Abstract
Spectra of the small Fabry–Perot interferometer (FPI) of the size of the order of the wavelength, with the main mode excited by a quantum field from a nano–LED or a laser, are investigated. The input field is detuned from the FPI mode with only a few photons. We formulate the convenient model for the FPI interacting with a quantum field, and provide novel explicit expressions for the field and the photon number fluctuation spectra inside and outside the FPI, with clearly identified contributions of the quantum and the classical noise. As a result, we found the spectra structures are quite different for the field, the photon number fluctuations inside the FPI, for the transmitted and the reflected fields and note asymmetries in spectra. The quantum noise is colored (or white) inside (or outside) the FPI, which explains differences in spectra. As another novel result, we calculate the second-order time auto–correlation functions for the FPI field; they oscillate and are negative under certain conditions. Results will help the study, design, manufacture, and use of the small elements of quantum optical integrated circuits, such as delay lines or optical transistors.
1. Introduction
The Fabry–Perot interferometer (FPI), invented in 1899 [1], is widely used in optics, optoelectronics, and laser physics [2,3]. FPIs can be met, in particular, in telecommunications for wavelength–division multiplexing [4], as laser cavities [5], in spectroscopy to control and measure the wavelengths of light [6], and in precision displacement measurements (chapter 5.10.1.1 of [7]), in optical integrated circuits [8,9,10]. Recent technological progress leads to a considerable reduction of the optical element size [11,12] and the appearance of photonic quantum technologies (PQT) [13]. PQT requires experimental research and theoretical studies of quantum phenomena in small optical elements, with the size of the order of the optical wavelength, such as the small FPI, operating with a few photons at a significant quantum noise. The paper contributes to the quantum theory of such a small FPI.
The particular motivation for the quantum consideration of the small FPI is making the background for the theoretical model of the small quantum, a single-photon optical transistor for PQT. It is well-known that the FPI with the nonlinear medium has, in certain conditions, dispersive optical bistability [14,15,16] and operates as an optical transistor [17]. Some attractive phenomena have been predicted in the quantum optical transistor based at FPI, for example, the noiseless amplification [18,19]. Thus, the bistable miniature FPI is an essential element for the quantum photonic circuits, necessary for ultra-low power signal processing [20,21].
In this paper, we calculate, in particular, the photon number fluctuation spectrum of the FPI with the quantum input field detuned from the center of the FPI mode. It is a necessary step for analyzing the bistability in the quantum nonlinear FPI with only a few photons. We will do such analysis in the future with the method developed in [22] and related papers [23,24,25,26]. The method of [22] permits solving nonlinear operator equations and generalizes a cumulant–neglect closure approach of the classical stochastic theory [27,28] to spectral analysis of open quantum nonlinear systems such as lasers and nonlinear optical devices. The cumulant–neglect closure approach has been used previously for quantum systems in the cluster expansion method [29,30] for calculations of high–order correlations.
Another motivation of the present study is the investigation of the field, the field power fluctuation spectra, and the auto-correlation functions of the small FPI with a mode detuned from the quantum input field. We find spectral profiles different from Lorentzian (or, Airy) spectral distributions well-known from the classical theory of FPI [3]. We see that spectra are asymmetric, with a noticeable contribution of quantum fluctuations. Spectra have different shapes inside and outside the FPI.
Quantum analysis has been made previously in the relation with various applications of the FPI. For example, the quantum limits of measurements with FPI have been considered in [31]. A quantum description of FPI, modeled as a beam splitter with frequency–dependent transmissivity and reflectivity coefficients, predicts the antibunching [32] necessary for non–classical light generation. A reduction of the effective finesse of the FPI cavity with regard to quantum noise has been found in [33] for the gravitational wave measurements. However, previous theories should pay more attention to the quantum FPI spectra.
Some applications of the FIP with the incoherent input have been studied. For example, the incoherent input field has been applied to FPI in experiments for the characterization of optical Fabry–Perot cavities [34].
We model the FPI as the quantum harmonic oscillator excited by the quantum stochastic force. The oscillator with a stochastic excitation is one of the basic models in the stochastic theory [35,36] including the quantum case [37]. There is a high interest in quantum phenomena in dynamical systems in general. For example, quantum corrections increase the number of equilibrium points in the Hill system considered in relation to the stability of satellites [38,39,40]. We hope that this paper contributes to the spectral theory of open quantum harmonic oscillators and helps to extend the method of [22] from the laser theory to general quantum devices and objects [41] modeled as sets of oscillators.
We present general formulas for the photon number fluctuation spectra inside the FPI and the field power fluctuation spectra outside the FPI; formulate the model for the FPI interacting with a quantum field; and find explicit expressions for the FPI spectra in Section 2.
We show and describe spectra and auto–correlation functions of the FPI, interacting with the quantum field, in Section 3.
2. Methods: Formulas for Spectra and Quantum Model of the FPI
In this section, we derive formulas for the photon number fluctuation (the field power) spectra for fields inside (outside) the FPI, whose scheme is shown in Figure 1.

Figure 1.
Fabry–Perot interferometer with two semitransparent mirrors, the input (reflected) field amplitude operators () on the right, transmitted field on the left, and the field inside.
A quazi–monochromatic external field with Bose–operator , with the amplitude operator and the carrier frequency , enters the FPI, shown in Figure 1, through the semitransparent mirror on the right. is close to the frequency of the center of the FPI mode spectrum. The FPI mode has Bose–operator and is excited by the external field. Detuning . The small FPI in Figure 1 has the size , where is the wavelength of the FPI mode. For certainty, we suppose that the main mode of the small FPI is excited, so the FPI free spectral range is of the order of or . We assume the FPI cavity quality factor ; it can be achieved, for example, in photonic crystal cavities [42]. In the future, we want to satisfy conditions for the dispersive bistability in the FPI with a nonlinear medium [16], so we take few , where is the half–width (HWHM) of the excited FPI mode. For such parameters, we, with a negligibly small error , neglect the excitation of all FPI modes but the main FPI mode.
2.1. General Formula for the Photon Number Fluctuation Spectrum in the Cavity
We make Fourier–expansions of the amplitude operators of the field inside the FPI cavity and of the input field entering the cavity through the semitransparent mirror
where and are the Fourier–component operators; is the deviation of the field optical frequency from . We consider , where is a photon number operator, means the normal ordering, T is the time ordering and is the quantum averaging; see [43], Section 12.2.2. Using and the first of Fourier–expansions (1), we write
so we separate the time and the normal–ordering operations.
Fourier–component operators of different frequencies commute; they are uncorrelated with each other, so the mean is not zero if and , or and . The commutator of the field Bose operators inside the cavity is
with [44]. Note that the cavity modifies the density of states of the quantum field, respectively, to the free space [45], so commutation relations (3) for Fourier–component operators in the cavity differ from commutation relations (12) in the free space. for the FPI cavity is given by Equation (23).
We insert Equation (4) into Equation (2), calculate the integral in Equation (2) with –functions, and see that the integral from the first term in Equation (4) is so that
The time–ordering operation in Equation (5) is
Replacing in Equation (5) by a new variable and by , we find the second–order auto–correlation function for the photon number fluctuations
where . The Wiener–Khinchin theorem ([46], page 102) tells us that the spectrum of the photon number fluctuations is related to by the Fourier–transform
so we find by the Fourier–transform of Equation (7). In such a transform, the integral over is split into two parts: from to 0 and from 0 to ∞, taking into account the multiplier . We carry out the Fourier–transform and come to
Making the replacement , we see that , so we re–write Equation (9) as
The first term in Equation (10) is the same as for the classical field fluctuations ([43], Section 9.8.3). One can obtain this term without the time and the normal orderings, considering in Equation (2) as a classical fluctuating variable. The second term in Equation (10) appears due to quantum fluctuations applying the time and the normal orderings. Below, we call the first term of (10) a classical contribution, and the second one a quantum contribution to the photon number fluctuation spectrum.
We see in Equation (10) that as it must be for real . The photon number variance corresponds to Bose–Einstein distribution.
The meaning of in is different from the meaning of in or . in is the radio frequency. Otherwise, in or is the deviation of the optical frequency of the field inside the FPI from the central frequency of the input field spectra.
2.2. Photon Number Fluctuation Spectra Outside FPI: General Formula
We write the field power operator (in photons per second) in the free space for the input , output fields, and the field reflected from the input mirror of the interferometer . We will find
We carry out the normal ordering in Equation (11) using commutation relations for Bose operators in free space [44]
so that
Similar to the case of Equation (2), we note that operators of different frequencies commute and do not correlate with each other; therefore,
Inserting Equation (13) into the integral in Equation (11), we see that the first term in Equation (13) is the mean power square . Taking the integral in Equation (11) over and , inserting there the power spectra , we come to the auto–correlation function for the field power fluctuations in free space
where , and we replace by ; by . The integral over in the second term in Equation (14) leads to , the integral over in this term gives , so the auto–correlation function is
The Fourier transform of Equation (15) leads to the spectrum of the field power fluctuations in the free space
Since , we write Equation (16) as
The first term in Equation (17) is a “colored” part of the spectrum. The second term is a white noise with constant spectrum power density . The first term in Equation (17) is the classical contribution, similar to the first term in Equation (10). The second one is the quantum contribution.
Equation (17) is different from the result for the classical field ([43], Section 9.8.3) in the second term , which is the spectral density of the “white” quantum noise. Note the difference between the quantum (the second) terms in Equations (10) and (17). The quantum term in Equation (10) is a convolution of “colored” quantum noise with the field spectrum in the cavity, while there is a “white” quantum noise term in Equation (17) for the free space.
Dimensionalities of and are the photon number per Hz and the photon number square per Hz, respectively. Dimensionalities of () are the photon number (the photon number square) per second per Hz.
2.3. The Model of the FPI with Quantum Input Field
We consider the field and the photon number fluctuation spectra inside and outside the small FPI; the main FPI cavity mode is excited by the quasi–monochromatic quantum field taken, for example, from a LED or a laser. Figure 2 shows the scheme of the FPI (on the left) and the input field source (on the right).
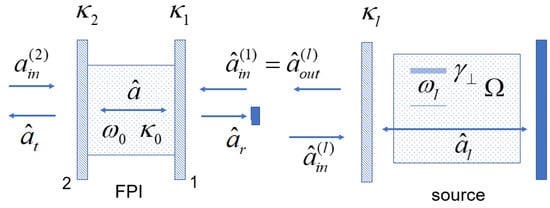
Figure 2.
FPI (on the left) with the source of the quantum field (on the right). The field , reflected from the FPI input mirror 1, is isolated from the source. FPI parameters are explained in the main text, and parameters of the field source are described in Appendix A.
Bose–operator of the FPI mode amplitude satisfies the equation
written with the help of the input–output theory [44]. In Equation (18), is the decay rate of the mode due to the field escape through the FPI semitransparent mirrors 1 and 2 with rates and the absorption inside the FPI with the rate . Bose–operators and correspond to zero temperature baths, uncorrelated with each other and related with the absorption and the field escape through the FPI mirror 2. The input field with the Bose–operator is the output of the source in Figure 2.
Making the Fourier transform in Equation (18) and solving the equation for Fourier–component operators, we find the Fourier–component operator of the FPI mode
where , is the optical frequency of the mode, and are Fourier–component operators of baths and the input field. The baths and the input field operators obey the free space Bose–commutation relations [44]
. Substituting the expression (19) into the relation , we obtain the spectrum of the FPI mode
where is the input field spectrum satisfying . In Equation (21) and below, we denote the Lorenz spectrum
Using Equation (19) and Bose–commutation relations (20), we find
where is a “commutator spectrum”; see Equation (3).
The input field spectrum is
where is the input power in photons per second, is the spectrum HWHM with the maximum value ; is the input field emission rate from the mirror of the source in Figure 2. When increases, decreases. We identify the LED, the intermediate, and the lasing regime when , , and , correspondingly. The derivation of expressions (24) is in the Appendix A.
2.4. Explicit Expressions for Spectra Inside FPI
we calculate the integral
and find the mean photon number in the FPI mode
With from Equation (21) and from Equation (23), we obtain, from Equation (10), the FPI mode photon number (or the field power) fluctuation spectrum
where
One can find some cumbersome explicit expressions for . We do not write them here.
2.5. Explicit Spectra Outside FPI
2.5.1. The Field Spectra
Spectra of the transmitted , the absorbed fields, and the transmitted and the absorbed field powers are
The reflected field is , according to the boundary conditions on the FPI input mirror 1 in Figure 2. Taking from Equation (19), we see that the reflected field Fourier component is
Inserting Equation (30) into , taking into account that only the input field gives a non–zero contribution to , calculating the mean values and expressing the result in terms of Lorenz spectra (22), we obtain the reflected field spectrum
One can see that , as it must be.
2.5.2. The Field Power Fluctuation Spectra
2.5.3. Reflection and Transmission Coefficients
3. Results
We demonstrate examples of spectra of the FPI with quantum input at the different input field powers. Suppose that the FPI input is taken from the small field source as the quantum dot LED or laser with the photonic crystal cavity [42]. The source cavity quality factor is ; the frequency of the center of the input field spectrum corresponds to the wavelength μm. Such a field source with the mean cavity photon number produces about photons per second (≈0.07 μWt). We take the rate rad/s of the field escape from the source cavity as a normalizing factor.
We will see fascinating features of FPI spectra by changing the normalized FPI input power in the range from 0 to 50. in the range corresponds to the LED (), the intermediate (), and the lasing () radiation. obtained in the photonic crystal laser with 100–1000 resonant emitters (quantum dots) with the small lasing mode volume V, for example, , where is the minimum cavity mode volume, and is the refractive index inside the source cavity.
We take in Equation (24); see the expression for in Appendix A. We suppose that the FPI is from the photonic crystal, similar to the cavity of the input field source, so we take the decay rates in the FPI cavity of the order of , namely , . We set the detuning , which is relatively large, respectively, to the FPI mode total decay rate . Relatively large detuning is necessary for the optical bistability in the small FPI with a quantum field and nonlinear medium [14,15], which we will consider in the future. The chosen is not too large, so the main FPI mode is effectively excited by the input field, while the excitation of the other FPI modes is negligibly small.
For , the mean FPI cavity photon number , even for high power of the input field , when the input is practically coherent radiation of a narrow spectrum, with a small HWHM ; see Figure 3a. Such a small number of photons in the FPI cavity confirms the importance of quantum analysis.
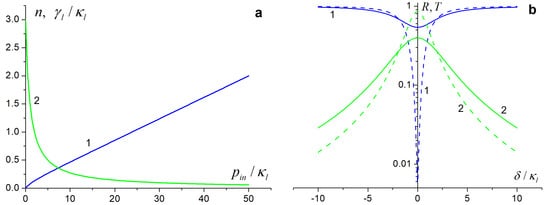
Figure 3.
(a) The mean photon number n in the FPI mode (curve 1) and the HWHM of the input field spectrum (curve 2) versus the power of the input field for the detuning . Note that , at a high input power ; (b) reflection R (curves 1) and transmission T (curves 2) coefficients of the FPI versus the detuning . Solid curves are for the input field spectrum of a finite HWHM (at ), dashed curves are for the monochromatic input with , values of other parameters given in the text. Near , the transmittance for the finite spectral width field is low, and the reflection is higher than for the monochromatic field—compare the solid and the dashed curves with the same numbers.
3.1. Reflection and Transmission Coefficients
The reflection and the transmission coefficients characterize the FPI. Equation (35) defines and , shown in Figure 3b, for the FPI with quantum input. and are symmetric relative to . We see from Figure 3b that the FPI has a lower transmission and higher reflection for the finite spectral width input than for the monochromatic input field. Indeed, the non–monochromatic input field includes the frequency components detuned from the exact resonance with the FPI mode even at .
3.2. Field Spectra
The field spectra outside the FPI have the spectrum power densities (in photons per second per Hz): transmitted , see Equation (29); input , Equation (24); and reflected from the mirror of the FPI, , Equation (31). The physical meaning of, for example, is the part of the input field power in a narrow frequency interval reflected from the FPI input mirror.
Figure 4a–d show . The input field power increased, and the input field spectra HWHM decreased from Figure 4a–d. The reflected field spectrum (green curves 1) has the same structure at any and . There is the peak at the center of the input field spectrum at and the gap at the center of the FPI mode spectrum at . The peak is narrower and higher, and the gap has a smaller depth at the higher and smaller ; see the green curves 1.
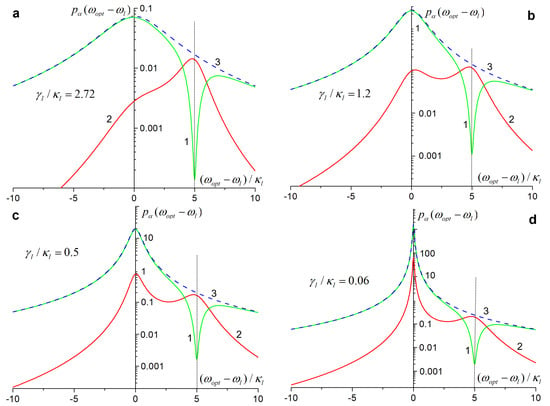
Figure 4.
Spectral power densities are shown for reflected (curves 1), transmitted (2), and input (3) fields. The power increases from (a) to (d): (a), 1.5 (b), 5 (c), and 50 (d). The input field spectrum HWHM decreases with the ; values are in the figures. The minima of the transmitted and local maxima of the reflected field spectra correspond to the center of the FPI mode marked by the vertical dashed line. Maxima at (the horizontal axis zero) correspond to the center of the input field spectrum.
The structure of the transmitted field spectrum (the red curves 2) changed with and . For Figure 4a, the FPI mode is excited by a weak broadband input field with and , so the input field spectrum is broader than the empty FPI mode spectrum. The transmitted field spectrum in Figure 4a is broad and asymmetric, with a single maximum at the center of the FPI mode.
When we go from Figure 4a–d, the input power grows with the narrowing of the input field spectrum. For Figure 4b, , and —close to the HWHM of the empty FPI mode. The peak at appears in the transmitted field spectrum in Figure 4b. Parameters of Figure 4b are such that both maxima in the transmitted field spectra have approximately the same height. The maxima slightly shifted toward each other relative to the maxima of the input field spectra (at zero in Figure 4) and the FPI mode spectra (marked by the vertical dashed line).
With further increase of and narrowing of the input field spectra, the maximum of the transmitted FPI spectrum at the input field frequency (at zero in Figure 4) increases and narrows as in Figure 4c,d.
If we separate the transmitted field spectra at their local minimum at , we see that 48, 70, and 95% of the transmitted field energy are in the left part, near the maximum of the input field spectrum—for Figure 4b,c, and d correspondingly. Thus, a large amount of the transmitted field energy is in the spectral range of the input of a narrow spectrum, as for Figure 4c,d. The situation is the opposite for a broadband input, as in Figure 4a, where the principal part of the transmitted field energy is near the maximum of the FPI mode spectrum marked by the vertical dashed line.
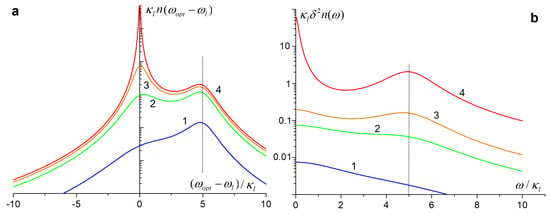
Figure 5.
(a) The field and (b) the photon number fluctuation spectra of the FPI cavity mode for [] (curves 1); 1.5 [1.1] (2); 5 [0.45] (3); and 50 [0.05] (4). The field spectra have two maxima, similar to the transmitted field spectra in Figure 4. has the sideband maxima at (shown by the vertical dashed line) in curve 3,4 for a high input field power.
In Figure 5, the input field power (the linewidth) increases (decreases) from curve 1 to curve 4. spectra have two peaks at a large input field, similar to the transmitted field spectrum curves shown in Figure 4. Note that the shape of curves in Figure 5a is different from the well–known Lorenzian (or Airy function) curves of the field mode spectra of the empty FPI [3].
3.3. Photon Number Fluctuation Spectra
Figure 5b shows , given by Equation (26), for the same parameters as for the FPI field spectra in Figure 5a. In Figure 5b, the width of the input field spectrum exceeds the width of the empty FPI mode for curves 1 and 2, so is broad with a single maximum at . When the input power increases and the input field spectrum narrows, the second local peak appears in at in curve 3. The peak at is higher and narrower while the increases. The sideband maximum at grows with the but not so rapidly as the maximum at in curve 4.
It is interesting to compare the classical and the quantum contributions in given by the first and the second terms in Equation (26), correspondingly. Figure 6a–d present curves, the same as in Figure 5b, together with the quantum and the classical contributions to them.
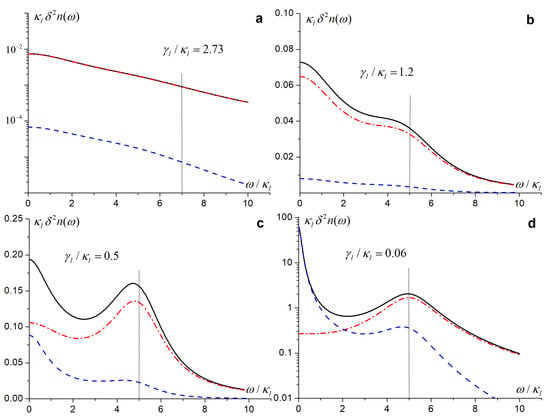
Figure 6.
Photon number fluctuation spectra in the FPI mode (solid curves) and their classical (dashed curves) and quantum (dash–dotted curves) components. Solid curves in Figures (a–d) are the same as curves 1–4, correspondingly, in Figure 5b. The vertical dashed lines mark .
Figure 6a corresponds to a broadband spectrum of the input field with the HWHM . Large quantum fluctuations contribute to . The broad spectrum has only one maximum at .
With the increase of and the reduction of up to , a structure of appears near in Figure 6b; quantum fluctuations still give a significant contribution to . With further growth and the input field spectrum narrowing, the quantum and the classical contributions to become similar; see the peaks at and in Figure 6c. With a large , when , and when the input field source approaches a lasing regime, the spike in is high and narrow, while the side–band peak in still presents in Figure 6d. Photon number fluctuations in the FPI cavity give a considerable contribution to near the FPI mode maximum at , marked by the vertical dashed lines in Figure 6.
Photon number fluctuations have the maximum at the center of the FPI cavity mode, shifted on , respectively, to the center of the input field spectrum. This explains the noticeable contribution of quantum fluctuations near .
Figure 7 show the power fluctuation spectra of the transmitted and the reflected fields given by Equations (32) and (33). Profiles of the spectra in Figure 7 differ from the power fluctuation spectra inside the FPI in Figure 5b and Figure 6.
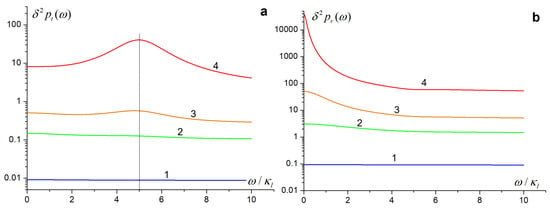
Figure 7.
Power fluctuation spectra of the transmitted (a) and reflected (b) fields for the same parameters as for curves 1–4 in Figure 5. The input field power (the HWHM) increases (decreases) from curves 1 to 4. There is only one peak at in the transmitted field and in the reflected field spectra: compare with two peaks in curves inside the FPI shown in Figure 5.
has the maximum at , while —at . Maxima observed if the input field power is large. The quantum part of the transmitted and the reflected power fluctuation spectra does not depend on the frequency, as in Equations (17), (32) and (33). Quantum contributions only shift the spectra up from the horizontal axis. They do not influence the structure of spectra, which is different from the power fluctuation spectra inside the FPI cavity in Figure 6.
3.4. Auto–Correlation Functions
Inverse Fourier–transforms of the photon number fluctuation spectrum (26), transmitted (32), and reflected (33) field power fluctuation spectra lead to auto–correlation functions. Equations (8) and (26) determine the auto–correlation function of the FPI cavity photon number fluctuations. The first term in Equation (26) is responsible for the classical component of , and the second is responsible for the quantum component.
Figure 8 shows examples of and their quantum and classical components. in Figure 8a decreases monotonically with and is determined mostly by quantum fluctuations with a small contribution from classical fluctuations. It is for a small power and a wide input field spectrum with HWHM . starts to oscillate at larger and the smaller the spectrum HWHM , as shown in Figure 8b; still includes a large part of quantum fluctuations. oscillates, with its quantum part, and accepts negative values at greater and smaller in Figure 8c. At large and small , is positive and displays oscillations in the quantum part of , as shown in Figure 8d.
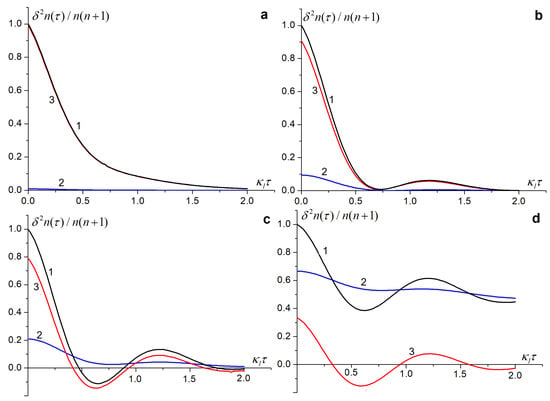
Figure 8.
Auto−correlation functions for the photon number fluctuations in the FPI cavity (curves 1) consisted of the classical (curves 2) and the quantum (curves 3) contributions. The input field power increases from (a–d) with the same values of parameters as for Figure 6a–d, correspondingly.
The slow decay of in Figure 8d is related to a narrow line and, correspondingly, the long coherency time of the input field.
Figure 9 shows the auto–correlation function for the transmitted field power fluctuations. does not contain the term presented in in Equation (15). We find by the inverse Fourier–transform of Equation (32) without , which corresponds to the quantum part of the transmitted field auto–correlation function. Quantum contributions, proportional to the delta–function , are not shown in Figure 9. Normalizing factor , used in Figure 9, is the integral over frequencies of the expression (32), taken without .
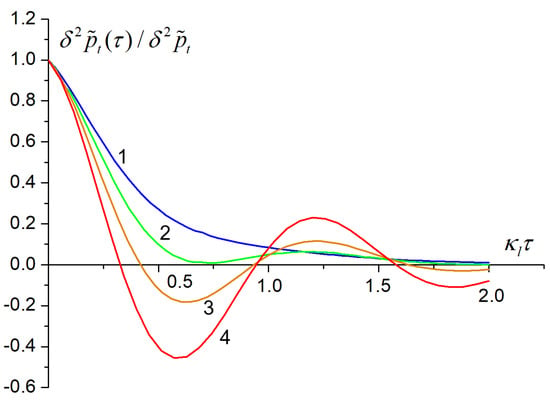
Figure 9.
Auto−correlation functions for the transmitted field with parameters for curves 1–4 as for Figure 8a–d. Delta functions at , corresponding to quantum noise contributions, are not shown.
We see in Figure 9 that starts to oscillate and takes negative values with the increase of the input field power and the narrowing of the input field spectrum—from curve 1 to curve 4. Such behavior is related to beatings between the FPI mode and the input field at the non–zero detuning of centers of the FPI mode and the input field spectra.
The first term in Equation (33) dominates in the auto–correlation function of the reflected field at chosen parameter values. Thus, (taken without delta–function at ) is very well approximated by , and we do not show on figures.
4. Discussion
We derived Formulas (10) and (17) for the photon number and the transmitted/reflected field power fluctuation spectra. We found transmission/reflection coefficients; transmission, reflection, and the cavity mode field spectra; the photon number (the field power) fluctuation spectra inside (outside) the FPI. We calculate the auto–correlation functions of the FPI—for the FPI excited by a finite spectrum width field when maxima of the FPI cavity mode and the input field spectra detuned on . We take the detuning several times larger than HWHMs of spectra of the FPI mode and the input field. Detuning considered for using the results in the future investigation of the optical bistability [14,15] in the miniature FPI with the nonlinear medium and quantum field with only a few, one, or less than one photon in the cavity. Different from well–known “macroscopic” FPI [3], quantum fluctuations are significant in the small FPI with a detuning.
We found the transmission T and the reflection R coefficients of the FPI. T (or R) reduced (or increased) with the broadening of the input field spectrum; see Figure 3b. This is because the finite spectrum width field includes the frequency components shifted from the resonance with the FPI mode even at the detuning . The effective FPI mode HWHM is in expressions for T and R, where and is HWHM of the empty FPI mode and the input field spectra—see Equations (35) and (36) for R and T.
We investigate the FPI field spectra. The structure of the reflected field spectra (shown by curves 1 in Figure 4) remains the same for any width of the input field spectrum. The reflected field spectrum contains the peak at the input field frequency and the gap at the FPI mode frequency. The peak becomes higher and narrower with the narrowing of the input field spectrum.
The FPI transmitted field spectrum, shown in curves 2 in Figure 4, changes its structure with the narrowing of the input field spectrum. The transmitted field has one broad maximum at the FPI mode frequency for broad–band input, see Figure 4a. There are two maxima of similar height—when the input field spectral width is of the order of the FPI mode spectral width; see Figure 4b,c. The first high and narrow peak is at the input field frequency. The second broad local maximum is at the FPI mode frequency if the input field has high power and a narrow spectrum; see Figure 4d.
Figure 5a shows the FIP field spectra evolution with the narrowing of the input field spectrum. It is similar to the transmitted field spectra in Figure 4. It is impossible to separate quantum and classical contributions in the field spectra.
The two–peak structure in the photon number fluctuation spectra inside the FPI appeared with the narrowing of the input field spectrum. We see it in Figure 5b. This structure is related to the beating between the input field and the FPI mode field when the input field spectrum is narrower or of the order of the FPI mode spectrum. in Figure 5b has only the maximum at for the weak broad–band input field.
It is possible to separate the quantum and the classical contributions in the photon number fluctuation spectra inside FPI, such contributions shown in Figure 6. The broad–band quantum fluctuations dominate in with the maximum at . It is for a weak input field in Figure 6a. With the increase of the input field power, the beatings between quantum fluctuations in the FPI mode and the input field appear, leading to the side–band maximum in at , see Figure 6b,c. Quantum fluctuations contribute near the FPI mode spectrum maximum. They are high near the local maximum at in Figure 6c,d.
It is not possible to measure inside FPI directly. However, the photon number fluctuations influence, for example, the interaction of the quantum field with the nonlinear medium inside the FPI. Photon number fluctuation spectra shown in Figure 5 and Figure 6 help identify the frequency domains where quantum fluctuation dominates. It is meaningful, in particular, if we insert the nonlinear resonant medium inside the small FPI cavity for absorptive bistability or other purposes, for investigating the quantum field spectra by FPI.
Field power fluctuation spectra for the transmitted (Figure 7a) and for the reflected (Figure 7b) fields are different from the photon number fluctuation spectra inside FPI in Figure 5 and Figure 6. has the maximum at , while has the maximum at if the input field has a high power and a narrow spectrum. are flat (or almost flat) for a weak and broad–band input field. The white quantum noise does not beat the transmitted (reflected) fields. Thus, there is only one peak in the transmitted (reflected) field power spectra at ().
Auto–correlation functions inside the FPI, shown in Figure 8, have the quantum and the classical components. The quantum component dominates at a weak and a broad–band input, and the classical—at a strong and a narrow spectrum input. We see in Figure 8b–d oscillations of related with a beating between the detuned FPI mode and the input field mode. Beatings disappear at a weak input field and significant quantum noise. Then, decays monotonically, as in Figure 8a. The auto–correlation function takes negative values when the contribution of the quantum noise is comparable with the classical part of ; see Figure 8c.
The output field power auto–correlation function in Figure 9 oscillates, similar to the auto–correlation function inside FPI. accepts negative values when the input field has a high power and a narrow spectrum. Negative values of are a “trace” of the quantum interference of the FPI mode noise and the input field inside the FPI. The quantum part of is a delta function at . We do not show this part in Figure 9. The difference in quantum contributions to the field power fluctuation spectra inside and outside the FPI is related to a broad–band white quantum noise outside and a narrow–band “colored” quantum noise inside the FPI cavity.
5. Conclusions
We performed the quantum analysis of the small, of the size of wavelength Fabry–Perot interferometer (FPI) with only a few photons in the cavity. The quantum input field is taken from a LED or a laser with the finite spectral width detuned from the FPI mode. The method of study is based on general formulas for the photon number fluctuation spectra inside and outside the FPI derived in Section 2. We obtain explicit analytical expressions for the field and the photon number fluctuation spectra inside and outside the FPI in Section 2 and investigate the spectra in Section 3. The FPI spectra have asymmetry, and the structure depends on the input field spectral width and power. We identify the classical and the quantum contributions in the photon number fluctuation spectra and investigate the evolution of such contributions with the increase of the input field power and the narrowing of the input field spectra. We found that spectra structures are quite different inside and outside the FPI. The different noise explains differences in spectra: the colored (the white) quantum noise inside (outside) the FPI. We also calculate the second–order time auto–correlation functions for the FPI field; they oscillate and become negative under certain conditions. Section 3 and Section 4 describe details and reasons for the evolution of the spectra and the auto–correlation functions.
We will apply the present results for the future investigation of the optical bistability in the quantum FPI with a nonlinear medium. In general, results will help the study, design, manufacture, and use of the small elements of quantum optical integrated circuits, such as delay lines and optical transistors. We hope that the present results will stimulate experimental investigations of the quantum fluctuations and the fluctuation spectra in the small FPI.
Author Contributions
I.E.P. formulated the main idea, derived formulas, and interpret results. A.V.U. carried out analytical calculations and formulated the physical meaning of results. All authors have read and agreed to the published version of the manuscript.
Funding
This research received no external funding.
Data Availability Statement
Not applicable.
Conflicts of Interest
The authors declare no conflict of interest.
Abbreviations
The following abbreviations are used in this manuscript:
| FPI | Fabry–Perot interferometer |
| PQT | Photonic quantum technology |
| HWHM | Half–width at half–maximum |
| LED | Light emitting diode |
Appendix A. Quantum Input Field for the Small FPI
The right part of Figure 2 shows the scheme of the input field source (a LED or a laser). Operator of the field amplitude inside the source cavity satisfies Equations [23,24]
where is the active medium polarization operator, is the vacuum Rabi frequency, is the polarization decay rate, factor , the population inversion , () is the population of the upper (the low) states of the active medium with two–level emitters, is the Langevin force with non–zero correlations
We suppose that the input field is not too large and, following [23,24], neglect in Equation (A1) fluctuations of populations of states of the two–level medium.
We take the source with and eliminate the polarization adiabatically, setting in Equation (A1). We obtain and
where , is the threshold population inversion found in the semi–classical laser theory [5,23]. Equation (A3) leads to the Fourier–component operator of the field inside the source cavity
Operators and of amplitudes of the input vacuum and the output fields at the output (the left) mirror of the source in Figure 2 satisfies the boundary condition . Taking this condition and Equation (A4), we find the Fourier component of the FPI input field
Using the relation , Equation (A5), and the first correlation in Equation (A2), we find the FPI input field power Fourier–component
The FPI input field power is . We represent as a function of
and use as a governing parameter in calculations of spectra in the main text. In Equation (A7),
is the HWHM of the input field spectrum. The maximum value of is ; at .
References
- Fabry, C.; Perot, A. Theorie et applications d’une nouvelle methode de spectroscopie interferentielle. Ann. Chim. Phys. 1899, 26, 115–144. [Google Scholar]
- Vaughan, J.M. The Fabry–Perot Interferometer; Hilger, A., Ed.; CRC Press: Boca Raton, FL, USA, 1989; p. 583. [Google Scholar]
- Ismail, N.; Kores, C.C.; Geskus, D.; Pollnau, M. Fabry–Perot resonator: Spectral line shapes, generic and related Airy distributions, linewidths, finesses, and performance at low or frequency-dependent reflectivity. Opt. Express 2016, 24, 16366–16389. [Google Scholar] [CrossRef] [PubMed]
- Keiser, G.E. A Review of WDM Technology and Applications. Opt. Fiber Technol. 1999, 5, 3–39. [Google Scholar] [CrossRef]
- Sargent, M.; Scully, M.O.; Lamb, W.E. Laser Physics; Addison-Wesley: London, UK, 1974. [Google Scholar]
- 5 The Fabry–Perot spectrometer. In Spectral Imaging of the Atmosphere; International Geophysics; Shepherd, G.G., Ed.; Academic Press: Cambridge, MA, USA, 2003; Volume 82, pp. 102–128. [Google Scholar] [CrossRef]
- Leach, R. Fundamental Principles of Engineering Nanometrology; Science & Technology Books; Elsevier: Amsterdam, The Netherlands, 2014; p. 384. [Google Scholar]
- Chou, S. Subwavelength optical elements (SOEs) and nanofabrications—A path to integrate optical communication components on a chip. In Proceedings of the the 15th Annual Meeting of the IEEE Lasers and Electro-Optics Society, Glasgow, UK, 10–14 November 2002; Volume 2, pp. 574–575. [Google Scholar]
- Zhu, D.; Shao, L.; Yu, M.; Cheng, R.; Desiatov, B.; Xin, C.J.; Hu, Y.; Holzgrafe, J.; Ghosh, S.; Shams-Ansari, A.; et al. Integrated photonics on thin-film lithium niobate. Adv. Opt. Photon. 2021, 13, 242–352. [Google Scholar] [CrossRef]
- Elshaari, A.W.; Pernice, W.; Srinivasan, K.; Benson, O.; Zwiller, V. Hybrid integrated quantum photonic circuits. Nat. Photonics 2020, 14, 285–298. [Google Scholar] [CrossRef]
- Wang, R.; Sprengel, S.; Boehm, G.; Muneeb, M.; Baets, R.; Amann, M.C.; Roelkens, G. 2.3-μm range InP-based type-II quantum well Fabry–Perot lasers heterogeneously integrated on a silicon photonic integrated circuit. Opt. Express 2016, 24, 21081–21089. [Google Scholar] [CrossRef] [PubMed]
- Liu, Q.; Ramirez, J.M.; Vakarin, V.; Roux, X.L.; Frigerio, J.; Ballabio, A.; Simola, E.T.; Alonso-Ramos, C.; Benedikovic, D.; Bouville, D.; et al. On-chip Bragg grating waveguides and Fabry–Perot resonators for long-wave infrared operation up to 8.4-μm. Opt. Express 2018, 26, 34366–34372. [Google Scholar] [CrossRef]
- Pelucchi, E.; Fagas, G.; Aharonovich, I.; Englund, D.; Figueroa, E.; Gong, Q.; Hannes, H.; Liu, J.; Lu, C.Y.; Matsuda, N.; et al. The potential and global outlook of integrated photonics for quantum technologies. Nat. Rev. Phys. 2022, 4, 194–208. [Google Scholar] [CrossRef]
- Lugiato, L.A. Optical bistability. Contemp. Phys. 1983, 24, 333–371. [Google Scholar] [CrossRef]
- Agrawal, G.P.; Carmichael, H.J. Optical bistability through nonlinear dispersion and absorption. Phys. Rev. A 1979, 19, 2074–2086. [Google Scholar] [CrossRef]
- Felber, F.S.; Marburger, J.H. Theory of nonresonant multistable optical devices. Appl. Phys. Lett. 1976, 28, 731–733. [Google Scholar] [CrossRef]
- Bowden, C.M.; Ciftan, M.; Robl, H.R. Optical Bistability; Plenum Press: New York, NY, USA, 1981; p. 614. [Google Scholar]
- Protsenko, I.E.; Lugiato, L.A.; Fabre, C. Spectral analysis of the degenerate optical parametric oscillator as a noiseless amplifier. Phys. Rev. A 1994, 50, 1627–1645. [Google Scholar] [CrossRef] [PubMed]
- Protsenko, I.; Lugiato, L. Noiseless amplification in the optical transistor. Opt. Commun. 1994, 109, 304–311. [Google Scholar] [CrossRef]
- Kerckhoff, J.; Armen, M.A.; Mabuchi, H. Remnants of semiclassical bistability in the few-photon regime of cavity QED. Opt. Express 2011, 19, 24468–24482. [Google Scholar] [CrossRef]
- Kim, M.K.; Hwang, I.K.; Lee, Y.H. All-Optical Bistability in Photonic Crystal Resonators based on InGaAsP Quantum-Wells. In Proceedings of the LEOS 2006—19th Annual Meeting of the IEEE Lasers and Electro-Optics Society, Montreal, QC, Canada, 29 October–2 November 2006; pp. 769–770. [Google Scholar] [CrossRef]
- Protsenko, I.E.; Uskov, A.V. Perturbation approach in Heisenberg equations for lasers. Phys. Rev. A 2022, 105, 053713. [Google Scholar] [CrossRef]
- André, E.C.; Protsenko, I.E.; Uskov, A.V.; Mørk, J.; Wubs, M. On collective Rabi splitting in nanolasers and nano-LEDs. Opt. Lett. 2019, 44, 1415–1418. [Google Scholar] [CrossRef]
- Protsenko, I.E.; Uskov, A.V.; André, E.C.; Mørk, J.; Wubs, M. Quantum Langevin approach for superradiant nanolasers. New J. Phys. 2021, 23, 063010. [Google Scholar] [CrossRef]
- Protsenko, I.; Domokos, P.; Lefèvre-Seguin, V.; Hare, J.; Raimond, J.M.; Davidovich, L. Quantum theory of a thresholdless laser. Phys. Rev. A 1999, 59, 1667–1682. [Google Scholar] [CrossRef]
- Protsenko, I.E.; Uskov, A.V. Oscillator Laser Model. Ann. Der. Phys. 2023, 535, 2200298. [Google Scholar] [CrossRef]
- Wu, W.; Lin, Y. Cumulant-neglect closure for nonlinear oscillators under random parametric and external excitations. Int. J. Non-Linear Mech. 1984, 19, 349–362. [Google Scholar] [CrossRef]
- Sun, J.Q.; Hsu, C.S. Cumulant-Neglect Closure Method for Nonlinear Systems Under Random Excitations. J. Appl. Mech. 1987, 54, 649–655. [Google Scholar] [CrossRef]
- Jahnke, F.; Gies, C.; Aßmann, M.; Bayer, M.; Leymann, H.A.M.; Foerster, A.; Wiersig, J.; Schneider, C.; Kamp, M.; Höfling, S. Giant photon bunching, superradiant pulse emission and excitation trapping in quantum-dot nanolasers. Nature Commun. 2016, 7, 11540. [Google Scholar] [CrossRef]
- Gies, C.; Wiersig, J.; Lorke, M.; Jahnke, F. Semiconductor model for quantum-dot-based microcavity lasers. Phys. Rev. A 2007, 75, 013803. [Google Scholar] [CrossRef]
- Ley, M.; Loudon, R. Quantum Theory of High-resolution Length Measurement with a Fabry–Perot Interferometer. J. Mod. Opt. 1987, 34, 227–255. [Google Scholar] [CrossRef]
- Ataman, S. The quantum optical description of a Fabry–Perot interferometer and the prediction of an antibunching effect. Eur. Phys. J. D 2015, 69, 187. [Google Scholar] [CrossRef]
- Iwaguchi, S.; Ishikawa, T.; Ando, M.; Michimura, Y.; Komori, K.; Nagano, K.; Akutsu, T.; Musha, M.; Yamada, R.; Watanabe, I.; et al. Quantum noise in a Fabry–Perot interferometer including the influence of diffraction loss of light. Galaxies 2021, 9, 9. [Google Scholar] [CrossRef]
- Tsuchida, H. Characterization of optical resonators with an incoherent light. Opt. Express 2012, 20, 29347–29352. [Google Scholar] [CrossRef]
- Gitterman, M. The Noisy Oscillator; World Scientific Publishing Company: Singapore, 2005; p. 160. [Google Scholar]
- Oraevskii, A.N. Locking of a self-oscillator by a random signal. Sov. J. Quantum Electron. 1987, 17, 798. [Google Scholar] [CrossRef]
- Horowitz, J.M. Quantum-trajectory approach to the stochastic thermodynamics of a forced harmonic oscillator. Phys. Rev. E 2012, 85, 031110. [Google Scholar] [CrossRef]
- Alshaery, A.; Abouelmagd, E.I. Analysis of the spatial quantized three-body problem. Results Phys. 2020, 17, 103067. [Google Scholar] [CrossRef]
- Abouelmagd, E.I.; Kalantonis, V.S.; Perdiou, A.E. A Quantized Hill’s Dynamical System. Adv. Astron. 2021, 2021, 9963761. [Google Scholar] [CrossRef]
- Ansari, A.A.; Alhowaity, S.; Abouelmagd, E.I.; Sahdev, S.K. Analysis of Equilibrium Points in Quantized Hill System. Mathematics 2022, 10, 2186. [Google Scholar] [CrossRef]
- Sutherland, R.L. Handbook of Nonlinear Optics; Marcel Dekker: New York, NY, USA, 2003; p. 971. [Google Scholar]
- Zhang, Y.N.; Zhao, Y.; Lv, R.Q. A review for optical sensors based on photonic crystal cavities. Sensors Actuators A Phys. 2015, 233, 374–389. [Google Scholar] [CrossRef]
- Mandel, L.; Wolf, E. Optical Coherence and Quantum Optics; Cambridge University Press: Cambridge, UK, 1995; p. 1166. [Google Scholar]
- Collett, M.J.; Gardiner, C.W. Squeezing of intracavity and traveling-wave light fields produced in parametric amplification. Phys. Rev. A 1984, 30, 1386–1391. [Google Scholar] [CrossRef]
- Purcell, E.M. Spontaneus Emission Probabilities at Radio Frequencies. Phys. Rev. 1946, 69, 681. [Google Scholar] [CrossRef]
- Champeney, D.C. A handbook of Fourier theorems; Cambridge University Press: Cambridge, UK, 1987; p. 185. [Google Scholar]
- Akhmanov, S.A.; Nikitin, S.Y. Physical Optics; Clarendon Press: Oxford, UK, 1997; p. 488. [Google Scholar]
Disclaimer/Publisher’s Note: The statements, opinions and data contained in all publications are solely those of the individual author(s) and contributor(s) and not of MDPI and/or the editor(s). MDPI and/or the editor(s) disclaim responsibility for any injury to people or property resulting from any ideas, methods, instructions or products referred to in the content. |
© 2023 by the authors. Licensee MDPI, Basel, Switzerland. This article is an open access article distributed under the terms and conditions of the Creative Commons Attribution (CC BY) license (https://creativecommons.org/licenses/by/4.0/).