1. Introduction
The acceptance sampling (AS) plan is a prominent and an efficient quality control mechanism. It is frequently implemented to ensure and verify the quality and conditions of services or products, etc. The AS plan is implemented to inspect the products of lots and to decide whether to keep or extract the incoming products of lots. Rather than investigating the entire lot, the AS technique allows us to decide about the entire lot via its portion (i.e., a sample of the entire lot) only. Thus, if the selected portion of the entire lot appears as good as expected, the entire lot as per the result will be accepted. On the other hand, if the selected portion of the entire lot does not appear as good as expected, the entire lot will be rejected accordingly. Henceforth, the products will be given back to the supplier [
1,
2,
3].
The AS plan has great applicability on industrial scales and is implemented to decrease the expenditure of the inspection process. It provides a guideline to the inspection team on whether the specified products or services are reliable enough for marketing or not. In addition to the reduction of the inspection expenditure, it also helps to prevent both suppliers and buyers from future losses by minimizing:
- (i)
the supplier’s risk to prevent the rejection of the good quality lot, and
- (ii)
the consumer’s risk to prevent the buyers from accepting the poor quality lot. For more detail, see [
4,
5].
Due to the importance of the AS plan in the industry and other commercial sectors, researchers have been trying to develop more and more efficient AS plans using different probability distributions. For example,
- (i)
Singh and Tripathi [
6] introduced an AS plan using the inverse Weibull distribution,
- (ii)
Abushal et al. [
7] implemented the power inverted Topp–Leone distribution for developing a new AS plan,
- (iii)
Tripathi et al. [
8] used the inverse log-logistic distribution to introduce a new AS plan,
- (iv)
Alyami et al. [
9] created a new AS plan by adopting the Fréchet binomial distribution,
- (v)
Algarni [
10] proposed a group acceptance sampling (GAS) plan with the three-parameter Weibull distribution,
- (vi)
Nassr et al. [
11] used the inverted Topp-Leone distribution for studying a new AS plan,
- (vii)
Khan et al. [
12] created the fuzzy AS plan using the transmuted Weibull distribution,
- (viii)
Fayomi and Khan [
13] proposed a group AS plan using the generalized transmuted exponential distribution,
- (ix)
Al-Omari and Alomani [
14] introduced a double AS plan by using the Xgamma distribution, and
- (x)
Yiğiter et al. [
15] recommended a group AS plan for the compound Weibull-exponential distribution, among others.
From the above-mentioned literature, we can see the development of new AS plans has received great attention. Nonetheless, there is a lack of established research work and guidelines for constructing new AS plans through incorporating trigonometric-based probability distributions. In this ongoing part of our research, we aim to cover this curious and astonishing research gap. The core motivation of this work is therefore to design and implement a new AS plan by means of the cosine function.
In this paper, we first attempt to introduce a new probabilistic method by considering the cosine function. The suggested method is called a new modified cosine-G (NMC-G) family. The beauty of the NMC-G family is that it does not have any extra or additional parameters. In the second attempt, we incorporate the proposed model for generating a new AS plan.
Definition 1. X follows a NMC-G model if its cumulative distribution function (CDF) is expressed bywhere and is a valid CDF depending upon the parameter vector η. The expression defined by Equation (1) is a valid CDF as and , because is a CDF. Moreover, is an increasing differentiable function with a derivative provided in Equation (2). The probability density function (PDF)
is
where
With a link to
, the survival function (SF)
is
The hazard function (HF)
is
The cumulative hazard function (CHF)
is
In this paper, using the approach defined in Equation (
1), we study a new trigonometric distribution. The new trigonometric distribution may be called a new modified cosine-Weibull (NMC-Weibull) distribution.
Section 2 offers the basic key functions and visual illustrations of the NMC-Weibull distribution. The usefulness and optimality of the NMC-Weibull distribution are shown in the industrial sectors by analyzing two applications in
Section 3. In addition to the practical illustrations, the important work based on the NMC-Weibull distribution is performed in
Section 4. The work that is carried out in
Section 4 deals with the construction of the NMC-Weibull distribution-based repeating acceptance sampling strategy for attributes with specified shape parameters. Finally,
Section 5 summarizes the conclusions drawn from this research work.
2. Special Model
Assume that
follows the Weibull distribution (chosen as a special case of the NMC-
G method) with parameters
and
Then, the CDF
of
X is
and PDF
where
.
Incorporating Equation (
3) in Equation (
1) gives the CDF of the proposed NMC Weibull distribution, expressed as
and SF
The PDF
corresponding to Equation (
5) is
Furthermore, the expression of the HF
of the NMC-Weibull distribution is
and the expression of the CHF
of the NMC-Weibull distribution is
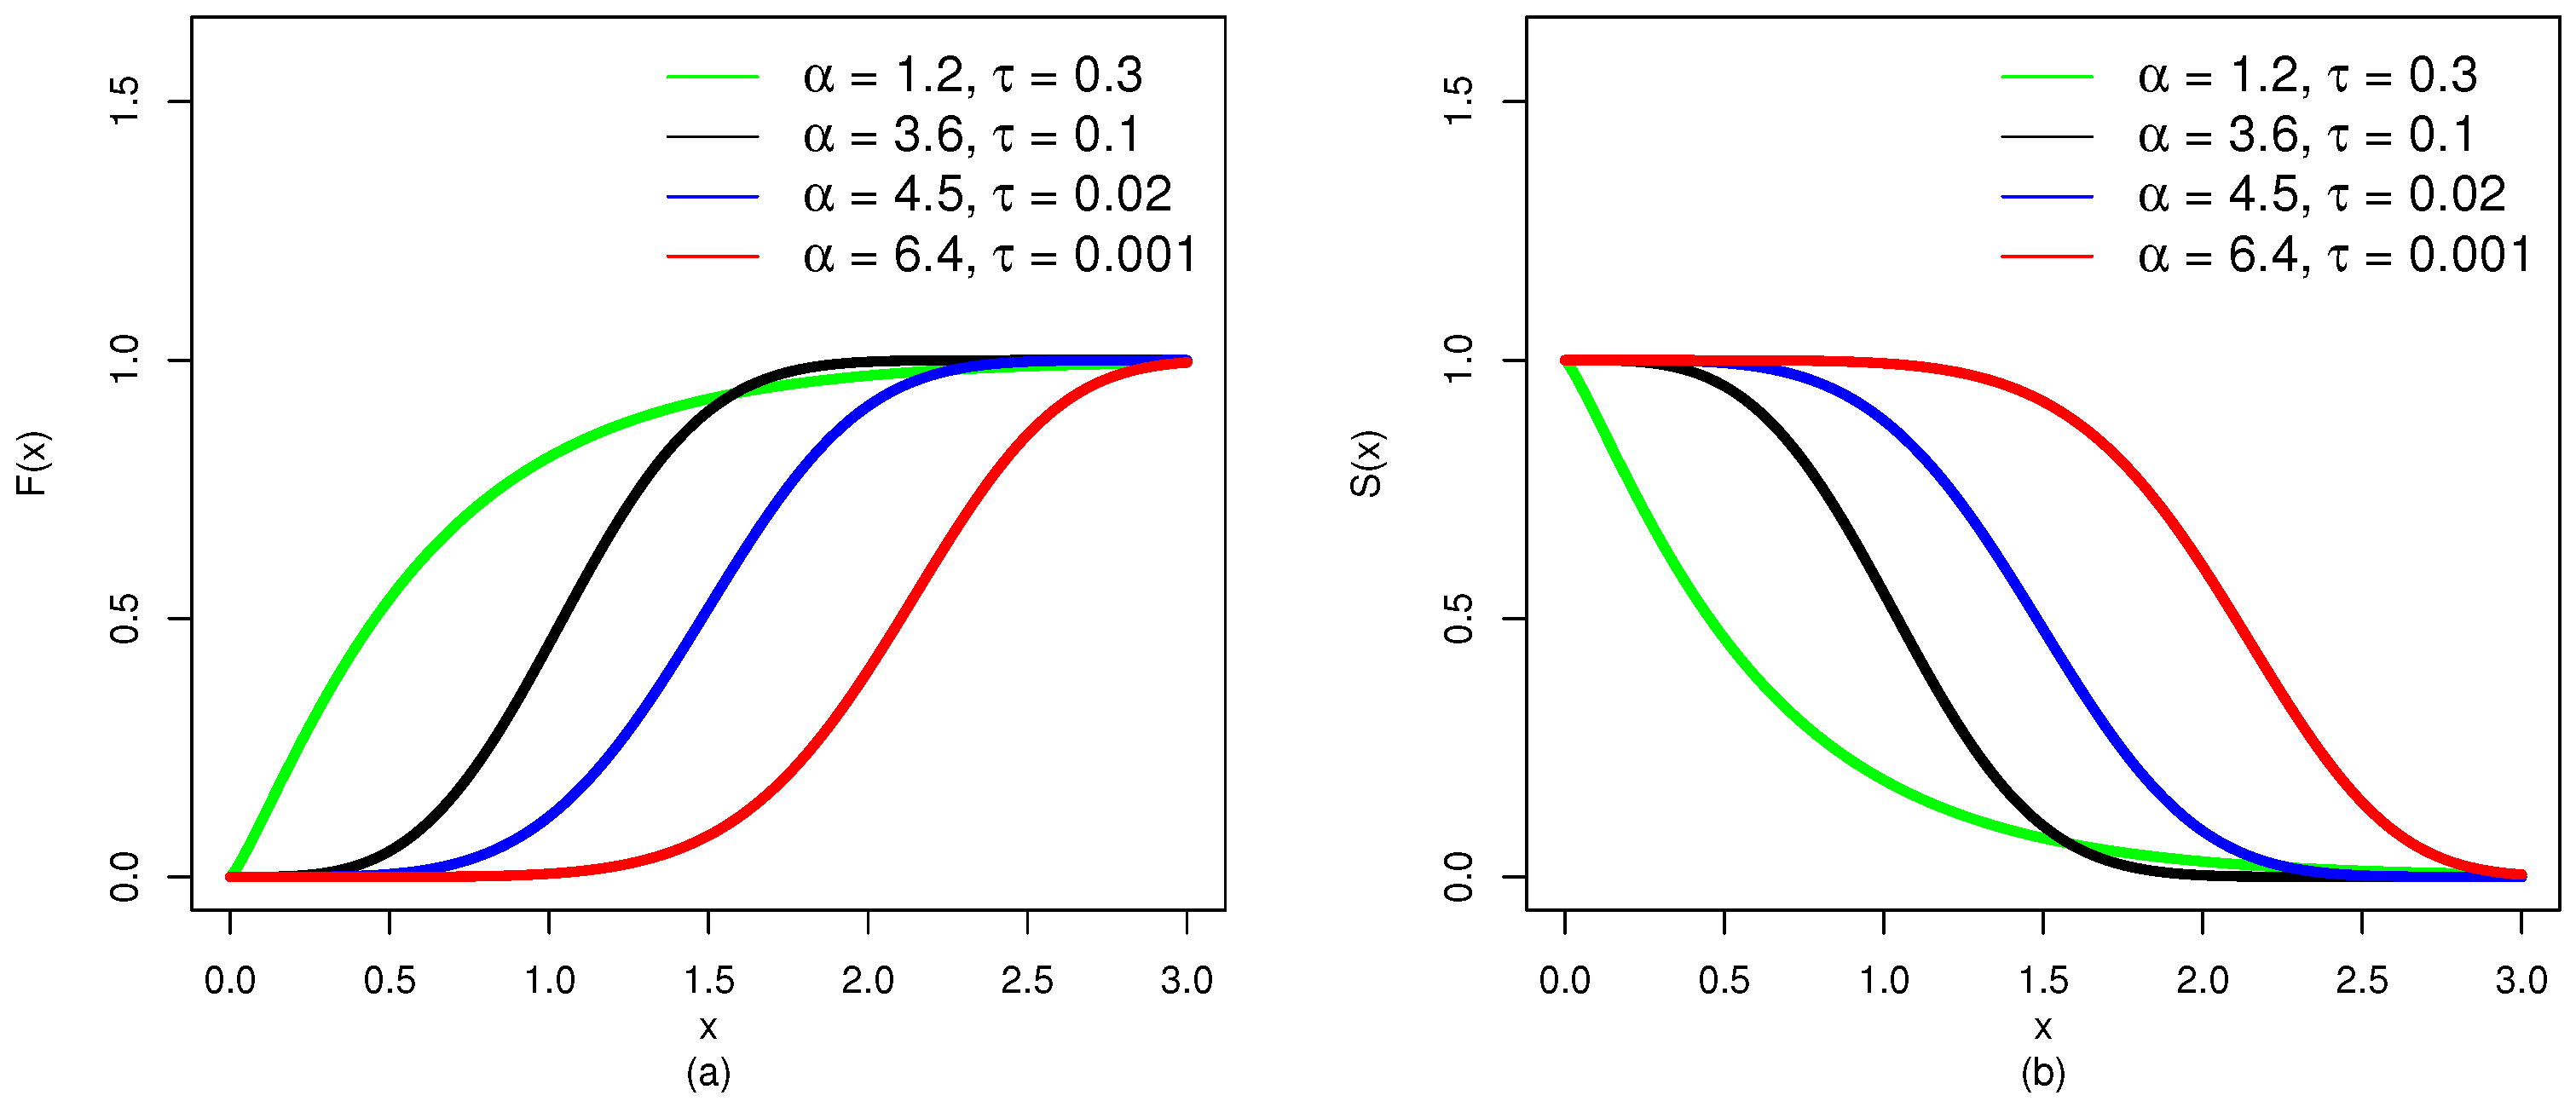
The visual representations for
and
of the NMC-Weibull distribution are shown in
Figure 1. The plots of
and
are sketched for
and
.
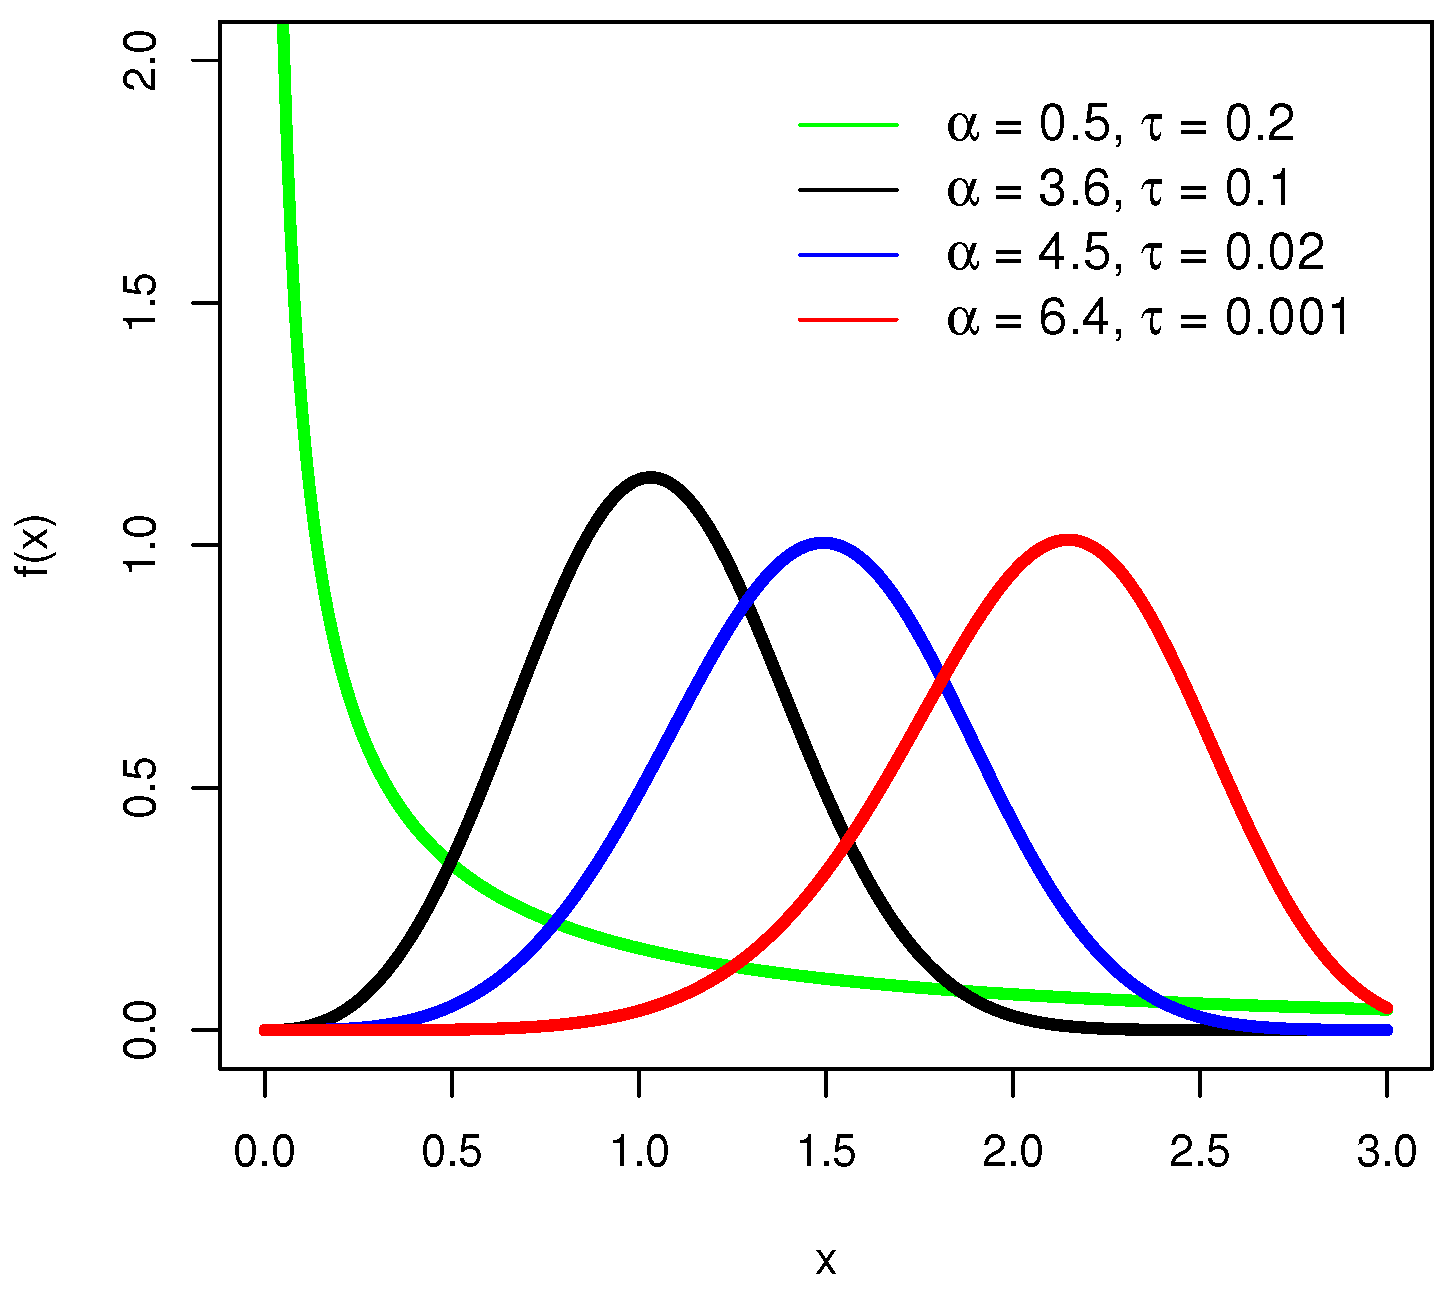
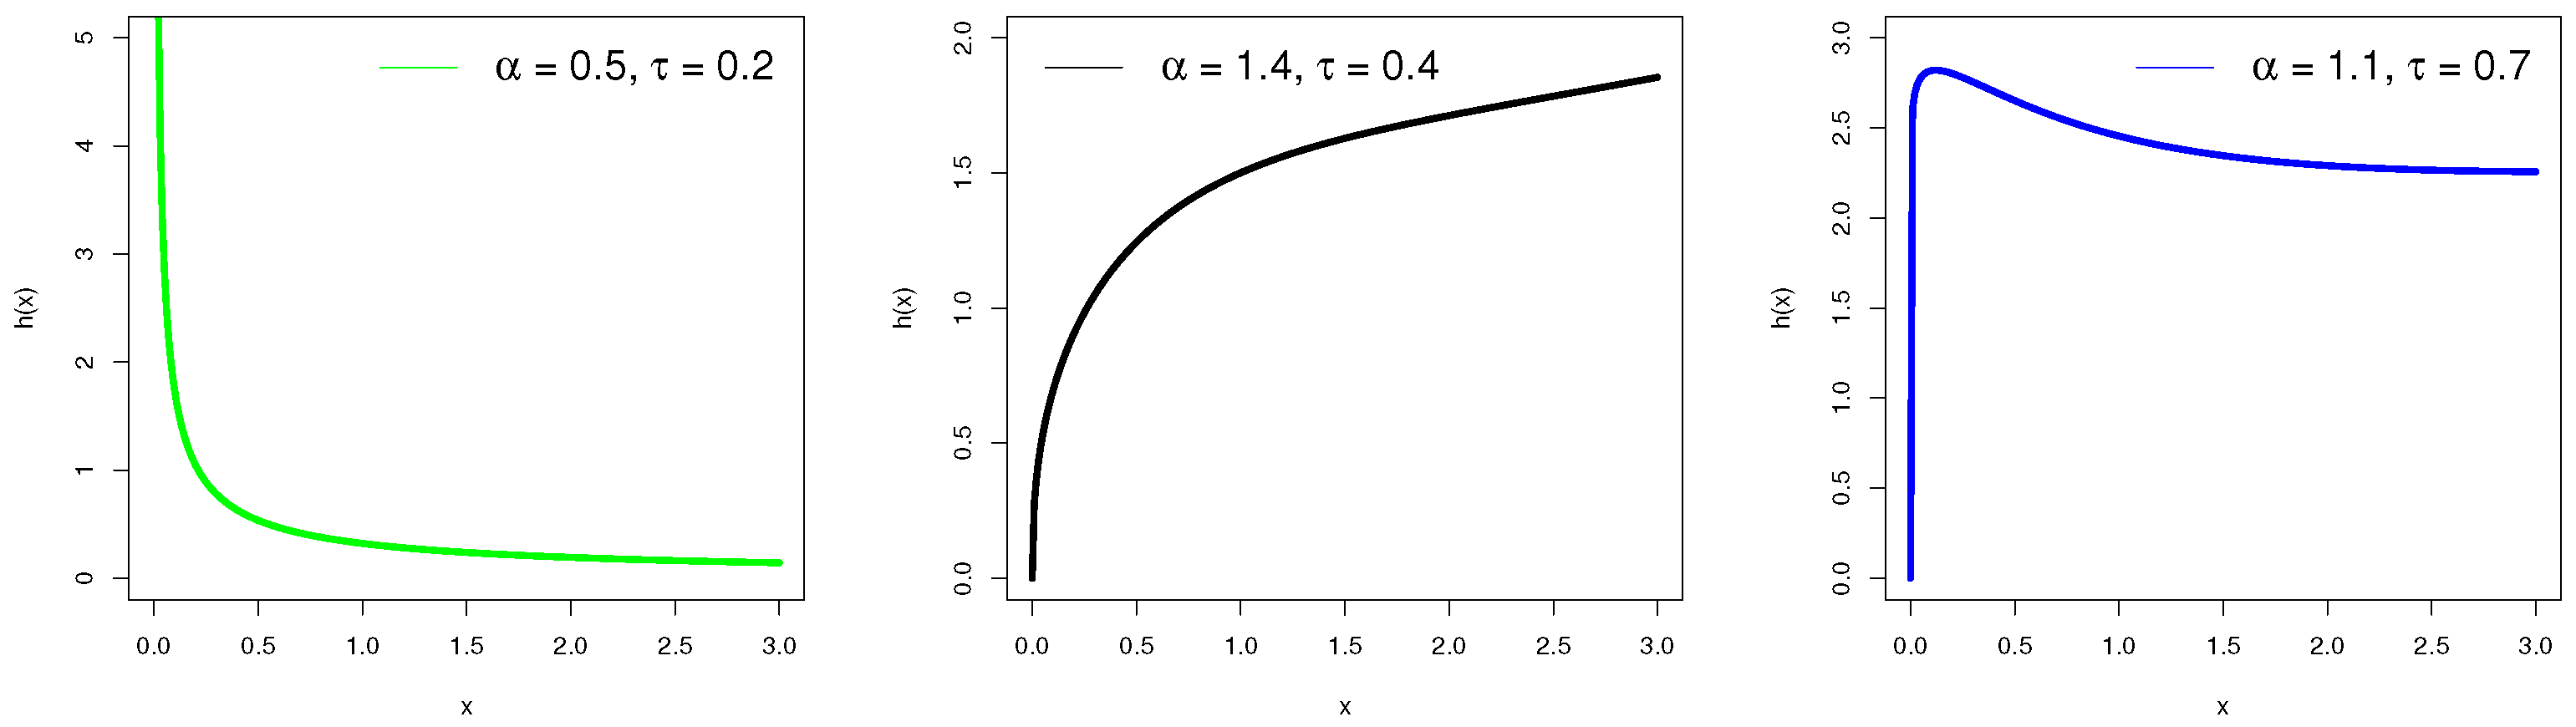
The plots of
for
,
and the plots of
for
,
are, respectively, presented in
Figure 2 and
Figure 3.
From
Figure 2, we can see that when
,
of the NMC-Weibull model has a reverse-J shape (or decreasing shape). Furthermore, we can see that when the value of
increases and the value of
decreases,
of the NMC-Weibull distribution captures the following:
- (a)
a right-skewed shape when and ,
- (b)
a symmetrical shape when and , and
- (c)
a left-skewed shape when and .
Figure 3 shows that when
,
of the NMC-Weibull has a decreasing form. When
,
of the NMC-Weibull distribution has an increasing form. Moreover, when
and the value of
increases,
of the NMC-Weibull distribution tends to unimodal.
3. Data Analysis
Here, we practically show the implications of the NMS-Weibull distribution on an industrial scale. For this purpose, we consider a reliability engineering data set taken from [
16]. The observations of the data set represent the waiting period between each successive failure when testing secondary reactor pumps, which are measured in thousands of hours. The observations of the considered reliability data sets are 6.560, 5.320, 4.992, 4.082, 3.465, 2.160, 1.921, 1.359, 1.060, 0.954, 0.746, 0.614, 0.605, 0.491, 0.402, 0.358, 0.347, 0.273, 0.199, 0.150, 0.101, 0.070, 0.062. Some descriptive measures of the data set are:
minimum = 0.062, maximum = 6.560, mean/
= 1.578, median/
= 0.614, variance = 3.7275,
= 0.310, standard deviation = 1.9306,
= 2.041, skewness = 1.3643, kurtosis = 3.54453, and range = 6.498. For information on researchers who have recently considered this data set, see [
17,
18].
Figure 4 sketches some baseline plots for the secondary reactor pump data set.
By means of secondary reactor pump data, the performance of the NMC-Weibull distribution is compared numerically and visually with the baseline Weibull distribution. Additionally, the performance of the NMC-Weibull distribution is also compared numerically and visually with the (a) new modified Weibull (NM-Weibull) distribution with parameters (b) exponential TX Weibull (ETX-Weibull) distribution with parameters and (c) new beta power transformed Weibull (NBPT-Weibull) distribution with parameter
For the SFs of the rival distributions are
NBPT-Weibull distribution
The next step after selecting the competing models is to consider evaluation criteria to identify which distribution has the most optimal fit and best suited for the secondary reactor pump data. To figure out the most optimal model for the secondary reactor pumps data, we consider three well-known evaluation criteria. These assessment criteria are
In addition to the above three evaluation criteria, the p-value relating to the KS test is also taken into account to calculate when comparing the performances of the fitted distributions. The numerical values of the evaluation criteria as well as the p-value are obtained by implementing the with software (version 4.2.0) using the method.
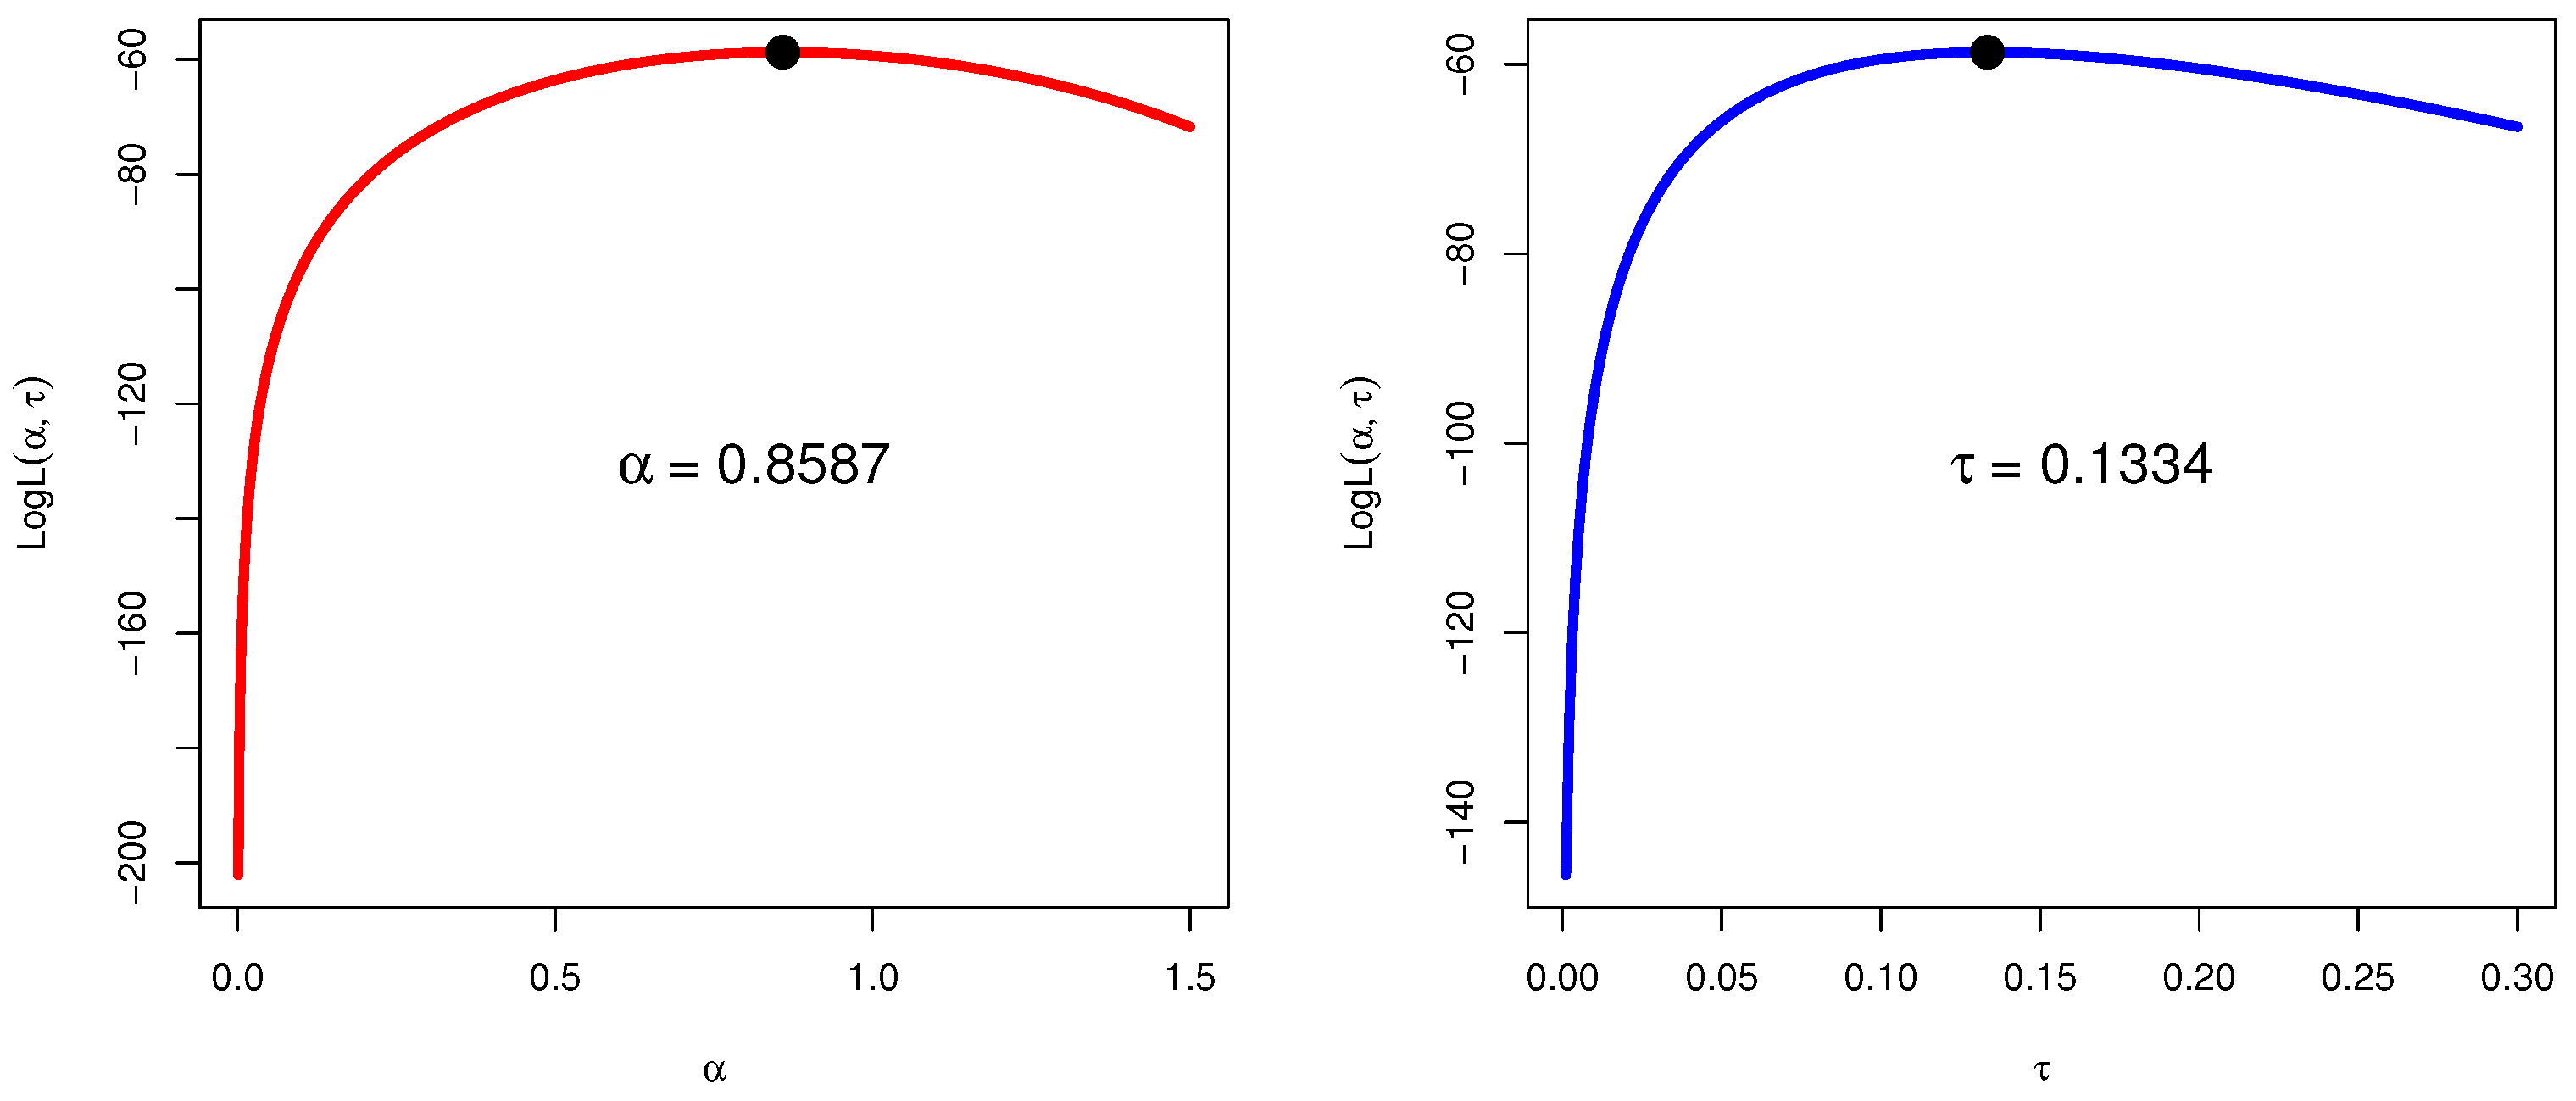
After carrying out the analysis, the values of
are provided in
Table 1. In order to check the uniqueness of
and
of the NMC-Weibull distribution, we obtain the log-likelihood profiles plots of
and
.
Figure 5 illustrates and confirms the uniqueness of
and
.
With regard to the secondary reactor pump data,
Table 2 reports the assessment criteria values as well as the
p-value for the fitted distribution. Based on our analysis of the secondary reactor pumps data, we can conclude that the NMC-Weibull distribution may be the best choice to apply for the data sets on the industrial scale.
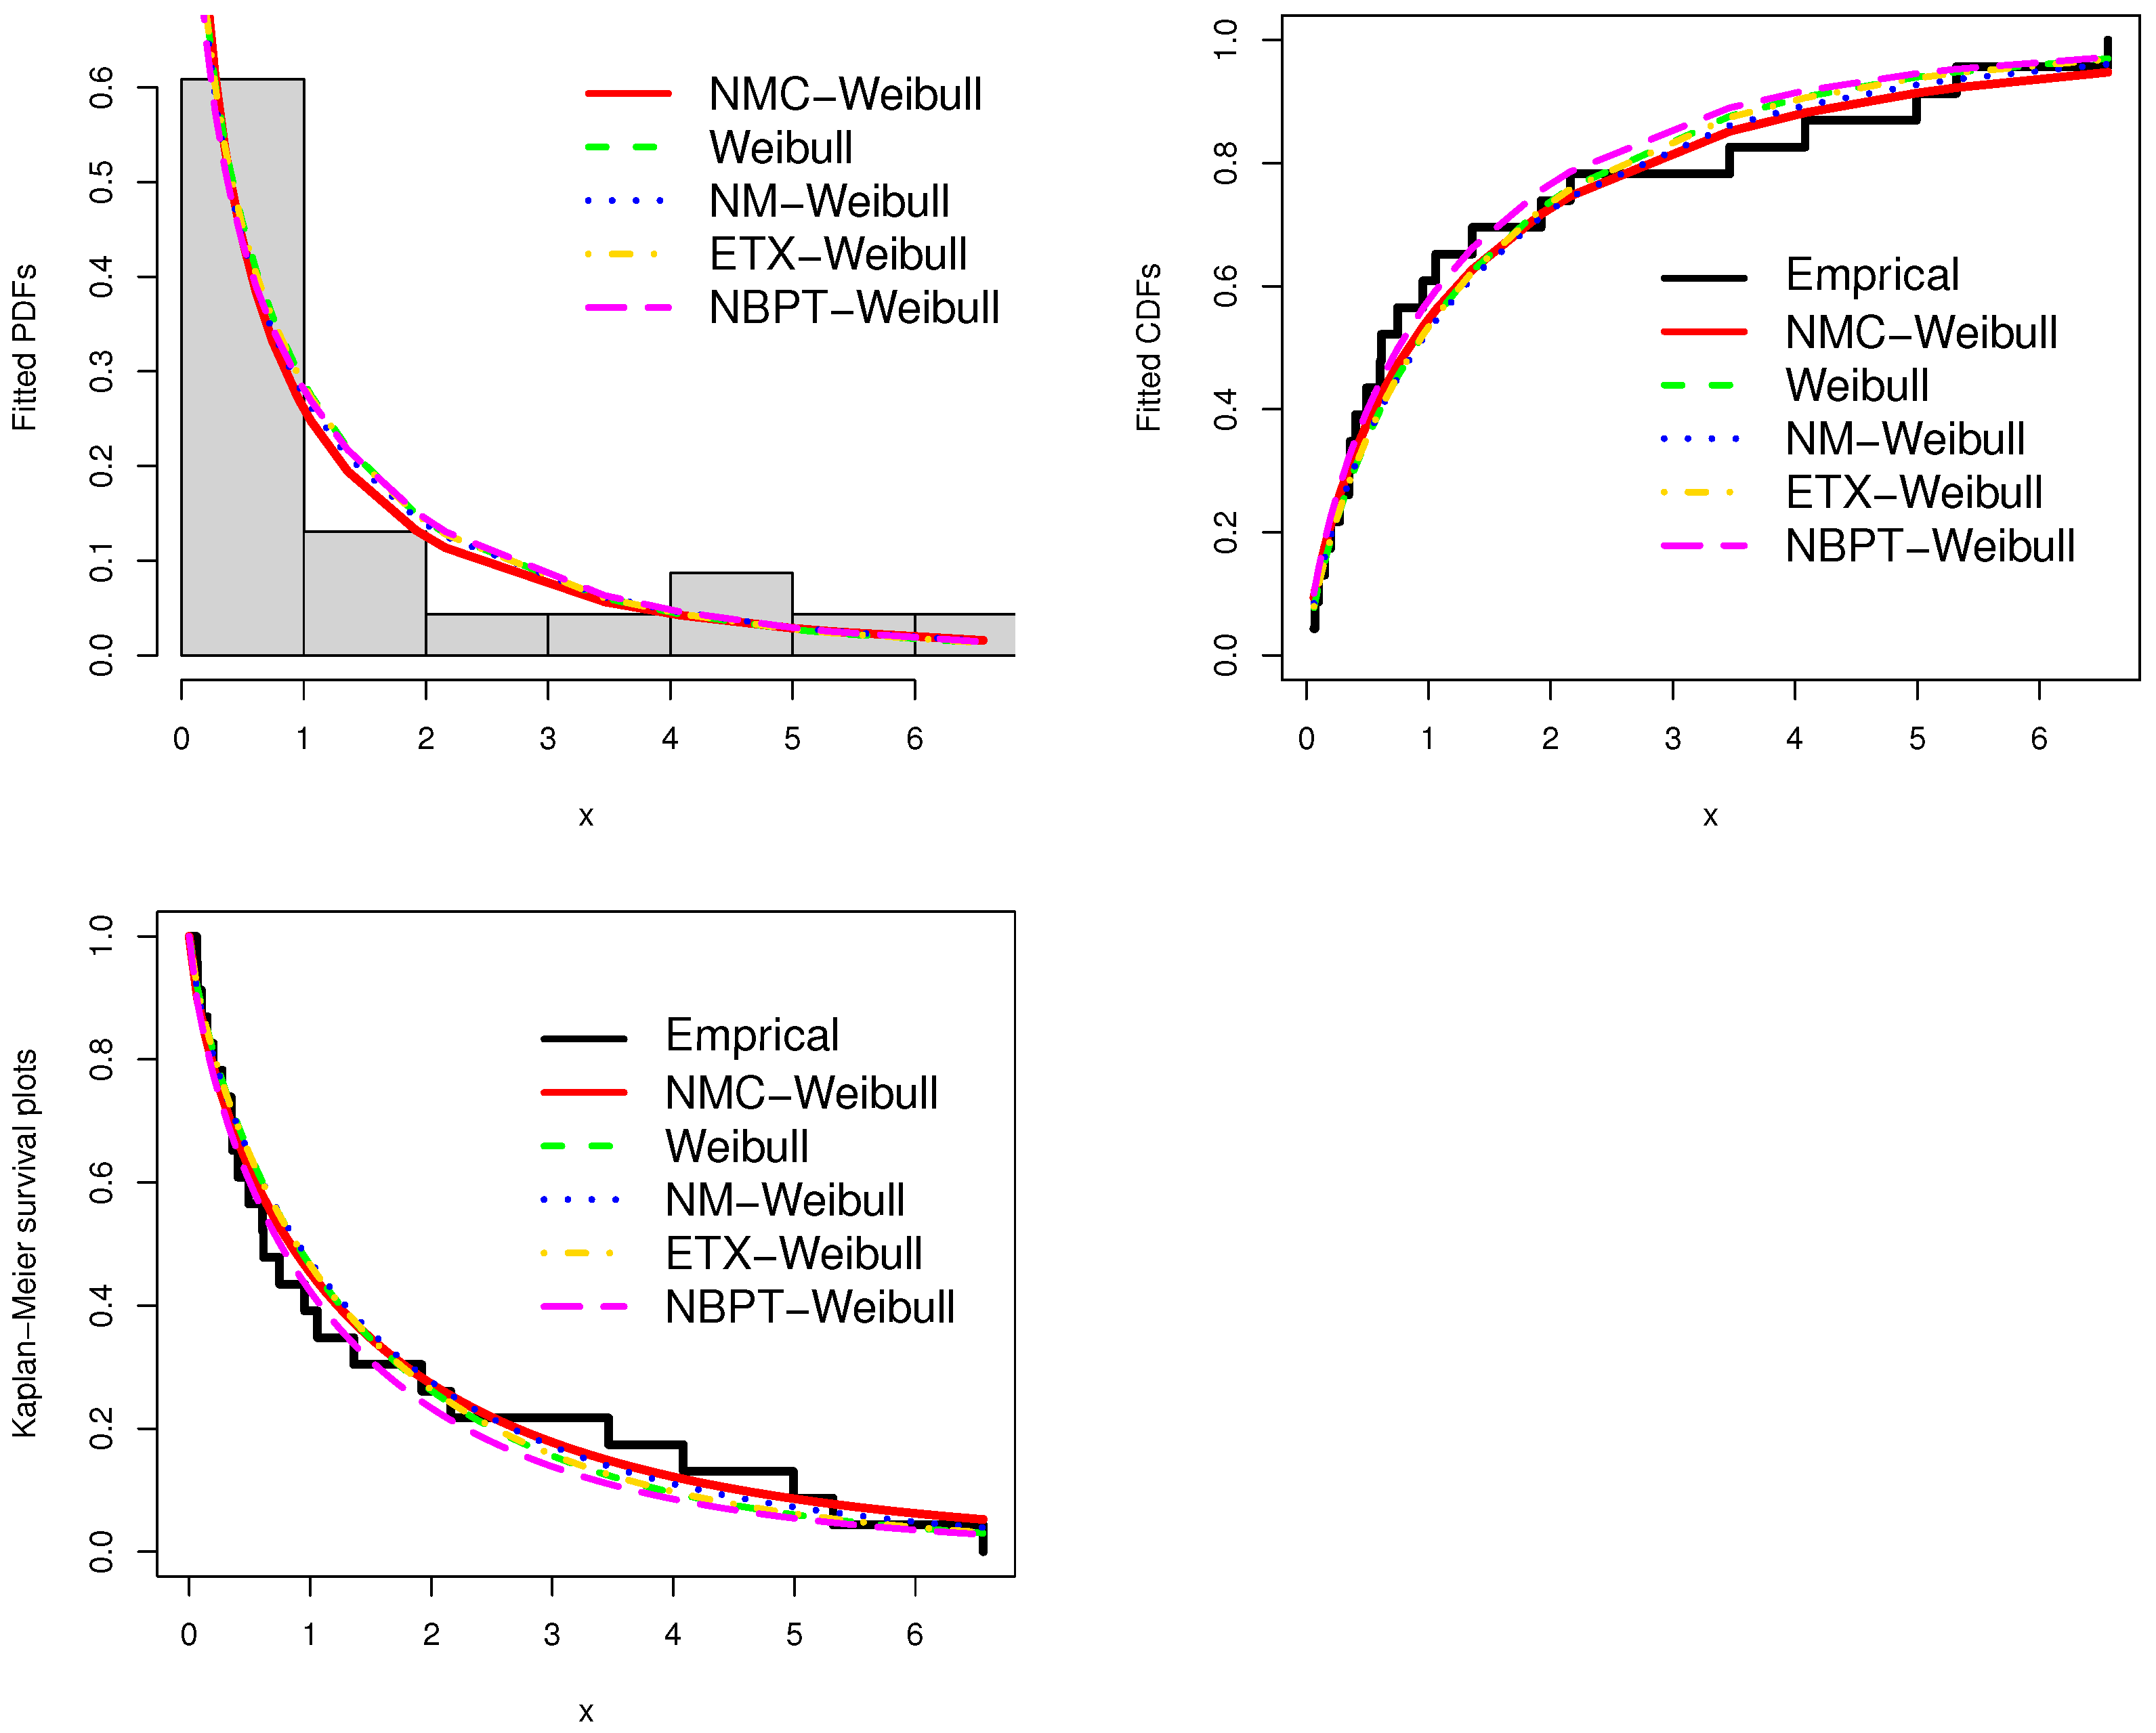
In addition to the numerical assessments in
Table 2, we also carry out a visual illustration/comparison of the fitted distributions. For such comparison through the secondary reactor pumps data, we consider three graphical tools such as the (
i) fitted PDF, (
ii) empirical CDF, and (
iii) estimated survival plots.
Figure 6 presents the fitted plots, which graphically illustrate and demonstrate the fitting ability (or optimality) of the competing distributions. The given visual results in
Figure 6 show that the secondary reactor pump data set is closely fitted by the NMC-Weibull distribution.
4. A New Repetitive Acceptance Sampling Plan
In medical research and life testing trials, type-I and type-II filtering are two censoring techniques that are frequently employed. The test duration is fixed by the type-I filtering system and the number of failures is fixed by the type-II filtering technique. Nonetheless, time-truncated schemes are now preferred in life testing. In life testing, the experiment is often terminated when the allotted amount of time has passed. To cut down on the time and expense of the experiment to obtain the ultimate conclusion, this plan is more practical than censorship systems.
Generally speaking, an attribute sampling plan is easier to apply than a variable sampling plan, but it does require more samples. A specified number of units from each lot are inspected during attribute sampling, and each unit is labeled as either conforming or nonconforming. Accept the lot if the sample’s nonconforming unit count is less than or equal to the required minimum; if not, reject it. Depending on how many samples need to be taken from the lot, sampling plans can be further divided into single, double, multiple, sequential, repeated, and more categories. The cost of the inspection, which is directly correlated with sample size, is a concern for the producers during the product inspection process. Thus, to reduce the expense, duration, and effort of the inspection, the researchers would like to suggest a more effective sample approach. Industrial engineers love single sampling plans (SSP) for their simplicity, but in certain situations, deciding on lot sentencing solely based on a single sample might damage goodwill between producers and consumers.
In circumstances where sampling inspection products are harmful and extremely expensive, a repeated sampling plan is more suitable. Based on the excellent deal’s repeated sample test findings, this plan allows for either acceptance or rejection of the lot. Comparing the repeated sampling plan to the single sampling plan, the latter can provide the smallest sample size with the appropriate protection. Regardless of the established acceptance sampling plans (ASP), the lot decision is always linked to the producer and consumer risk. This means that one may choose to accept a subpar lot or reject an excellent lot.
The risk to the consumer
is the possibility that a poor lot will be accepted, whereas the risk to the producer
is the possibility that a good lot will be rejected. Therefore, the sampling plan’s objective is to collect as few samples as feasible to minimize these risks; see [
19,
20,
21,
22,
23].
If a sampling plan was designed in a method that required a minimum sample size, it was deemed to be the best one out of the ones that were available for examination. These designs are referred to as inexpensive sampling plans because they have a minimal sample size, which reduces the inspection costs. It saves time as well. The main advantage of the recurring group acceptance sampling approach is a reduction in the ASN based on attribute repetitive group sampling. Sherman [
24] proposed a repeating group acceptance sampling approach for a normal distribution. According to him, the repeated group acceptance sampling plan that was developed offers a sample size that is as near to the consumer risk as feasible. Many authors thought about repetitive acceptance sampling plans (RASP) for different distributions; for additional information, see [
25,
26,
27,
28,
29,
30,
31,
32].
The
th percentile of the NMC-Weibull is given as
On simplifying Equation (
7), we obtain
where
In order to obtain a lot with defective fraction
p, we postulate the termination time
as a multiple of the specified lifetime
. That is,
, for a constant
a which is known as the experiment termination ratio and the targeted
th lifetime percentile,
, thus,
4.1. Design of the Repetitive Acceptance Sampling Scheme
The following is a description of the RASP under the proposed plan’s truncated life test:
Step-1: select a sample at random of size n from the whole population, and subject them to a timed life test
Step-2: if the number of failures (D) is less than (or equal to) , accept the lot (first acceptance number). As soon as the number of defectives surpasses , the test and the lot should be terminated , where
Step-3: if , then move to Step-1. Continue the earlier experiment. The parameters of the suggested plan are and . The single sample plan is generalized into the characteristics repetitive acceptance sampling plan, which reduces the above-mentioned strategy to a SSP. The operational characteristic (OC) function, from which the probability of acceptance lot is determined, is deduced to be:
where
is the probability of acceptance of a submitted lot with a fraction of defective
P based on a given sample.
whereas,
is the corresponding probability of lot rejection.
The OC specified in Equation (
8) can therefore be rewritten as
The design parameters of the proposed RASP are
and
, as pointed out by Aslam and Jun [
33]. It could be simplest to state the time of termination
, as a multiple of the specified length
a. Accordingly, we will consider that
for a constant
a and the targeted
th lifetime percentile,
thus,
At two places on the OC curve, we select the strategy that accounts for both the producer’s and the customer’s risk. This viewpoint was adopted by many writers, such as Fertig and Mann [
34], to create their sample plans. This approach calculates the quality level as a ratio of its life expectancy to the specified value
. A minimum probability of lot acceptance of
at the Acceptance Quality Level (AQL) is demanded from the producers; let
be the probability of a failure corresponding to the producer’s risk
at AQL, say
However, from the standpoint of the customer, the lot rejection probability should be at most
at the Restricted Quality Level. Let
stand for the probability of a corresponding consumer’s risk
at LQL, say
. The following two inequality conditions must be met for the RASP parameters
and
:
and
where
and
are given by
and
The minimum ASN at the LQL yields the recommended repetitive acceptance sampling plan’s parameters. Here is the suggested plan’s ASN when
p is the true fraction faulty.
Thus, the proposed plan’s , and parameters can be found by resolving the following optimization issue:
Minimize , subject to
where n is an integer.
Given the producer’s risk and its percentile ratio with to 1.0, there are three parameters and in this proposed RASP under the truncated life test at the specified time , with , and obtained according to the consumer’s confidence levels and for 50th percentile lifetime. The ASN is also reported and finally, the probability of acceptance is also reported.
Finally, the likelihood of acceptance is presented together with the ASN.
Table 3,
Table 4,
Table 5 and
Table 6 present the findings. The NMC-Weibull distribution estimated parameters value
, the sampling parameters for 50th percentile predicted lives are shown in
Table 6.
The sample size
n reduces as the constant increases from 0.5 to 1.0, as seen in
Table 3,
Table 4,
Table 5 and
Table 6. Moreover, the sample size
n is reduced as the shape parameter rises from 0.8587 to 2.0. Moreover, the sample size grows as consumer risk rises. The tables also include the ASN and acceptance probability
for the best acceptance strategies.
4.2. An Industrial Application of the Developed Plan
The waiting durations between successive failures when testing secondary reactor pumps are used to show the planned scheme for NMC-Weibull in this section using real lifetime data. Take the NMC-Weibull distribution for the data set as given. The MLEs of the parameters are
and
, respectively. The data set is reasonably suited for the NMC-Weibull distribution based on the results in
Table 2 and
Figure 6. Consider the NMC-Weibull distribution as the life cycle of the products with
,
,
,
, and
; thus we obtain
. Using
Table 6, we observe that
,
and
are the ideal design parameters. As a result, the sample plan can be put into practice as follows: choose a sample size, say
, at random from the group. If there are more than 11 failures, reject the lot and stop the test. Accept the lot if six failures occur during the testing of secondary reactor pumps before 0.150 million hours. The experiments should be repeated if there are between 6 and 11 failures. Our data show that three failures occurred within 0.150 million hours. As a result, the provided lot is accepted as the best professional judgment.
4.3. Comparison Study
An attributes RASP based on truncated life tests is unquestionably superior to the corresponding SSP in terms of necessary sample size. The sample size for the RASP with the recommended features and the SSP when producer’s risk
,
, consumer’s confidence levels
, and
are reported in
Table 7 and
Table 8. It is evident in
Table 7 that the developed scheme required a small sample size than the SSP. For instance, when
,
, and
, the sample size of the proposed plan is 42, whereas the SSP is 122. From
Table 8, for example,
,
,
, and
, the sample size of the proposed plan is 16, whereas the SSP is 53. According to this study’s findings, the RASP approach offers greater benefits than the SSP.
5. Concluding Remarks
We attempted to fill the curious and astonishing research gap by constructing a new repetitive acceptance sample design using a trigonometric-based probability distribution. For this purpose, we proposed a new distributional method via the cosine function, called a NMC-G family. Using the NMC-G method, a new useful probability model called a NMC-Weibull distribution was studied. Based on the NMC-Weibull time-truncated life test, a new repetitive acceptance sample design was introduced. Producer and customer risk are taken into consideration simultaneously while determining the characteristics of the suggested sample plan, , and . Regarding sample size, a comparison is made between the SSP technique and the suggested recurrent group sampling plan. We discovered that the suggested method works better than the option of using the SSP.
In this paper, we considered the statistical modeling of the reliability data set using the NMC-Weibull distribution. Furthermore, we constructed an acceptance sampling strategy for the NMC-Weibull distribution. Motivated by [
35,
36,
37], in the future, we intend to carry out Bayesian analysis using the NMC-Weibull distribution.
Author Contributions
Conceptualization, H.M.A., G.S.R., J.-T.S., S.S. and S.K.K.; Methodology, H.M.A., G.S.R., J.-T.S., S.S. and S.K.K.; Software, H.M.A., G.S.R., J.-T.S., S.S. and S.K.K.; Validation, H.M.A., G.S.R. and S.S.; Formal analysis, H.M.A., G.S.R., J.-T.S., S.S. and S.K.K.; Investigation, G.S.R. and S.K.K.; Resources, S.S.; Data curation, H.M.A., J.-T.S. and S.K.K.; Writing—original draft, H.M.A., G.S.R., J.-T.S., S.S. and S.K.K.; Visualization, H.M.A., G.S.R., J.-T.S. and S.K.K. All authors have read and agreed to the published version of the manuscript.
Funding
Princess Nourah bint Abdulrahman University Researchers Supporting Project number (PNURSP2023R 299), Princess Nourah bint Abdulrahman University, Riyadh, Saudi Arabia.
Data Availability Statement
Where requested, the data sets shall be made available by the corresponding author.
Conflicts of Interest
The authors declare no conflict of interest.
References
- Butt, K.A.; Aslam, M.; Jun, C.H. Analysis of process yield in a cost-effective double acceptance sampling plan. Commun. Stat.-Theory Methods 2020, 49, 5975–5987. [Google Scholar] [CrossRef]
- Liaqat, M.; Saeed, N.; Saleem, K.; Aslam, M.; Sherwani, R.A.K. A Modified Group Chain Sampling Plan for lifetime following Kumaraswamy Generalized Power Weibull Distribution with Minimum Angle Approach. Sci. Iran. 2023. [Google Scholar] [CrossRef]
- Mahmood, Y.; Fatima, S.; Khan, H.; Amir, H.; Khoo, M.B.; Teh, S.Y. Acceptance sampling plans based on Topp-Leone Gompertz distribution. Comput. Ind. Eng. 2021, 159, 107526. [Google Scholar] [CrossRef]
- Gharaibeh, N.G.; Liu, L.; Wani, S.S. Skip-lot acceptance sampling plans for highway construction and materials. J. Constr. Eng. Manag. 2012, 138, 791–796. [Google Scholar] [CrossRef]
- Yen, C.H.; Lee, C.C.; Lo, K.H.; Shiue, Y.R.; Li, S.H. A rectifying acceptance sampling plan based on the process capability index. Mathematics 2020, 8, 141. [Google Scholar] [CrossRef]
- Singh, S.; Tripathi, Y.M. Acceptance sampling plans for inverse Weibull distribution based on truncated life test. Life Cycle Reliab. Saf. Eng. 2017, 6, 169–178. [Google Scholar] [CrossRef]
- Abushal, T.A.; Hassan, A.S.; El-Saeed, A.R.; Nassr, S.G. Power inverted Topp–Leone distribution in acceptance sampling plans. Comput. Mater. Contin. 2021, 67, 991–1011. [Google Scholar] [CrossRef]
- Tripathi, H.; Dey, S.; Saha, M. Double and group acceptance sampling plan for truncated life test based on inverse log-logistic distribution. J. Appl. Stat. 2021, 48, 1227–1242. [Google Scholar] [CrossRef]
- Alyami, S.A.; Elgarhy, M.; Elbatal, I.; Almetwally, E.M.; Alotaibi, N.; El-Saeed, A.R. Fréchet Binomial Distribution: Statistical Properties, Acceptance Sampling Plan, Statistical Inference and Applications to Lifetime Data. Axioms 2022, 11, 389. [Google Scholar] [CrossRef]
- Algarni, A. Group Acceptance Sampling Plan Based on New Compounded Three-Parameter Weibull Model. Axioms 2022, 11, 438. [Google Scholar] [CrossRef]
- Nassr, S.G.; Hassan, A.S.; Alsultan, R.; El-Saeed, A.R. Acceptance sampling plans for the three-parameter inverted Topp–Leone model. Math. Biosci. Eng. 2022, 19, 13628–13659. [Google Scholar] [CrossRef] [PubMed]
- Khan, M.Z.; Khan, M.F.; Aslam, M.; Mughal, A.R. Fuzzy acceptance sampling plan for transmuted Weibull distribution. Complex Intell. Syst. 2022, 8, 4783–4795. [Google Scholar] [CrossRef]
- Fayomi, A.; Khan, K. A group acceptance sampling plan for ‘Another Generalized Transmuted-Exponential Distribution’based on truncated lifetimes. Qual. Reliab. Eng. Int. 2022. [Google Scholar] [CrossRef]
- Al-Omari, A.I.; Alomani, G. Double acceptance sampling plan based on truncated life tests for two-parameter Xgamma distribution. Electron. J. Appl. Stat. Anal. 2022, 15, 290–321. [Google Scholar]
- Yiğiter, A.; Hamurkaroğlu, C.; Danacıoğlu, N. Group acceptance sampling plans based on time truncated life tests for compound Weibull-exponential distribution. Int. J. Qual. Reliab. Manag. 2023, 40, 304–315. [Google Scholar] [CrossRef]
- Suprawhardana, M.S.; Prayoto, S. Total time on test plot analysis for mechanical components of the RSG-GAS reactor. At. Indones. 1999, 25, 81–90. [Google Scholar]
- Coşkun, K.U.Ş.; Korkmaz, M.Ç.; Kinaci, İ.; Karakaya, K.; Akdogan, Y. Modified-Lindley distribution and its applications to the real data. Commun. Fac. Sci. Univ. Ank. Ser. Math. Stat. 2022, 71, 252–272. [Google Scholar]
- Demirci, B.H.; Bicer, C.; Bakouch, H.S.H. A geometric process with Hjorth marginal: Estimation, discrimination, and reliability data modeling. Qual. Reliab. Eng. Int. 2022, 38, 2795–2819. [Google Scholar] [CrossRef]
- Kantam, R.R.L.; Rosaiah, K.; Rao, G.S. Acceptance sampling based on life tests: Log-logistic models. J. Appl. Stat. 2001, 28, 121–128. [Google Scholar] [CrossRef]
- Balakrishnan, N.; Leiva, V.; Lopez, J. Acceptance sampling plans from truncated life tests based on the generalized Birnbaum-Saunders distribution. Commun. -Stat.-Theory Methods. 2007, 36, 643–656. [Google Scholar] [CrossRef]
- Lio, Y.L.; Tsai, T.R.; Wu, S.J. Acceptance sampling plans from truncated life tests based on the burr type XII percentiles. J. Chin. Inst. Ind. Eng. 2010, 27, 270–280. [Google Scholar] [CrossRef]
- Lio, Y.L.; Tsai, T.R.; Wu, S.J. Acceptance sampling plans from truncated life tests based on the Birnbaum-Saunders distribution for percentiles. Commun. Stat.-Theory Methods. 2010, 39, 119–136. [Google Scholar] [CrossRef]
- Tsai, T.R.; Wu, S.J. Acceptance sampling based on truncated life tests for generalized Rayleigh distribution. J. Appl. Stat. 2006, 33, 595–600. [Google Scholar] [CrossRef]
- Sherman, R.E. Design and evaluation of repetitive group sampling plan. Technometrics 1965, 7, 11–21. [Google Scholar] [CrossRef]
- Balamurali, S.; Jun, C.-H. Repetitive group sampling procedure for variables inspection. J. Appl. Stat. 2006, 33, 327–338. [Google Scholar] [CrossRef]
- Balamurali, S.; Park, H.; Jun, C.-H.; Kim, K.J.; Lee, J. Designing of variable repetitive group sampling plan involving minimum average sample number. J. Stat. Simul. Comput. 2005, 34, 799–807. [Google Scholar] [CrossRef]
- Lee, S.; Aslam, M.; Jun, C.-H. Repetitive group sampling plans with two specification limits. Pak. J. Stat. 2012, 28, 41–57. [Google Scholar]
- Aslam, M.; Jun, C.-H.; Fernez, A.J.; Ahmad, M.; Rasool, M. Repetitive Group Sampling Plan Based on Truncated Tests for Weibull Models. Res. J. Appl. Sci. Eng. Technol. 2014, 7, 1917–1924. [Google Scholar] [CrossRef]
- Singh, N.; Singh, N.; Kaur, K. Design of repetitive acceptance sampling plan for truncated life test using inverse Weibull distribution. Int. J. Manag. Technol. Eng. 2018, 8, 433–441. [Google Scholar]
- Singh, N.; Singh, N.; Kaur, K. A repetitive acceptance sampling plan for generalized inverted exponential distribution based on truncated life test. Int. J. Sci. Res. Math. Stat. Sci. 2018, 5, 58–64. [Google Scholar] [CrossRef]
- Kalyani, K.; Rao, G.S.; Rosaiah, K.; Sivakumar, D.C.U. Repetitive acceptance sampling plan for odds exponential log-logistic distribution based on truncated life test. J. Ind. Prod. Eng. 2021, 38, 395–400. [Google Scholar] [CrossRef]
- Rao, G.S.; Jilani, S.; Rao, A.V. Design of repetitive acceptance sampling plan for truncated life test using type II generalized half-logistic distribution. Songklanakarin J. Sci. Technol. 2021, 43, 1491–1498. [Google Scholar]
- Aslam, M.; Jun, C.H. A group acceptance sampling plans for truncated life tests based on the inverse Rayleigh and log-logistic distributions. Pak. J. Stat. 2009, 25, 107–119. [Google Scholar]
- Fertig, F.W.; Mann, N.R. Life-test sampling plans for two-parameter Weibull populations. Technometrics 1980, 22, 165–177. [Google Scholar] [CrossRef]
- Zhuang, L.; Xu, A.; Wang, X.L. A prognostic driven predictive maintenance framework based on Bayesian deep learning. Reliab. Eng. Syst. Safety 2023, 234, 109181. [Google Scholar] [CrossRef]
- Luo, C.; Shen, L.; Xu, A. Modelling and estimation of system reliability under dynamic operating environments and lifetime ordering constraints. Reliab. Eng. Syst. Safety 2022, 218, 108136. [Google Scholar] [CrossRef]
- Zhou, S.; Xu, A.; Tang, Y.; Shen, L. Fast Bayesian Inference of Reparameterized Gamma Process With Random Effects. IEEE Trans. Reliab. 2023, in press. [Google Scholar] [CrossRef]
Figure 1.
The visual representations for (a) and (b) of the NMC-Weibull distribution for and .
Figure 1.
The visual representations for (a) and (b) of the NMC-Weibull distribution for and .
Figure 2.
The PDF plots for and .
Figure 2.
The PDF plots for and .
Figure 3.
The HF plots for and .
Figure 3.
The HF plots for and .
Figure 4.
Some baseline plots for the secondary reactor pump data set.
Figure 4.
Some baseline plots for the secondary reactor pump data set.
Figure 5.
The log-likelihood profiles of and of the NMC-Weibull model for the secondary reactor pumps data.
Figure 5.
The log-likelihood profiles of and of the NMC-Weibull model for the secondary reactor pumps data.
Figure 6.
The optimal fitting comparison of the rival distributions for the data from the secondary reactor pumps.
Figure 6.
The optimal fitting comparison of the rival distributions for the data from the secondary reactor pumps.
Table 1.
Using the given secondary reactor pumps data, the values of and of the fitted distributions.
Table 1.
Using the given secondary reactor pumps data, the values of and of the fitted distributions.
| Models | | | | | |
|---|
| NMC-Weibull | 0.8587 | 0.1334 | - | - | - |
| Weibull | 0.8091 | 0.7642 | - | - | - |
| ETX-Weibull | 0.8009 | 26.772 | - | 0.7902 | - |
| NM-Weibull | 0.8000 | 0.7835 | 26.5708 | - | - |
| NBPT-Weibull | 0.8077 | 1.0008 | - | - | 0.7657 |
Table 2.
The assessment criteria values of the rival distributions for the data from the secondary reactor pumps.
Table 2.
The assessment criteria values of the rival distributions for the data from the secondary reactor pumps.
| Models | CVM | AD | KS | p-Value |
|---|
| NMC-Weibull | 0.0575 | 0.3894 | 0.1105 | 0.9126 |
| Weibull | 0.0655 | 0.4315 | 0.1192 | 0.8615 |
| ETX-Weibull | 0.0664 | 0.4365 | 0.1168 | 0.8766 |
| NM-Weibull | 0.0662 | 0.4353 | 0.1192 | 0.8614 |
| NBPT-Weibull | 0.0654 | 0.4310 | 0.1183 | 0.8667 |
Table 3.
The proposed plan’s design criteria for the NMC-Weibull distribution at .
Table 3.
The proposed plan’s design criteria for the NMC-Weibull distribution at .
| | | | |
|---|
| | | | | | ASN | | | | | ASN |
|---|
| | 1.5 | 4 | 6 | 41 | 0.9558 | 58.93 | 4 | 6 | 13 | 0.9515 | 20.52 |
| | 1.6 | 2 | 4 | 27 | 0.9545 | 43.51 | 3 | 5 | 11 | 0.9600 | 17.94 |
| 0.25 | 1.8 | 1 | 3 | 20 | 0.9706 | 35.76 | 3 | 4 | 10 | 0.9650 | 12.58 |
| | 2.0 | 0 | 2 | 13 | 0.9685 | 28.20 | 2 | 3 | 8 | 0.9672 | 10.24 |
| | 2.2 | 1 | 2 | 18 | 0.9694 | 23.47 | 1 | 2 | 6 | 0.9544 | 7.84 |
| | 1.5 | 2 | 6 | 37 | 0.9531 | 81.48 | 5 | 8 | 18 | 0.9515 | 28.09 |
| | 1.6 | 3 | 6 | 45 | 0.9512 | 66.59 | 5 | 7 | 17 | 0.9575 | 22.45 |
| 0.1 | 1.8 | 0 | 3 | 19 | 0.9509 | 45.57 | 2 | 4 | 10 | 0.9552 | 14.76 |
| | 2.0 | 1 | 3 | 25 | 0.9673 | 37.06 | 1 | 3 | 8 | 0.9539 | 11.91 |
| | 2.2 | 0 | 2 | 16 | 0.9654 | 28.52 | 0 | 2 | 5 | 0.9568 | 9.41 |
| | 1.5 | 5 | 9 | 66 | 0.9518 | 95.10 | 4 | 8 | 17 | 0.9583 | 32.41 |
| | 1.6 | 2 | 6 | 42 | 0.9510 | 73.25 | 5 | 8 | 19 | 0.9658 | 26.84 |
| 0.05 | 1.8 | 1 | 4 | 31 | 0.9513 | 49.80 | 1 | 4 | 9 | 0.9584 | 17.32 |
| | 2.0 | 0 | 3 | 23 | 0.9523 | 41.44 | 2 | 4 | 11 | 0.9690 | 14.51 |
| | 2.2 | 1 | 3 | 29 | 0.9711 | 37.99 | 1 | 3 | 9 | 0.9609 | 11.76 |
| | 1.5 | 5 | 11 | 80 | 0.9529 | 115.84 | 7 | 12 | 28 | 0.9567 | 38.86 |
| | 1.6 | 4 | 9 | 71 | 0.9532 | 93.54 | 3 | 8 | 18 | 0.9525 | 30.18 |
| 0.01 | 1.8 | 2 | 6 | 52 | 0.9532 | 66.62 | 2 | 6 | 15 | 0.9584 | 21.43 |
| | 2.0 | 0 | 4 | 31 | 0.9560 | 51.72 | 2 | 5 | 15 | 0.9541 | 17.59 |
| | 2.2 | 1 | 4 | 39 | 0.9764 | 48.71 | 1 | 4 | 12 | 0.9658 | 14.83 |
Table 4.
The proposed plan’s design criteria for the NMC-Weibull distribution at .
Table 4.
The proposed plan’s design criteria for the NMC-Weibull distribution at .
| | | | |
|---|
| | | | | | ASN | | | | | ASN |
|---|
| | 1.5 | 7 | 10 | 47 | 0.9542 | 74.21 | 6 | 9 | 18 | 0.9519 | 34.21 |
| | 1.6 | 6 | 8 | 40 | 0.9509 | 54.70 | 6 | 8 | 17 | 0.9548 | 25.52 |
| 0.25 | 1.8 | 3 | 5 | 25 | 0.9568 | 38.07 | 6 | 7 | 17 | 0.9506 | 19.96 |
| | 2.0 | 2 | 4 | 20 | 0.9677 | 32.44 | 1 | 3 | 6 | 0.9592 | 13.24 |
| | 2.2 | 0 | 2 | 9 | 0.9504 | 21.01 | 3 | 4 | 10 | 0.9659 | 12.58 |
| | 1.5 | 6 | 11 | 50 | 0.9561 | 101.15 | 8 | 12 | 25 | 0.9518 | 45.14 |
| | 1.6 | 8 | 11 | 58 | 0.9523 | 77.92 | 4 | 8 | 16 | 0.9515 | 36.35 |
| 0.1 | 1.8 | 3 | 6 | 31 | 0.9516 | 50.04 | 3 | 6 | 13 | 0.9535 | 23.80 |
| | 2.0 | 2 | 5 | 27 | 0.9578 | 43.35 | 4 | 6 | 15 | 0.9595 | 19.85 |
| | 2.2 | 2 | 4 | 24 | 0.9588 | 33.30 | 2 | 4 | 10 | 0.9565 | 14.76 |
| | 1.5 | 6 | 12 | 55 | 0.9505 | 113.01 | 8 | 13 | 27 | 0.9502 | 51.32 |
| | 1.6 | 6 | 11 | 55 | 0.9524 | 89.38 | 9 | 13 | 29 | 0.9613 | 42.95 |
| 0.05 | 1.8 | 3 | 7 | 36 | 0.9539 | 60.09 | 5 | 8 | 19 | 0.9510 | 26.84 |
| | 2.0 | 3 | 6 | 35 | 0.9574 | 48.21 | 3 | 6 | 14 | 0.9664 | 22.10 |
| | 2.2 | 1 | 4 | 22 | 0.9576 | 37.00 | 1 | 4 | 9 | 0.9598 | 17.32 |
| | 1.5 | 10 | 18 | 89 | 0.9529 | 139.57 | 10 | 17 | 36 | 0.9510 | 62.97 |
| | 1.6 | 6 | 13 | 64 | 0.9550 | 108.05 | 8 | 14 | 31 | 0.9500 | 48.04 |
| 0.01 | 1.8 | 5 | 10 | 57 | 0.9502 | 74.55 | 4 | 9 | 20 | 0.9598 | 33.67 |
| | 2.0 | 1 | 6 | 30 | 0.9527 | 57.11 | 3 | 7 | 17 | 0.9548 | 24.57 |
| | 2.2 | 2 | 6 | 38 | 0.9521 | 48.58 | 2 | 6 | 15 | 0.9602 | 21.43 |
Table 5.
The proposed plan’s design criteria for the NMC-Weibull distribution at .
Table 5.
The proposed plan’s design criteria for the NMC-Weibull distribution at .
| | | | |
|---|
| | | | | | ASN | | | | | ASN |
|---|
| | 1.5 | 12 | 17 | 55 | 0.9502 | 111.68 | 17 | 21 | 42 | 0.9535 | 72.57 |
| | 1.6 | 12 | 16 | 54 | 0.9571 | 91.72 | 9 | 13 | 25 | 0.9523 | 54.37 |
| 0.25 | 1.8 | 10 | 12 | 44 | 0.9503 | 57.18 | 7 | 10 | 20 | 0.9561 | 36.80 |
| | 2.0 | 4 | 7 | 24 | 0.9504 | 44.10 | 6 | 8 | 17 | 0.9517 | 25.52 |
| | 2.2 | 4 | 6 | 22 | 0.9526 | 32.89 | 5 | 7 | 15 | 0.9615 | 23.05 |
| | 1.5 | 16 | 23 | 77 | 0.9507 | 155.44 | 16 | 23 | 45 | 0.9545 | 107.34 |
| | 1.6 | 17 | 22 | 79 | 0.9505 | 118.64 | 17 | 22 | 46 | 0.9515 | 75.36 |
| 0.1 | 1.8 | 7 | 12 | 41 | 0.9545 | 81.09 | 14 | 17 | 38 | 0.9502 | 50.13 |
| | 2.0 | 5 | 9 | 32 | 0.9515 | 57.92 | 9 | 12 | 27 | 0.9542 | 38.00 |
| | 2.2 | 6 | 9 | 36 | 0.9502 | 49.65 | 6 | 9 | 20 | 0.9612 | 30.97 |
| | 1.5 | 17 | 26 | 87 | 0.9503 | 185.49 | 19 | 27 | 54 | 0.9505 | 115.86 |
| | 1.6 | 15 | 22 | 77 | 0.9505 | 134.45 | 20 | 26 | 55 | 0.9553 | 86.59 |
| 0.05 | 1.8 | 12 | 17 | 64 | 0.9509 | 91.66 | 11 | 16 | 34 | 0.9567 | 56.98 |
| | 2.0 | 6 | 11 | 40 | 0.9543 | 69.12 | 9 | 13 | 29 | 0.9574 | 42.95 |
| | 2.2 | 6 | 10 | 39 | 0.9595 | 57.32 | 4 | 8 | 17 | 0.9514 | 32.41 |
| | 1.5 | 37 | 47 | 174 | 0.9504 | 223.37 | 33 | 43 | 91 | 0.9533 | 136.20 |
| | 1.6 | 18 | 28 | 99 | 0.9524 | 166.05 | 26 | 34 | 74 | 0.9514 | 101.88 |
| 0.01 | 1.8 | 15 | 22 | 85 | 0.9513 | 111.84 | 14 | 21 | 46 | 0.9530 | 68.02 |
| | 2.0 | 6 | 13 | 47 | 0.9515 | 82.87 | 10 | 16 | 36 | 0.9568 | 51.66 |
| | 2.2 | 5 | 11 | 42 | 0.9521 | 65.90 | 9 | 14 | 33 | 0.9633 | 43.23 |
Table 6.
The proposed plan’s design criteria for the NMC-Weibull distribution at .
Table 6.
The proposed plan’s design criteria for the NMC-Weibull distribution at .
| | | | |
|---|
| | | | | | ASN | | | | | ASN |
|---|
| | 1.5 | 16 | 22 | 65 | 0.9522 | 142.29 | 20 | 25 | 49 | 0.9516 | 95.30 |
| | 1.6 | 17 | 21 | 66 | 0.9503 | 104.18 | 17 | 21 | 42 | 0.9526 | 72.57 |
| 0.25 | 1.8 | 9 | 13 | 40 | 0.9546 | 74.31 | 13 | 16 | 33 | 0.9566 | 50.92 |
| | 2.0 | 7 | 10 | 32 | 0.9520 | 52.60 | 7 | 10 | 20 | 0.9583 | 36.80 |
| | 2.2 | 5 | 8 | 25 | 0.9624 | 45.19 | 8 | 10 | 22 | 0.9509 | 30.25 |
| | 1.5 | 31 | 38 | 122 | 0.9517 | 193.86 | 35 | 41 | 85 | 0.9524 | 130.77 |
| | 1.6 | 23 | 29 | 94 | 0.9532 | 147.83 | 21 | 27 | 55 | 0.9529 | 99.57 |
| 0.1 | 1.8 | 13 | 18 | 59 | 0.9503 | 95.92 | 17 | 21 | 45 | 0.9537 | 65.73 |
| | 2.0 | 6 | 11 | 34 | 0.9535 | 73.33 | 14 | 17 | 38 | 0.9533 | 50.13 |
| | 2.2 | 6 | 10 | 33 | 0.9558 | 57.65 | 10 | 13 | 29 | 0.9598 | 40.70 |
| | 1.5 | 33 | 42 | 135 | 0.9521 | 221.34 | 36 | 44 | 91 | 0.9521 | 148.63 |
| | 1.6 | 22 | 30 | 96 | 0.9536 | 167.93 | 27 | 34 | 71 | 0.9536 | 114.13 |
| 0.05 | 1.8 | 15 | 21 | 70 | 0.9508 | 109.30 | 15 | 21 | 44 | 0.9527 | 75.32 |
| | 2.0 | 11 | 16 | 55 | 0.9513 | 82.00 | 15 | 19 | 43 | 0.9501 | 56.44 |
| | 2.2 | 7 | 12 | 41 | 0.9511 | 66.55 | 9 | 13 | 29 | 0.9514 | 42.95 |
| | 1.5 | - | - | - | - | - | - | - | - | - | - |
| | 1.6 | 36 | 46 | 156 | 0.9514 | 206.10 | 33 | 43 | 91 | 0.9517 | 136.20 |
| 0.01 | 1.8 | 17 | 26 | 87 | 0.9512 | 134.20 | 21 | 29 | 63 | 0.9517 | 90.23 |
| | 2.0 | 10 | 18 | 60 | 0.9505 | 100.31 | 12 | 19 | 41 | 0.9510 | 65.27 |
| | 2.2 | 7 | 14 | 47 | 0.9541 | 80.25 | 14 | 19 | 45 | 0.9516 | 54.72 |
Table 7.
Comparison of sample sizes for the NMC-Weibull distribution between proposed and single sampling schemes when and .
Table 7.
Comparison of sample sizes for the NMC-Weibull distribution between proposed and single sampling schemes when and .
| | | | | |
|---|
| | Proposed | Single | Proposed | Single | Proposed | Single |
|---|
| | 1.5 | 41 | 71 | 47 | 86 19 | 55 | 138 |
| | 1.6 | 27 | 58 | 40 | 67 | 54 | 107 |
| 0.25 | 1.8 | 20 | 37 | 25 | 47 | 44 | 71 |
| | 2.0 | 13 | 30 | 20 | 37 | 24 | 53 |
| | 2.2 | 18 | 30 | 9 | 27 | 22 | 42 |
| | 1.5 | 37 | 119 | 50 | 143 | 77 | 218 |
| | 1.6 | 45 | 91 | 58 | 113 | 79 | 168 |
| 0.1 | 1.8 | 69 | 19 | 31 | 77 | 41 | 113 |
| | 2.0 | 25 | 55 | 27 | 61 | 32 | 83 |
| | 2.2 | 16 | 47 | 24 | 51 | 36 | 68 |
| | 1.5 | 66 | 151 | 55 | 182 | 87 | 278 |
| | 1.6 | 42 | 122 | 55 | 141 | 77 | 212 |
| 0.05 | 1.8 | 31 | 85 | 36 | 94 | 64 | 142 |
| | 2.0 | 23 | 69 | 35 | 73 | 40 | 108 |
| | 2.2 | 29 | 53 | 22 | 62 | 39 | 85 |
| | 1.5 | 80 | 224 | 89 | 263 | 174 | 407 |
| | 1.6 | 71 | 172 | 64 | 206 | 99 | 311 |
| 0.01 | 1.8 | 52 | 125 | 57 | 142 | 85 | 210 |
| | 2.0 | 31 | 101 | 30 | 108 | 47 | 160 |
| | 2.2 | 39 | 84 | 38 | 91 | 42 | 124 |
Table 8.
Comparison of sample sizes for the NMC-Weibull distribution between proposed and single sampling schemes when and .
Table 8.
Comparison of sample sizes for the NMC-Weibull distribution between proposed and single sampling schemes when and .
| | | | | |
|---|
| | Proposed | Single | Proposed | Single | Proposed | Single |
|---|
| | 1.5 | 13 | 27 | 18 | 44 | 42 | 90 |
| | 1.6 | 11 | 18 | 17 | 31 | 25 | 67 |
| 0.25 | 1.8 | 10 | 14 | 17 | 23 | 20 | 46 |
| | 2.0 | 8 | 12 | 6 | 16 | 17 | 33 |
| | 2.2 | 6 | 10 | 10 | 14 | 15 | 27 |
| | 1.5 | 18 | 39 | 25 | 66 | 45 | 136 |
| | 1.6 | 17 | 33 | 16 | 53 | 46 | 102 |
| 0.1 | 1.8 | 10 | 21 | 13 | 35 | 38 | 70 |
| | 2.0 | 8 | 17 | 15 | 26 | 27 | 53 |
| | 2.2 | 5 | 14 | 10 | 21 | 20 | 39 |
| | 1.5 | 17 | 51 | 27 | 82 | 54 | 173 |
| | 1.6 | 19 | 37 | 29 | 62 | 55 | 130 |
| 0.05 | 1.8 | 9 | 28 | 19 | 44 | 34 | 89 |
| | 2.0 | 11 | 21 | 14 | 33 | 29 | 67 |
| | 2.2 | 9 | 18 | 9 | 28 | 17 | 51 |
| | 1.5 | 28 | 73 | 36 | 116 | 91 | 250 |
| | 1.6 | 18 | 54 | 31 | 94 | 74 | 189 |
| 0.01 | 1.8 | 15 | 40 | 20 | 64 | 46 | 125 |
| | 2.0 | 15 | 30 | 17 | 47 | 36 | 96 |
| | 2.2 | 12 | 25 | 15 | 40 | 33 | 78 |
| Disclaimer/Publisher’s Note: The statements, opinions and data contained in all publications are solely those of the individual author(s) and contributor(s) and not of MDPI and/or the editor(s). MDPI and/or the editor(s) disclaim responsibility for any injury to people or property resulting from any ideas, methods, instructions or products referred to in the content. |
© 2023 by the authors. Licensee MDPI, Basel, Switzerland. This article is an open access article distributed under the terms and conditions of the Creative Commons Attribution (CC BY) license (https://creativecommons.org/licenses/by/4.0/).


 ,
, 

