Lambert W Random Variables and Their Applications in Loss Modelling
Abstract
1. Introduction
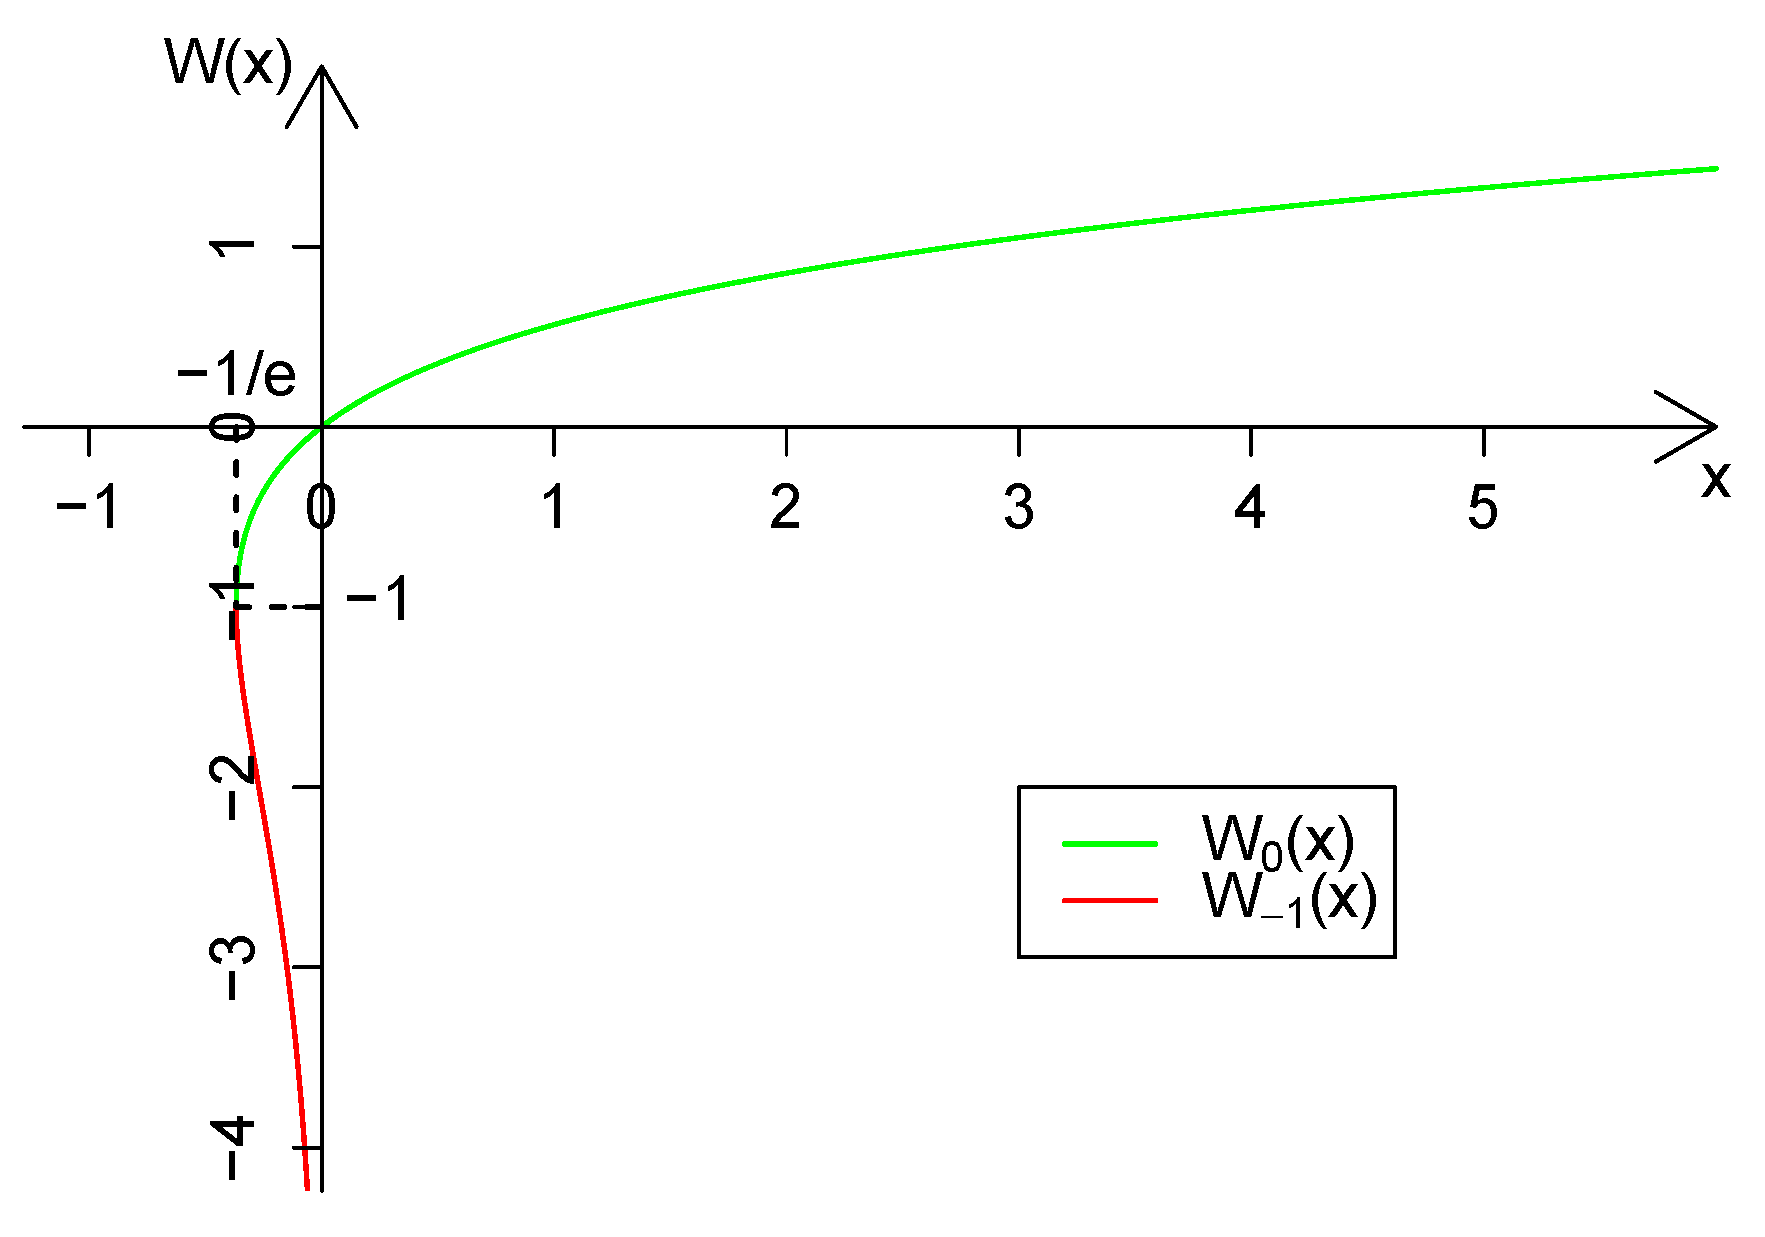
2. The Lambert W Function and Its Properties
3. Lambert W Random Variables
3.1. Definitions
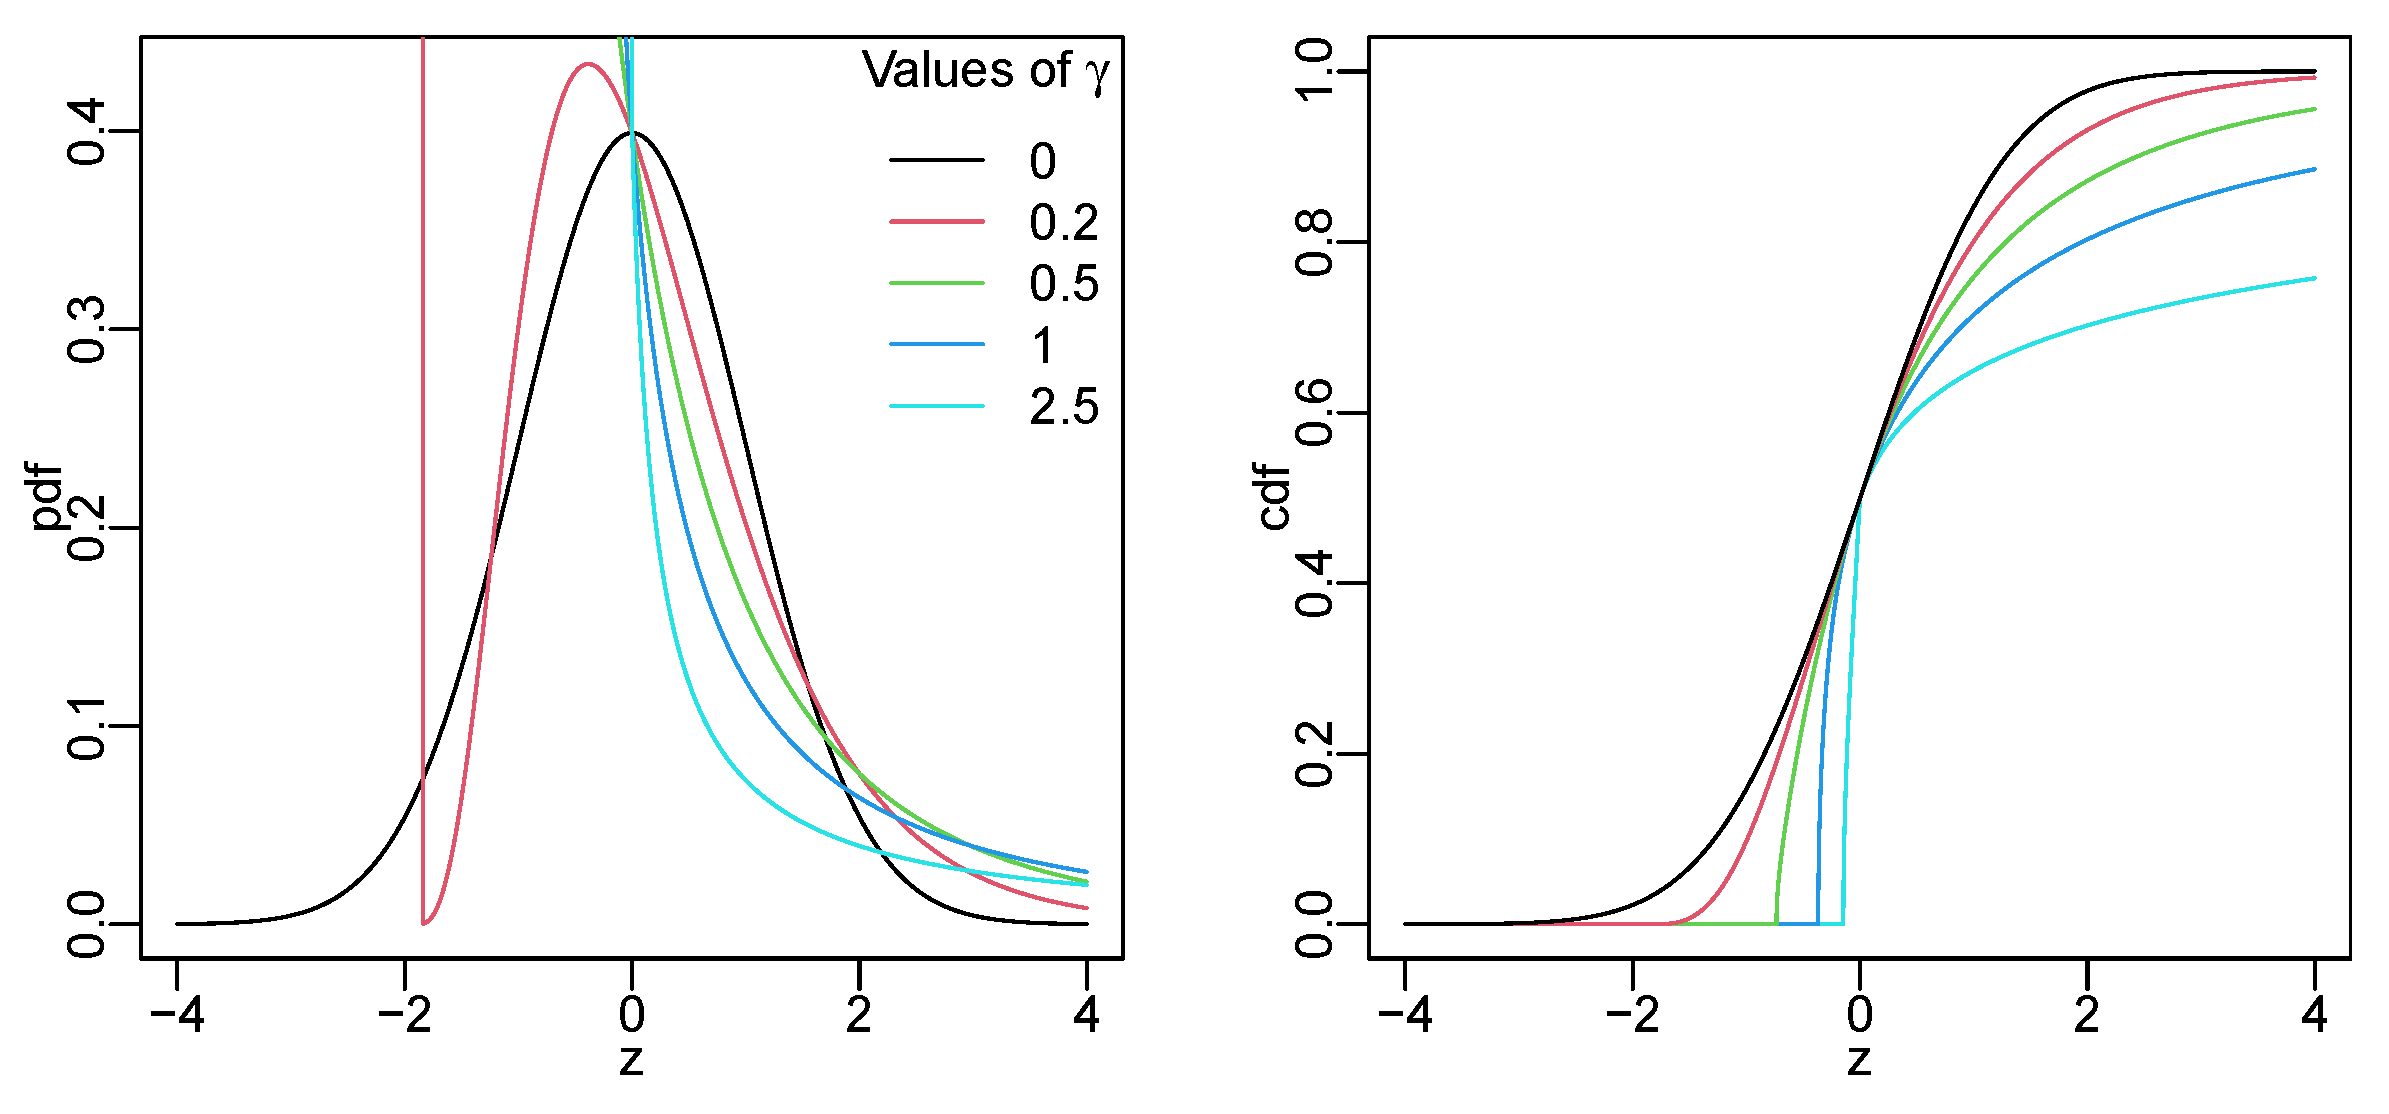
3.2. Lambert W Normal Distribution
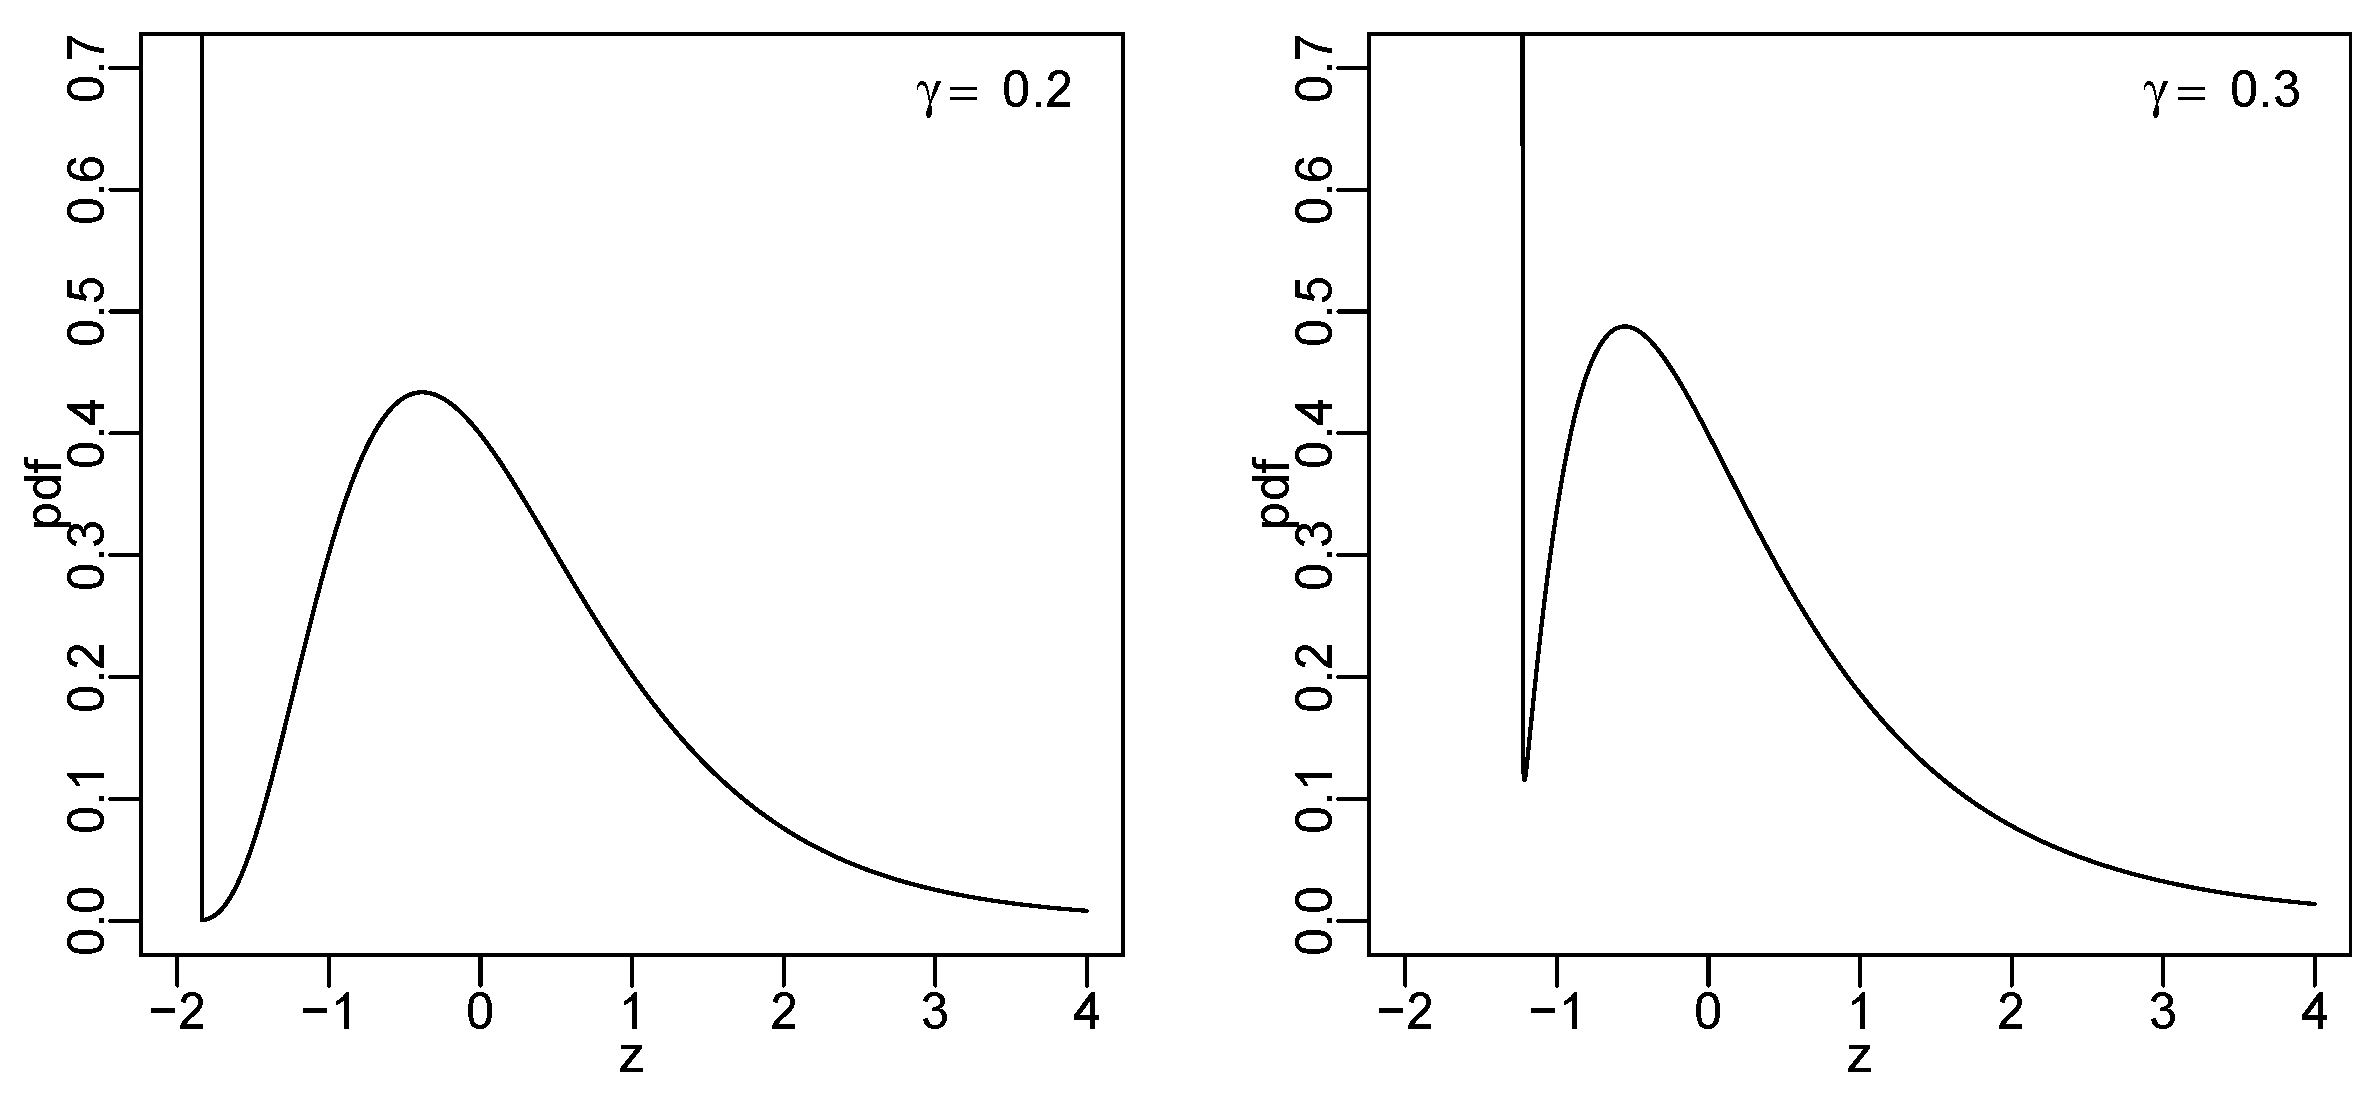
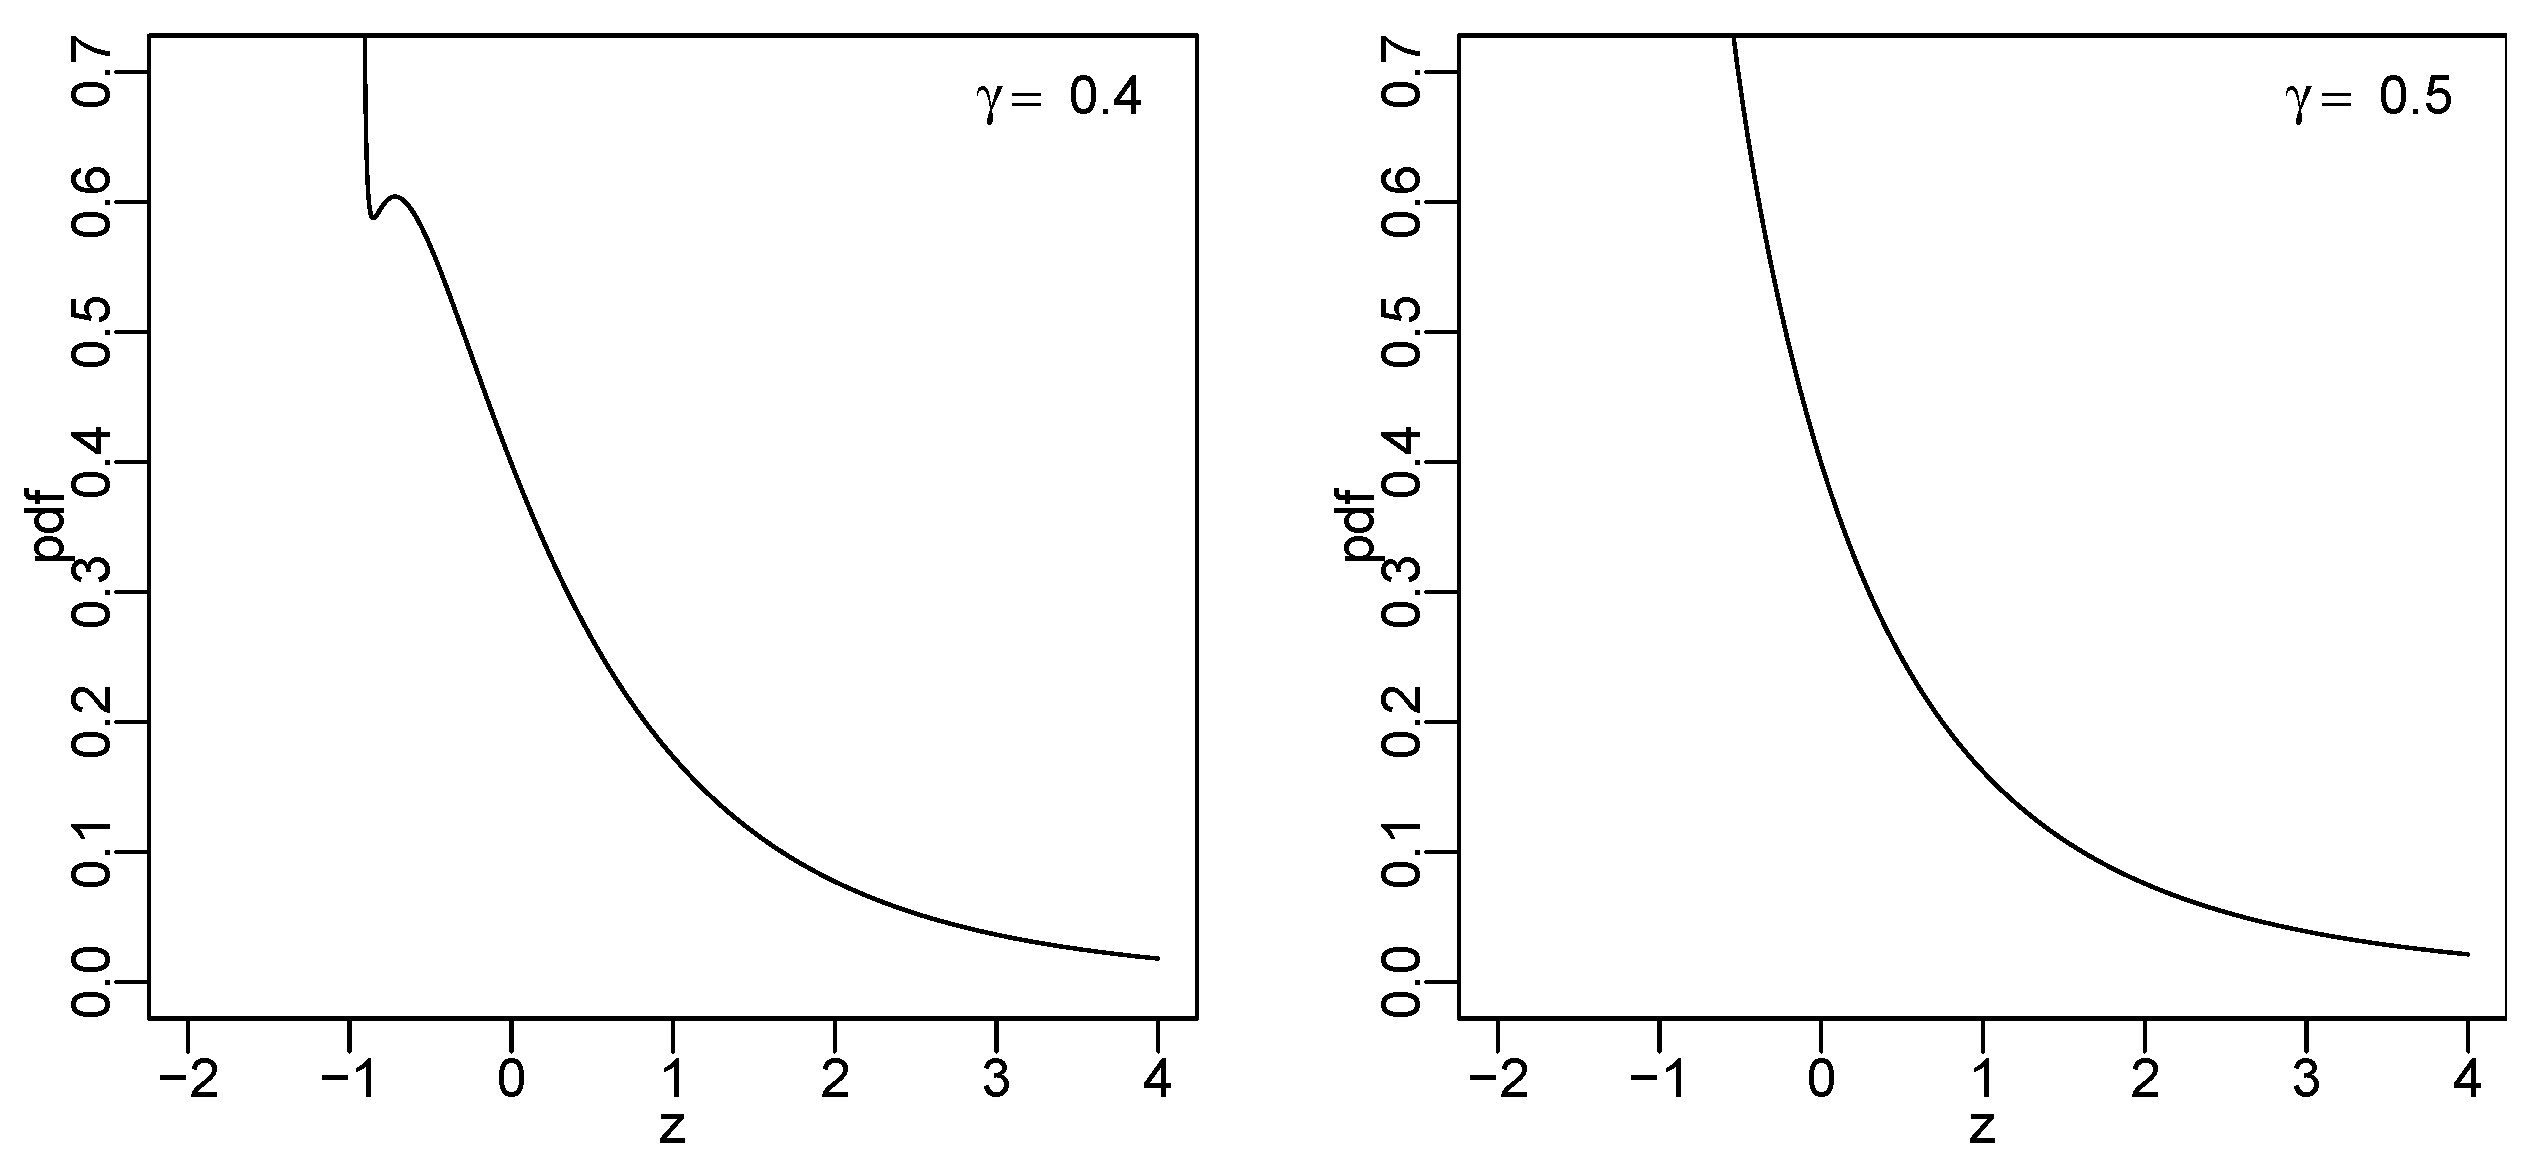
- (a)
- has two local extrema (maximum and minimum) if ; and
- (b)
- is monotone decreasing if .
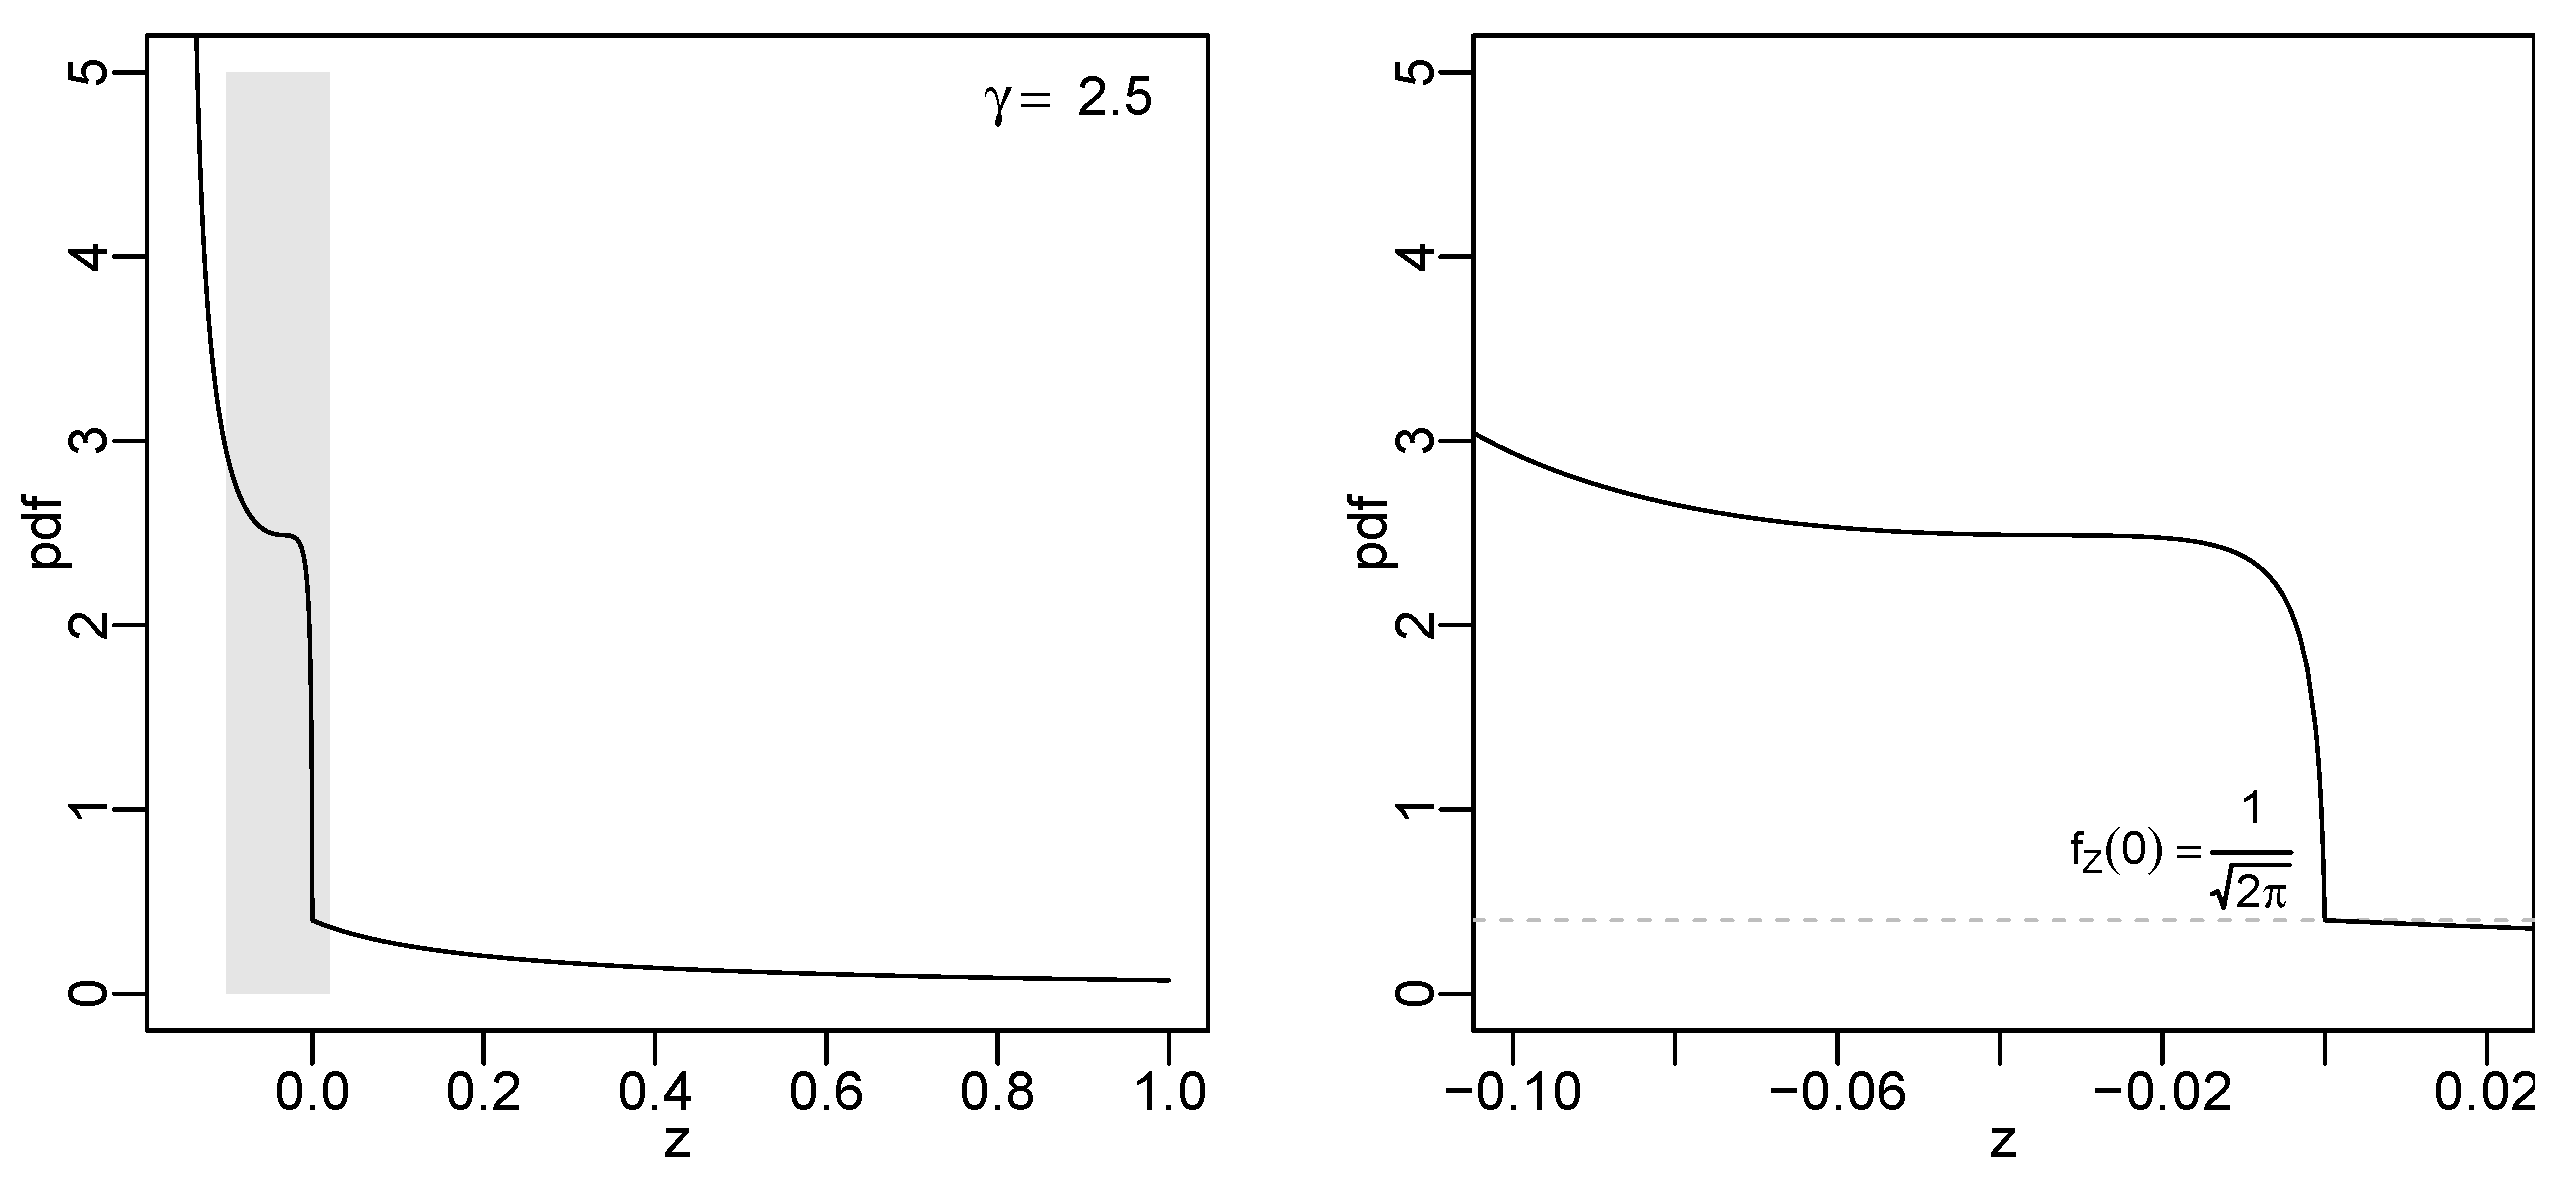
- (a)
- is monotone increasing (to 0) if ; and
- (b)
- has two local extrema (maximum and minimum) if .
3.3. Lambert W Exponential Distribution
4. Fitting Lambert W Random Variables to Insurance Data
5. Summary
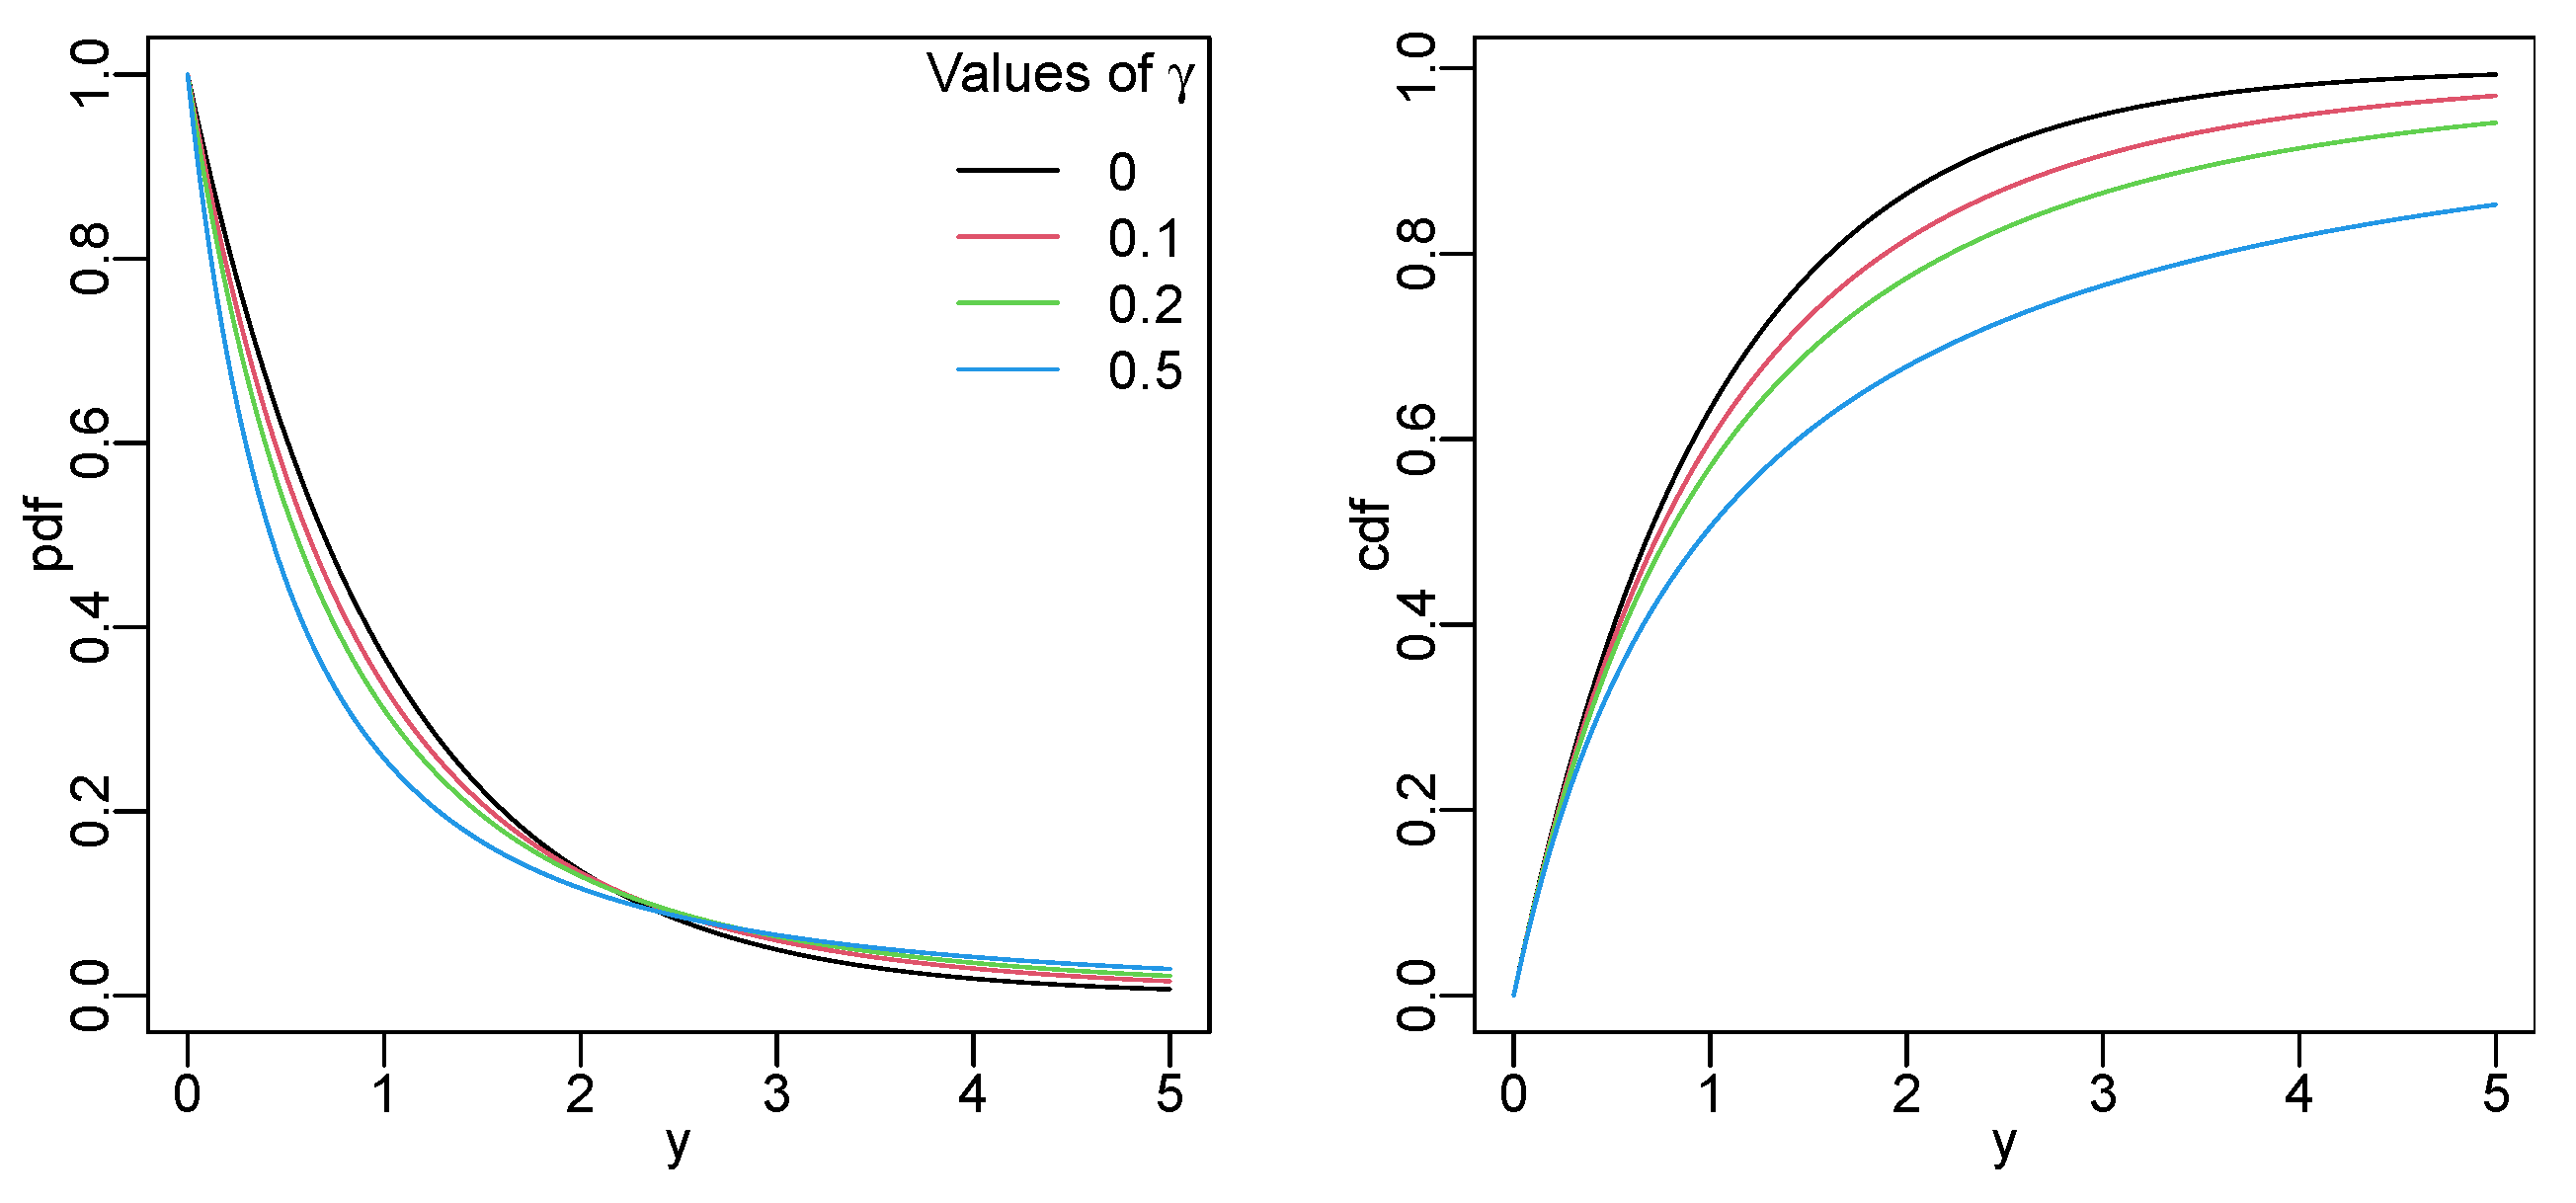
- (a)
- If , then the pdf has two local extrema;
- (b)
- If , then the pdf is monotone decreasing;
- (c)
- If , then the pdf has two local extrema.
Author Contributions
Funding
Data Availability Statement
Acknowledgments
Conflicts of Interest
Appendix A. Proofs of the Properties of Lambert W Standard Normal Random Variables
Appendix B. Details of Estimation
Appendix C. Data Histograms with the Three Best Fitting Models
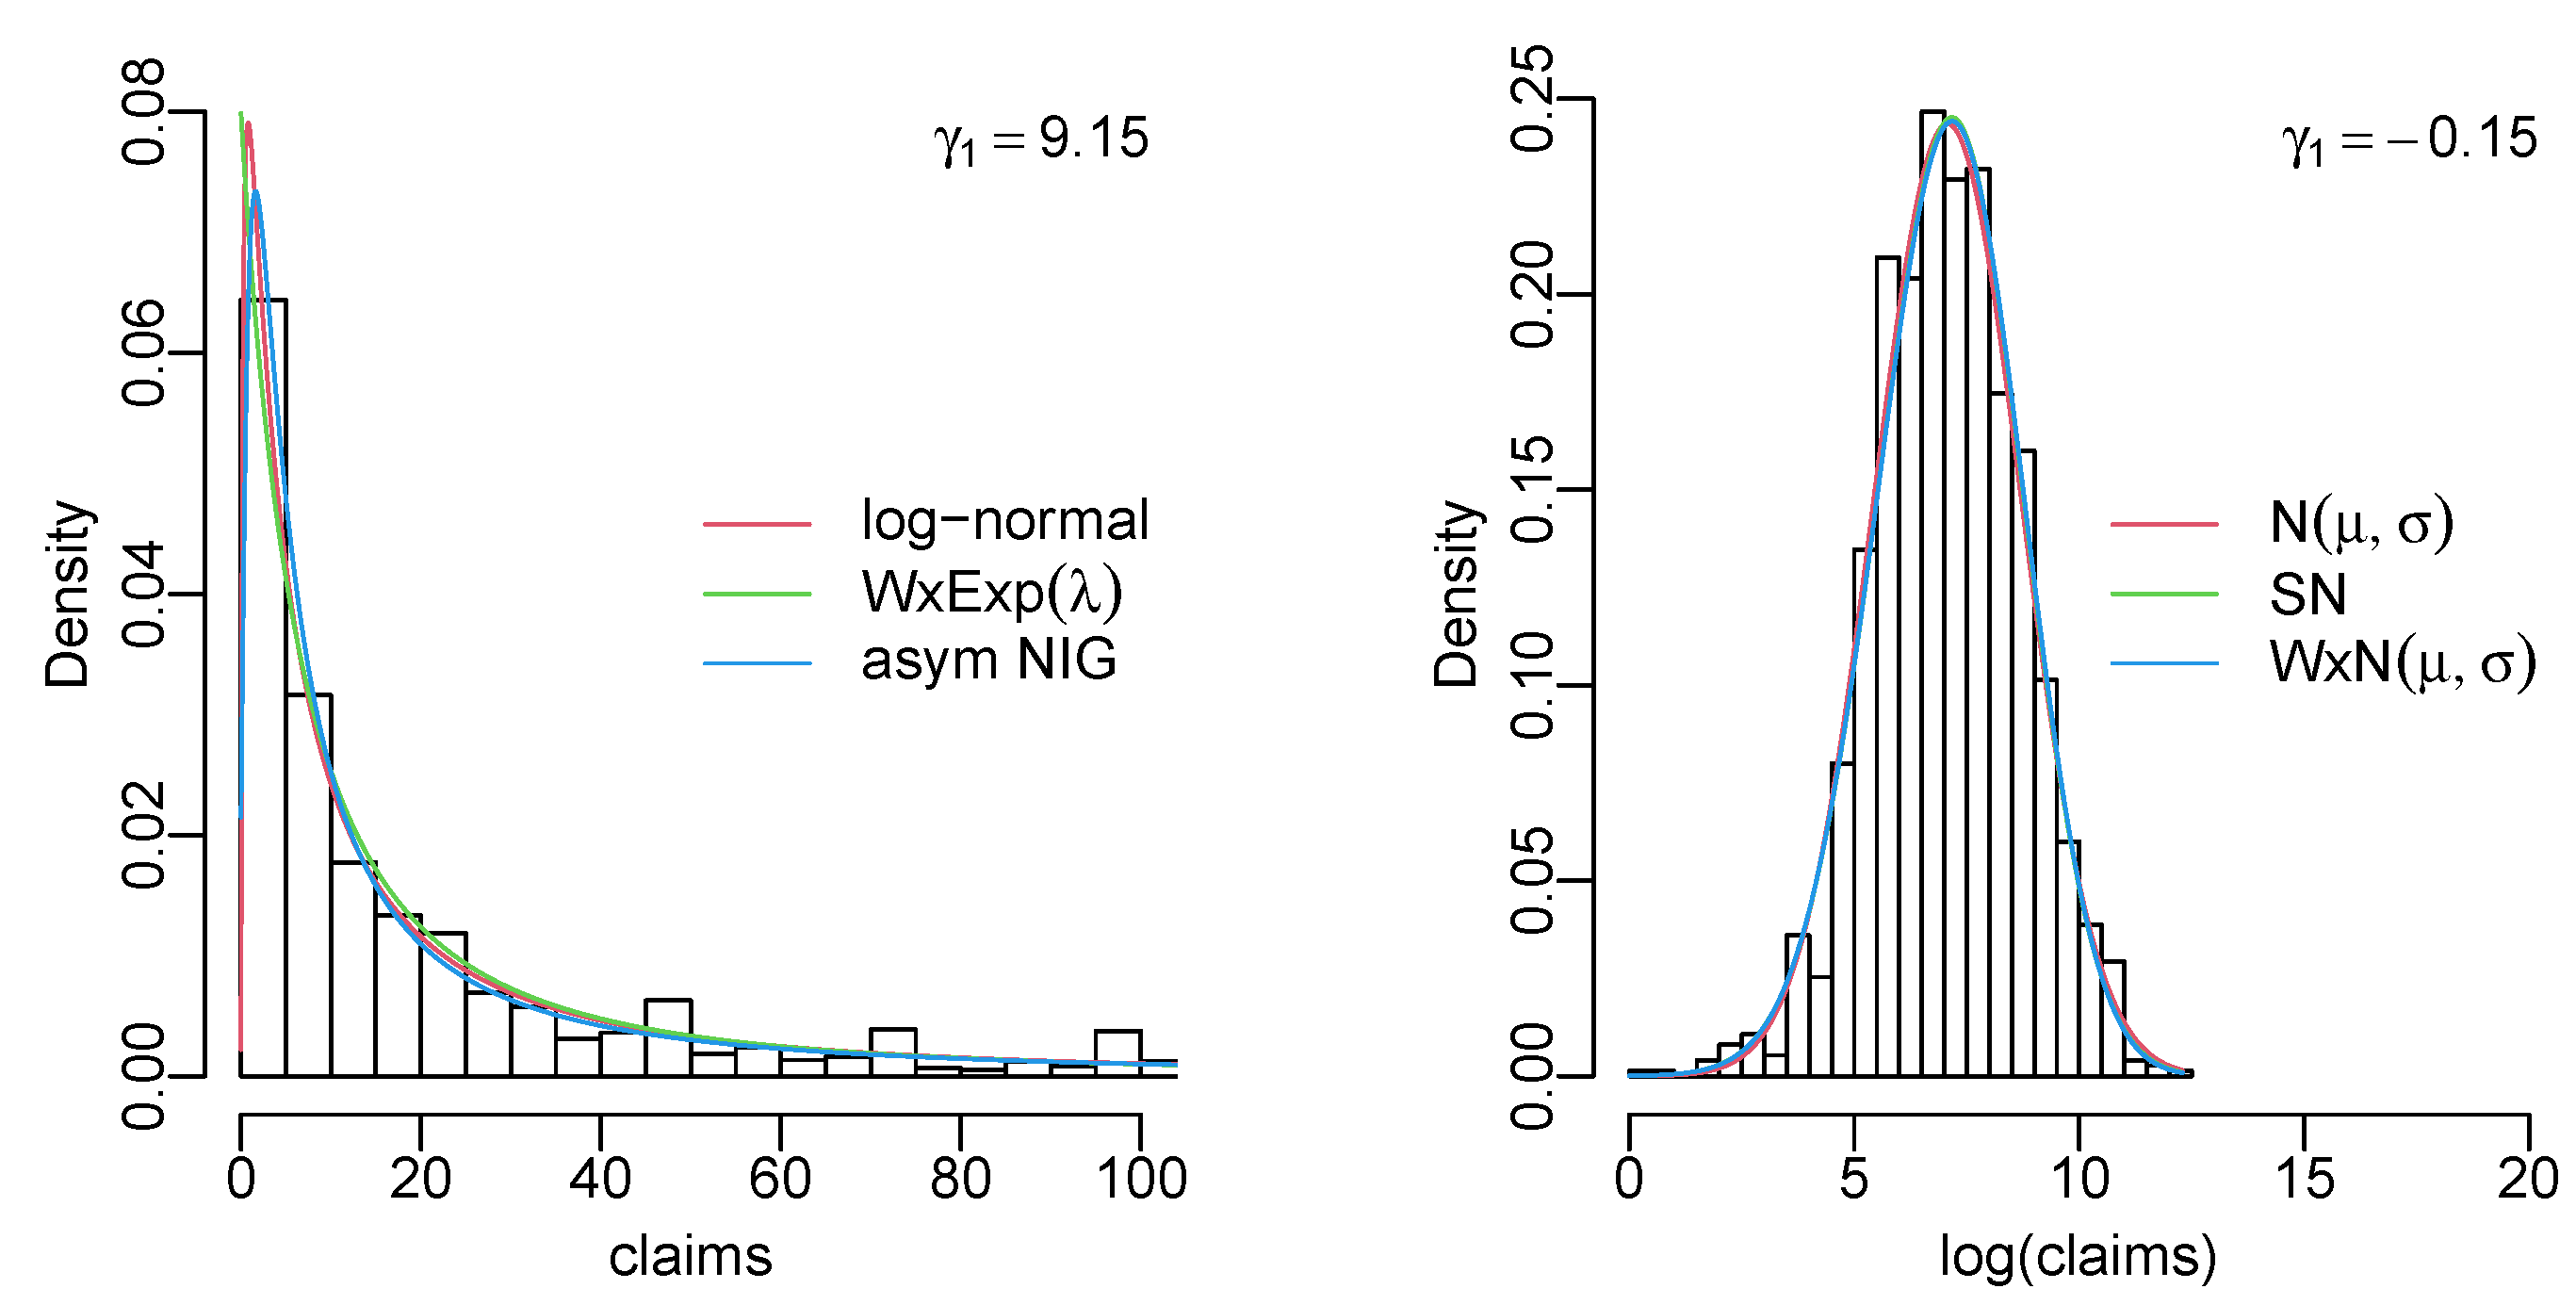
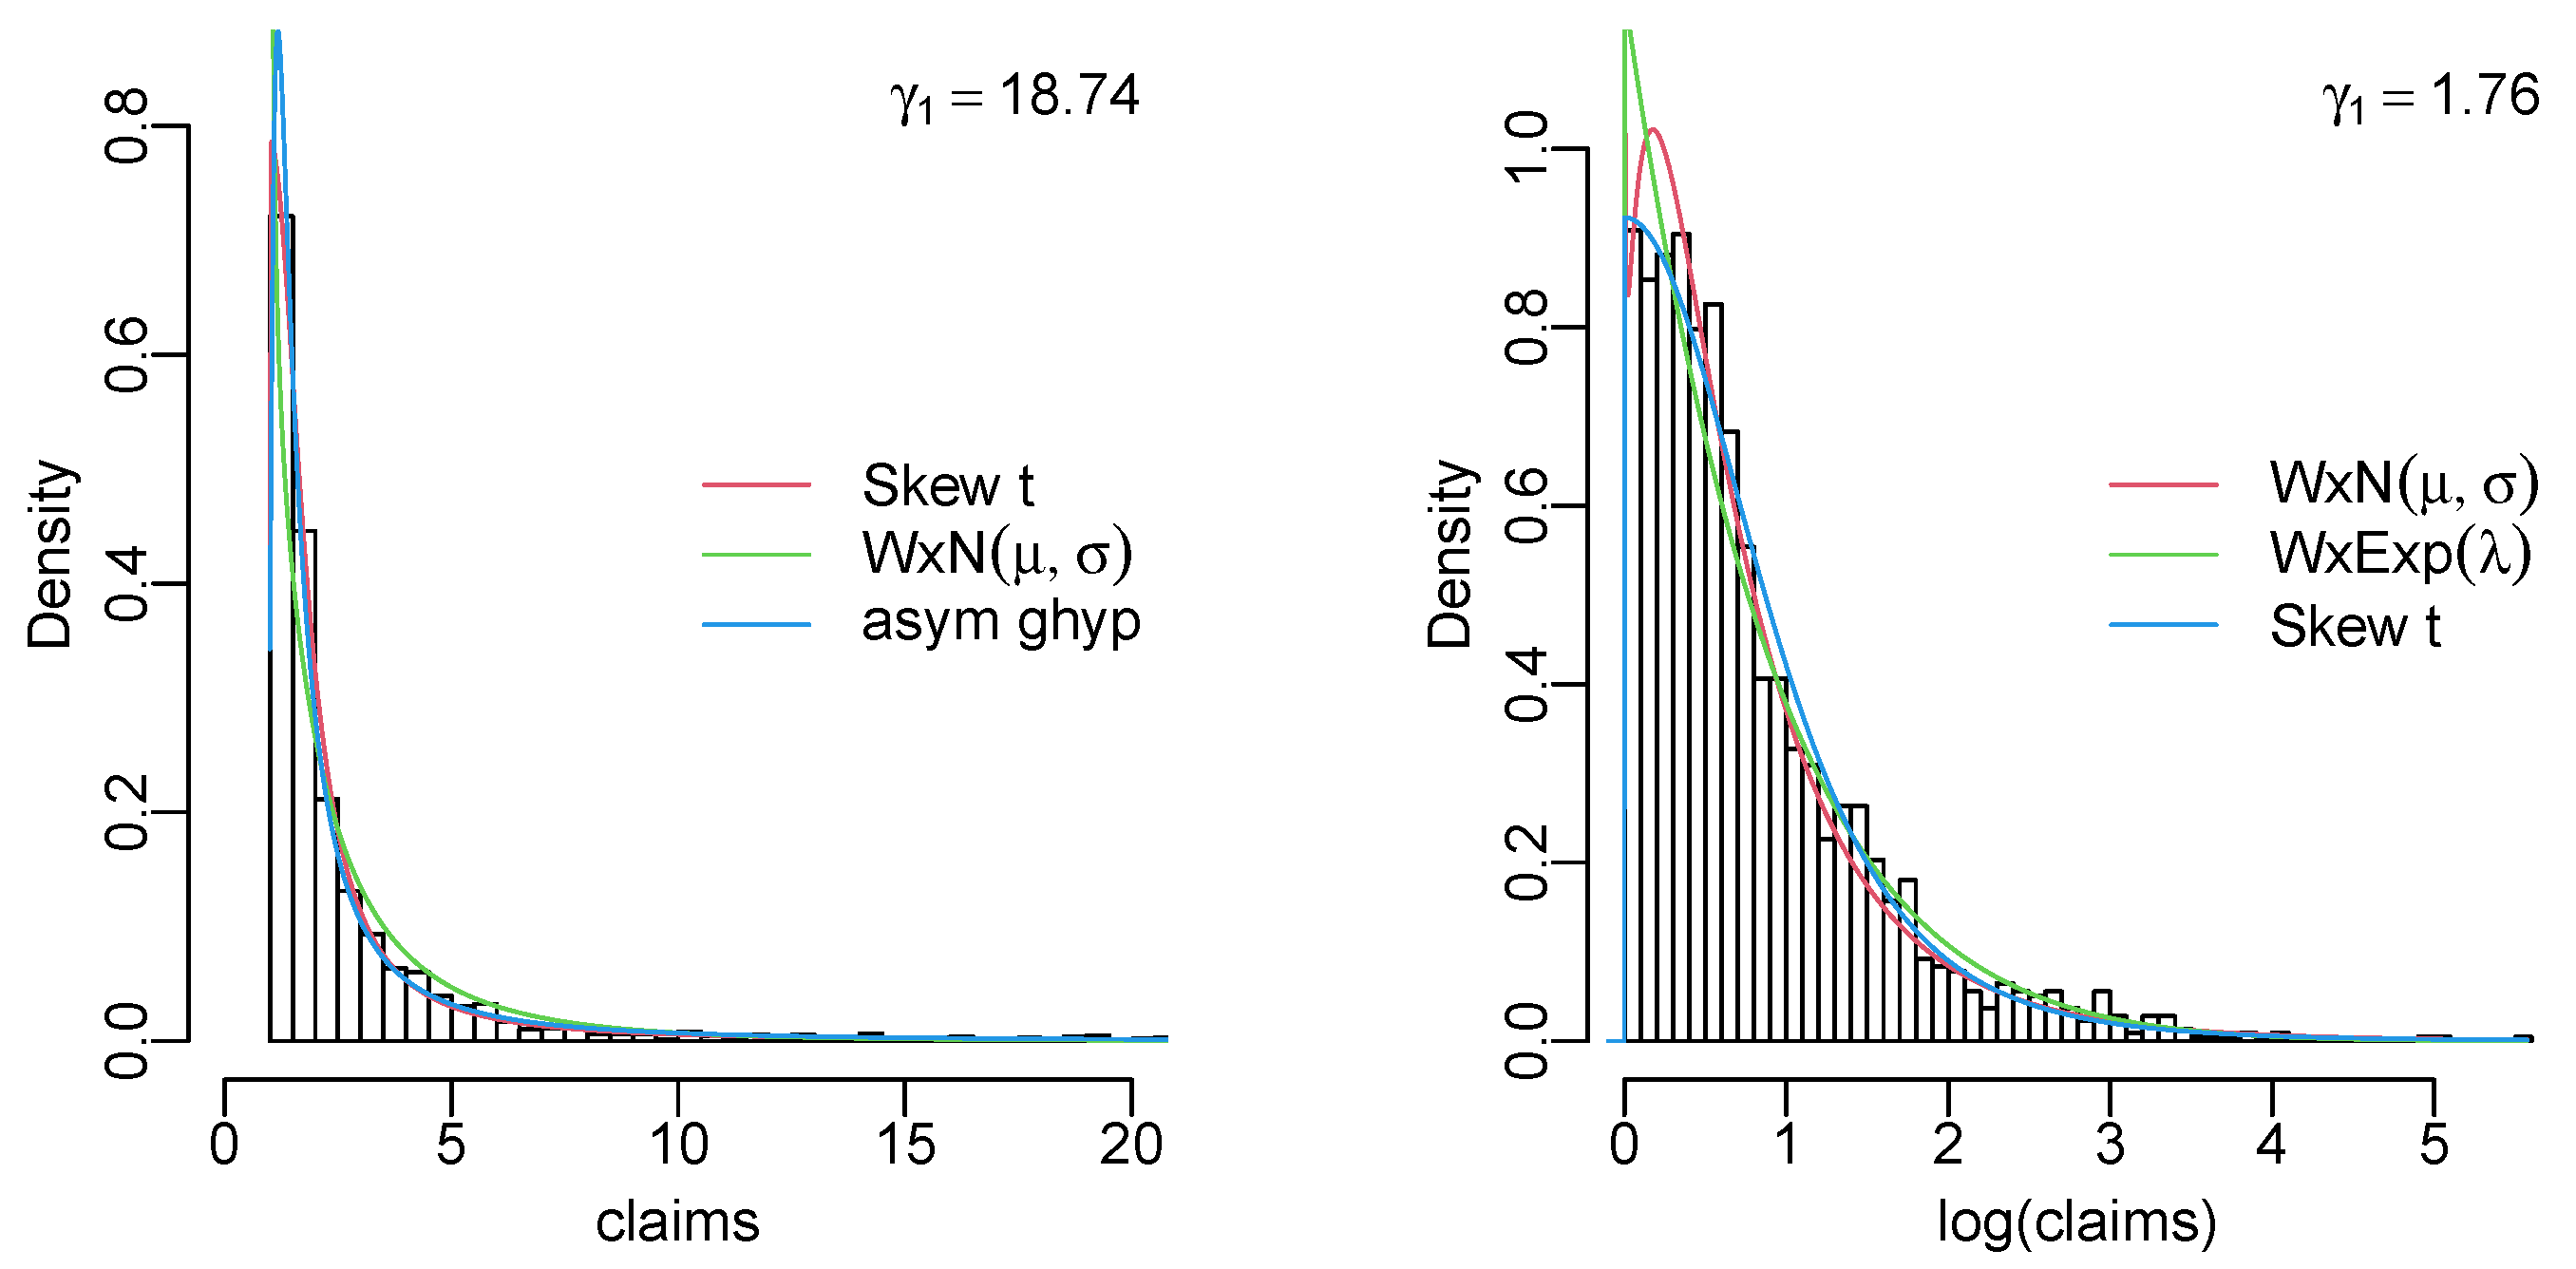
References
- Hogg, R.V.; Klugman, S.A. Loss Distributions; John Wiley & Sons: Hoboken, NJ, USA, 1984. [Google Scholar]
- Klugman, S.A.; Panjer, H.H.; Willmot, G.E. Loss Models: From Data to Decisions; John Wiley & Sons: Hoboken, NJ, USA, 2012; Volume 715. [Google Scholar]
- Azzalini, A. A class of distributions which includes the normal ones. Scand. J. Stat. 1985, 12, 171–178. [Google Scholar]
- Azzalini, A.; Capitanio, A. Distributions generated by perturbation of symmetry with emphasis on a multivariate skew t-distribution. J. R. Stat. Soc. Ser. B Stat. Methodol. 2003, 65, 367–389. [Google Scholar] [CrossRef]
- Genton, M.G. Skew-Elliptical Distributions and Their Applications: A Journey Beyond Normality; CRC Press: Boca Raton, FL, USA, 2004. [Google Scholar]
- Nadarajah, S.; Kotz, S. Skewed distributions generated by the normal kernel. Stat. Probab. Lett. 2003, 65, 269–277. [Google Scholar] [CrossRef]
- Adcock, C.; Eling, M.; Loperfido, N. Skewed distributions in finance and actuarial science: A review. Eur. J. Financ. 2015, 21, 1253–1281. [Google Scholar] [CrossRef]
- Goerg, G.M. Lambert W random variables—A new family of generalized skewed distributions with applications to risk estimation. Ann. Appl. Stat. 2011, 5, 2197–2230. [Google Scholar] [CrossRef]
- Witkovsk’y, V.; Wimmer, G.; Duby, T. Logarithmic Lambert W × F random variables for the family of chi-squared distributions and their applications. Stat. Probab. Lett. 2014, 96, 223–231. [Google Scholar] [CrossRef]
- Iriarte, Y.A.; de Castro, M.; Gómez, H.W. The Lambert-F Distributions Class: An Alternative Family for Positive Data Analysis. Mathematics 2020, 8, 1398. [Google Scholar] [CrossRef]
- Iriarte, Y.A.; de Castro, M.; Gómez, H.W. An Alternative One-Parameter Distribution for Bounded Data Modeling Generated from the Lambert Transformation. Symmetry 2021, 13, 1190. [Google Scholar] [CrossRef]
- Peterson, R.A. The R Journal: Finding Optimal Normalizing Transformations via bestNormalize. R J. 2021, 13, 294–313. [Google Scholar] [CrossRef]
- Klami, A.; Lagus, J.; Sakaya, J. Lambert Matrix Factorization. In Proceedings of the Machine Learning and Knowledge Discovery in Databases: European Conference, ECML PKDD 2018, Dublin, Ireland, 10–14 September 2018; Proceedings, Part II 18. Springer: Berlin/Heidelberg, Germany, 2019; pp. 311–326. [Google Scholar]
- Stehlík, M. Distributions of exact tests in the exponential family. Metrika 2003, 57, 145–164. [Google Scholar] [CrossRef]
- Stehlík, M. Exact likelihood ratio scale and homogeneity testing of some loss processes. Stat. Probab. Lett. 2006, 76, 19–26. [Google Scholar] [CrossRef]
- Stehlík, M.; Economou, P.; Kisel’ák, J.; Richter, W.D. Kullback–Leibler life time testing. Appl. Math. Comput. 2014, 240, 122–139. [Google Scholar] [CrossRef]
- Goerg, G.M. The Lambert way to Gaussianize heavy-tailed data with the inverse of Tukey’s h transformation as a special case. Sci. World J. 2015, 2015, 909231. [Google Scholar] [CrossRef] [PubMed]
- Goerg, G.M. LambertW: Probabilistic Models to Analyze and Gaussianize Heavy-Tailed, Skewed Data; R Package Version 0.6.7-1; R Foundation for Statistical Computing: Vienna, Austria, 2022. [Google Scholar]
- Brito, P.; Fabião, F.; Staubyn, A. Euler, Lambert, and the Lambert W-function today. Math. Sci. 2008, 33, 127–133. [Google Scholar]
- Dence, T. A Brief Look into the Lambert W Function. Appl. Math. 2013, 4, 887–892. [Google Scholar] [CrossRef]
- Corless, R.; Gonnet, G.; Hare, D.; Jeffrey, D.; Knuth, D. On the Lambert W Function. Adv. Comput. Math. 1996, 5, 329–359. [Google Scholar] [CrossRef]
- Casella, G.; Berger, R.L. Statistical Inference; Duxbury Press: Pacific Grove, CA, USA, 2002. [Google Scholar]
- Frees, E.W.; Valdez, E.A. Understanding relationships using copulas. N. Am. Actuar. J. 1998, 2, 1–25. [Google Scholar] [CrossRef]
- McNeil, A.J. Estimating the tails of loss severity distributions using extreme value theory. ASTIN Bull. J. IAA 1997, 27, 117–137. [Google Scholar] [CrossRef]
- Klugman, S.A.; Parsa, R. Fitting bivariate loss distributions with copulas. Insur. Math. Econ. 1999, 24, 139–148. [Google Scholar] [CrossRef]
- Dupuis, D.J.; Jones, B.L. Multivariate Extreme Value Theory And Its Usefulness In Understanding Risk. N. Am. Actuar. J. 2006, 10, 1–27. [Google Scholar] [CrossRef][Green Version]
- Resnick, S.I. Discussion of the Danish Data on Large Fire Insurance Losses. Astin Bull. 1997, 27, 139–151. [Google Scholar] [CrossRef]
- Cooray, K.; Ananda, M.M.A. Modeling actuarial data with a composite lognormal-Pareto model. Scand. Actuar. J. 2005, 2005, 321–334. [Google Scholar] [CrossRef]
- Dell’Aquila, R.; Embrechts, P. Extremes and Robustness: A Contradiction? Financ. Mark. Portf. Manag. 2006, 20, 103–118. [Google Scholar] [CrossRef][Green Version]
- Eling, M. Fitting insurance claims to skewed distributions: Are the skew-normal and skew-student good models? Insur. Math. Econ. 2012, 51, 239–248. [Google Scholar] [CrossRef]
- Wuertz, D.; Setz, T.; Chalabi, Y. fExtremes: Rmetrics—Modelling Extreme Events in Finance; R Package Version 4021.83.; R Foundation for Statistical Computing: Vienna, Austria, 2022. [Google Scholar]
- Hofert, M.; Kojadinovic, I.; Maechler, M.; Yan, J. Copula: Multivariate Dependence with Copulas; R Package Version 1.1-2; R Foundation for Statistical Computing: Vienna, Austria, 2023. [Google Scholar]
- R Core Team. R: A Language and Environment for Statistical Computing; R Foundation for Statistical Computing: Vienna, Austria, 2022. [Google Scholar]
- Weibel, M.; Luethi, D.; Breymann, W. ghyp: Generalized Hyperbolic Distribution and Its Special Cases; R Package Version 1.6.3; R Foundation for Statistical Computing: Vienna, Austria, 2022. [Google Scholar]
- Azzalini, A. The R Package sn: The Skew-Normal and Related Distributions Such as the Skew-t and the SUN (Version 2.1.0); Università degli Studi di Padova: Padua, Italia, 2022. [Google Scholar]
- Delignette-Muller, M.L.; Dutang, C. fitdistrplus: An R Package for Fitting Distributions. J. Stat. Softw. 2015, 64, 1–34. [Google Scholar] [CrossRef]


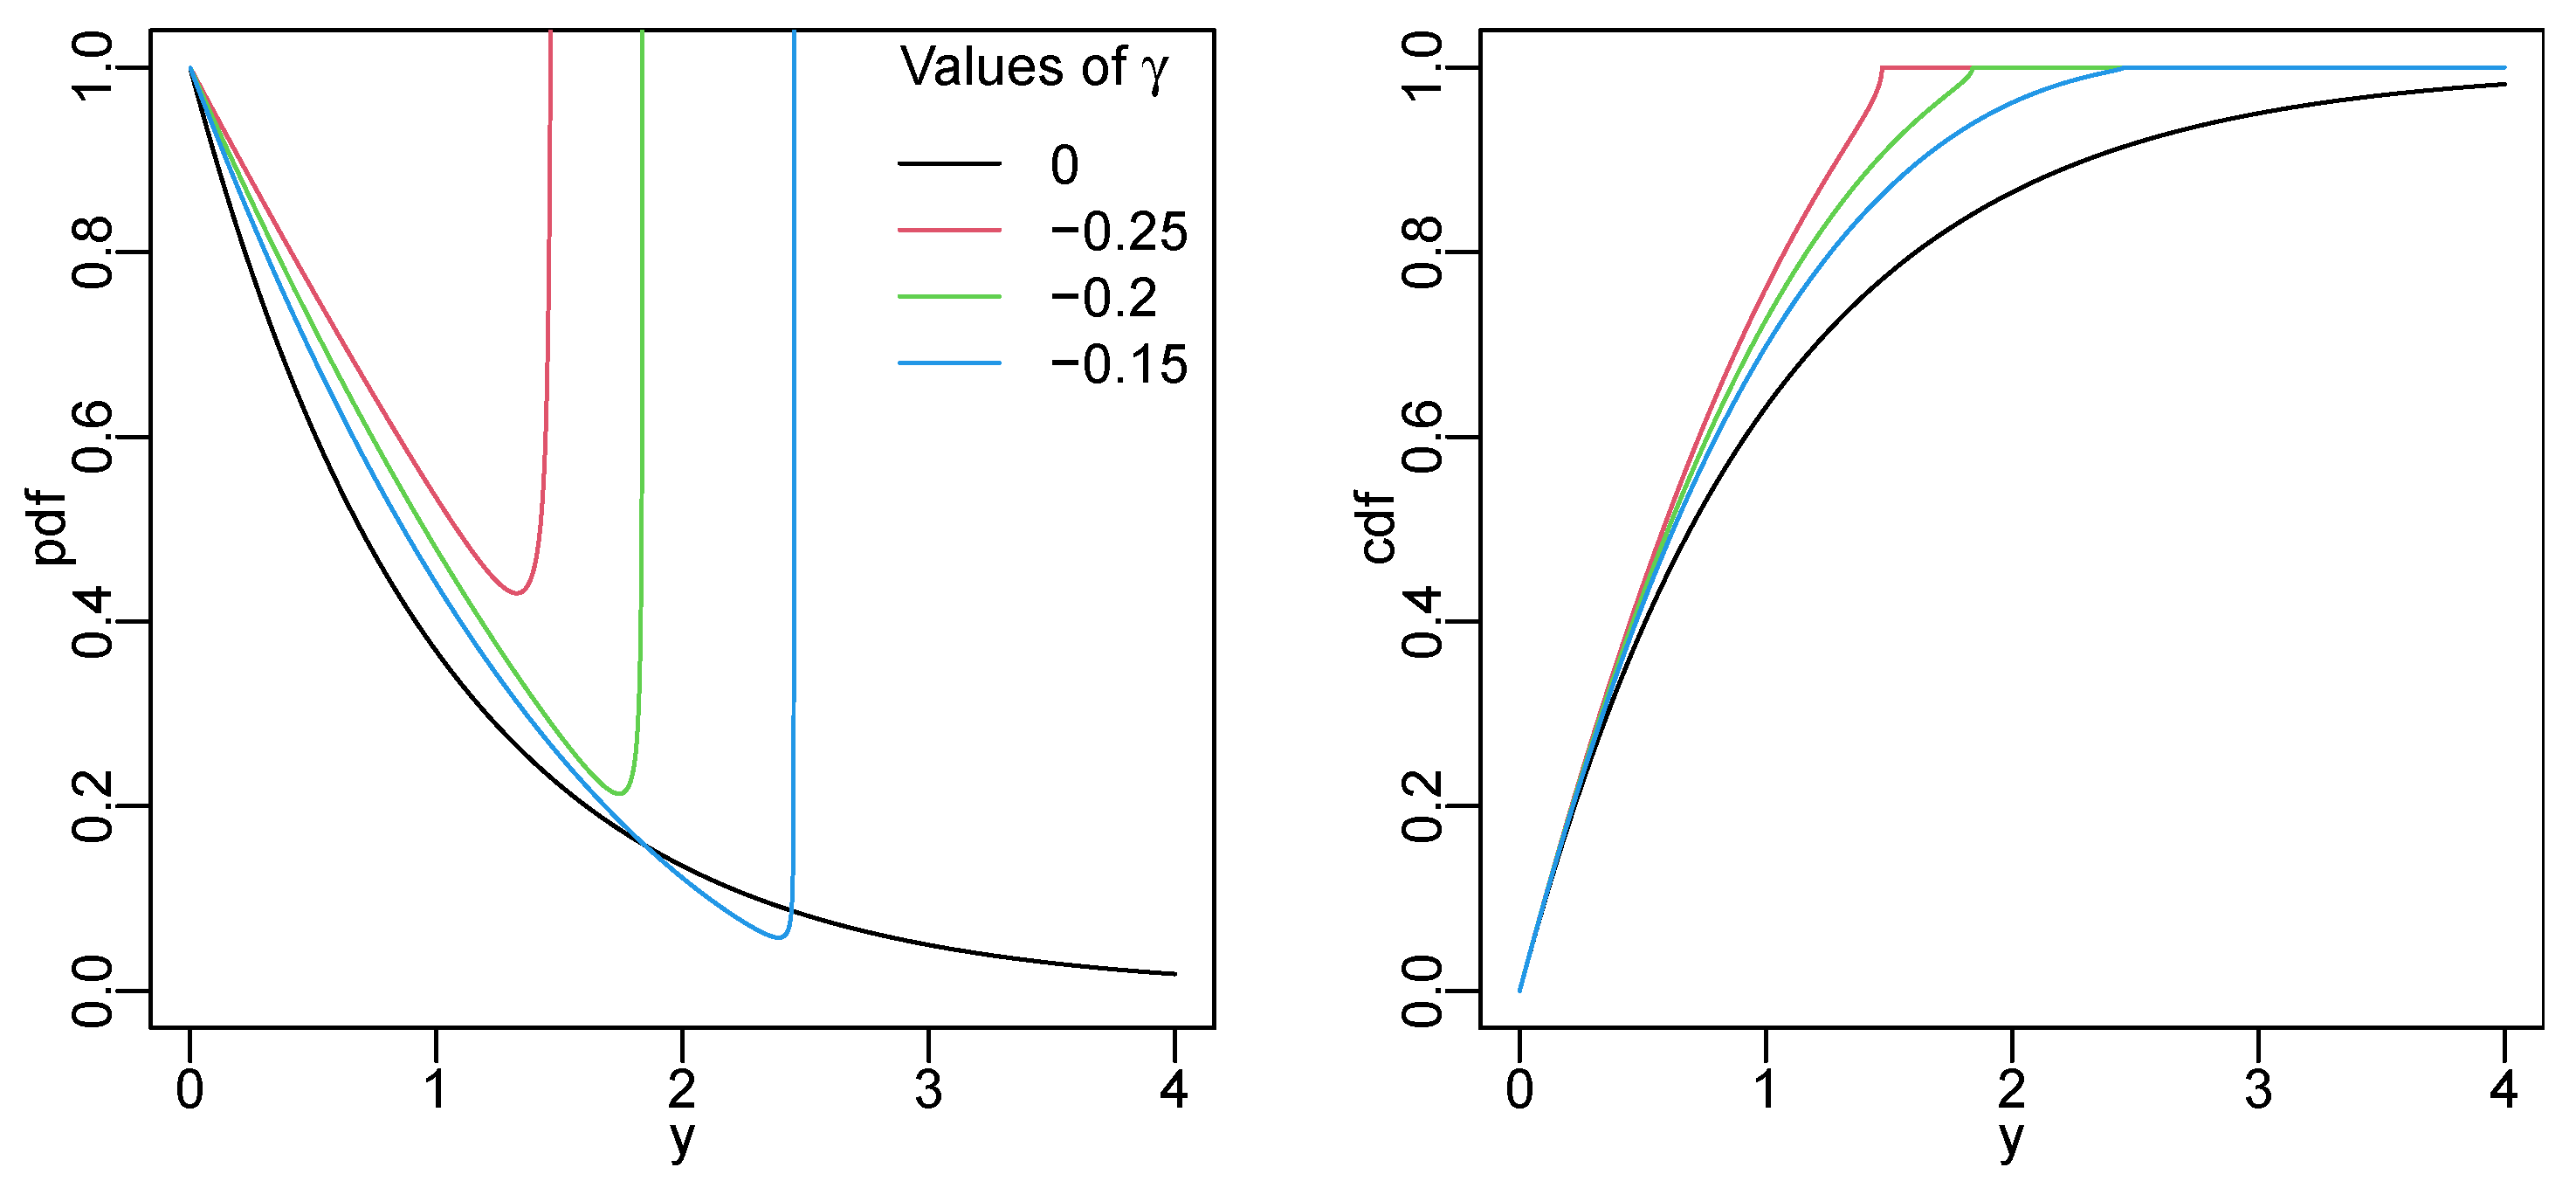
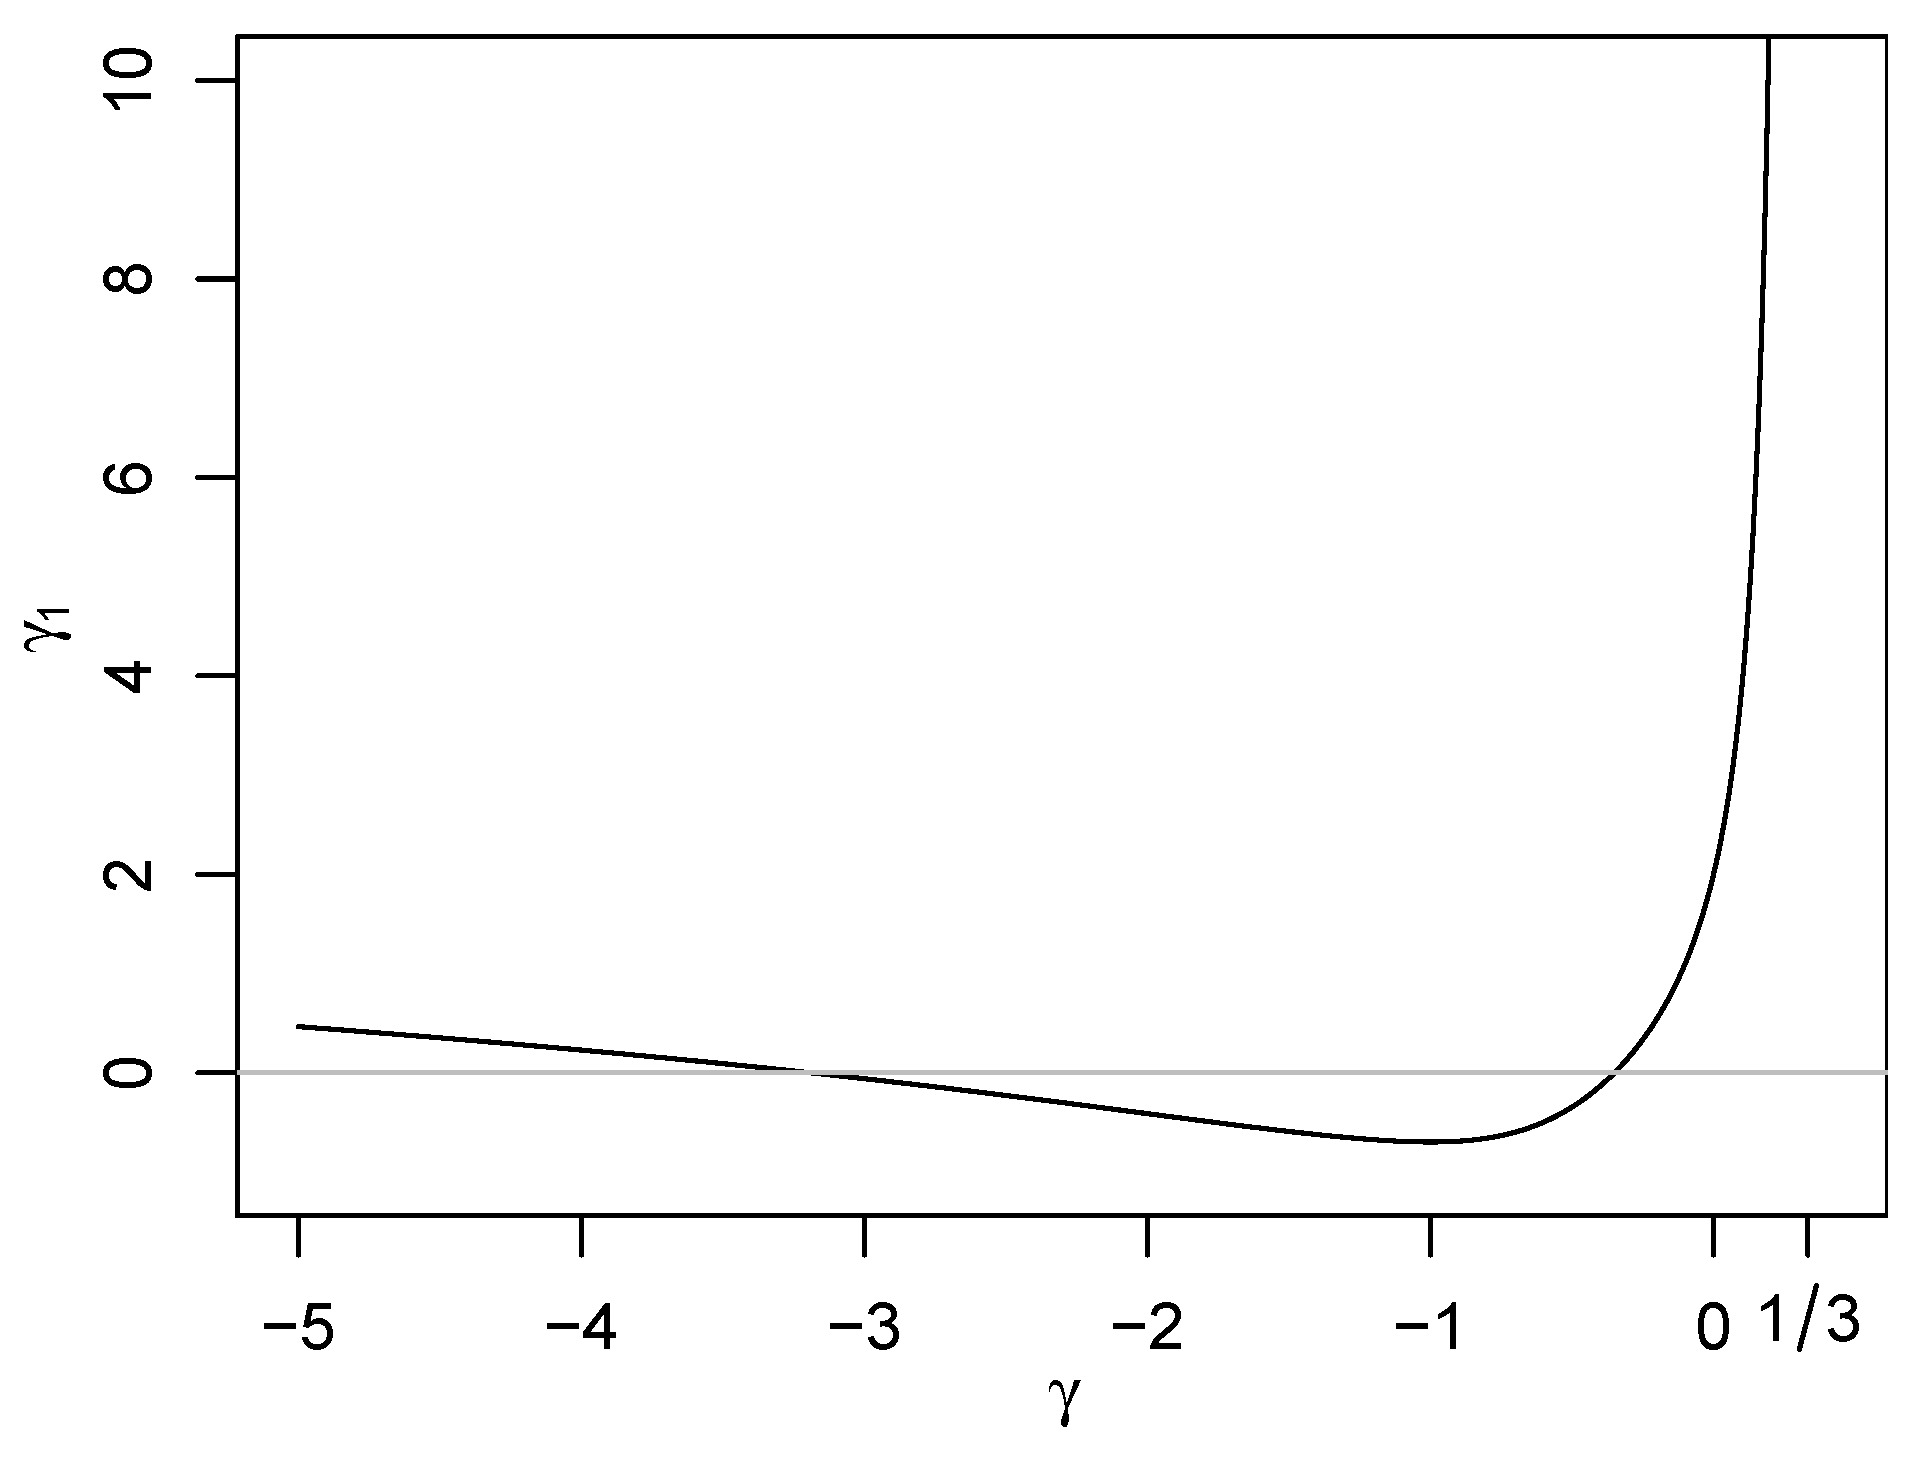
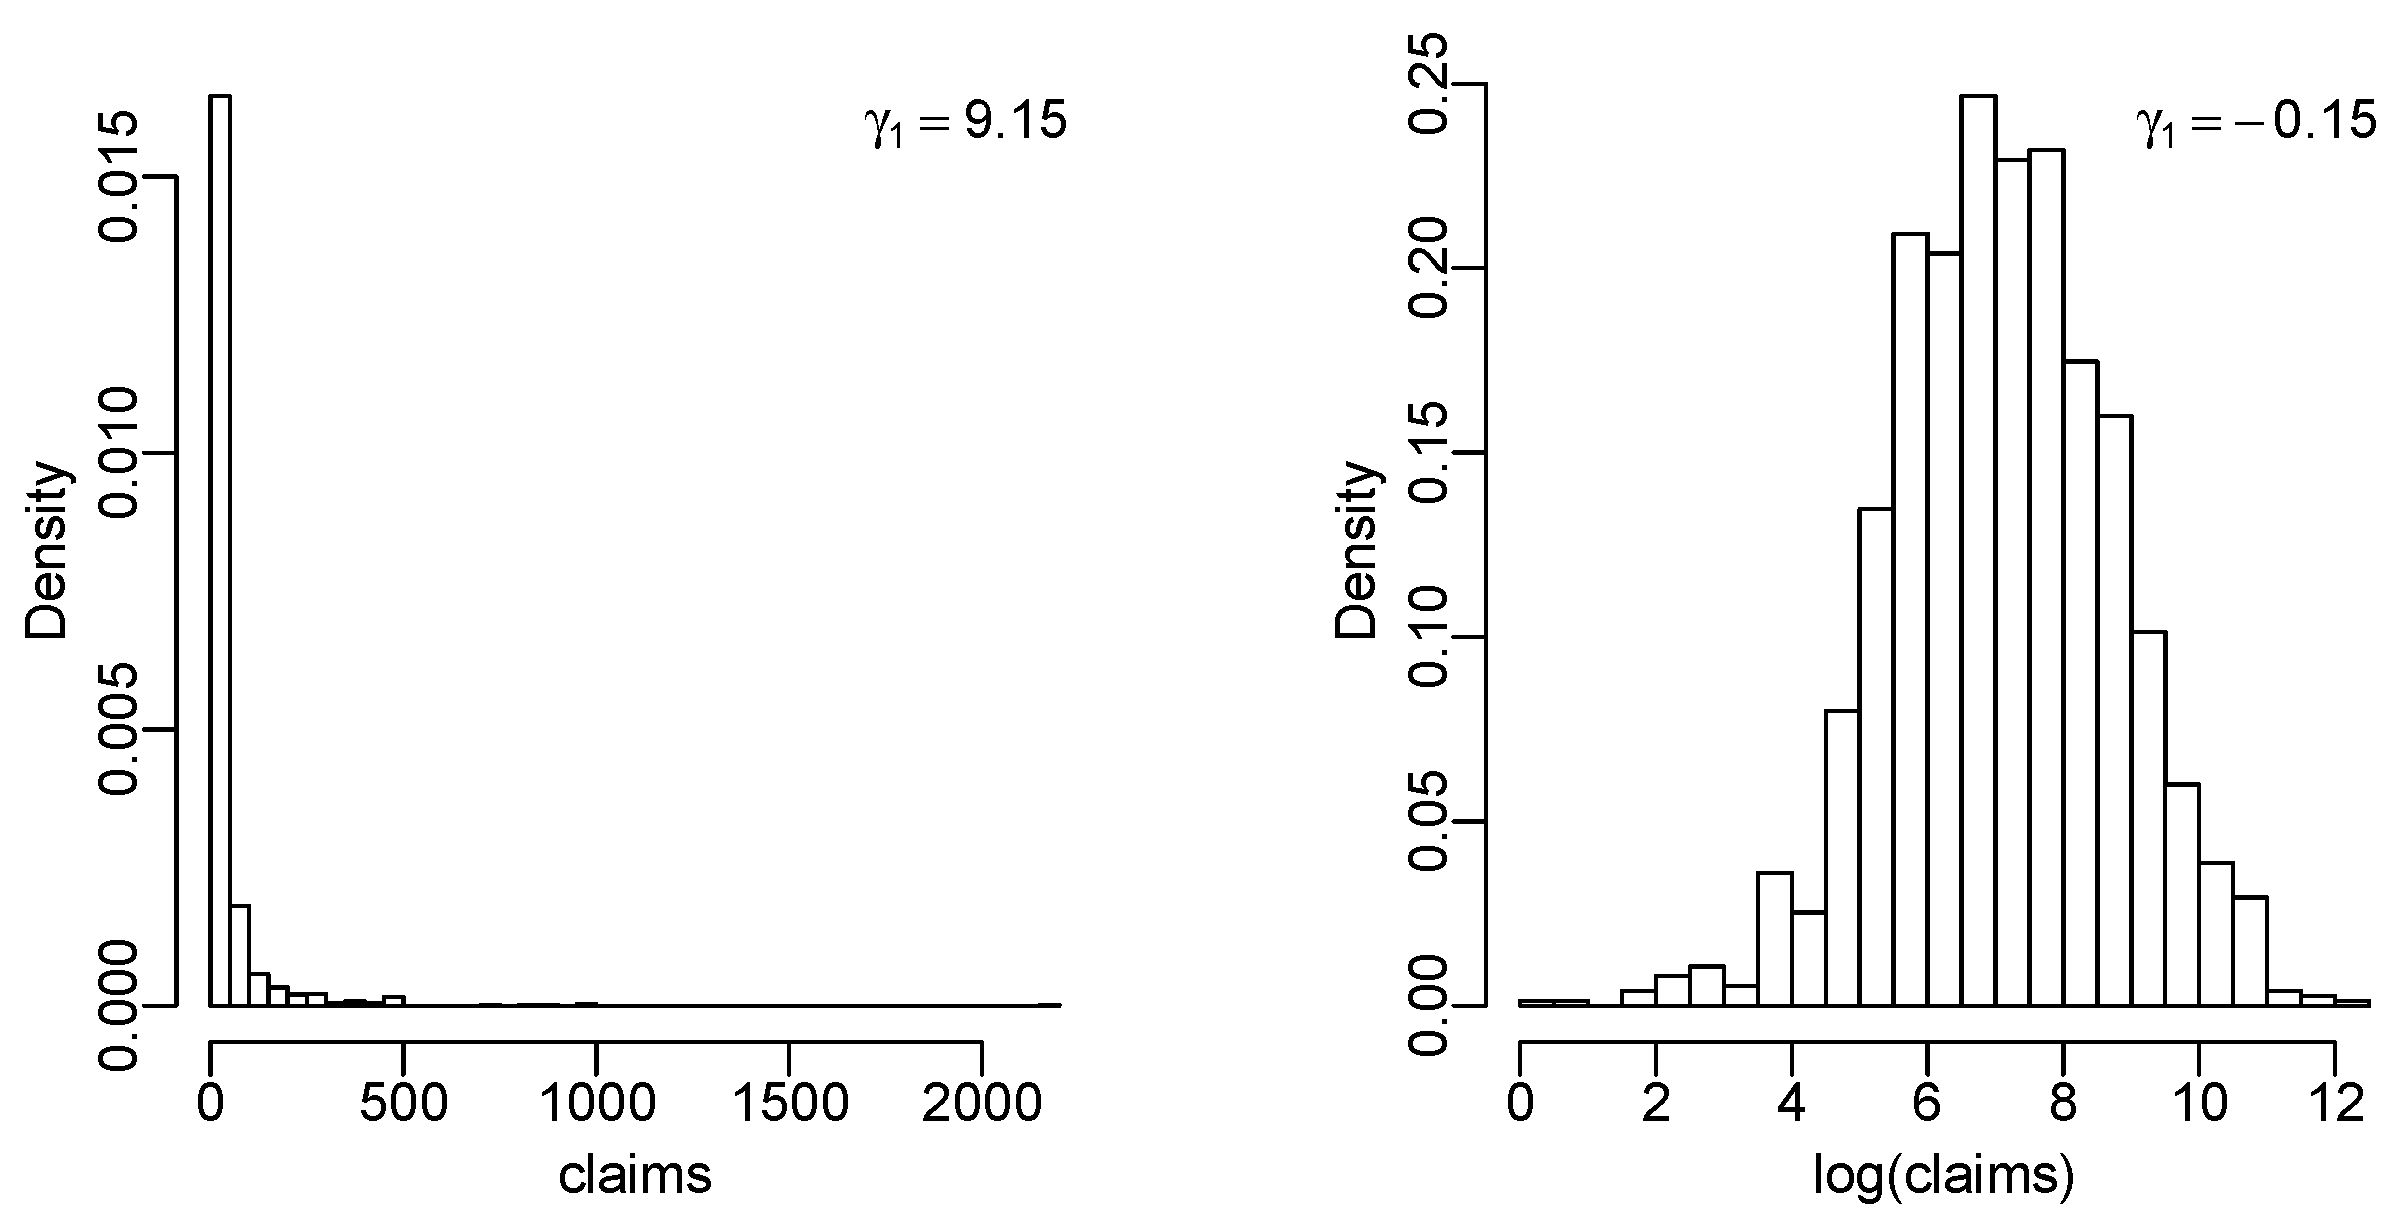
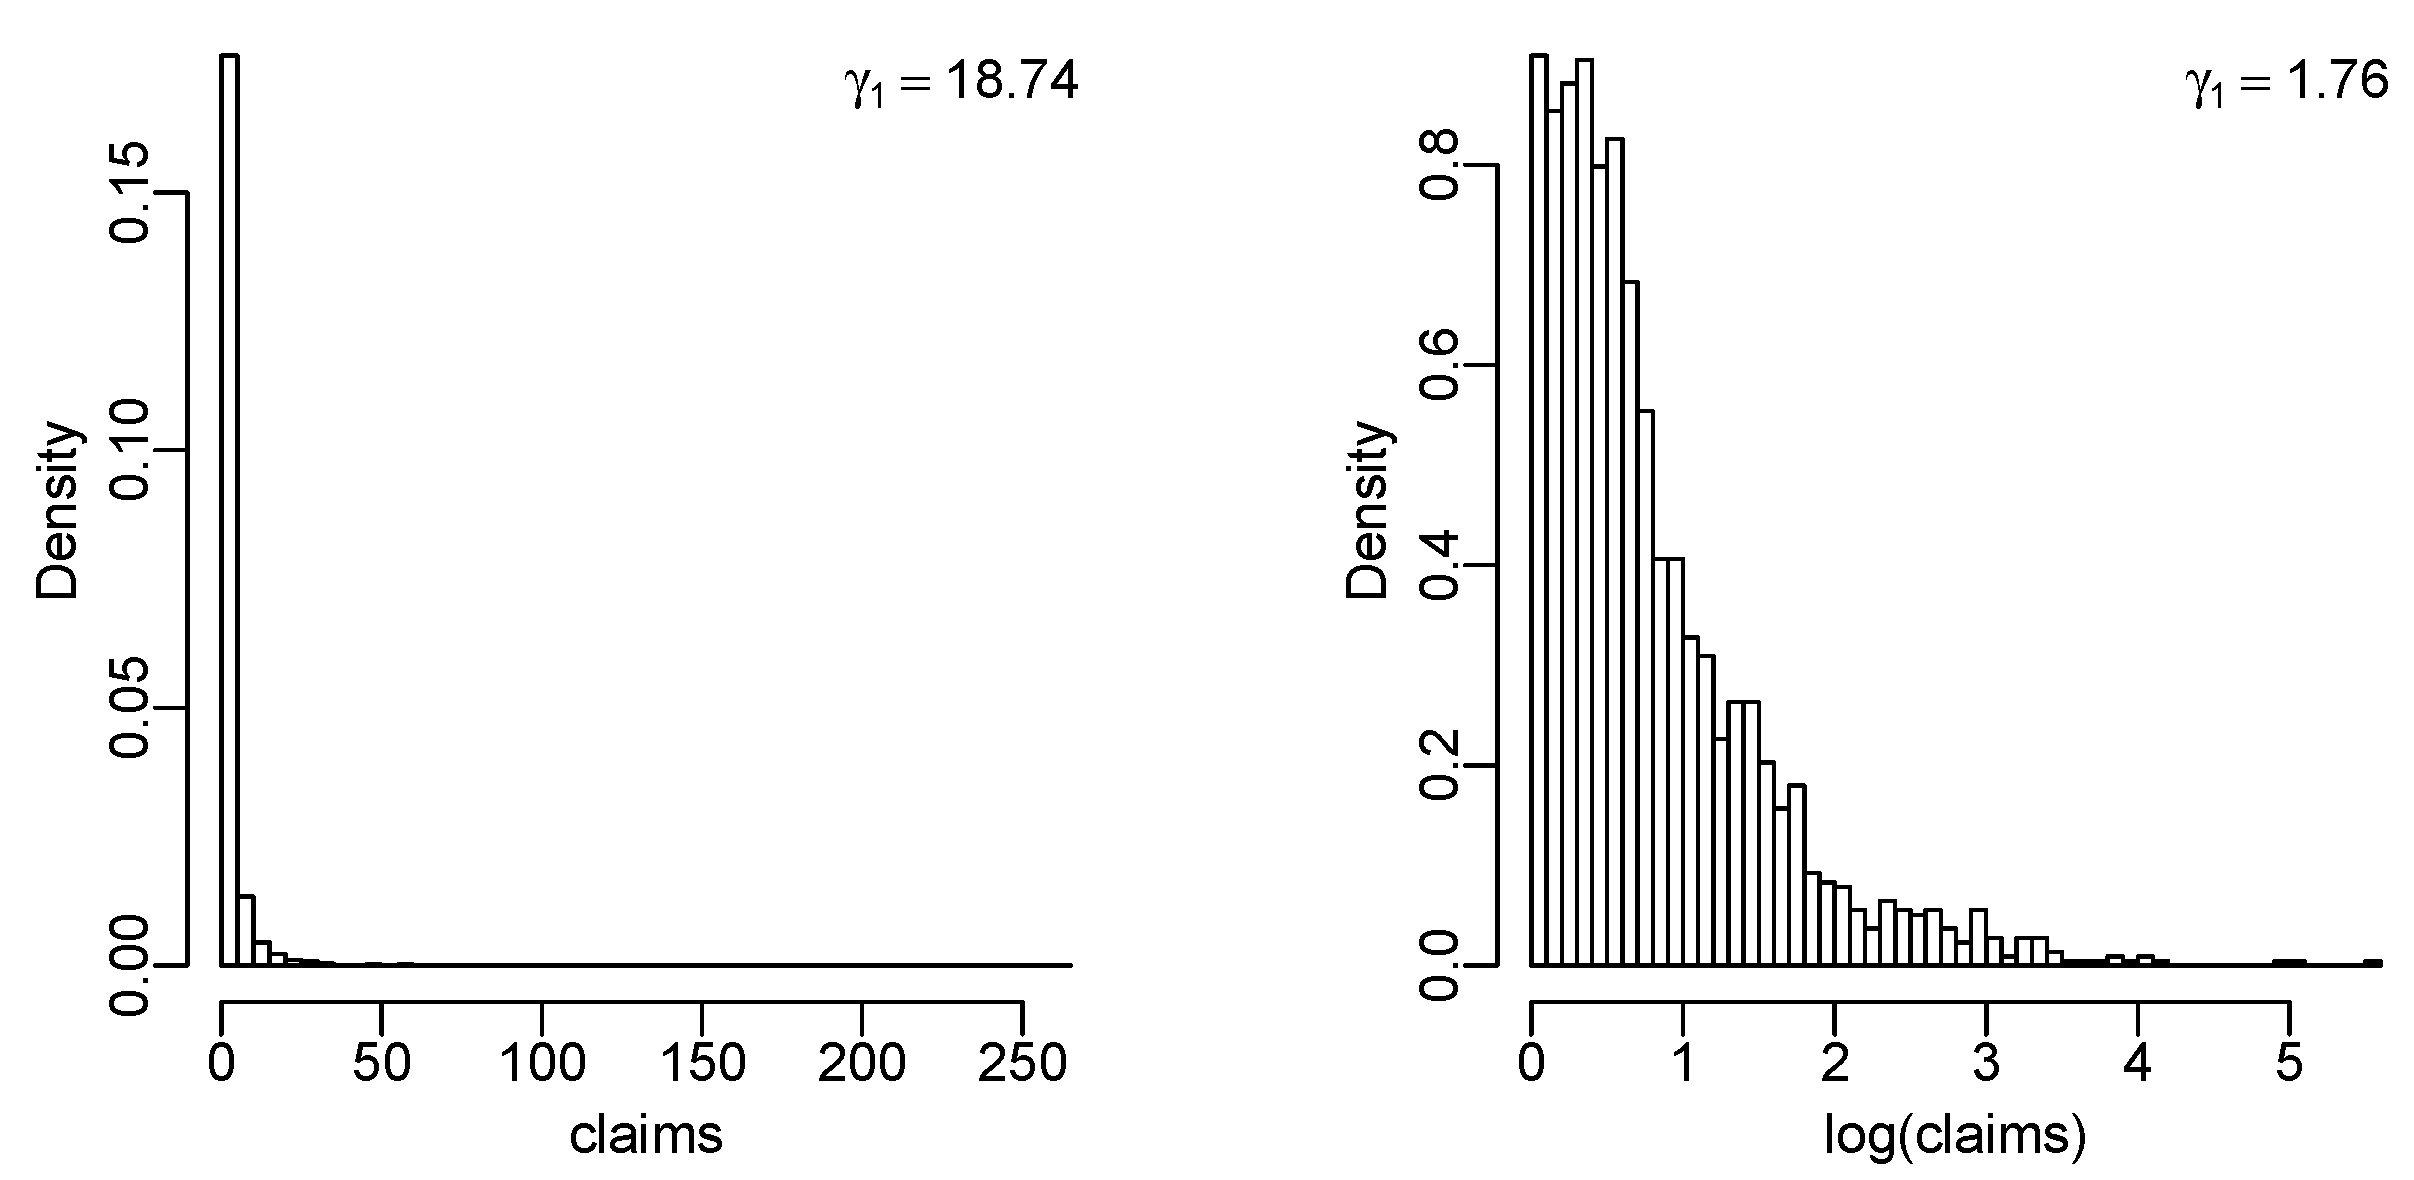
| Data | |||||
|---|---|---|---|---|---|
| US indemnity | 0.080 | −0.496 | 13.444 | 28.829 | −0.789 |
| US indemnity, log | 0.093 | −0.321 | 17.106 | 21.635 | −0.021 |
| Danish fire | 0.386 | −0.096 | 11.923 | 21.417 | −0.564 |
| Danish fire, log | 1.176 | −0.040 | 10.542 | 20.549 | −0.373 |
| Distribution | AIC | BIC | |||
|---|---|---|---|---|---|
| Npar | Original | Log | Original | Log | |
| Lambert W exponential | 2 | 13,141.92 | 7845.81 | 13,152.55 | 7856.44 |
| Lambert W normal | 3 | 13,397.48 | 5737.79 | 13,413.42 | 5753.73 |
| exponential | 1 | 14,157.93 | 8869.95 | 14,163.24 | 8875.26 |
| gamma | 2 | 13,537.17 | 6442.22 | 13,547.80 | 6452.85 |
| log-normal | 2 | 13,137.53 | 8895.12 | 13,148.16 | 8905.74 |
| logistic | 2 | 16,544.91 | 5753.92 | 16,555.54 | 5764.55 |
| normal | 2 | 18,156.65 | 5740.44 | 18,167.27 | 5751.06 |
| Weibull | 2 | 13,321.70 | 5923.95 | 13,332.33 | 5934.58 |
| Cauchy | 2 | 14,518.07 | 6264.44 | 14,528.69 | 6275.07 |
| Pareto | 2 | 13,148.51 | 8871.95 | 13,159.13 | 8882.58 |
| symm hyperbolic | 3 | 15,884.38 | 5738.41 | 15,900.32 | 5754.35 |
| symm NIG 1 | 3 | 14,515.76 | 5738.38 | 14,531.70 | 5754.32 |
| symm VG 2 | 3 | 14,261.53 | 5738.65 | 14,277.47 | 5754.59 |
| student t | 3 | 14,492.64 | 5738.12 | 14,508.58 | 5754.06 |
| skew-normal | 3 | 16,315.13 | 5737.79 | 16,331.07 | 5753.73 |
| asymm hyperbolic | 4 | 14,163.24 | 5738.16 | 14,184.49 | 5759.41 |
| asymm NIG | 4 | 13,148.66 | 5738.12 | 13,169.91 | 5759.37 |
| asymm VG | 4 | 14,177.46 | 5738.61 | 14,198.71 | 5759.86 |
| symm ghyp 3 | 4 | 14,494.64 | 5740.43 | 14,515.89 | 5761.68 |
| skew t | 4 | 13,197.79 | 5738.06 | 13,219.05 | 5759.32 |
| asymm ghyp | 5 | 13,145.91 | 5740.61 | 13,172.48 | 5767.17 |
| Distribution | AIC | BIC | |||
|---|---|---|---|---|---|
| Npar | Original | Log | Original | Log | |
| Lambert W exponential | 2 | 9264.10 | 3282.22 | 9275.46 | 3293.58 |
| Lambert W normal | 3 | 6699.82 | 2978.46 | 6716.86 | 2995.50 |
| exponential | 1 | 9620.79 | 3297.61 | 9626.47 | 3303.30 |
| gamma | 2 | 9538.19 | 3299.61 | 9549.55 | 3310.98 |
| log-normal | 2 | 8119.79 | 5504.62 | 8131.16 | 5515.98 |
| logistic | 2 | 11,479.71 | 4421.17 | 11,491.08 | 4432.53 |
| normal | 2 | 15,431.52 | 4709.15 | 15,442.89 | 4720.52 |
| Weibull | 2 | 9611.24 | 3294.27 | 9622.61 | 3305.63 |
| Cauchy | 2 | 8240.17 | 4589.38 | 8251.53 | 4600.74 |
| Pareto | 2 | 9249.67 | 3818.07 | 9261.03 | 3829.43 |
| symm hyperbolic | 3 | 10,433.17 | 4363.90 | 10,450.21 | 4380.95 |
| symm NIG 1 | 3 | 8237.61 | 4303.93 | 8254.66 | 4320.97 |
| symm VG 2 | 3 | 9089.69 | 4375.17 | 9106.73 | 4392.21 |
| student t | 3 | 8237.85 | 4299.90 | 8254.90 | 4316.94 |
| skew-normal | 3 | 12,608.36 | 3441.49 | 12,625.40 | 3458.54 |
| asymm hyperbolic | 4 | 8109.27 | 3307.83 | 8132.00 | 3330.56 |
| asymm NIG | 4 | 6806.79 | 3378.14 | 6829.52 | 3400.86 |
| asymm VG | 4 | 7404.07 | 3281.06 | 7426.80 | 3303.78 |
| symm ghyp 3 | 4 | 8224.65 | 4298.21 | 8247.38 | 4320.93 |
| skew t | 4 | 6683.02 | 3274.24 | 6705.75 | 3296.96 |
| asymm ghyp | 5 | 6775.85 | 3283.06 | 6804.26 | 3311.46 |
Disclaimer/Publisher’s Note: The statements, opinions and data contained in all publications are solely those of the individual author(s) and contributor(s) and not of MDPI and/or the editor(s). MDPI and/or the editor(s) disclaim responsibility for any injury to people or property resulting from any ideas, methods, instructions or products referred to in the content. |
© 2023 by the authors. Licensee MDPI, Basel, Switzerland. This article is an open access article distributed under the terms and conditions of the Creative Commons Attribution (CC BY) license (https://creativecommons.org/licenses/by/4.0/).
Share and Cite
Käärik, M.; Selart, A.; Puhkim, T.; Tee, L. Lambert W Random Variables and Their Applications in Loss Modelling. Symmetry 2023, 15, 1877. https://doi.org/10.3390/sym15101877
Käärik M, Selart A, Puhkim T, Tee L. Lambert W Random Variables and Their Applications in Loss Modelling. Symmetry. 2023; 15(10):1877. https://doi.org/10.3390/sym15101877
Chicago/Turabian StyleKäärik, Meelis, Anne Selart, Tuuli Puhkim, and Liivika Tee. 2023. "Lambert W Random Variables and Their Applications in Loss Modelling" Symmetry 15, no. 10: 1877. https://doi.org/10.3390/sym15101877
APA StyleKäärik, M., Selart, A., Puhkim, T., & Tee, L. (2023). Lambert W Random Variables and Their Applications in Loss Modelling. Symmetry, 15(10), 1877. https://doi.org/10.3390/sym15101877


