Article

A Study of the Critical Velocity of the Droplet Transition from the Cassie to Wenzel State on the Symmetric Pillared Surface

College of Architecture and Environment, Sichuan University, Chengdu 610065, China
*
Author to whom correspondence should be addressed.
Symmetry 2022, 14(9), 1891; https://doi.org/10.3390/sym14091891
Submission received: 1 August 2022 / Revised: 1 September 2022 / Accepted: 5 September 2022 / Published: 9 September 2022

Abstract

:
A droplet hitting a superhydrophobic surface will undergo the Cassie to Wenzel transition when the wetting force exceeds the anti-wetting force. The critical velocity of the droplet’s Cassie to Wenzel state transition can reflect the wettability of the surface. However, the critical velocity research is still at the microscale and has not been extended to the nanoscale mechanism. A cross-scale critical velocity prediction model for superhydrophobic surfaces with symmetric structures is proposed here based on a mechanical equilibrium system. The model’s applicability is verified by experimental data. It demonstrates that the mechanical equilibrium system of droplet impact with capillary pressure and Laplace pressure as anti-wetting forces is more comprehensive, and the model proposed in this study predicts the critical velocity more precisely with a maximum error of 12% compared to the simulation results. Furthermore, the correlation between the simulation at the nanoscale and the evaluation of the macroscopic symmetrical protrusion surface properties is established. Combined with the model and the correlation, the relationship between the microscopic mechanism and the macroscopic examination of droplet dynamics on the superhydrophobic surface be presented, and the wettability evaluation method of macroscopic surfaces based on the molecular simulation mechanism can be realized.

1. Introduction

Cassie states and Wenzel states are two typical states of droplet impact on a superhydrophobic surface [1], as shown in Figure 1. A droplet that has transitioned from the Cassie state to the Wenzel state (C-W) shows bigger contact angle hysteresis and slip angle, which results in the gaps on the surface being occupied by droplets and the surface losing its superhydrophobic properties [2]. When the superhydrophobic properties of the surface are weakened, the surface is easily contaminated in the case of foreign body viscosity. It has been verified that the wetting force of the droplet will be larger than the anti-wetting force of the surface under a high enough impact velocity of the droplet, which causes the C-W transition of the droplet [3]. The study of the critical velocity of the droplet at the C-W transition is very important for many applications, such as anti-fogging of windshield glasses [4], medical cooling spray [5], anti-icing of aircraft and circuit surfaces [6,7], and anti-fouling of photovoltaic panels [8].
Therefore, efforts have been made to understand the mechanism of the C-W transition of the droplet using experimental methods, and many models have been proposed to predict the critical velocity of the C-W transition of the droplet. Reyssat et al. [3] found that the critical velocity of the C-W transition of the droplet was closely related to the structure distribution through an experiment of a droplet’s impact on a pillared surface, and proposed a critical velocity model ( V = γ lv h / ρ d 2 , where γ is the surface tension of the droplet; h is the pillar height; ρ is the droplet density; d is the pillar spacing). Barolo et al. [9] analyzed the droplet impact on a model microfabricated surface and established a semi-quantitative model to predict the critical velocity of the C-W transition of the droplet based on the surface resistance. Jung et al. [10] observed the wetting behavior of the droplet impact on a pillared surface and proposed the critical velocity prediction model ( V = 16 γ lv h / ρ d 2 ) by the relationship between the impact velocity of the droplet and the surface parameters, as shown in Figure 2b. Liu et al. [11] studied the critical parameter of the C-W transition of the droplet and established physical and mathematical models of the C-W transition of the droplet from the perspective of energy balance. The above models were based on the equilibrium between the inertial force and the Laplace pressure of the droplet. However, Shi et al. [12] concluded that whether a droplet underwent the C-W transition was determined by the competition between the inertia force of the droplet and the capillary force. Malla et al. [13] studied the wetting behavior of the droplet impact on a micro-grooved surface and established a critical velocity model based on the relationship between the impact velocity of the droplet and the groove spacing. Recently, Wang et al. [14] found in their experiments that the actual critical velocity of the C-W transition of the droplet was nearly 10 times higher than the theoretical value of the above models and proposed a standard for the C-W transition of the droplet based on the height of the droplet meniscus, as shown in Figure 2c.
Although many critical velocity prediction models have been proposed, there is still a lack of tests available to evaluate the applicability of the models for a variety of superhydrophobic surfaces. In addition, such trial-and-error research is costly, time-consuming, and a waste of resources. Molecular dynamics (MD) simulation has been widely used to study the dynamics of droplets on superhydrophobic surfaces due to the advantages of high reliability, low cost, and a short research period [15,16]. Furthermore, the effects of droplet impact velocity, height, width, and spacing of the protrusion structure on the droplet wetting state have been studied deeply by MD simulation [17,18,19,20]. However, no critical velocity prediction model at the nanoscale has been reported so far. Furthermore, the results of MD simulation at the nanoscale are not practical because of the lack of correlation with the macroscale, which means the results of MD simulation cannot directly evaluate superhydrophobic surface properties at the macroscale. Thus, it is very important to establish the critical velocity prediction model of the C-W transition of a droplet at the nanoscale and explore the correlation between the nanoscale and the macroscale of a droplet’s wetting behavior on superhydrophobic surfaces.
In this paper, the MD simulation method was employed to study the effects of nanopillar spacing and the droplet radius on the critical velocity of the C-W transition of a droplet. It was found that the capillary pressure and the Laplace pressure must be considered in the calculation of the critical velocity, and the critical velocity prediction model was established based on the mechanical equilibrium system at the C-W transition of a droplet, while its applicability was verified by the experiment data. In addition, the correlation between the nanoscale and the macroscale of the C-W transition of the droplet was proposed based on the model. Using the critical velocity prediction model and the correlation between the nanoscale and the macroscale of the C-W transition of the droplet, the MD simulation results can directly evaluate superhydrophobic surface properties at the macroscale.

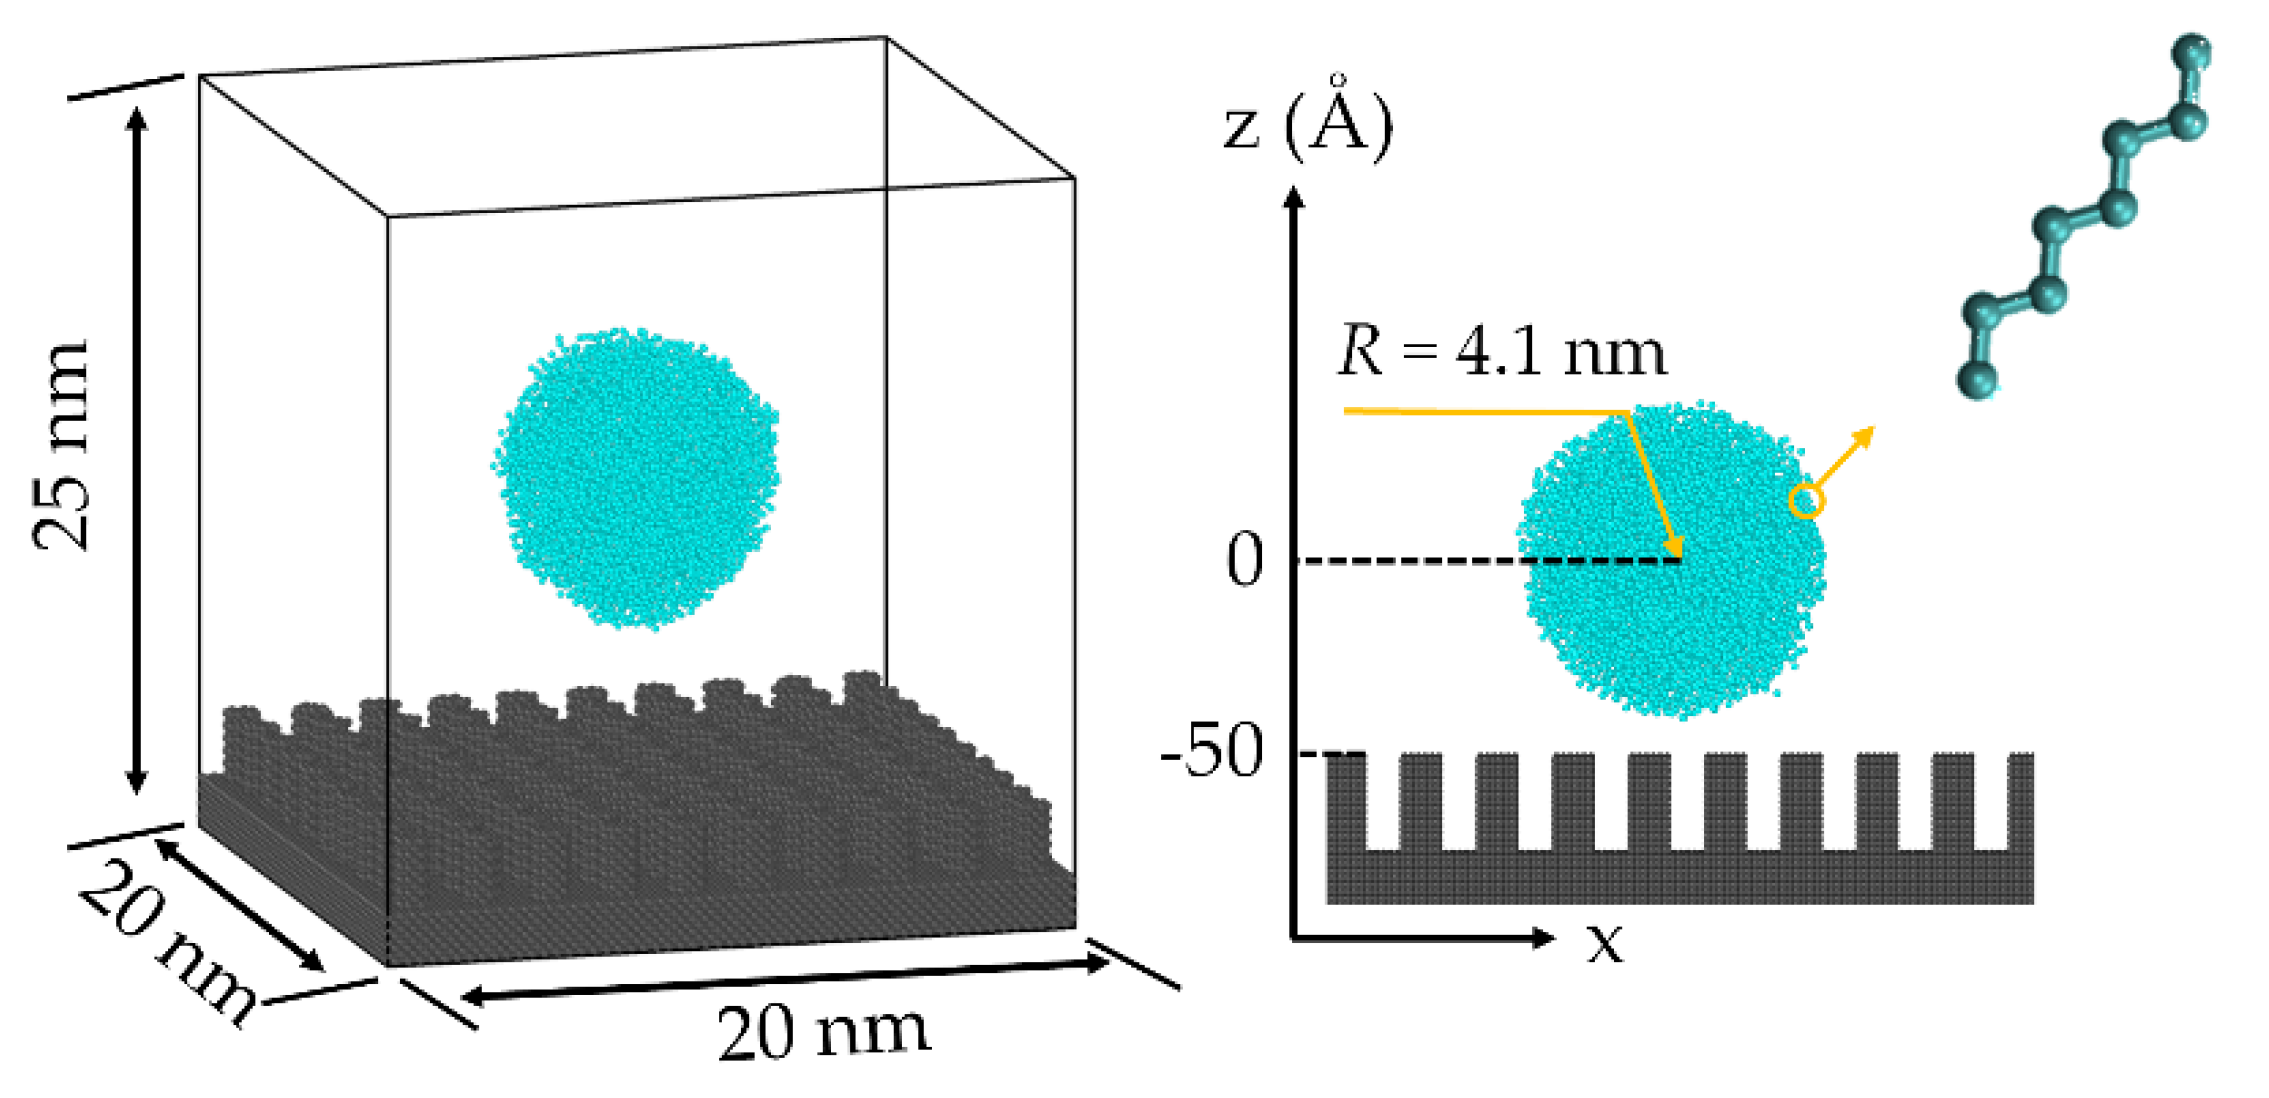
2. Simulation Methodology

In this paper, the wetting behavior of droplets on a superhydrophobic surface was calculated by the MD simulation method. The impact model consists of a spherical droplet model and a substrate model with a nanopillar structure. Furthermore, the dimensions of the model box are 20 nm, 20 nm, and 25 nm in the x, y, and z directions, respectively, as shown in Figure 3. In the initial case, the positions of the centroid of the droplet and the nanopillar top surface are 0 and −50 Å, respectively. The eight-atom chain liquid molecular model that was often used to establish the molecular models of the polymer [21], silicone oil [22], and water [23] was used to establish the droplet model. It has been proven that the model can reflect the dynamic behavior and physical parameters of the liquid well and has been widely used in molecular dynamic simulation of wetting and flow at the solid–liquid interface. After the relaxation of the droplet model, the interatomic bond length of the chain liquid molecule is 1.54 Å, the bond angle of the chain liquid molecule is 109.5°, and the dihedral angle of the chain liquid molecule is 0. The extra interaction forces of the chain molecule model can force the atoms in a molecule together and reduces evaporation [24]. In addition, we used carbon atoms as monomers in chain molecules, which can significantly reduce the computational burden of the Coulomb force calculation. This method of building chain molecules using uncharged particles was used in many similar studies [23,25,26]. The single crystal Cu structure was used to establish the substrate model, and the lattice type of the substrate model is a face-centered cubic lattice, while the lattice constant is 3.615 Å.
In the process of MD simulation, the Velocity-verlet method [27] was employed to solve Newton’s equation of motion of the particles in the system to obtain the velocities and positions of the particles, and the Lennard–Jones (LJ) potential was employed to calculate the force between unbonded atoms. The function is
U i j = 4 ε i j [ ( σ i j r i j ) 12 ( σ i j r i j ) 6 ] ,
where ε i j is the interatomic interaction strength coefficient, r i j is the distance between atoms, and σ i j is the distance between atoms at equilibrium. In this paper, the interaction strength coefficients of liquid–liquid ( ε l l ), solid–solid ( ε s s ), and liquid–solid ( ε l s ) atoms are 0.931, 0.582, and 0.087 kcal/mol, respectively, and the distance between atoms at equilibrium is 3.5 Å.
The Finite Extensible Nonlinear Elastic (FENE) potential was employed to calculate the force between bonded atoms, and the function is
E F E N E ( r ) = { 0.5 K L 0 2 ln [ 1 ( r L 0 ) 2 ] r L 0 r > L 0 ,
where L 0 is the maximum distance the chain can extend and K is the elasticity modulus. In this paper, L 0 and K were calculated as L 0 = 1.5 σ i j , K = 30 ε i j / σ i j 2 according to Ref. [21]. The surface tension of the droplet ( γ lv ) was calculated by the Test-area method [28], and the surface tension of the droplet model at 298 K was calculated as 59.0 × 10³ N/m.
LAMMPS software [29] was used to perform the MD simulations based on the above potential functions and parameters, and the NVT ensemble was used in the simulation process. The Nose–Hoover thermostat was used to keep the system temperature at 298 K, and the temperature damping coefficient was 100 fs. The base atoms remained fixed, and the truncation radius was set to 10 Å. The x and y directions were periodic boundaries, and the z direction was an aperiodic boundary. The time step was 1.0 fs. After the relaxation of 200 ps at 298 K, the droplet was loaded at a given initial velocity and the loading lasted 200 ps.

3. Results and Discussion

The effect of nanopillar spacing and the droplet radius on the critical velocity of the C-W transition of the droplet was investigated via MD simulation. Due to the scale effect, the nanoscale droplets require a higher initial impact velocity to deform similarly to the macroscale droplets [30]. As a result, in the MD simulation calculations, the initial velocity of droplets is nearly three orders of magnitude greater than that of macroscopic droplets to produce the Weber number (We) of droplets close to the macroscopic situation. In the calculations, the droplet impact velocity ranged from 180 m/s to 730 m/s. The contact angle was measured using the simulation results. To reduce the measurement error, the contact angle of the droplet on each surface was measured five times, and the final value was taken within the error range. Figure 4 shows the contact angle and the statistical error of each case in Table 1.

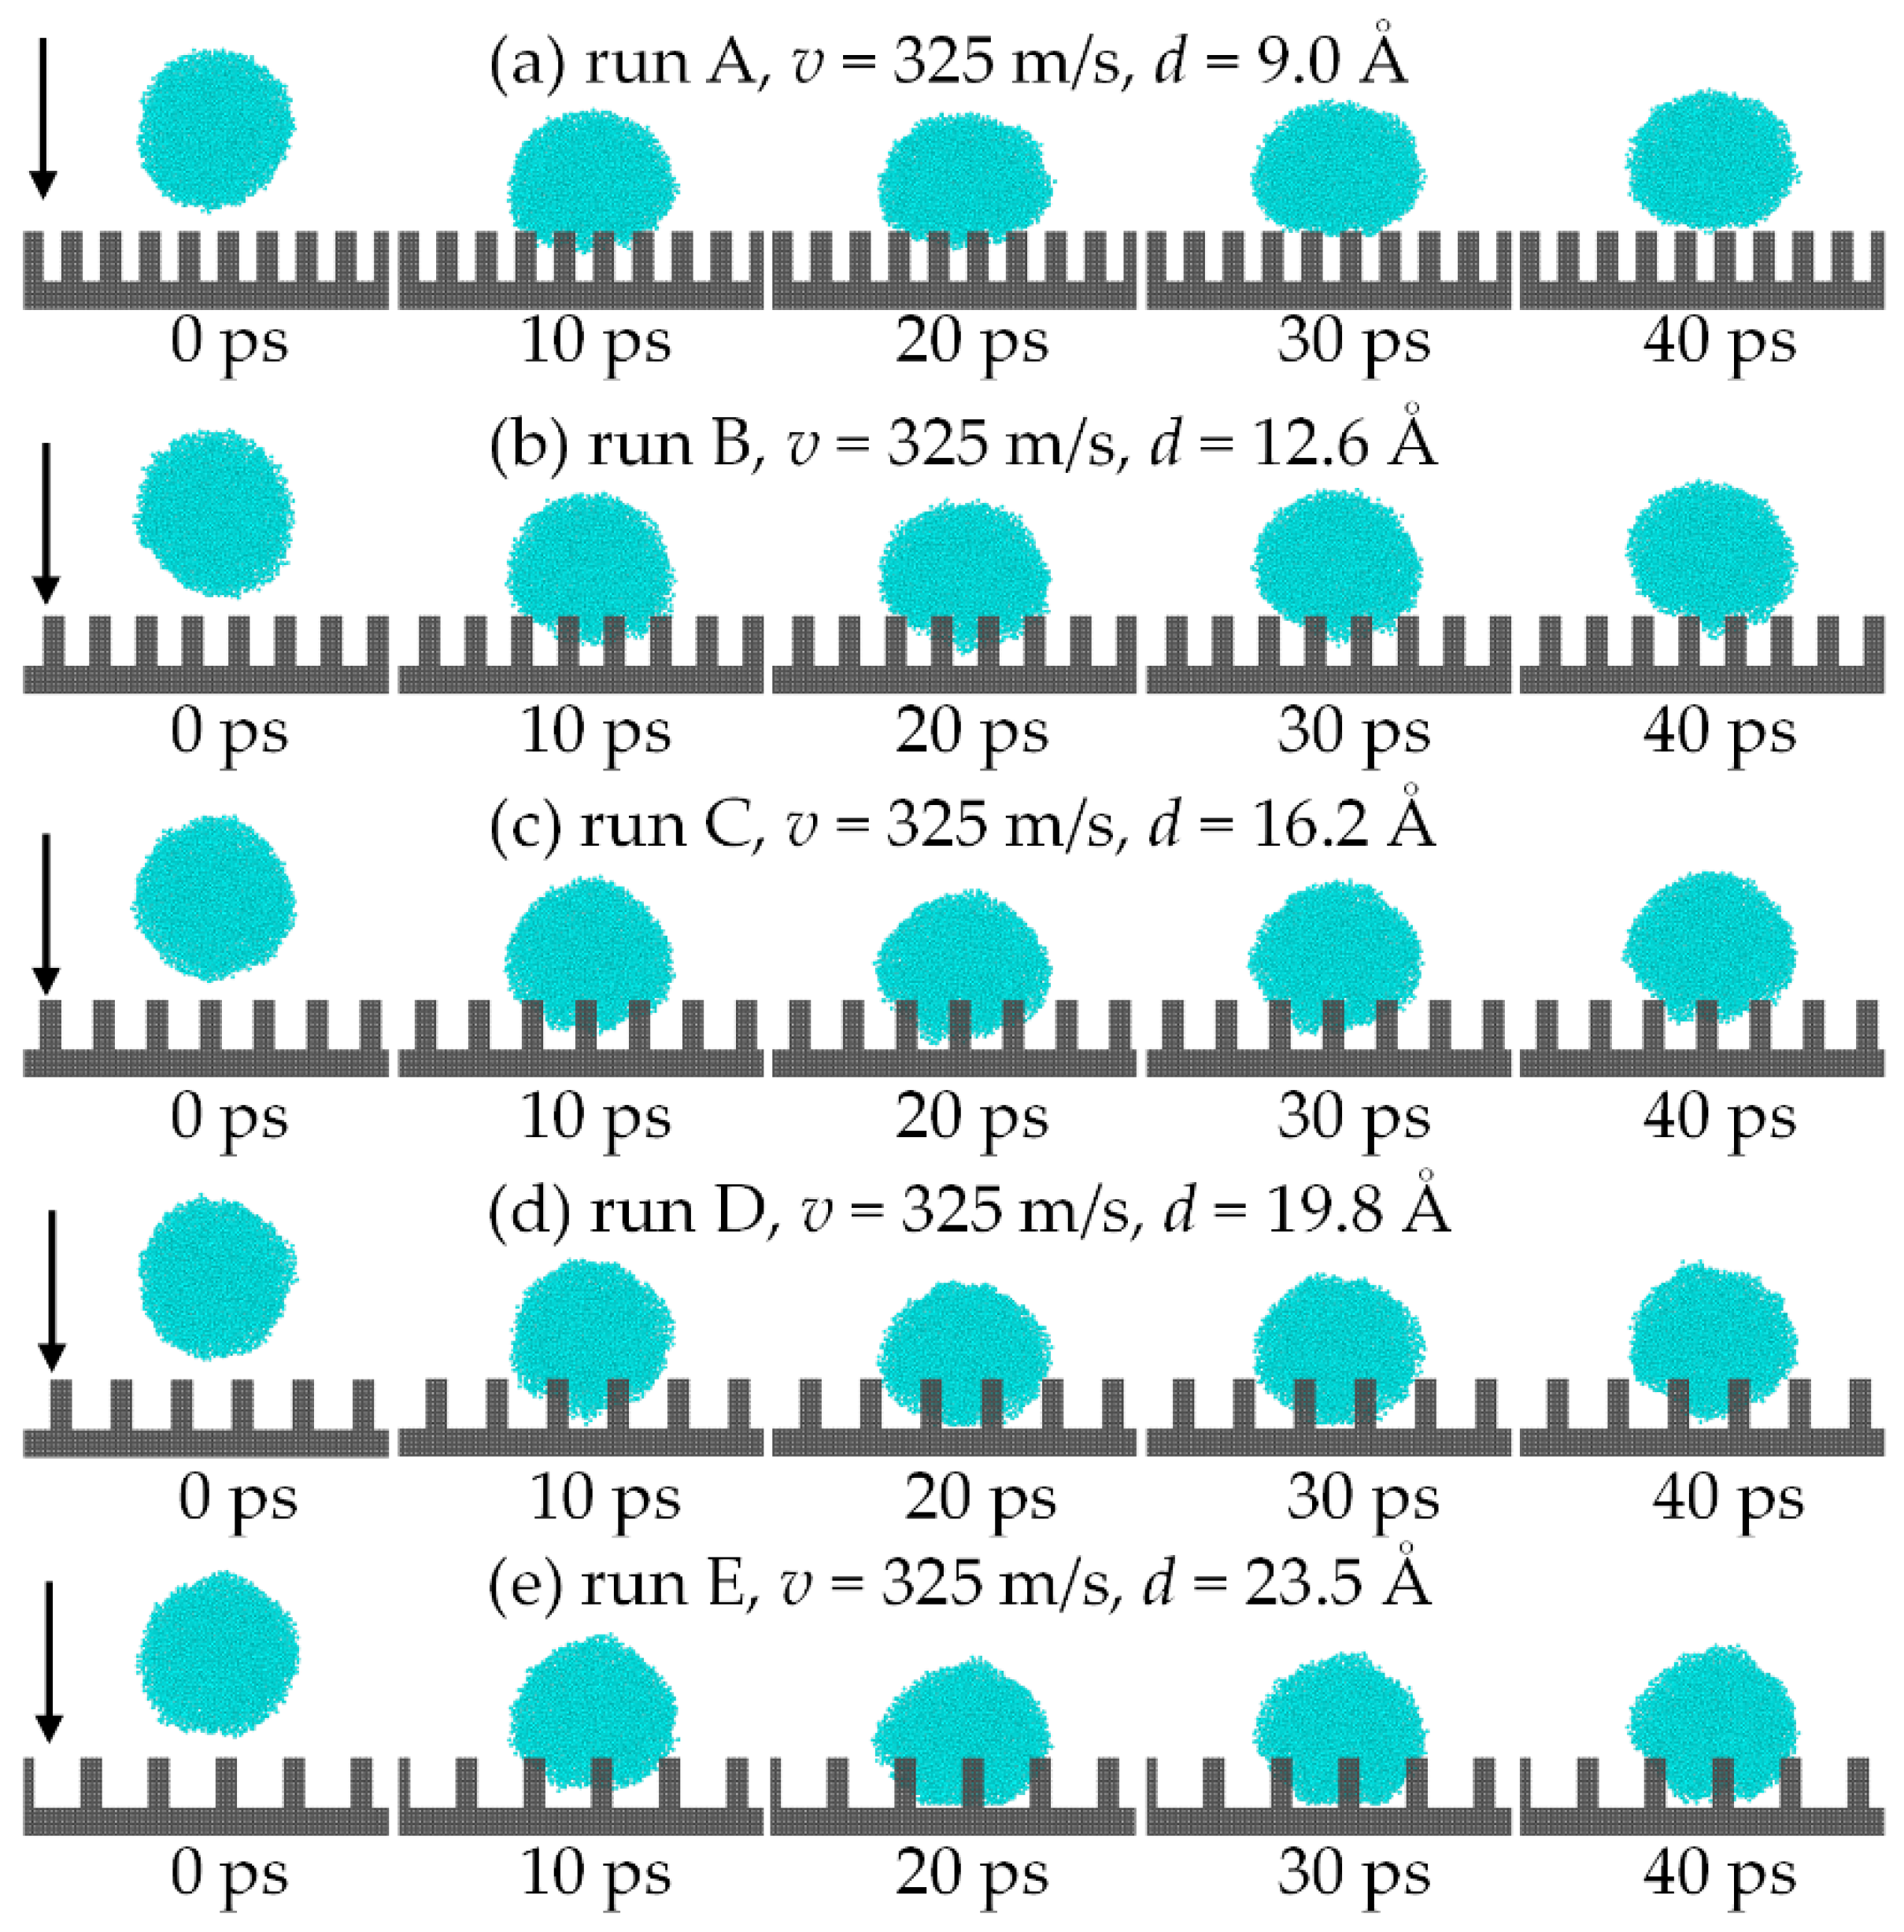
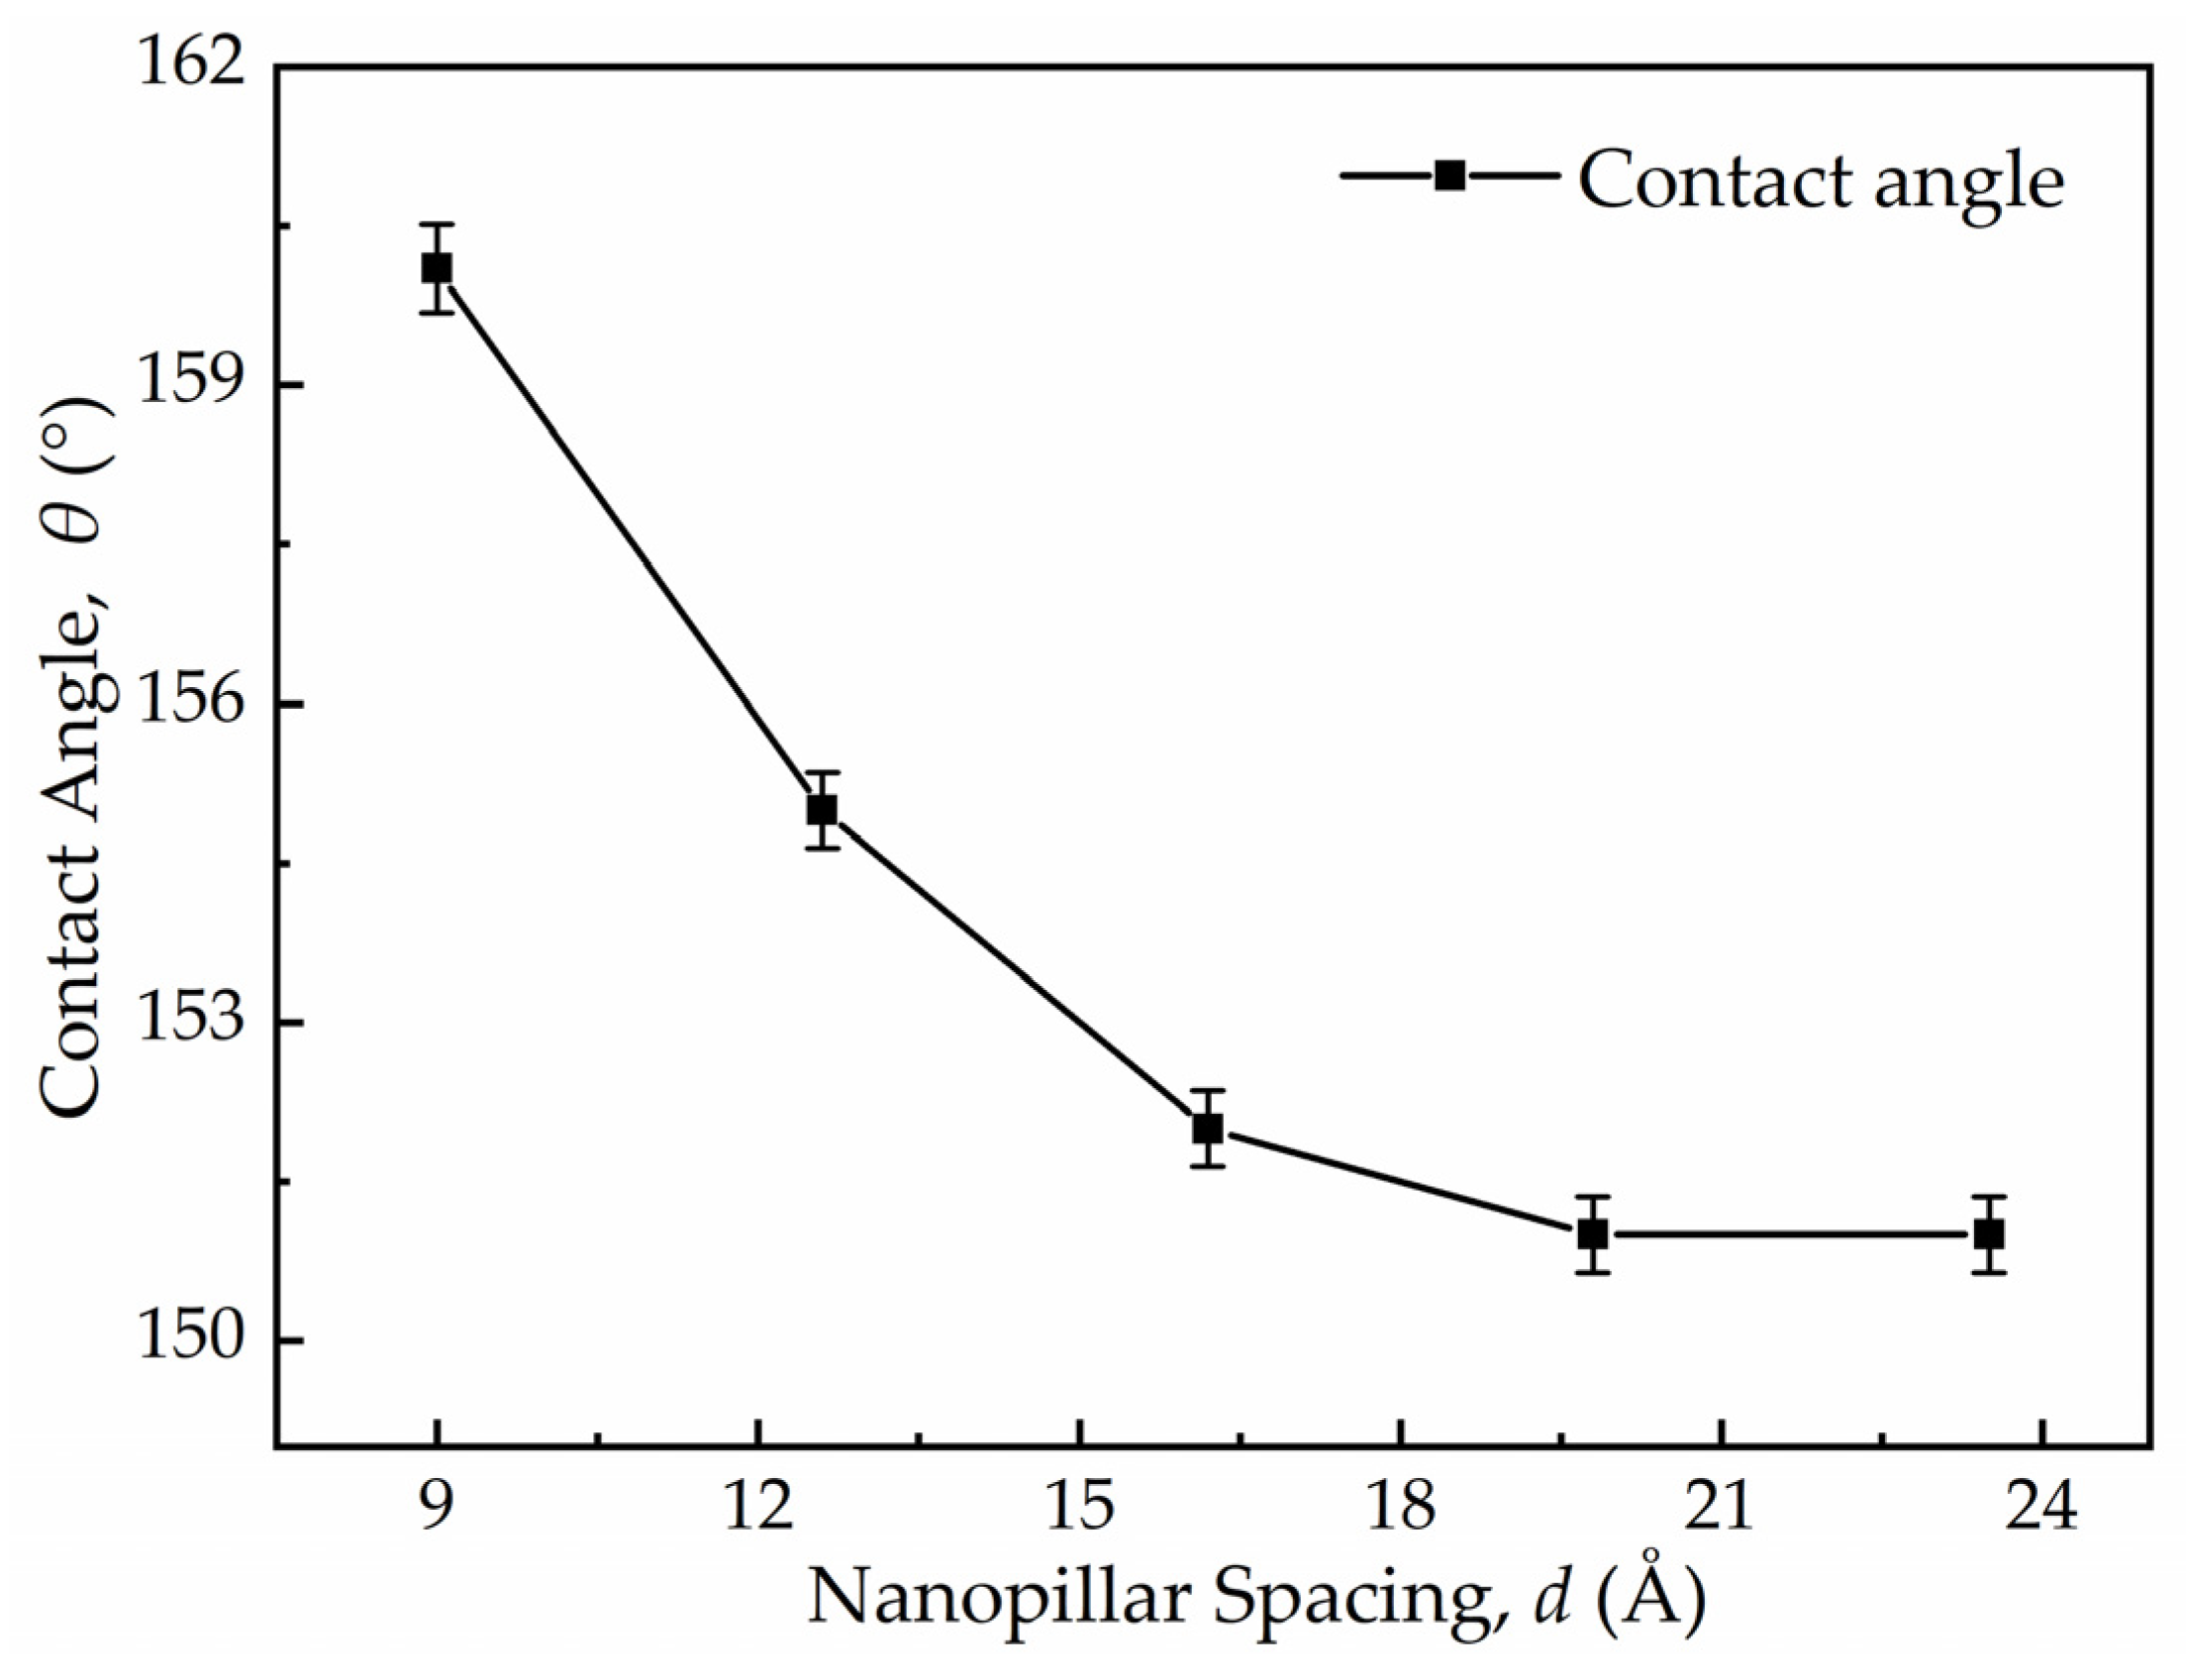
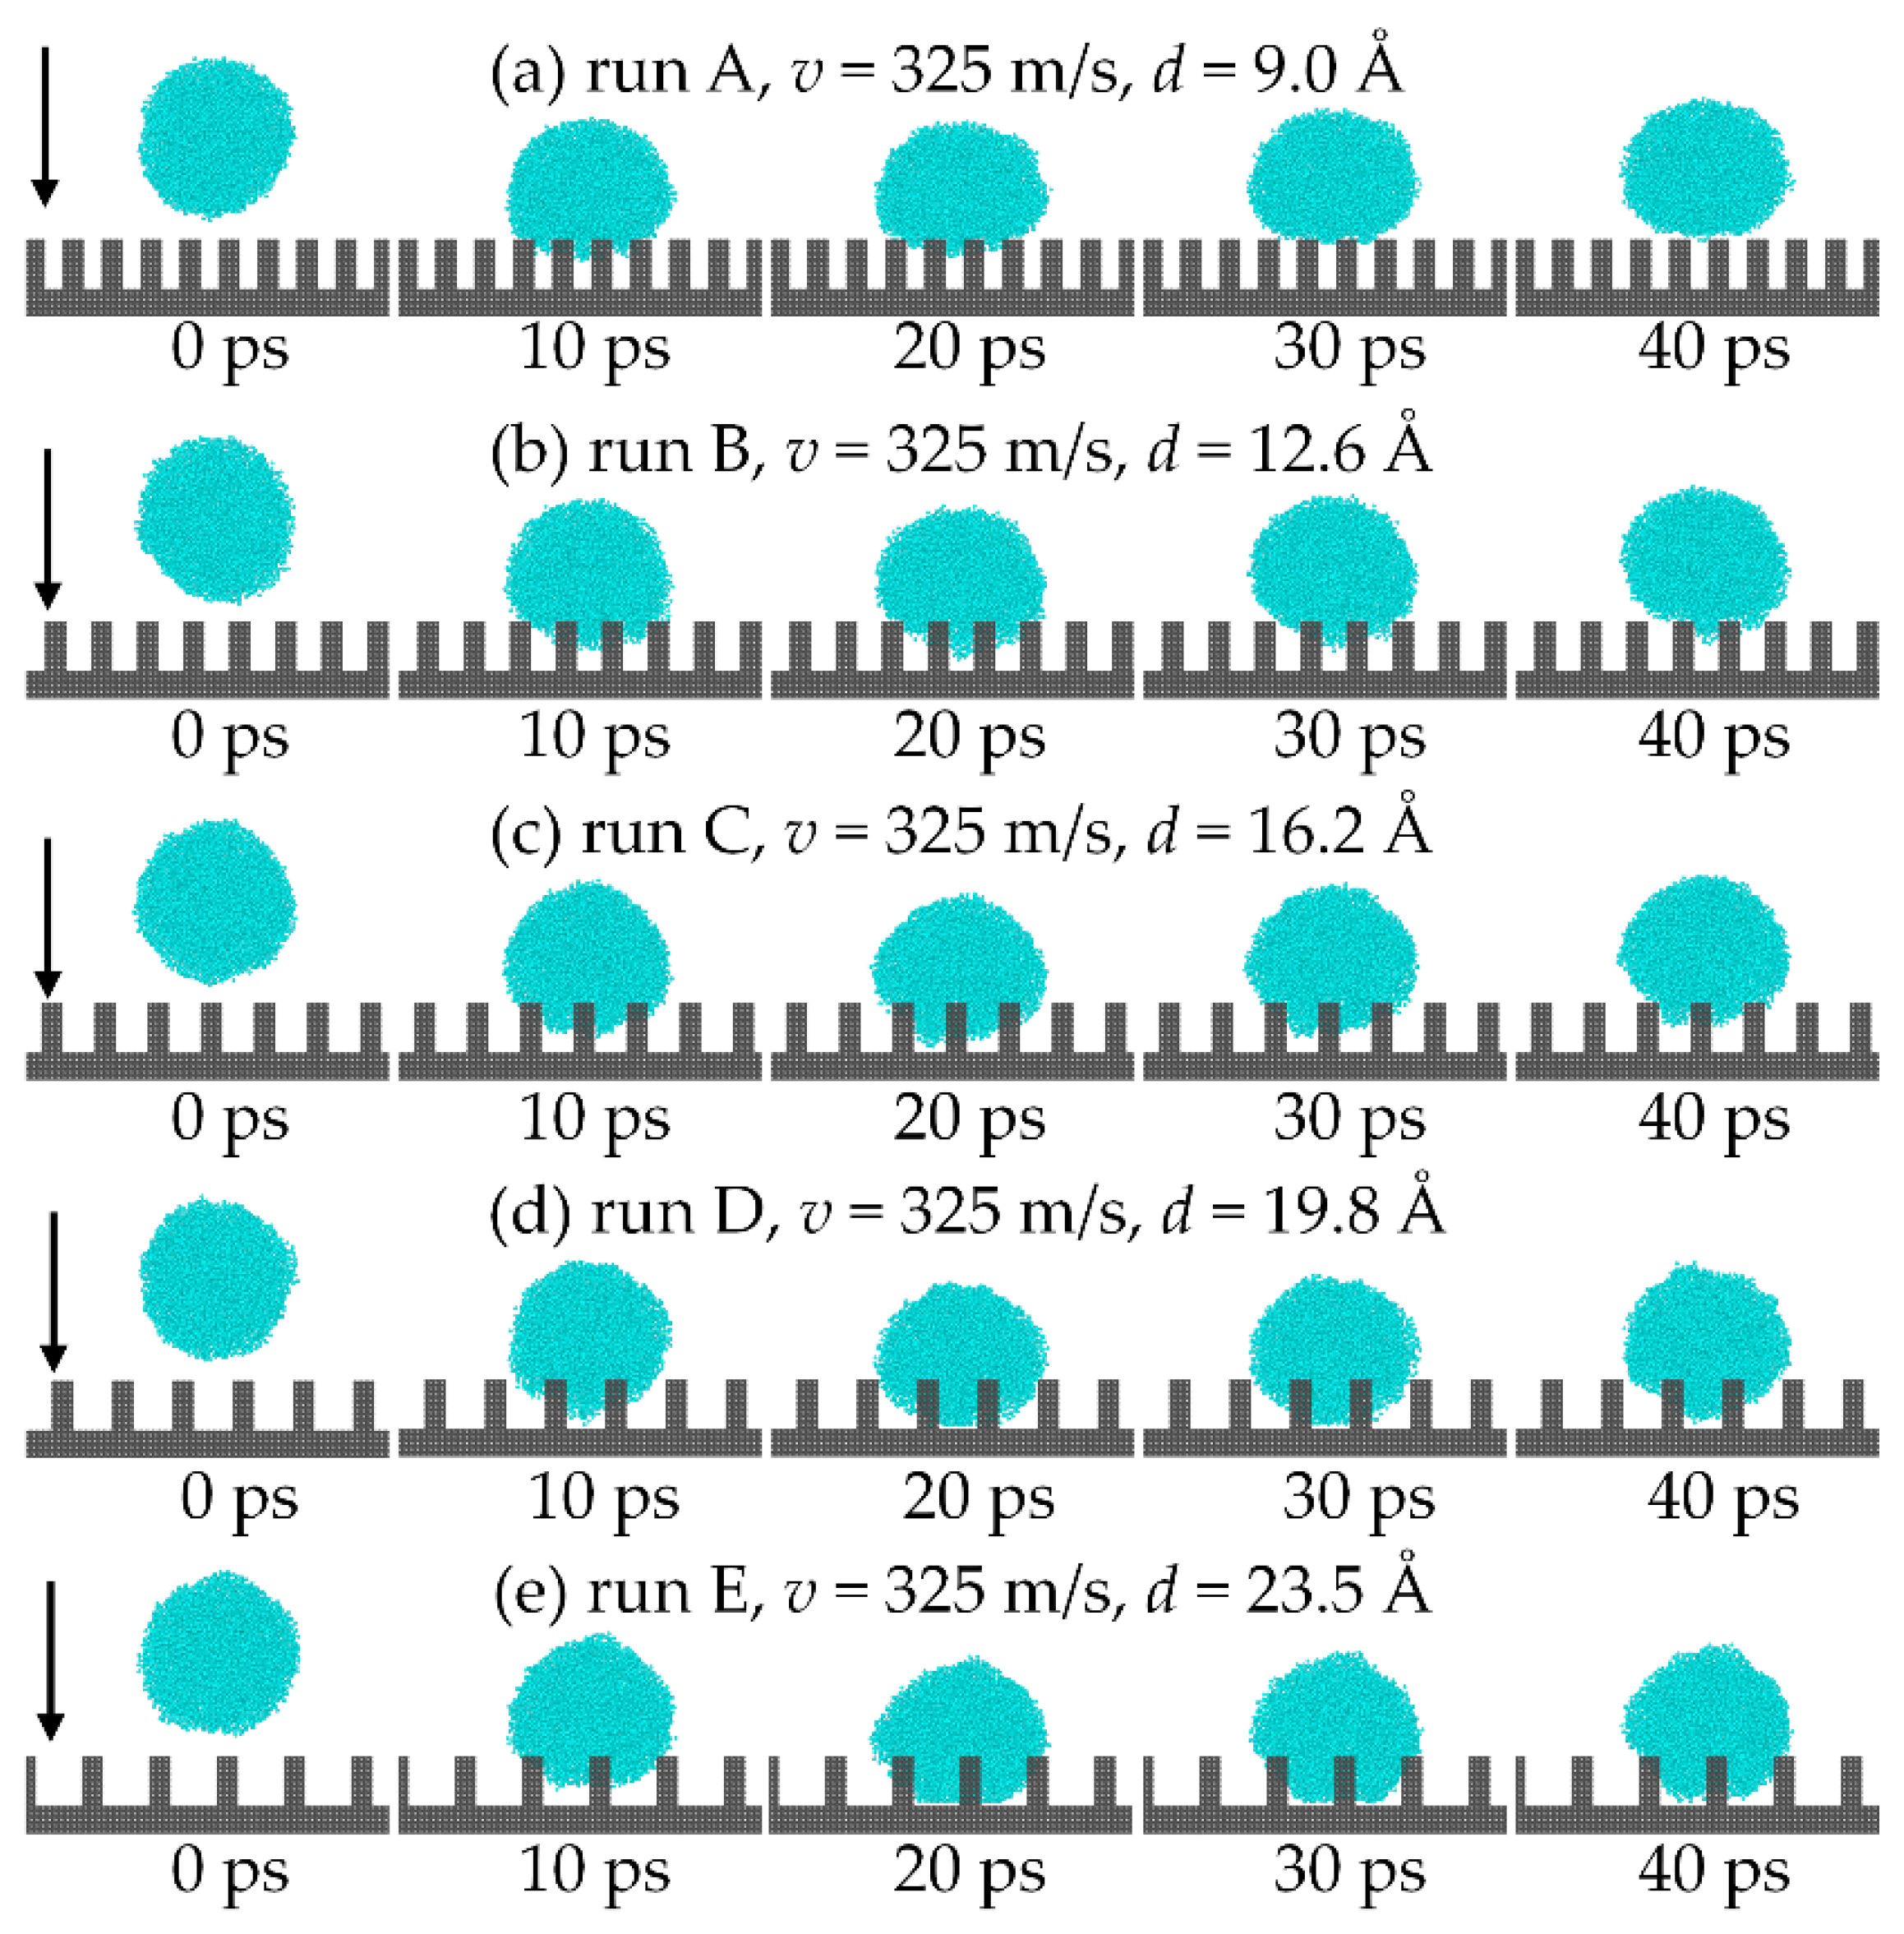
3.1. Effect of Different Pillar Spacing

Table 1 shows the parameters of different surfaces. Five cases were calculated to investigate the effect of different pillar spacing on the critical velocity of the droplet. The height of the pillar is 18 Å and the droplet models consist of 800 chain molecules with a radius of 41 Å in all cases. The impact process was recorded in the first 40 ps with a 10 ps interval as shown in Figure 5. It shows that the varying pillar spacing affects the wetting behavior of droplets significantly compared with the state of the five cases in 20 ps, and the droplet cannot wet the pillar gap when the spacing is 9.0 Å. Furthermore, the droplet’s wetting state transitions from the Cassie state to the Wenzel state when the spacing increases to 19.8 Å. The calculation results are similar to that in Ref. [31]. The wetting state of the droplet impact on the nano-pillared surface was controlled by varying the initial impact velocity of the droplet. The impact velocity at which the droplet undergoes the C-W transition is the critical velocity. It also shows that the greater the nanopillar spacing, the smaller the critical velocity of the C-W transition of the droplet.
Then, the variation trend of the critical velocity and the capillary pressure were compared, as shown in Figure 6. The capillary pressure [32] can be calculated by
P C = 4 γ lv cos θ Y ϕ r ( 1 ϕ ) ,
where ϕ is the area fraction of nanopillar structure on the surface, θ Y is Young’s contact angle, γ lv is the surface tension of the droplet, and r is the pillar width. The results show that the capillary pressure decreases with the increase in the nanopillar spacing, and the variation trend is similar to that of the critical velocity. The air in the nanopillar gap is more easily replaced by the droplet as the nanopillar spacing increases, which reduces the hydrophobic properties of the surface. As a result, there is great relevance between the critical velocity of the C-W transition of the droplet and the capillary pressure of the surface. Therefore, capillary pressure plays an indispensable role in determining the critical velocity of the droplet.

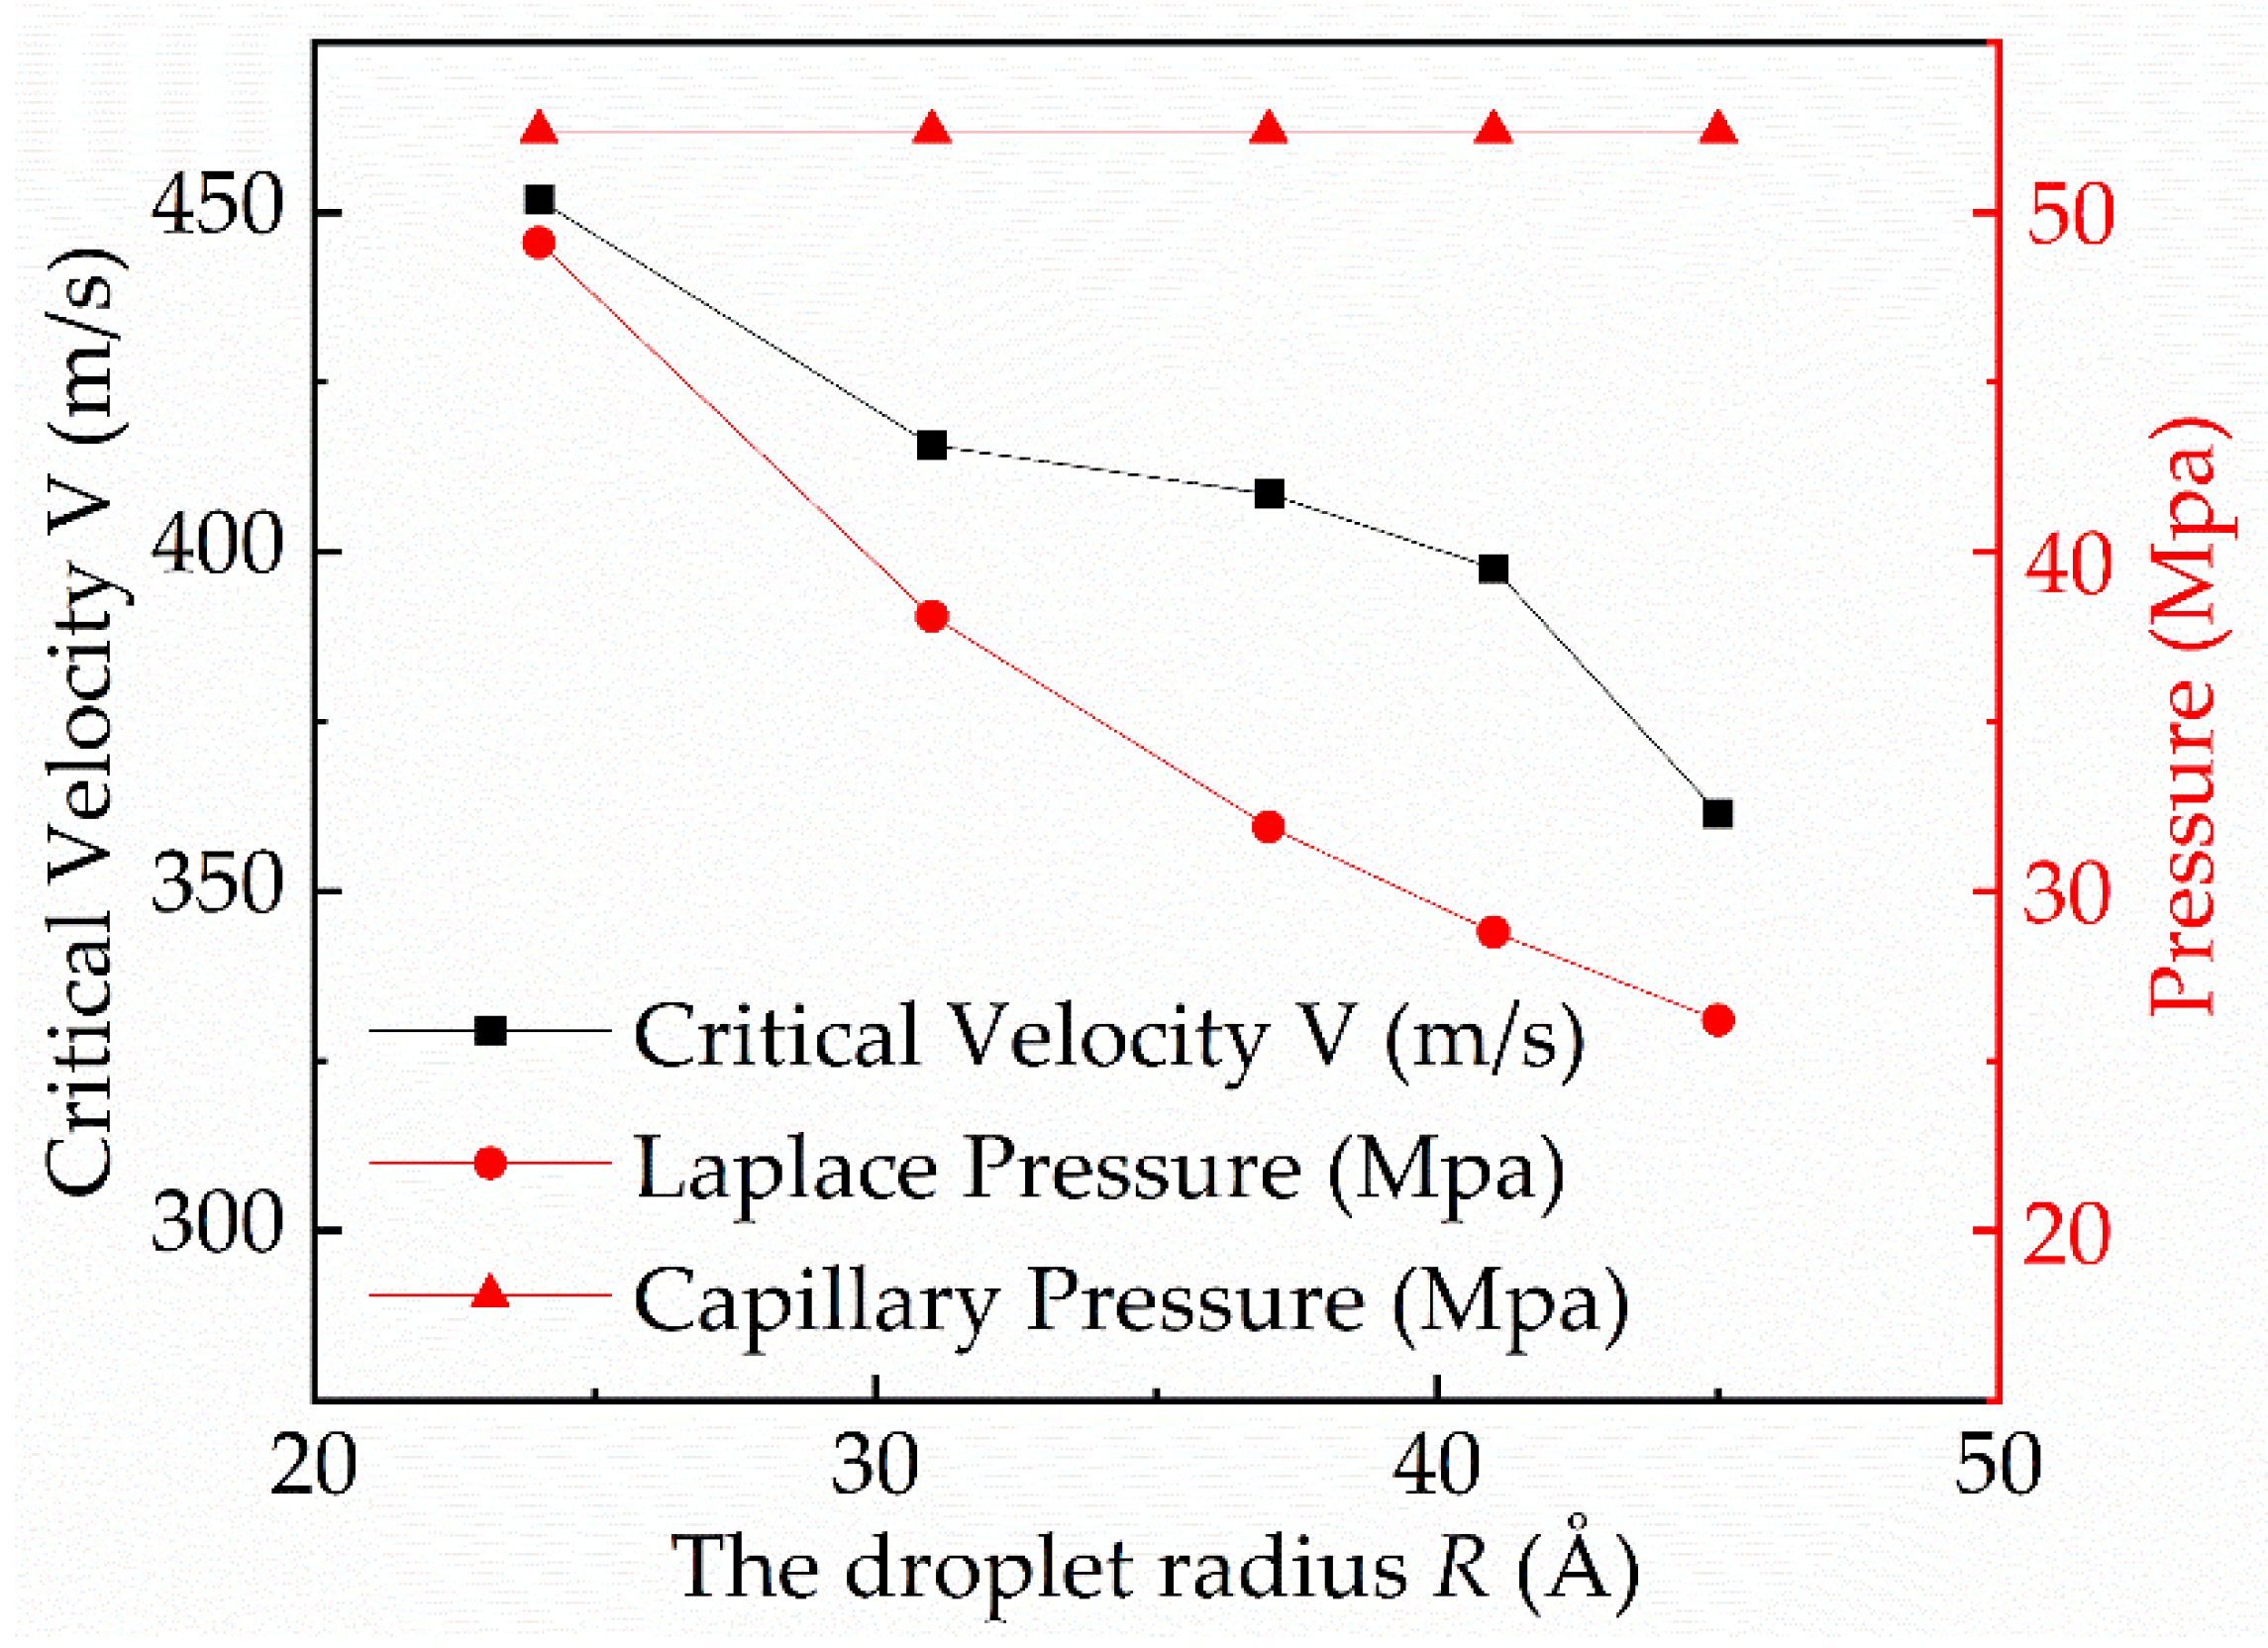
3.2. Effect of the Droplet Radius

Table 2 shows the parameters of the droplets. The droplet radius was varied by controlling the number of chain molecules. In cases 6 to 10, the nanopillar height, spacing, and width are 18 Å, 10.8 Å, and 12.6 Å on the surface, which are the same as in case 2.
The impact process was recorded in the first 40 ps with a 10 ps interval, as shown in Figure 7. The comparison of the wetting state of the droplet at 20 ps shows that the droplet can only wet the part of the gap on the surface when its droplet radius is 24 Å but reaches the Wenzel state when 41 Å. The phenomenon is the same as in Ref. [33]. As a result, the droplet radius significantly influences the wetting behavior of the droplet on the surface.
The change in droplet critical velocity, Laplace pressure, and capillary pressure with droplet radius was calculated as shown in Figure 8. The Laplace pressure can be calculated by
P L = 2 γ lv R ,
where the R is the droplet radius. The result shows that the bigger droplet can readily pin the gap in the surface and show the Wenzel state on the surface. The changing trend of the critical velocity and the Laplace pressure of the droplet is the same. Besides, the Laplace pressure and the capillary pressure are of the same order of magnitude. Thus, the Laplace pressure is part of the anti-wetting pressure and must be taken into account in the mechanical equilibrium system of the C-W transition of the droplet.

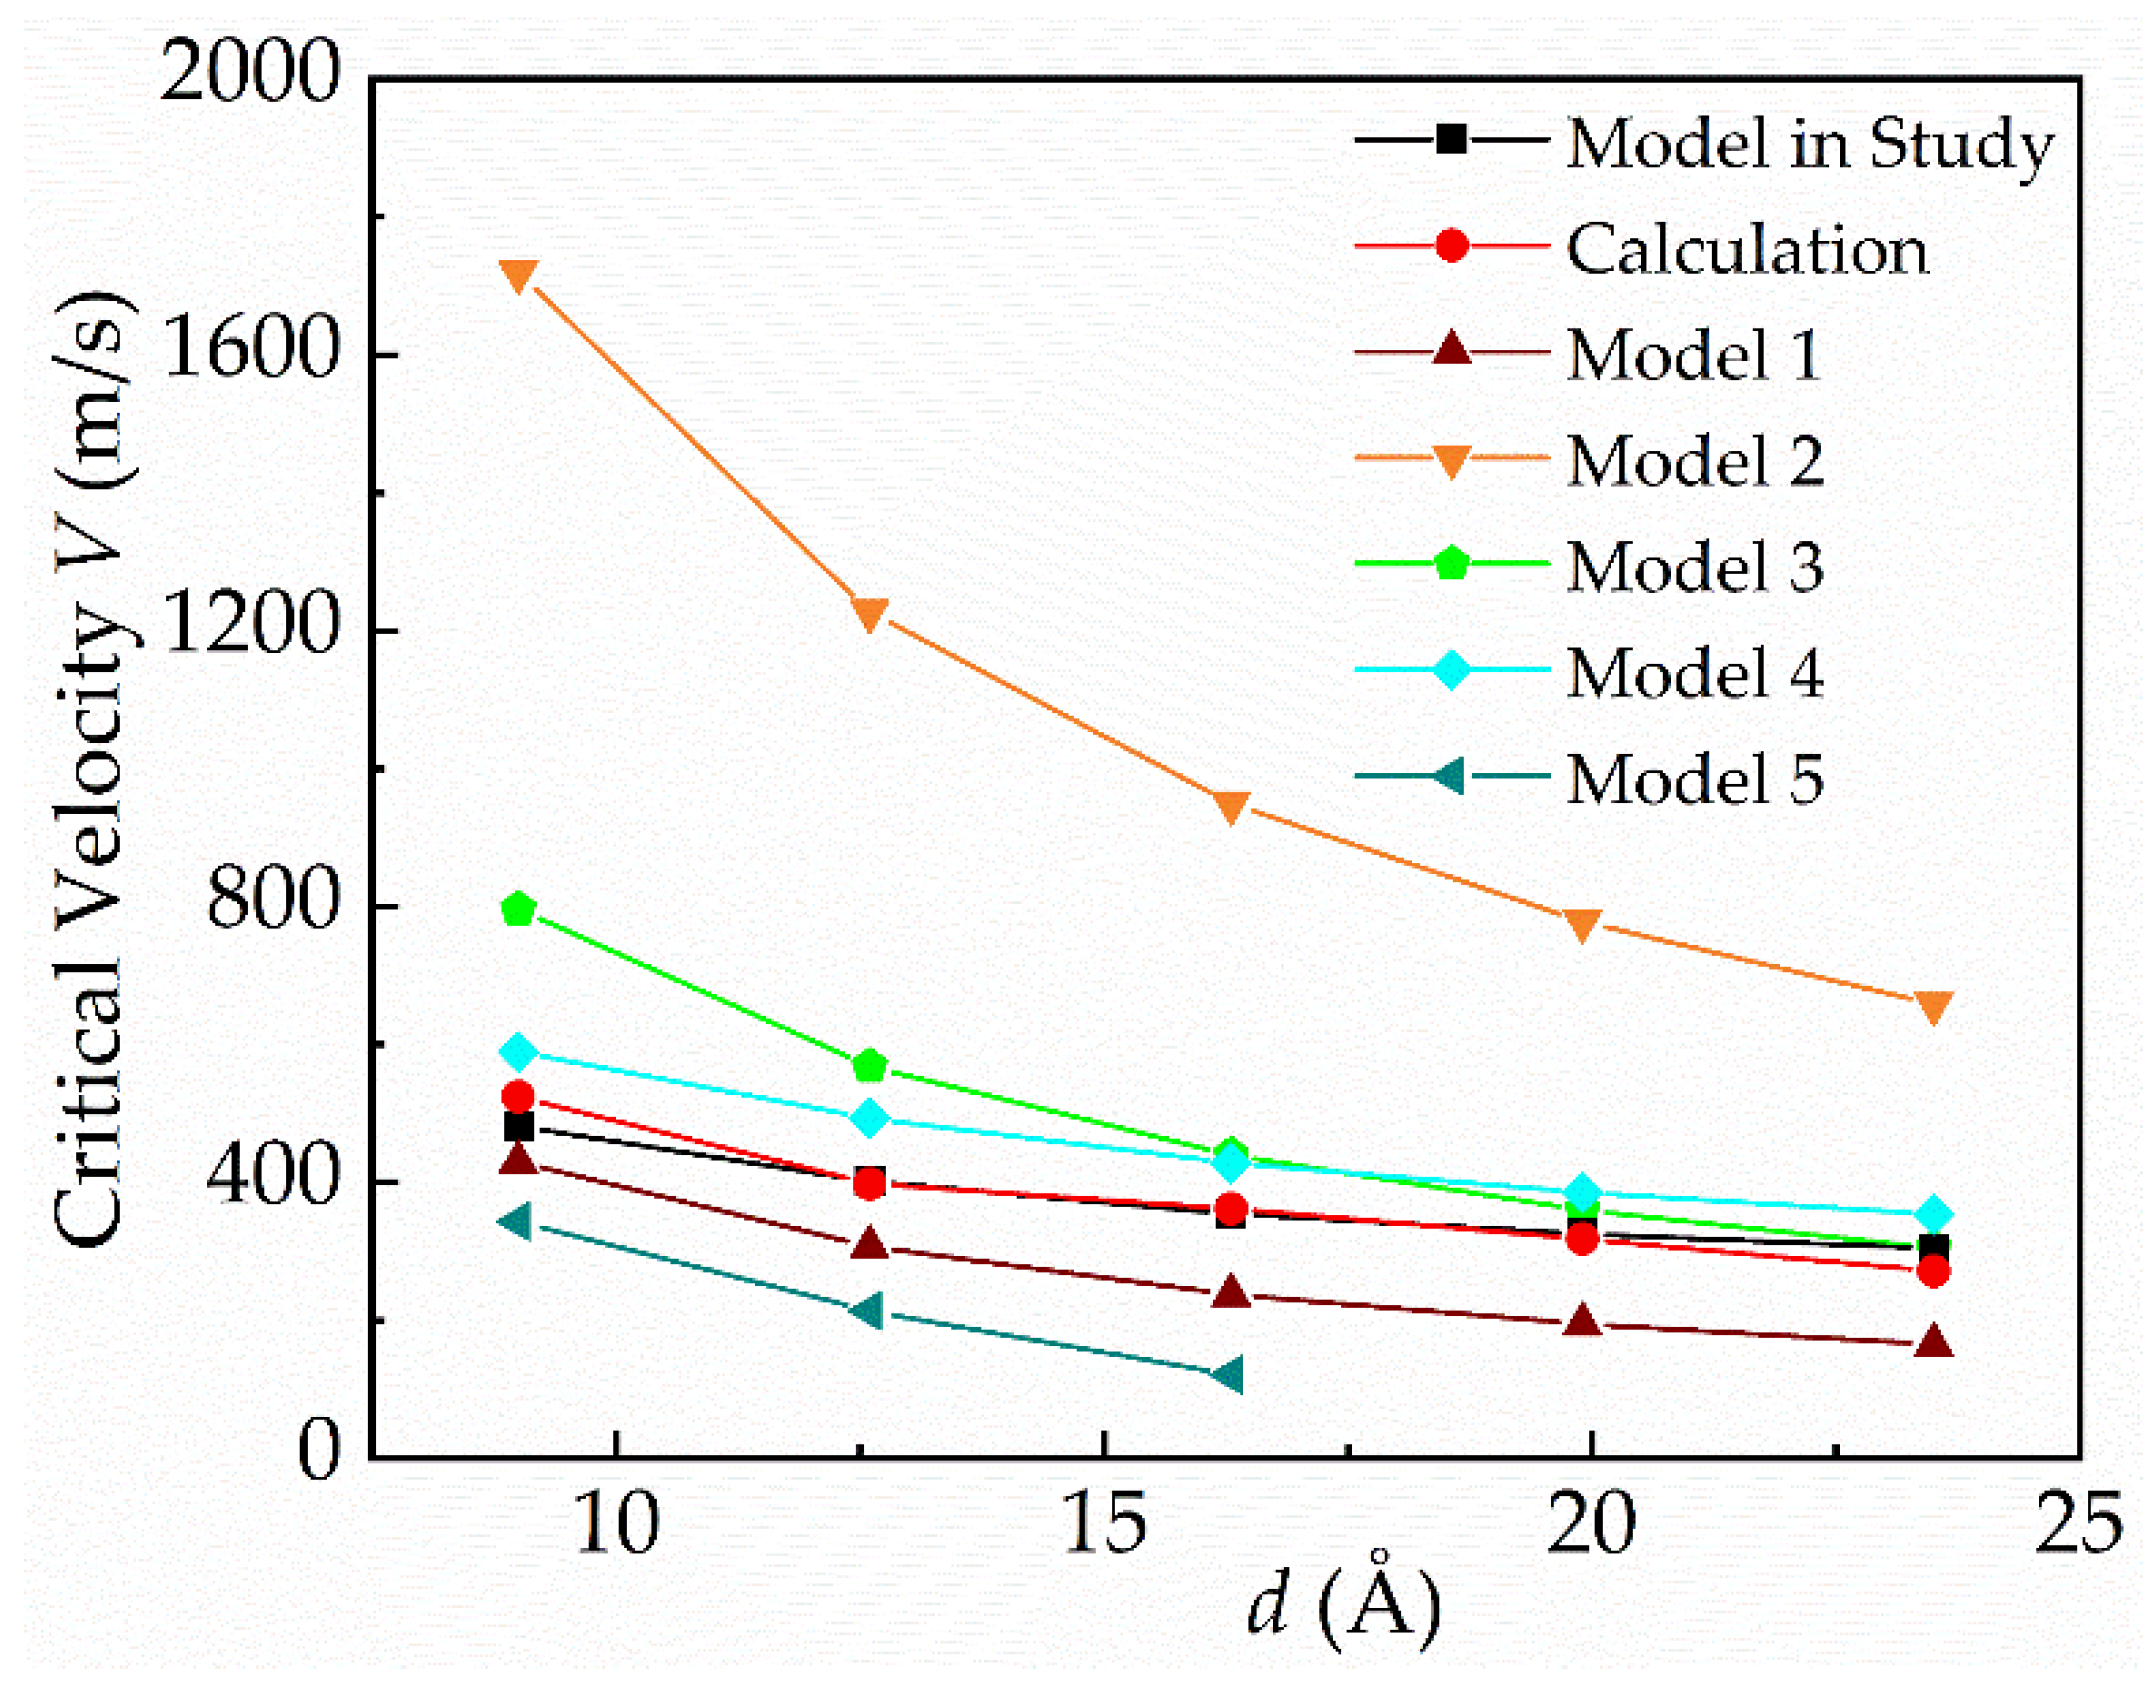
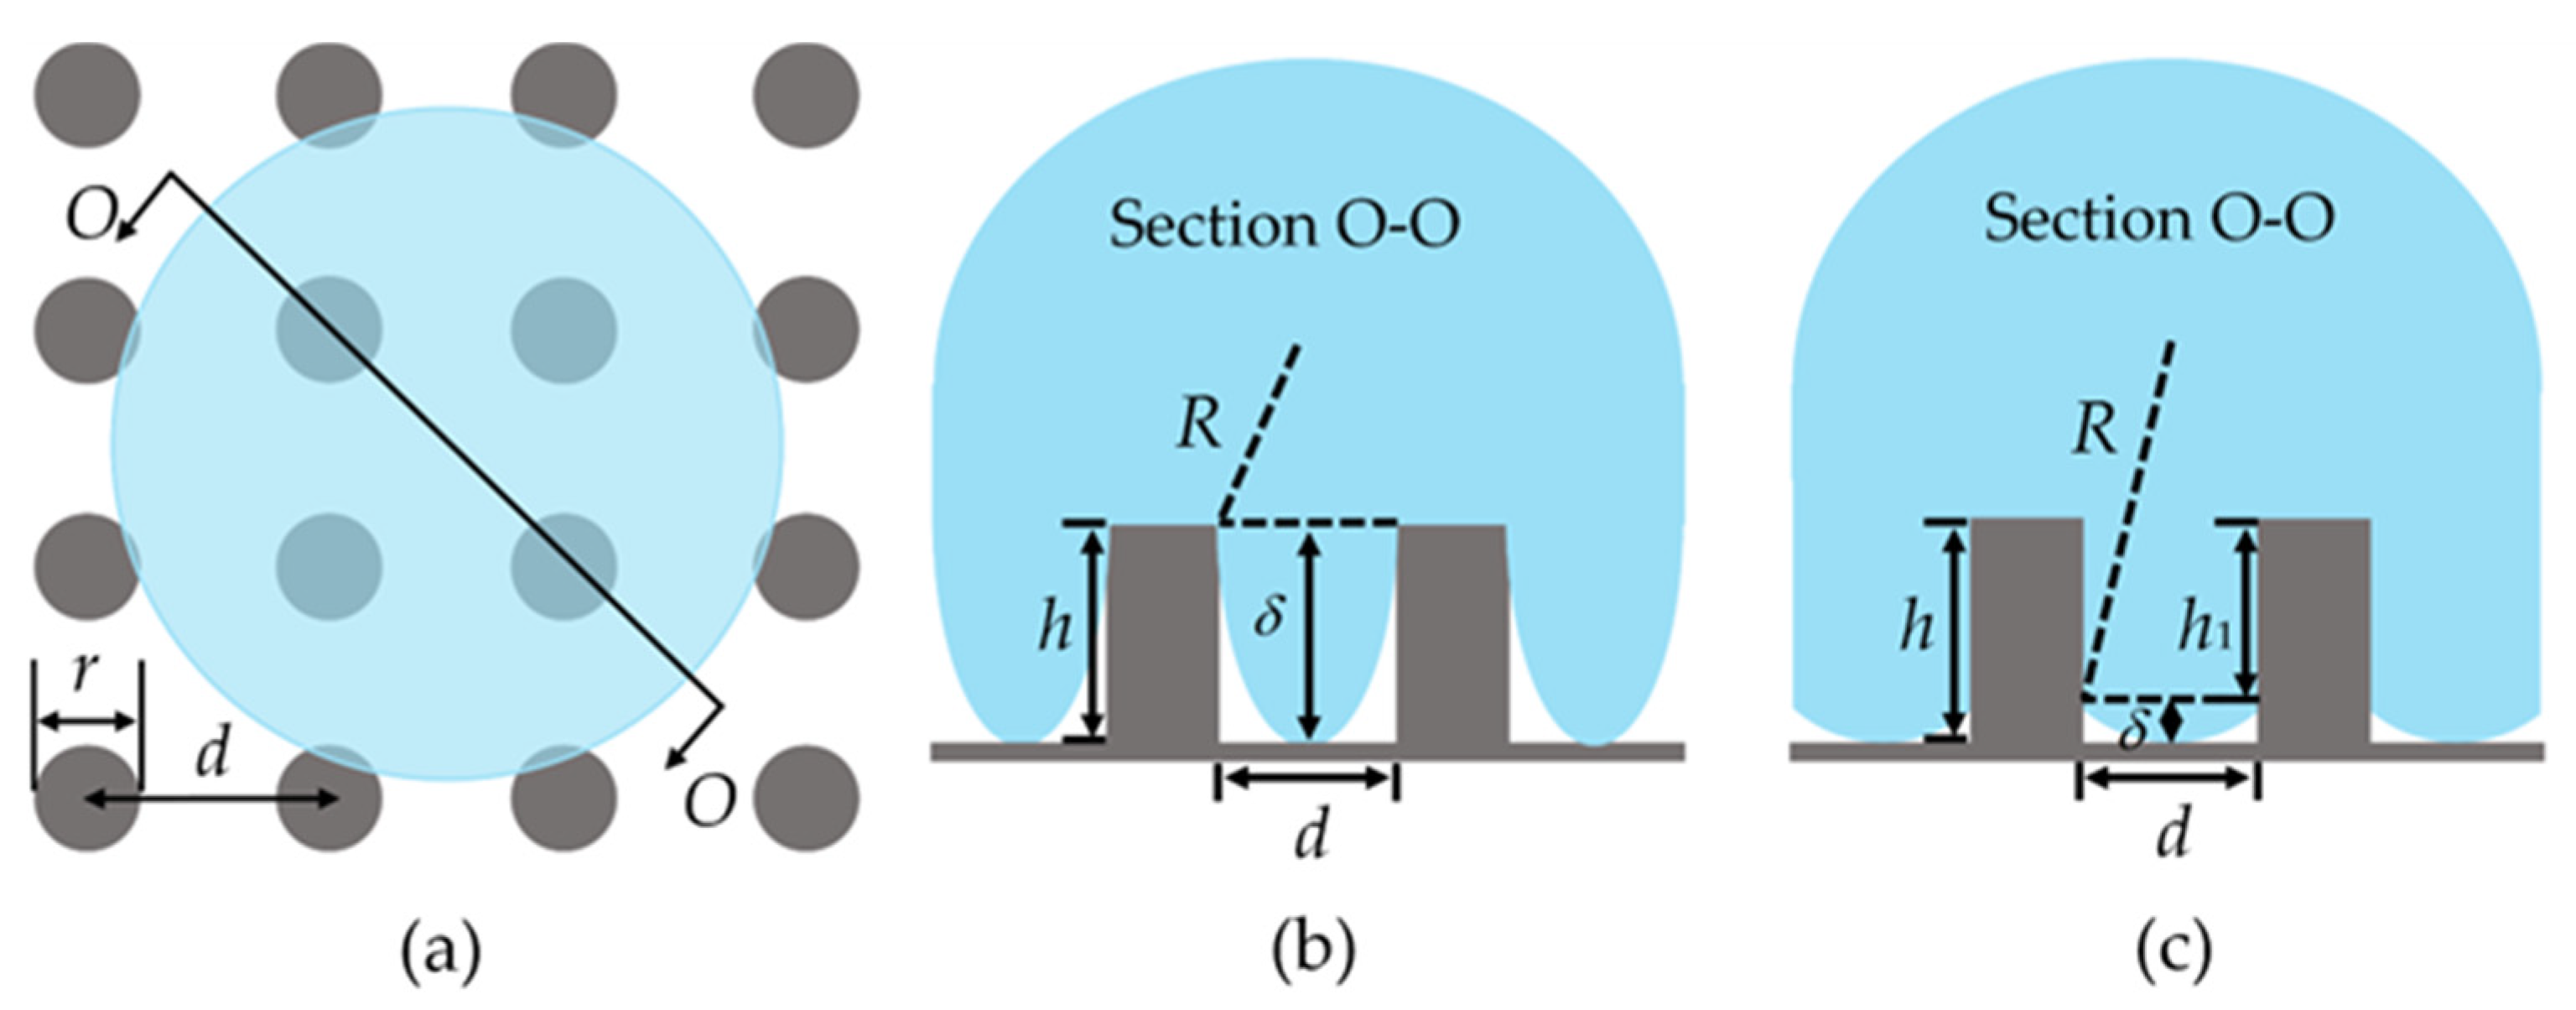
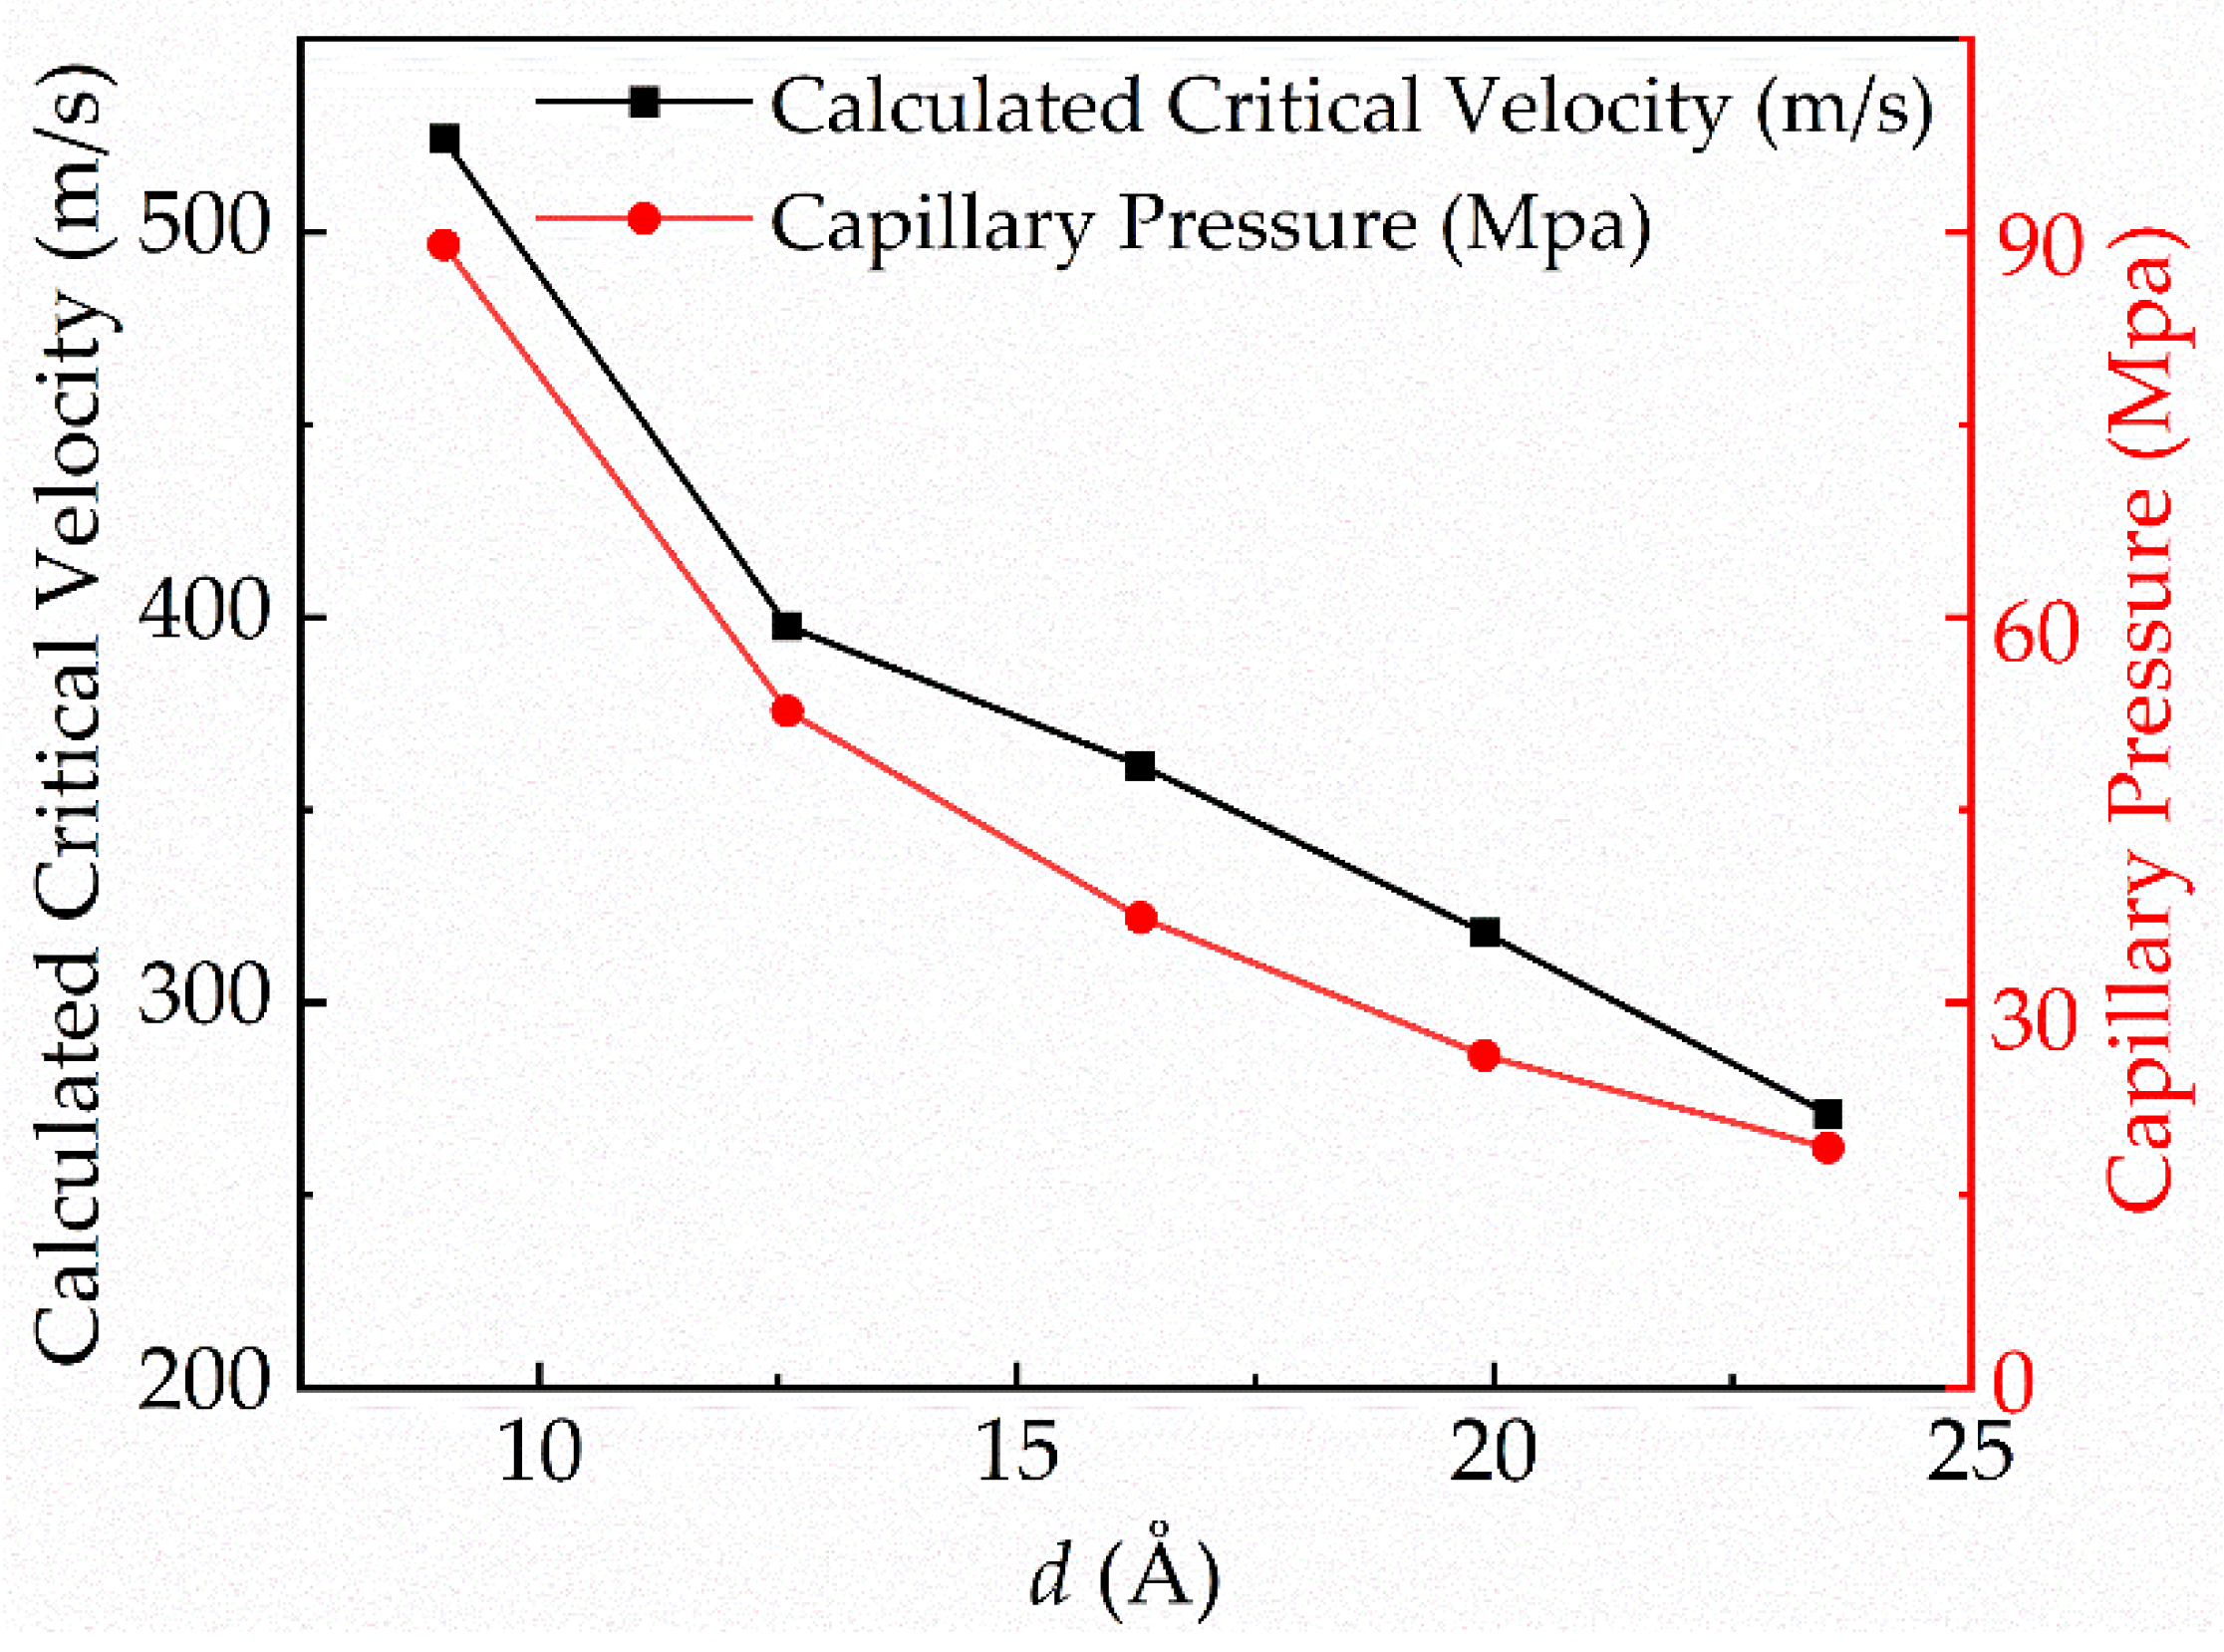
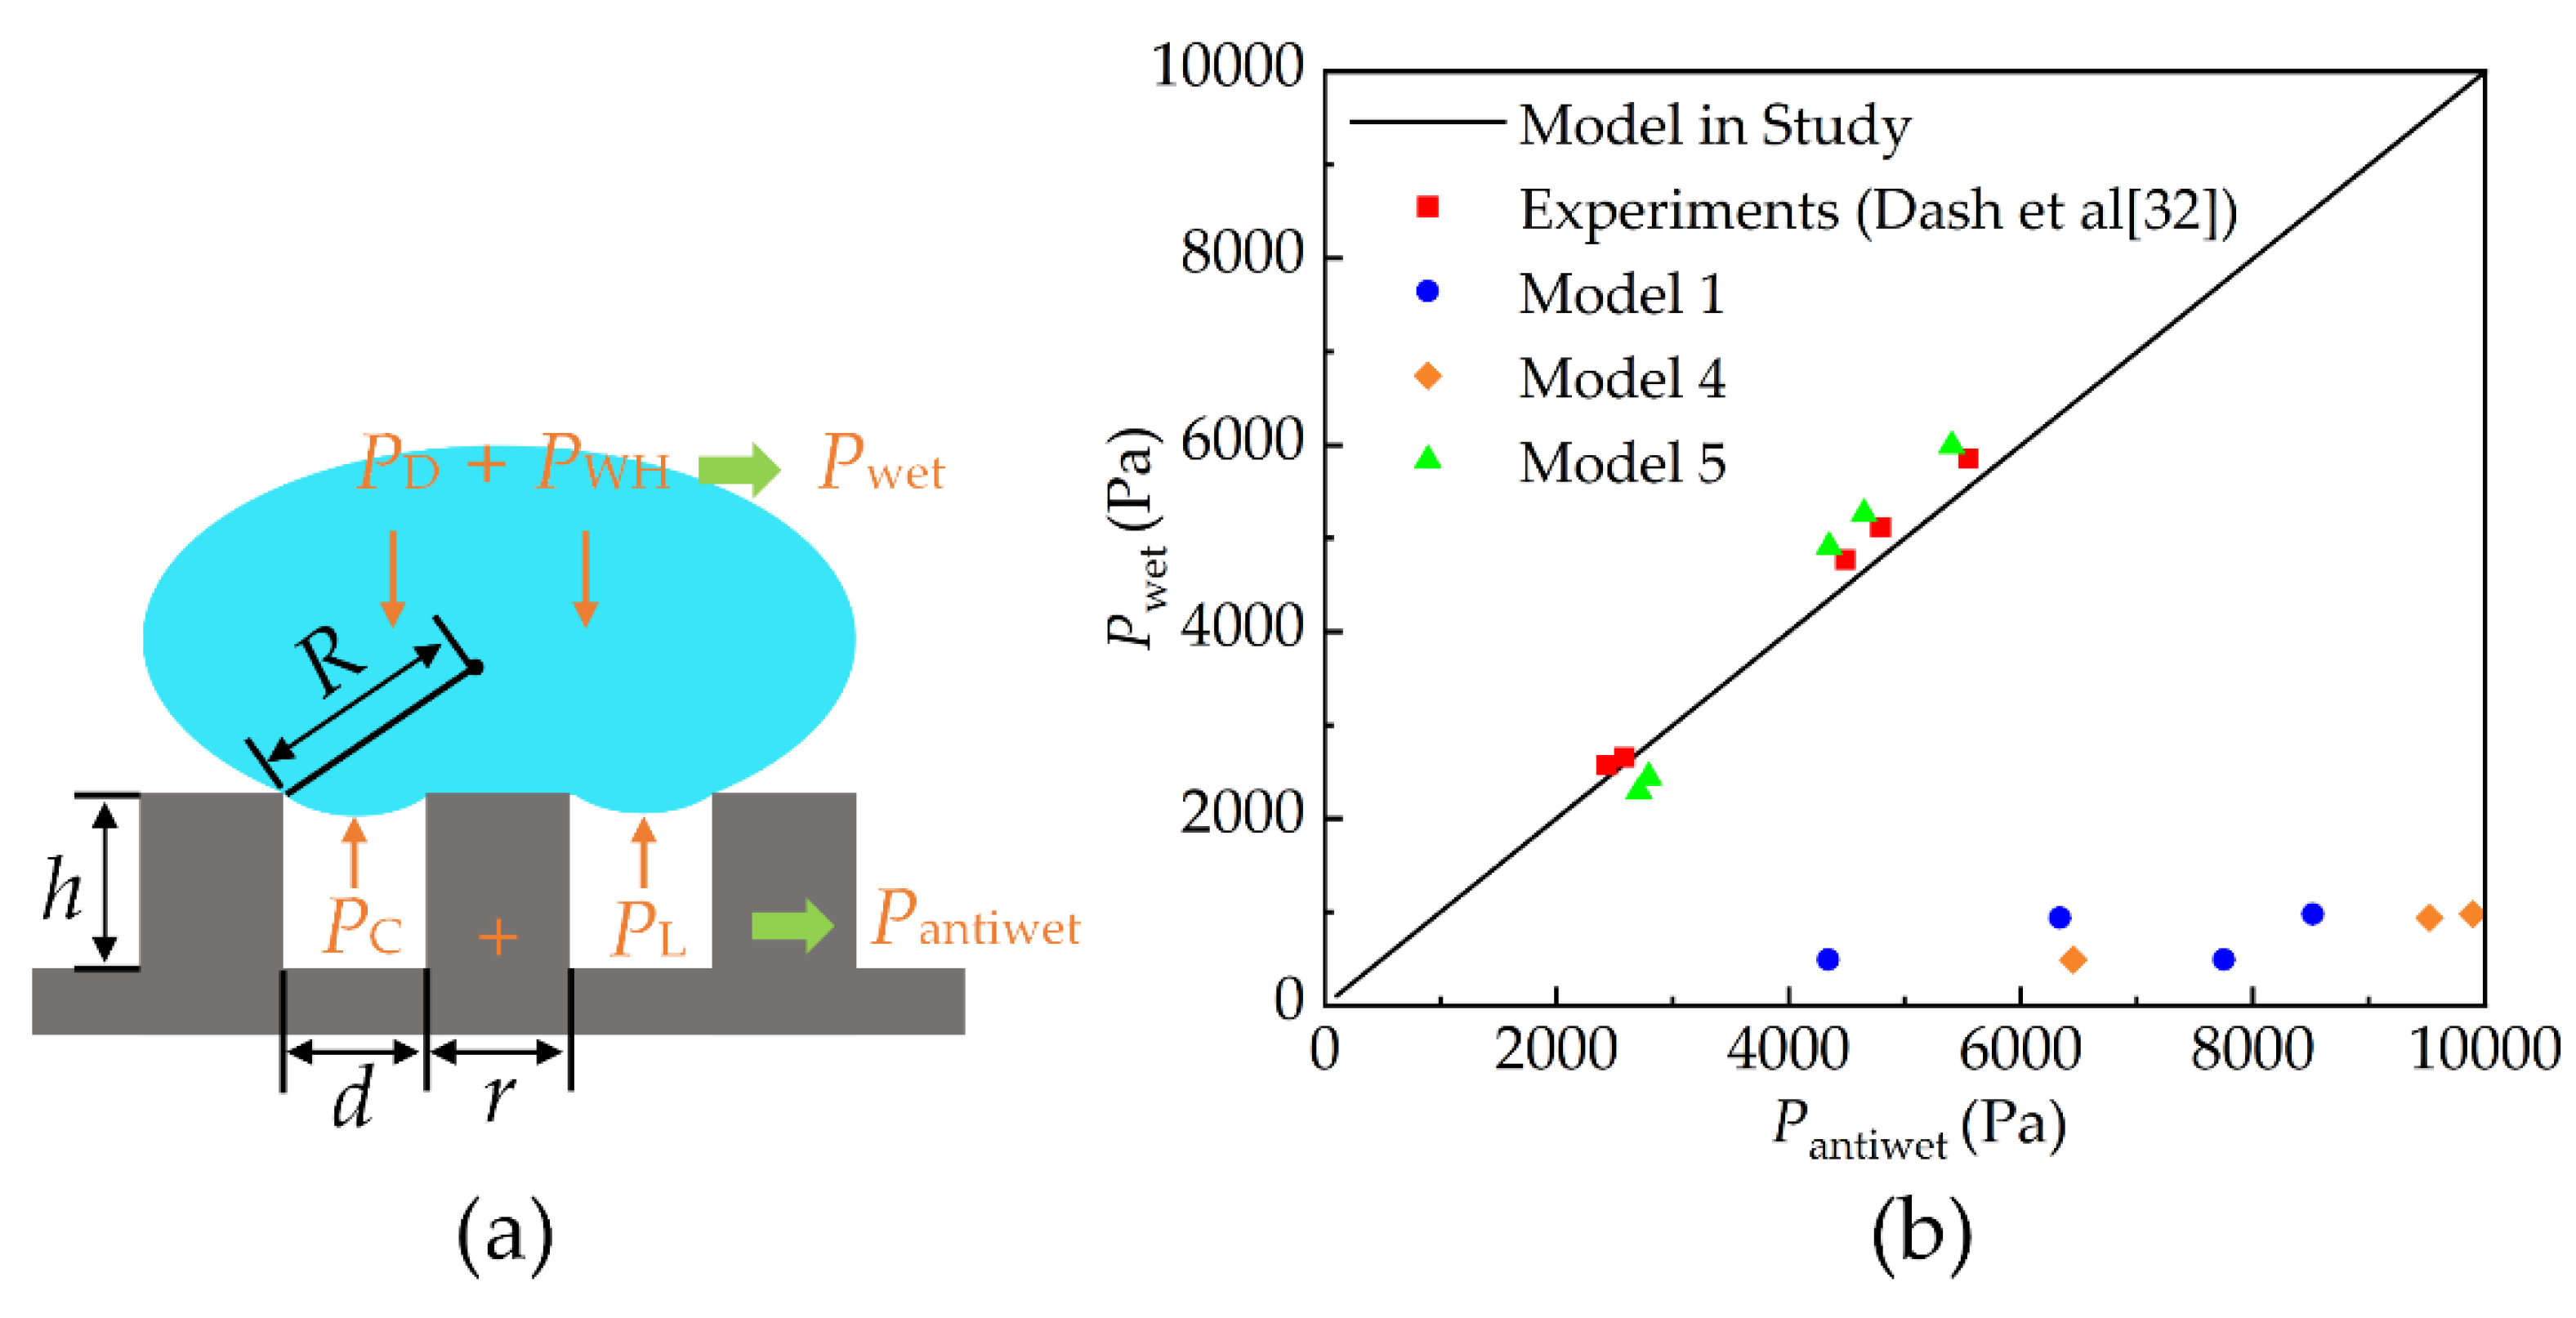
3.3. Components Critical Velocity Prediction Model

It is well known that the water hammer pressure generated by high-speed impact and the dynamic pressure generated by inertial force are the wetting forces during the process of droplet impact on a superhydrophobic surface. Furthermore, the expressions of the dynamic pressure and the water hammer pressure are
P D = 0.5 ρ V 2 ,
P WH = k ρ C V ,
where k is the coefficient of the water hammer pressure (obtained using k = 0.003 in Ref. [34]), ρ is the density of the impact droplet (obtained using ρ = 0.997 g/m3 in Ref. [35]), and C is the sound velocity in the liquid (obtained using C = 1497 m/s in Ref. [36]). In previous experiments, it was found that the action time of the water hammer pressure was shorter, but the magnitude of the water hammer pressure was much larger than that of dynamic pressure [10]. However, the maximum wetting depth of droplet impact on the surface can also be achieved in a short time [37]. Therefore, the water hammer pressure should not be neglected due to the short action time. In addition, the capillary pressure and the Laplace pressure are the anti-wetting forces. However, whether the capillary pressure or the Laplace pressure is used as the anti-wetting force, the mechanical equilibrium system is incomplete. It shows that considering the capillary pressure (the Laplace pressure) as the anti-wetting force alone means that the change in the droplet radius (the surface parameters) is independent of the anti-wetting force and the critical velocity of the C-W transition of the droplet based on Equations (3) and (4). This is contrary to some reports [31,33] and the calculation results in this paper.
Figure 9 shows the comparison of the critical velocity between the calculations in this paper and the predicted values of the five existing models, as shown in Table 3. “Model in study” presents the theoretical values of the model proposed in this study, and “Calculation” presents the calculated values by the MD method in Figure 9. The results show a significant difference. It is worth noting that model 1 and model 4 show a similar trend to the calculated results. Model 1 is established based on the competition between the dynamic pressure and the Laplace pressure. It causes that the predicted values of model 1 to be smaller than the calculations due to neglecting the capillary pressure. For model 4, the height of the protrusion structure is considered in the calculation of the capillary pressure, which results in the capillary pressure in model 4 being larger than the calculated value. Therefore, its predicted critical velocity values are larger than the calculated results. Compared with the calculation results, the model in this study has higher accuracy in predicting the critical velocity, with a maximum error of 12%.
Thus, the critical velocity prediction model of the C-W transition of the droplet was established based on the mechanical equilibrium system of P D + P WH = P C + P L in this paper (PD is the dynamic pressure, PWH is the water hammer pressure, PC is the capillary pressure, and PL is the Laplacian pressure), as shown in Figure 10a, and the expression is
V = k 2 C 2 + 4 γ lv ρ R 8 γ lv cos θ ϕ ρ r ( 1 ϕ ) k C ,
Figure 10b compares the balance of wetting pressure and anti-wetting pressure between the prediction models and the experimental data in Ref. [32]. It must be noted that not all models include the dynamic pressure, the water hammer pressure, the capillary pressure, and the Laplace pressure, but these models are based on a balance between the wetting force and resistance to wetting. The model proposed in this paper shows better agreement with the experimental data. Therefore, the critical velocity prediction model is applicable at the macroscale. However, the model can predict the critical velocity only when the contact angle of a droplet on the surface is known in practice. The most common method of obtaining the contact angle is test measurement, which is very troublesome. Fortunately, MD simulation can be employed to measure the contact angle of the droplet on the surface, which is consistent with the material and the solid area fraction ( ϕ ) of the macroscopic surface. As proposed by Cassie in the study of surface wetting [38], the contact angle of the droplet on a rough surface is unchanged when the material and the solid area fraction of the surface remain unchanged. Therefore, it is feasible to measure the contact angle of a droplet on a macroscopic surface using MD simulation and calculate the critical velocity according to Equation (7). In other words, the correlation between the simulation at the nanoscale and the evaluation of the macroscopic surface properties are valid.
Based on the model and the correlation, the transformation relationship between the macroscopic test and micro-nano-scale mechanism of the studies of the wetting behavior of a droplet on a surface and the coupling relationship between molecular-scale calculation mechanism and macroscopic experimental performance were realized, and the wettability evaluation method of a macroscopic surface based on the molecular simulation mechanism was presented. By predicting the critical velocity, the wetting resistance of superhydrophobic surfaces can be rapidly evaluated. In addition, the impact velocity of pollutants on the surface of different applications is different in different environments, and this model can provide a theoretical basis for the design of superhydrophobic surfaces for different applications.
However, it must be noted that this model can only be applied to surfaces with symmetric structures. When a droplet impacts an asymmetric surface, the capillary pressure will change with the location of the droplet impact, which is the factor that cannot be calculated by this model.

4. Conclusions

In this paper, the effect of the nanopillar spacing and the droplet radius on the critical velocity of the C-W transition of the droplet was examined. In addition, the critical velocity prediction model was proposed based on the mechanical equilibrium system of the C-W transition of the droplet. The study conclusions are as follows:
  • The capillary pressure and the Laplace pressure should be considered in the calculation of the critical velocity of the C-W transition of the droplet. Furthermore, a critical velocity prediction model was proposed based on the mechanical equilibrium system including the capillary pressure and the Laplace pressure. The model can predict the critical velocity more accurately and be applied across scales.
  • The correlation between the simulation at the nanoscale and the evaluation of the macroscopic symmetrical protrusion surface properties were presented. This correlation can be used to guide the parameters set in the MD simulation.
  • This study established a method to directly evaluate the wettability of a surface based on the results of the MD simulation and has practical application value for the design and research of superhydrophobic surfaces.

Author Contributions

Conceptualization, Z.W. and Z.Z.; methodology, Y.L. and X.L.; software, S.C.; validation, Z.W. and S.C.; investigation, Z.W.; resources, Y.L. and Z.Z.; data curation, X.T.; writing—original draft preparation, Z.W., Z.Z. and X.T.; writing—review and editing, Z.W., X.L. and S.C.; visualization, S.C. All authors have read and agreed to the published version of the manuscript.

Funding

This research was funded by the National Natural Science Foundation of China, grant number 12072213, the National Science and Technology Major Project, grant number J2019-III-0010-0054, and the National Numerical Windtunnel, grant number NNW2019-JT01-023, Open Project of Key Laboratory of Icing and Anti/De-icing, grant number IDAL202001.

Institutional Review Board Statement

Not applicable.

Informed Consent Statement

Not applicable.

Data Availability Statement

Not applicable.

Acknowledgments

I am grateful to Zhihong Zhou, Yingqi Li, Xiao Li, Xiaobao Tian, and Shaohan Cui for their strong support.

Conflicts of Interest

The authors declare no conflict of interest.

References

  1. Li, X.M.; Reinhoudt, D.; Crego-Calama, M. What Do We Need for a Superhydrophobic Surface? A Review on the Recent Progress in the Preparation of Superhydrophobic Surfaces. Chem. Soc. Rev. 2007, 38, 1350–1368. [Google Scholar] [CrossRef] [PubMed]
  2. Geyer, F.; D’Acunzi, M.; Sharifi-Aghili, A.; Saal, A.; Gao, N.; Kaltbeitzel, A.; Sloot, T.; Berger, R.; Butt, H.J.; Vollmer, D. When and how self-cleaning of superhydrophobic surfaces works. Sci Adv 2020, 6, eaaw9297. [Google Scholar] [CrossRef] [PubMed]
  3. Reyssat, M.; Pépin, A.; Marty, F.; Chen, Y.; Quéré, D. Bouncing transitions on microtextured materials. EPL 2006, 74, 306–312. [Google Scholar] [CrossRef]
  4. Yasmeen, S.; Yoon, J.; Moon, C.H.; Khan, R.; Gaiji, H.; Shin, S.; Oh, I.; Lee, H. Self-Formation of Superhydrophobic Surfaces through Interfacial Energy Engineering between Liquids and Particles. Langmuir 2021, 37, 5356–5363. [Google Scholar] [CrossRef] [PubMed]
  5. Zhang, X.; Liu, X.; Wu, X.; Min, J.C. Impacting-freezing dynamics of a supercooled water droplet on a cold surface: Rebound and adhesion. Int. J. Heat Mass Transf. 2020, 158, 119997. [Google Scholar] [CrossRef]
  6. Morita, K.; Kimura, S.; Sakaue, H. Hybrid System Combining Ice-Phobic Coating and Electrothermal Heating for Wing Ice Protection. Aerospace 2020, 7, 102. [Google Scholar] [CrossRef]
  7. Dalili, N.; Edrisy, A.; Carriveau, R. A review of surface engineering issues critical to wind turbine performance. Renew. Sust. Energ. Rev. 2009, 13, 428–438. [Google Scholar] [CrossRef]
  8. Bergin, M.H.; Ghoroi, C.; Dixit, D.; Schauer, J.J.; Shindell, D.T. Large Reductions in Solar Energy Production Due to Dust and Particulate Air Pollution. Env. Sci. Tech. Let. 2017, 4, 339–344. [Google Scholar] [CrossRef]
  9. Bartolo, D.; Bouamrirene, F.; Verneuil, É.; Buguin, A.; Silberzan, P.; Moulinet, S. Bouncing or sticky droplets: Impalement transitions on superhydrophobic micropatterned surfaces. EPL 2006, 74, 299–305. [Google Scholar] [CrossRef]
  10. Jung, Y.C.; Bhushan, B. Dynamic Effects of Bouncing Water Droplets on Superhydrophobic Surfaces. Langmuir 2008, 24, 6262–6269. [Google Scholar] [CrossRef]
  11. Liu, T.Q.; Li, Y.J.; Li, X.Q.; Sun, W. Theoretical analysis of droplet transition from Cassie to Wenzel state. Chin. Phys. B 2015, 24, 116801. [Google Scholar] [CrossRef]
  12. Shi, S.; Lv, C.; Zheng, Q. Drop Impact on Two-Tier Monostable Superrepellent Surfaces. ACS Appl. Mater. Interfaces 2019, 11, 43698–43707. [Google Scholar] [CrossRef] [PubMed]
  13. Malla, L.K.; Patil, N.D.; Bhardwaj, R.; Neild, A. Droplet Bouncing and Breakup during Impact on a Microgrooved Surface. Langmuir 2017, 33, 9620–9631. [Google Scholar] [CrossRef] [PubMed]
  14. Wang, L.Z.; Zhou, A.; Zhou, J.Z.; Chen, L.; Yu, Y.S. Droplet impact on pillar-arrayed non-wetting surfaces. Soft Matter 2021, 17, 5932–5940. [Google Scholar] [CrossRef]
  15. Lv, S.H.; Yang, Z.; Duan, Y.Y. Retraction kinetics of impacting nanodroplets on hydrophobic surfaces: A molecular dynamics simulation study. J. Mol. Liq. 2021, 341, 116936. [Google Scholar] [CrossRef]
  16. Karplus, M.; McCammon, J.A. Molecular dynamics simulations of biomolecules. Nat. Struct. Biol. 2002, 9, 646–652. [Google Scholar] [CrossRef]
  17. Ambrosia, M.S.; Ha, M.Y.; Balachandar, S. The effect of pillar surface fraction and pillar height on contact angles using molecular dynamics. Appl. Surf. Sci. 2013, 282, 211–216. [Google Scholar] [CrossRef]
  18. Wang, L.W.; Zhang, R.; Zhang, X.W.; Hao, P.F. Numerical simulation of droplet impact on textured surfaces in a hybrid state. Microfluid. Nanofluid. 2017, 21, 61. [Google Scholar] [CrossRef]
  19. Di, J.W.; Yang, Z.; Duan, Y.Y. Molecular dynamics simulation of nanosized water droplet spreading on chemically heterogeneous surfaces. Langmuir 2019, 9, 125105. [Google Scholar] [CrossRef]
  20. Hiratsuka, M.; Emoto, M.; Konno, A.; Ito, S. Molecular Dynamics Simulation of the Influence of Nanoscale Structure on Water Wetting and Condensation. Micromachines 2019, 10, 587. [Google Scholar] [CrossRef] [Green Version]
  21. Kurt, K.; Gary, S.G. Dynamics of entangled linear polymer melts: A molecular-dynamics simulation. J. Chem. Phys. 1990, 92, 5057–5086. [Google Scholar] [CrossRef]
  22. Fan, J.C.; Wang, F.C.; Chen, J.; Zhu, Y.B.; Lu, D.T.; Liu, H.; Wu, H.A. Molecular mechanism of viscoelastic polymer enhanced oil recovery in nanopores. Roy. Soc. Open Sci. 2018, 5, 180076. [Google Scholar] [CrossRef] [PubMed]
  23. Chen, H.; Nie, Q.C.; Fang, H.S. Many-body dissipative particle dynamics simulation of Newtonian and non-Newtonian nanodroplets spreading upon flat and textured substrates. Appl. Surf. Sci. 2020, 519, 146250. [Google Scholar] [CrossRef]
  24. de Ruijter, M.J.; Blake, T.D.; De Coninck, J. Dynamic Wetting Studied by Molecular Modeling Simulations of Droplet Spreading. Langmuir 1999, 15, 7836–7847. [Google Scholar] [CrossRef]
  25. Theodorakis, P.E.; Amirfazli, A.; Hu, B.; Che, Z.Z. Droplet Control Based on Pinning and Substrate Wettability. Langmuir 2021, 37, 4248–4255. [Google Scholar] [CrossRef]
  26. Li, Z.; Liao, K.; Liao, F.Y.; Xiao, Q.X.; Jiang, F.; Zhang, X.R.; Liu, B.; Sun, C.Y.; Chen, G.J. Wetting and Spreading Behaviors of Nanodroplets: The Interplay Among Substrate Hydrophobicity, Roughness, and Surfactants. J. Phy. Chem. C 2016, 120, 15209–15215. [Google Scholar] [CrossRef]
  27. Maroo, S.C.; Chung, J.N. Nano-Droplet Impact on a Homogenous Surface Using Molecular Dynamics. In Proceedings of the ASME 2008 3rd Energy Nanotechnology International Conference Collocated with the Heat Transfer, Fluids Engineering, and Energy Sustainability Conferences, Jacksonville, FL, USA, 5 June 2008; pp. 113–121. [Google Scholar]
  28. Nair, A.R.; Sathian, S.P. A molecular dynamics study to determine the solid-liquid interfacial tension using test area simulation method (TASM). J. Chem. Phys. 2012, 137, 084702. [Google Scholar] [CrossRef]
  29. Thompson, A.P.; Aktulga, H.M.; Berger, R.; Bolintineanu, D.S.; Brown, W.M.; Crozier, P.S.; in ’t Veld, P.J.; Kohlmeyer, A.; Moore, S.G.; Nguyen, T.D.; et al. LAMMPS—A flexible simulation tool for particle-based materials modeling at the atomic, meso, and continuum scales. Comput. Phys. Commun. 2022, 271, 108171. [Google Scholar] [CrossRef]
  30. Hu, H.B.; Chen, L.B.; Bao, L.Y.; Huang, S.H. Molecular dynamics simulations of the nano-droplet impact process on hydrophobic surfaces. Chin. Phys. B 2014, 23, 074702. [Google Scholar] [CrossRef]
  31. Hu, A.J.; Liu, D. 3D simulation of micro droplet impact on the structured superhydrophobic surface. Int. J. Multiphas. Flow 2022, 147, 103887. [Google Scholar] [CrossRef]
  32. Dash, S.; Alt, M.T.; Garimella, S.V. Hybrid surface design for robust superhydrophobicity. Langmuir 2012, 28, 9606–9615. [Google Scholar] [CrossRef]
  33. Thanh-Vinh, N.; Isao, S. Maximum Pressure Caused by Droplet Impact is Dependent on the Droplet Size. In Proceedings of the IEEE 2019 20th International Conference on Solid-State Sensors, Actuators and Microsystems & Eurosensors XXXIII, Berlin, Germany, 23 June 2019; pp. 813–816. [Google Scholar]
  34. Dae, H.K.; Sang, J.L. Impact and wetting behaviors of impinging microdroplets on superhydrophobic textured surfaces. Appl. Phys. Lett. 2012, 100, 171601. [Google Scholar] [CrossRef]
  35. Koishi, T.; Kenji, Y.; Shigenori, F.; Toshikazu, E.; Zeng, X.C. Coexistence and transition between Cassie and Wenzel state on pillared hydrophobic surface. Proc. Natl. Acad. Sci. USA 2009, 106, 8435–8440. [Google Scholar] [CrossRef] [PubMed]
  36. Martin, K.; Spinks, D. Measurement of the speed of sound in ethanol/water mixtures. Ultrasound Med. Biol. 2001, 27, 289–291. [Google Scholar] [CrossRef]
  37. Khojasteh, D.; Kazerooni, M.; Salarian, S.; Kamali, R. Droplet impact on superhydrophobic surfaces: A review of recent developments. J. Ind. Eng. Chem. 2016, 42, 1–14. [Google Scholar] [CrossRef]
  38. Cassie, A.B.D.; Baxter, S. Wettability of porous surfaces. Trans. Faraday. Soc. 1944, 40, 546–551. [Google Scholar] [CrossRef]
Figure 1. The Cassie state and Wenzel state of a droplet on a pillared surface.
Symmetry 14 01891 g001
Figure 2. Diagram of meniscus height of the droplet: (a) Section position diagram; (b) the theoretical model by Jung [10]; (c) the theoretical model by Wang [14].
Symmetry 14 01891 g002
Figure 3. The three−dimensional droplet impact model.
Symmetry 14 01891 g003
Figure 4. Measurement results and statistical errors of the contact angles of the droplet on the surface with different nanopillar spacing.
Symmetry 14 01891 g004
Figure 5. Comparison of the impact process for different nanopillar spacing: (a) 9.0 Å; (b) 12.6 Å; (c) 16.2 Å; (d) 19.8 Å; (e) 23.5 Å.
Symmetry 14 01891 g005
Figure 6. Curves of the critical velocity and capillary pressure with pillar spacing.
Symmetry 14 01891 g006
Figure 7. Comparison of the impact process for different droplet radius: (a) 24 Å; (b) 31 Å; (c) 37 Å; (d) 41 Å; (e) 45 Å.
Symmetry 14 01891 g007
Figure 8. Curves of the critical velocity, Laplace pressure, and capillary pressure with droplet radius.
Symmetry 14 01891 g008
Figure 9. Comparison of the critical velocity between the calculated results and the predicted values of each model.
Symmetry 14 01891 g009
Figure 10. (a) Schematic diagram of mechanical equilibrium mechanism of droplet wetting surface; (b) comparison of the balance of wetting pressure and anti-wetting pressure between the prediction models and the experiment data in Ref. [32].
Symmetry 14 01891 g010
Table 1. The parameters of surfaces.
CasePillar Width r (Å)Pillar Spacing d (Å) Solid   Area   Fraction   ϕ Contact   Angle   θ
110.8 Å9.0 Å0.29160
210.8 Å12.6 Å0.21155
310.8 Å16.2 Å0.16152
410.8 Å19.8 Å0.12151
510.8 Å23.5 Å0.09150.5
Table 2. The parameters of surfaces and droplets.
CaseNumber of AtomsDroplet Radius R (Å)
620024
740031
860037
980041
10200045
Table 3. Existing models for the critical velocity V based on impact parameters.
ModelModel ExpressionReference
1 V = γ lv h / ρ d 2 Reyssat et al. [3]
2 V = 16 γ lv h / ρ d 2 Jung et al. [9]
3 V = 16 γ lv ( h h 1 ) / ρ d 2 Wang et al. [10]
4 V = 4 γ lv ( r + h ) cos θ Y / ρ b h Shi et al. [13]
5 0.5 ρ V 2 + k ρ C V + 2 γ lv / R = 4 γ lv cos θ Y ϕ / r ( 1 ϕ ) Hu et al. [31]
Publisher’s Note: MDPI stays neutral with regard to jurisdictional claims in published maps and institutional affiliations.

