Article

An Improved Three-Way K-Means Algorithm by Optimizing Cluster Centers

1
School of Computer, Jiangsu University of Science and Technology, Zhenjiang 212003, China
2
School of Science, Jiangsu University of Science and Technology, Zhenjiang 212003, China
*
Author to whom correspondence should be addressed.
Symmetry 2022, 14(9), 1821; https://doi.org/10.3390/sym14091821
Submission received: 20 July 2022 / Revised: 22 August 2022 / Accepted: 24 August 2022 / Published: 2 September 2022
(This article belongs to the Special Issue Recent Advances in Granular Computing for Intelligent Data Analysis)

Abstract

:
Most of data set can be represented in an asymmetric matrix. How to mine the uncertain information from the matrix is the primary task of data processing. As a typical unsupervised learning method, three-way k-means clustering algorithm uses core region and fringe region to represent clusters, which can effectively deal with the problem of inaccurate decision-making caused by inaccurate information or insufficient data. However, same with k-means algorithm, three-way k-means also has the problems that the clustering results are dependent on the random selection of clustering centers and easy to fall into the problem of local optimization. In order to solve this problem, this paper presents an improved three-way k-means algorithm by integrating ant colony algorithm and three-way k-means. Through using the random probability selection strategy and the positive and negative feedback mechanism of pheromone in ant colony algorithm, the sensitivity of the three k-means clustering algorithms to the initial clustering center is optimized through continuous updating iterations, so as to avoid the clustering results easily falling into local optimization. Dynamically adjust the weights of the core domain and the boundary domain to avoid the influence of artificially set parameters on the clustering results. The experiments on UCI data sets show that the proposed algorithm can improve the performances of three-way k-means clustering results and is effective in revealing cluster structures.

1. Introduction

Rapid developments of science and technology produce a large number of data anytime and anywhere in modern society. How to mine valuable information from massive data has been a challenging task of information science and artificial intelligence. As one emerging technology of intelligence information processing, granular computing [1,2] deals with information in the form of some aggregates and their processing. The main task of granular computing is to construct different granular structures by various methods of information granulation [3]. There are many different approaches of information granulation, among which, clustering analysis is one of the widely and most used one [4]. Clustering analysis [5] is a multivariate analysis method in statistics. The objective of clustering is to divide a set of objects into different groups such that the objects in the same cluster have high similarity while the objects in the different groups have high dissimilarity. As a powerful data analysis technique, clustering has been widely used information granulation [6,7,8], information fusion [9,10,11], attribute reduction [12,13,14,15], feature selection [16,17,18], and other fields.
There are many different clustering algorithms, among which, k-means [19] is one of the most commonly used one. The object of k-means algorithm is to minimize the following function,
J = m i n j = 1 k v i C j | | v i μ j | | 2 ,
where | | v i μ j | | is a chosen distance measure between a data point v i and the cluster centre μ j of j-th cluster. The process of k-means has three steps. The first one is to randomly select k samples as the initial cluster centers, the second one is to calculate the distance between each sample and cluster center, and the third one is to assign the samples to the nearest cluster. The process is repeated by continuously updating the iterative cluster centers until a certain termination condition is met. Although k-means algorithm has been widely used since it was proposed, it still has the following problems.
  • The clustering results of k-means are dependent on the random selection of clustering centers and the problem of local optimization readily occurs.
  • Traditional k-means algorithms are based on the assumption that a cluster is represented by one single set with a sharp boundary. Only two types of relationship between an object and cluster are considered, i.e., belong to and not belong to. The requirement for a sharp boundary is easily met for analytical clustering results, but may not adequately show the uncertainty information in the dataset.
To solve the above problems, many methods have been developed to improve the results of the k-means algorithm. For example, Zhang et al. [20] proposed an improved k-means algorithm based on a density canopy to solve the problem of determining the best initial seeds. Wang et al. [21] presented a three-way k-means algorithm by integrating three-way decisions [22,23] into clustering to depict the uncertainty information in the dataset. The main idea of the three-way k-means algorithm is to introduce fault-tolerant errors in the k-means iteration process, and represents the results of each cluster with a core region and a fringe region. However, in common with the k-means algorithm, the three-way k-means algorithm also has the problems that the clustering results are dependent on the random selection of clustering centers, are sensitive to noise points and outliers, and easily succumb to local optimization.
To solve the local optimal problem of the three-way k-means algorithm, this paper presents an improved three-way k-means algorithm by integrating the ant colony [24] algorithm into the k-means algorithm. The ant colony algorithm simulates the foraging behavior of ants in nature, and initially solved a problem of traveling salesmen by analogy with a pheromone mechanism. Its inspiration came from the behavior of ants in finding the shortest path in the process of looking for food. Compared with other clustering algorithms, the ant colony algorithm has the advantages of strong robustness, good parallelism, adaptability to computer systems, ease of combination with other algorithms and others.
The positive pheromone feedback mechanism in the ant colony algorithm can be transformed into a clustering problem. In the ant colony clustering algorithm, based on ant colony foraging behavior, food sources are regarded as different clustering centers, and data are regarded as ants with different attributes. Under the guidance of pheromones, ants move between different food sources with a certain probability, and finally form clustering results around different food sources. In the proposed algorithm, we use the random probability selection strategy of ant decision-making in the ant colony algorithm to optimize the initial clustering centers. On this basis, iterative updating can better solve the problem of the sensitivity of the three-way k-means algorithm to the initial clustering center.
This article is structured in the following manner: In Section 2, we introduce the background to our proposed methods, including three-way clustering and three-way k-means. The detailed process of the proposed algorithm is presented in Section 3. In Section 4, experiments are described which evaluate the performance of the proposed algorithms. Some concluding remarks and discussion of future research directions are presented in Section 5.

2. Related Work

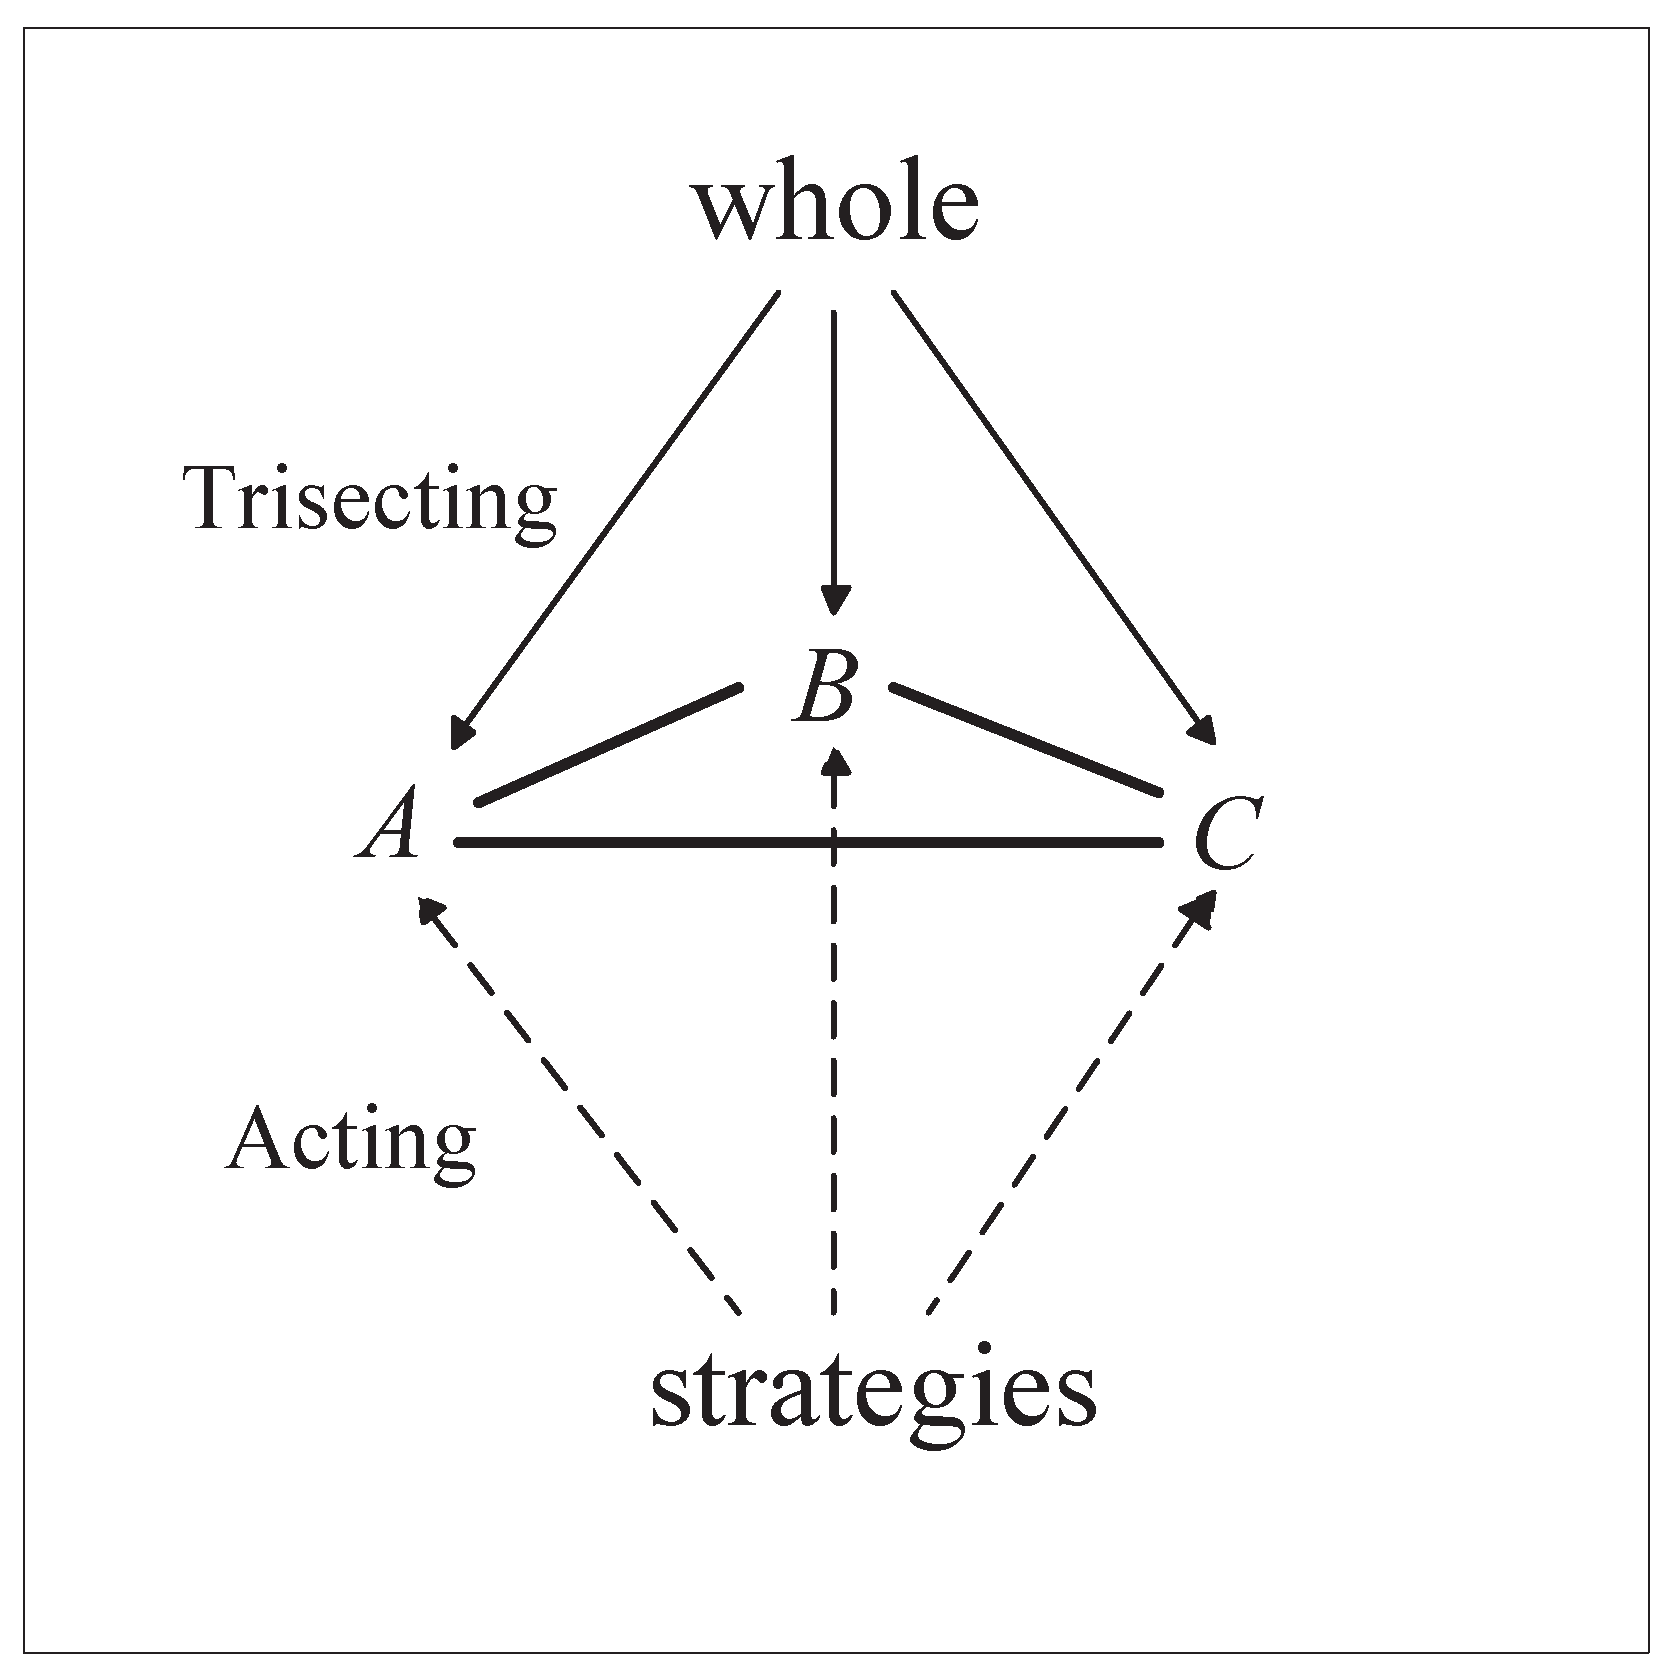
2.1. Three-Way Clustering

In classical two-way decision clustering, a cluster is represented by a set with a crisp boundary. There are only two relationships between an object and a class: the object either belongs or does not belong to the class. The requirement of a crisp boundary is conducive to analysis results, but may not adequately adequately show the uncertainty information in the data set. In order to address the problem of information uncertainty, Yao [22,23] proposed a theory of three-way decision by extending the commonly used binary-decision model. There are three main tasks in three-way decision [25]: (1) trisecting strategies, (2) acting strategies, and (3) outcome evaluation. The whole process can be depicted as TAO (trisecting-acting-outcome) [25] framework shown in Figure 1.
With the development of three-way decision, many applications of three-way decision were researched in various fields, such as, data analysis [26,27], concept analysis [28,29,30], granular computing [31,32], sequential three-way decision [33,34].
To relax this requirement of sharp boundary, a new type of clustering algorithms [35,36] was proposed, named three-way clustering. Unlike traditional hard clustering, three-way clustering presents a cluster through a pair of sets:
C i = ( C o ( C i ) , F r ( C i ) ) ,
where C o ( C i ) V and F r ( C i ) V are defined as the core region and fringe region of cluster C i , respectively. These two sets divide the universe into three parts C o ( C i ) , F r ( C i ) and T r ( C i ) , which chapter the three types of relationships between the objects and cluster, namely, objects belong to the cluster, objects not belong to the cluster, and objects partially belong to the cluster. For the samples in C o ( C i ) , they belong to the cluster ( C i ) definitely and have a higher within-class similarities. For the samples in F r ( C i ) , they maybe belong to the cluster ( C i ) and have a lower similarities with the core samples. For the samples are in T r ( C i ) , they do not belong to the cluster C i definitely. Different from using one single set to represent the cluster, three-way clustering uses C o ( C i ) , F r ( C i ) to represent one cluster. Three-way clustering addresses the problem of information uncertainty in traditional clustering methods through adding fringe region, which reduces decision risk caused by inaccurate information. We take Figure 2 as an example to show one three-way clustering result.
There are many different strategies to obtain the the core regions and fringe regions of three-way clustering. Typically, evaluation function is a commonly used method. The main idea of evaluation function is to construct a function and a pair of thresholds. The function assigns each sample a value. The samples with values greater than one threshold are assigned to the core region and the objects with values between the two thresholds are assigned to the fringe region. From a statistical point of view, a sample belongs to a certain cluster with a certain probability. It is reasonable to assign a sample to core region of one cluster when the probability of the sample belonging to this cluster is much greater than the probability of the sample belonging to other clusters. However, when the probability of a sample belonging to some clusters are almost same, it will be difficult to make a positive decision. Adopting a delayed decision and assigning them into the fringe region can reduce the risk of decision. Three-way clustering addresses the problem of information uncertainty in traditional clustering methods through adding fringe region, which reduces decision risk caused by inaccurate information. Recently, three-way clustering has attracted a lot of research, and many three-way clustering algorithms were developed. Wang et al. [37] proposed a three-way clustering framework by using contraction and expansion operators inspired in mathematical morphology; Jia et al. [38] introduced the definition of sample similarity to measure the uncertainty and developed an automatic three-way clustering approach. Fan et al. [39] proposed three-way density-sensitive spectral clustering algorithm by using density-sensitive metric. Shah [40] proposed a new three-way clustering by using image inspired cluster blur and sharp operators. Except the above research results, some other algorithms also enrich the theories and models of three-way clustering [41,42,43,44,45].
Given a set of data objects U = x 1 , x 2 , , x n , C = c 1 , c 2 , , c k is a finite set of clusters, and U is divided into k classes. The idea of three-way clustering is to use a pair of sets to represent each cluster. This pair of sets consists of a core region (Co), a fringe region (Fr), and a trivial fringe (Tr) [46]. The results of three-way clustering can be represented as the following family of clusters:
C = { ( C o ( C 1 ) , F r ( C 1 ) ) , ( C o ( C 2 ) , F r ( C 2 ) ) , , ( C o ( C k ) , F r ( C k ) ) } .
According to the definition of clustering results, C o ( C i ) and F r ( C i ) must meet the following three conditions:
1 C o ( C i ) ϕ , i = 1 , 2 , , k ;
2 i = 1 k ( C o ( C i ) F r ( C i ) ) = U ;
3 C o ( C i ) C o ( C j ) = ϕ , i j .

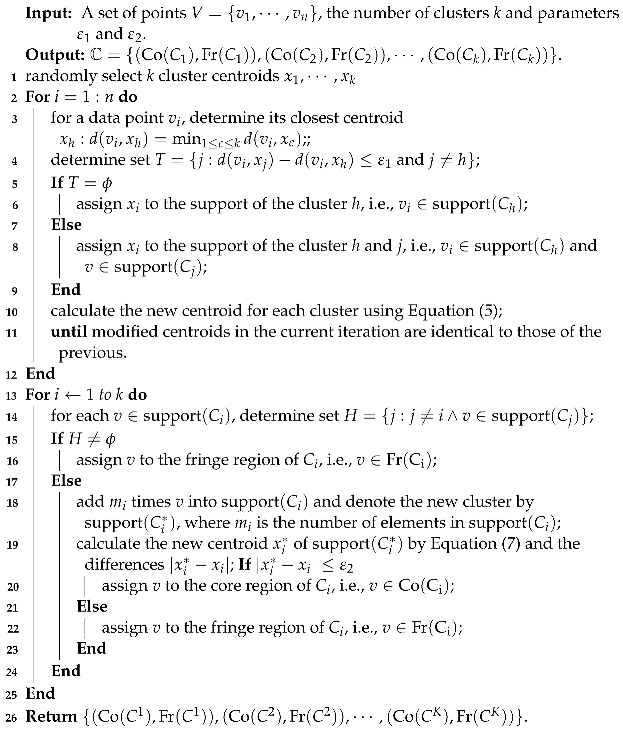
2.2. Three-Way k-Means

The traditional k-means algorithm is an iterative clustering analysis algorithm. The first step of the k-means algorithm is to randomly select k samples as the initial cluster centers. The second step is to calculate the distance between each sample and cluster center, and then assign the samples to the nearest cluster. The process is repeated by continuously updating the iterative cluster centers until a certain termination condition is met. In the process of k-means algorithm, there are only two relationships between samples and various clusters: belonging to the cluster and not belonging to the cluster. This two relationships ignore the samples which partially belong to one cluster. In fact, there is another type of relationship between sample and various clusters: belong to partially. In order to capture these three types of relationships, three-way k-means [21] was proposed by integrating three-way decision theory with the k-means algorithm. The main idea of the three-way k-mean algorithm is to introduce fault-tolerant errors in the k-means iteration process, and to represent the result of each cluster with a core region and a fringe region. The procedure of three-way k-means clustering consists mainly of two steps. The first step is to obtain the support of each cluster and the second step is to separate the core region from the support. For each object v and randomly selected k centroids x 1 , , x k , let d ( v , x j ) be the distance between itself and the centroid x j . Suppose d ( v , x i ) = min 1 j k d ( v , x j ) and T = { j : d ( v , x j ) d ( v , x i ) ε 1 and i j } , where ε 1 is a given parameter. Then,
(1)
If T ϕ , then v support ( C i ) and v support ( C j ) .
(2)
If T = ϕ , then v support ( C i ) .
The modified centroid calculations for the above procedure are given by:
x i = v support ( C i ) v | support ( C i ) | ,
where i = 1 , , k , v are all objects in support ( C i ) , and | support ( C i ) | is the number of objects in support ( C i ) .
This process is repeated until modified centroids in the current iteration are identical to those that have been generated in the previous one, i.e., when the prototypes are stabilized. The second step is to separate the core regions from the supports using a perturbation analysis method. Algorithm 1 is designed to describe the process of TWKM clustering.
Algorithm 1: Three-way k-means [21]
Symmetry 14 01821 i001

3. The Improved Three-Way k-Means

The three-way k-means clustering algorithm integrates three-way decision theory with the k-means algorithm and uses a pair of sets to represent a cluster, which can effectively deal with the uncertainty of data. However, as for the k-means algorithm, the three-way k-means method is still sensitive to the initial clustering centers and can easily succumb to the problem of local optimization.To solve this problem, we present an improved three-way k-means clustering algorithm by combining a random probability selection strategy and the pheromone feedback mechanism in the ant colony algorithm with three-way k-means. The sensitivity of the three k-means clustering algorithm to the initial clustering center is optimized through continuous updating iterations, so as to avoid the clustering results easily falling into local optimization. The weights of the core domain and the boundary domain are dynamically adjusted to avoid the influence of artificially set parameters on the clustering results.

3.1. Random Probability Selection Strategy

The ant colony algorithm simulates the foraging behavior of ants in nature, and initially solves the problem of traveling salesman by analogy with a pheromone mechanism. The inspiration for the ant colony algorithm came from the behavior of ants in finding the shortest path in the process of looking for food. In the ant colony algorithm, the process of ants looking for food sources can be viewed as continuous clustering. According to the size of the current pheromone quantity, ants randomly select according to probability, and allocate samples to each cluster center. The larger the pheromone amount between a sample and a cluster center, the greater the probability that the sample will be assigned to this class. In the process of clustering, the probability that a sample is assigned to a cluster center is calculated according to the size of the pheromone between the sample and the cluster center and the heuristic function. The random probability selection strategy greatly increases the effectiveness of the algorithm, causes the algorithm to have the characteristics of convergence, and prevents the algorithm from falling into local optimization. The probability calculation formula of the cluster center to which the ant search sample belongs is:
p i j = τ i j α ( t ) η i j β ( t ) ,
where η i j ( t ) is a heuristic function and η i j = 1 d i j ( i = 1 , 2 , n ; j = 1 , 2 , , k ) , d i j represents sample v i to cluster center x j . τ i j ( t ) ( i = 1 , 2 , n ; j = 1 , 2 , , k ) represents the pheromone concentration between sample v i and cluster center x j . The pheromone concentration is distributed between the sample and the clusters, and the initial pheromone concentration is 1, t is the number of iterations, α is the pheromone importance factor, and β is the heuristic importance factor. To increase the diversity of search and to speed up the convergence speed, at the beginning, ants randomly select a sample v i as the starting point, and then Formula (7) is used to calculate the probability p of the sample to each cluster center x j . The cluster of sample v i is determined using roulette. The above process is repeated for another sample until all the samples are traversed to form a solution.
In the ant colony algorithm, the objective function is used to evaluate the solution formed by all ants after completing an iteration, and only the clustering results obtained by the ants with the best objective function value are retained. We construct the fitness function using the intra-cluster cohesion function and the inter-cluster dispersion function, so that the objects in the same cluster are as similar as possible, and the objects in different clusters are as different as possible. The intra-cluster cohesion function is defined as follows,
J = i = 1 k ( ω i c o r e x i i c o r e ( v i m k 2 ) + ( ω i f r i n g e x i i f r i n g e ( v i m k 2 ) ,
where J represents the sum of the distance between each sample v i and cluster center x j , which is used to evaluate the degree of cohesion. ω i c o r e and ω i f r i n g e represent the weight values of the core region and the fringe region, respectively. Dynamic adjustment ω i c o r e and ω i f r i n g e can effectively avoid the influence of a sample’s number change in the core region and the fringe region, and can also avoid the influence of clustering centers due to differences in distance distribution. In this paper, we assume that ω i c o r e and ω i f r i n g e satisfy the following equations.
ω i c o r e + ω i f r i n g e = 1 ,
ω i c o r e ω i f r i n g e = | ω i c o r e | | ω i c o r e | ,
ω i c o r e and ω i f r i n g e where | ω i c o r e | and | ω i c o r e | are the number of samples in the core region and the fringe region, respectively.
The quality of clustering results is determined by the intra-cluster distance and the inter-cluster distance; when the intra-class distance is smaller, the inter-class distance is larger, the value of the objective function is smaller, and the clustering result is better. The inter-cluster dispersion function is defined as,  
D = 1 k ( i , j = 1 k x i x j 2 ) ,
where x i and x j represent the cluster center of C i and C j , respectively.
Based on the intra-cluster cohesion function and the inter-cluster dispersion function defined by (8) and (10), we construct the following fitness function to optimize three-way k-means:
F i t = 1 + D 1 + J .
In the process of looking for food sources, ants release pheromones on the paths they pass. The higher the pheromone concentration, the shorter the distance of the road. In this way, the more ants walk, the higher the pheromone concentration on this path. Each ant moves towards the direction with the highest pheromone concentration, and the continuously strengthened pheromone attracts more ants, so a positive feedback mechanism is formed. As time goes on, the pheromone on the poor path cannot be strengthened, and as the pheromone volatilizes continuously, it loses its attraction, thus forming a negative feedback mechanism.
The positive feedback mechanism attracts more ants to choose the current optimal path, accumulates more pheromone, increases the probability of other ants choosing the path, narrows the scope of ant search, and promotes the convergence of the clustering algorithm. The negative feedback mechanism can eliminate the effect of the positive feedback mechanism, effectively preventing more ants from being attracted to the optimal path, and making the algorithm result fall into the local optimal solution. Using the positive and negative feedback of pheromones, the ant colony algorithm avoids the algorithm falling into a local optimal solution and increases the diversity of solutions.
Pheromone updating in the ant colony algorithm uses the overall information of the ant colony. When the ant releases the pheromone, the pheromone remaining on the path will gradually disappear. This is also to make the next generation of ants more robust both globally and locally when choosing the path. Therefore, when all the ants have completed a cycle, the global update of the residual pheromone is carried out. The pheromone update formula in the ant colony algorithm is as follows:
τ i j ( t + 1 ) = ( 1 ρ ) τ i j ( t ) + Δ τ i j ,
Δ τ i j = 0.1 τ i j ,
where, parameter 0 < ρ < 1 indicates the degree of volatilization of the pheromone, τ i j represents the pheromone concentration, and Δ τ i j represents the increment in pheromone.

3.2. The Improved Three-Way k-Means Algorithm

Because the clustering results of the standard three-way k-means algorithm depend on the selection of initial centers they easily succumb to the problem of local optimization. To overcome this problem, this paper presents an improved three-way k-means algorithm by integrating the ant colony algorithm and three-way k-means. An original element of this paper is the application of clustering centers obtained by the ant colony algorithm to the three-way k-means, which makes up for the shortcomings of the three-way k-means clustering algorithm due to the random selection of clustering centers. Figure 3 presents a flowchart of the proposed algorithm.
The ant colony algorithm simulates the foraging behavior of ants in nature, and initially solves the problem of traveling salesman by analogy with a pheromone mechanism. Ants randomly select a sample in the sample space as the starting point. The probability that a sample is assigned to a cluster is obtained according to the amount of the pheromone between the sample and the cluster center. The sample is allocated to a cluster by roulette. Then the ant selects another sample until all samples are assigned, that is, when an iteration is completed to form a solution. The optimal solutions are calculated using the value of the objective function. The pheromone in the ant colony algorithm reflects the overall information in the ant colony. When the ant releases the pheromone, the pheromone remaining on the path will gradually disappear. This is also to make the next generation of ants more robust globally and locally when choosing the path. The specific steps of the algorithm are shown in Algorithm 2:
The detailed complexity of Algorithm 2 is as following: Line 3 to Line 11 are to find the support of each cluster. The time complexity of this process is O ( k n m ) , where n and m are the number of elements and attributes, respectively. Line 12 is to separate the core regions from the support sets using centroid perturbation analysis. The time complexity of this process is O ( k n m ) . Line 13 to Line 14 are to update the process. The time complexity of Algorithm 2 is O ( t k n m ) + O ( k n m ) , where t is the number of iterations.
Algorithm 2: The improved three-way k-means based on ant colony algorithm.
Symmetry 14 01821 i002

4. Experimental Analysis

4.1. Evaluation Indices

  • Accuracy ( A c c ) [47]
    A c c = 1 n i = 1 k C i
    In the above formula, n is the total number of samples in the dataset, C i is the correct number of samples divided into class clusters i, and k is the number of class clusters. A c c represents the ratio between the number of correctly partitioned elements and the total number. A greater A C C value implies a better clustering result. When A C C = 1, the result of the clustering algorithm is consistent with the real result.
  • Davies–Bouldin index ( D B I ) [47].
    D B = 1 c i = 1 c max j i S ( C i ) + S ( C j ) d ( x i , x j )
    where S ( C i ) and d ( x i , x j ) are the intra-cluster distance and the inter-cluster separation, respectively. S ( C i ) is defined as follows:
    S ( C i ) = v C i v x i C i .
    As a function of the ratio of the within cluster scatter to the between cluster separation, a lower value will mean that the clustering is better.
  • Average silhouette index ( A S ) [47].
    A S = 1 n i = 1 n S i ,
    where n is the total number of objects in the set and S i is the silhouette of object v i , which is defined as,
    S i = b i a i max { a i , b i } ,
    a i is the average distance between x i and all other objects in its own cluster, and b i is the minimum of the average distance between x i and objects in other clusters. The range of the average silhouette index is [ 1 , 1 ] ; a larger value means a better clustering result.

4.2. Performances of Proposed Algorithm

To test the performances of our proposed algorithm, we employed 10 datasets from the UCI Machine Learning repository, which were Wine, Class, Ecoli_Nor, Forest, Bank, Iris, Contraceptive, Molecular Biology1, Libras_Nor, and Caffeine_consumption. Table 1 shows the details of these datasets.
Because the evaluation indices A c c , D B I and A S are only adopted for the hard clustering results, three-way clustering cannot calculate these values directly. To present the performances of our proposed algorithm, we use the core regions to form a clustering result, then calculate the A c c , D B I and A S values using the core region to represent the corresponding cluster. The average A C C , D B I and A S values are achieved by running the process 30 times on all datasets. To compare clustering effects, the performances of k-means [19], FCM [48], and three-way k-means [21] are also presented in Table 2, Table 3 and Table 4. The best performance for each dataset is highlighted in bold.
To analyze the time comparison of different algorithms, Figure 4 lists the running time of different algorithms on the 10 UCI datasets where the unit of measurement for time is “second”.

4.3. Experimental Results Analysis

The average A c c values of k-means, FCM, three-way k-means and the proposed algorithm are reported in Table 2. Obviously, comparing with other three algorithms, the proposed algorithm achieves a better A C C value on 8 data sets. Though the performances of A c c value on Iris and Libras by three-way k-means algorithm are equal to or superior to the results by the proposed algorithm, while the D B I and A S value of our proposed algorithm are better than the results of three-way k-means. The increase of A c c value indicates that the proposed algorithm assign more samples to right cluster than other algorithms.
The results of D B I and A S are listed in Table 3 and Table 4, respectively. From Table 3 and Table 4, we can find that the proposed algorithm obtains better results than other algorithms in terms of D B I and A S value on all data sets. Since D B I is the ratio of the within cluster scatter to the between cluster separation, the improvement of D B I means that the clustering results of proposed algorithm have a higher cluster separation. The results of A S can also verify the fact that the clustering results of proposed algorithm have a lower intra class distance and a higher inter class distance. This can be attributed to the fact that the clustering result of the proposed algorithm is represented by core regions when calculate the D B I value and A S value, which can increase the degree of separation between clusters and reduce the degree of dispersion within clusters.
The running time of the proposed algorithm is much longer than k-means and FCM on all the UCI datasets, as shown in Figure 4. This is because the time complexity of the proposed algorithm is much more than that of k-means and FCM. Compared with the three-way k-means method, the proposed algorithm takes slightly longer. This is because the proposed algorithm integrates the ant colony algorithm into three-way k-means, which adds to the running time of the proposed algorithm.
The above discussion suggests that the proposed algorithm can effectively improve the results of three-way k-means, solving the clustering problem of uncertain elements and maintaining improved clustering performance at the same time. Though the proposed algorithm can achieve better clustering results than three-way k-means, it still has the following two disadvantages:
  • Similar to the k-means algorithm, the proposed method can achieve good results for convex datasets. If the dataset is non-convex, the proposed algorithm fails to give good results.
  • The time complexity and computation complexity of the proposed algorithm are higher than for k-means and three-way k-means, which means it is not suitable for big data.

5. Conclusions and Future Work

Three-way clustering uses a core region and a fringe region to represent a cluster, which divide the universe into three disjoint sets to reflect the three types of relationship between an object and a cluster. The samples in the core region are determined to belong to this type of cluster, while the samples in the fringe region may belong to this type of cluster. Three-way clustering assigns the samples with uncertainty information into corresponding fringe regions, which reduces the risk of decision-making. However, the standard three-way k-means algorithm does not always guarantee good results, as the accuracy of clustering depends on the selection of the initial centroids and easily succumbs to the problem of local optimization. Aiming to solving this problem, this paper presents an improved three-way k-means algorithm by integrating the ant colony algorithm and three-way k-means. The idea of this algorithm is to apply the clustering center obtained by each iteration of the ant colony algorithm to the three-way k-means, which compensates for the shortcomings of the three-way k-means clustering algorithm due to the random selection of clustering centers. The proposed algorithm optimizes three-way k-means using a random probability selection strategy in the ant colony algorithm and the positive and negative feedback mechanism of pheromones to dynamically adjust the weight. The experiments on UCI datasets show that the proposed algorithm can improve the performance of the three-way k-means clustering results according to the comparison of A C C , D B I and A S .
Finally, we should point out that the standard three-way k-means algorithm has two problems, the selection of the initial clustering centers and the determination of the cluster number. This paper presents a method to improve the selection of the initial clustering centers. The determination of cluster number is an interesting topic that requires further investigation.

Author Contributions

Conceptualization, P.W.; data curation, Q.G.; formal analysis, Z.Y.; funding acquisition, P.W.; methodology, P.W.; supervision, P.W. All authors have read and agreed to the published version of the manuscript.

Funding

This research was funded by the Natural Science Foundation of China (nos. 62076111, 62006099) and the Key Laboratory of Oceanographic Big Data Mining & Application of Zhejiang Province (no. OBDMA202002), Postgraduate Research & Practice Innovation Program of Jiangsu Province (nos. KYCX22_3826, SJCX22_1905).

Institutional Review Board Statement

Not applicable.

Informed Consent Statement

Not applicable.

Data Availability Statement

The data used to support the findings of this study are available from the corresponding author upon request.

Conflicts of Interest

The authors declare no conflict of interest.

References

  1. Fujita, H.; Li, T.R.; Yao, Y.Y. Advances in three-way decisions and granular computing. Knowl.-Based Syst. 2016, 91, 1–3. [Google Scholar] [CrossRef]
  2. Yao, Y.Y. Integrative Levels of Granularity, Human-Centric Information Processing through Granular Modelling; Springer: Berlin/Heidelberg, Germany, 2009; pp. 31–47. [Google Scholar]
  3. Fujita, H.; Gaeta, A.; Loia, V.; Orciuoli, F. Resilience analysis of critical infrastructures: A cognitive approach based on granular computing. IEEE Trans. Cybern. 2018, 49, 1835–1848. [Google Scholar] [CrossRef] [PubMed]
  4. Pedrycz, W. Granular Computing Analysis and Design of Intelligent Systems; CRC Press: Boca Raton, FL, USA, 2013. [Google Scholar]
  5. Xu, R.; Wunsch, D.C. Survey of clustering algorithms. IEEE Trans. Neural Netw. Learn. Syst. 2005, 16, 645–678. [Google Scholar] [CrossRef] [PubMed]
  6. Yang, X.B.; Qi, Y.S.; Song, X.N.; Yang, J.Y. Test cost sensitive multigranulation rough set: Model and minimal cost selection. Inf. Sci. 2013, 250, 184–199. [Google Scholar] [CrossRef]
  7. Xu, W.H.; Guo, Y.T. Generalized multigranulation double-quantitative decision-theoretic rough set. Knowl.-Based Syst. 2016, 105, 190–205. [Google Scholar] [CrossRef]
  8. Li, W.T.; Xu, W.H.; Zhang, X.Y.; Zhang, J. Updating approximations with dynamic objects based on local multigranulation rough sets in ordered information systems. Artif. Intell. Rev. 2022, 55, 1821–1855. [Google Scholar] [CrossRef]
  9. Xu, W.H.; Yu, J.H. A novel approach to information fusion in multi-source datasets: A granular computing viewpoint. Inf. Sci. 2017, 378, 410–423. [Google Scholar] [CrossRef]
  10. Chen, X.W.; Xu, W.H. Double-quantitative multigranulation rough fuzzy set based on logical operations in multi-source decision systems. Int. J. Mach. Learn. Cybern. 2022, 13, 1021–1048. [Google Scholar] [CrossRef]
  11. Xu, W.H.; Yuan, K.H.; Li, W.T. Dynamic updating approximations of local generalized multigranulation neighborhood rough set. Appl. Intell. 2022, 52, 9148–9173. [Google Scholar] [CrossRef]
  12. Yang, X.B.; Yao, Y.Y. Ensemble selector for attribute reduction. Appl. Soft Comput. 2018, 70, 1–11. [Google Scholar] [CrossRef]
  13. Jiang, Z.H.; Yang, X.B.; Yu, H.L.; Liu, D.; Wang, P.X.; Qian, Y.H. Accelerator for multi-granularity attribute reduction. Knowl.-Based Syst. 2019, 177, 145–158. [Google Scholar] [CrossRef]
  14. Li, J.Z.; Yang, X.B.; Song, X.N.; Li, J.H.; Wang, P.X.; Yu, D.-J. Neighborhood attribute reduction: A multi-criterion approach. Int. J. Mach. Learn. Cybern. 2019, 10, 731–742. [Google Scholar] [CrossRef]
  15. Liu, K.Y.; Yang, X.B.; Yu, H.L.; Fujita, H.; Chen, X.J.; Liu, D. Supervised information granulation strategy for attribute reduction. Int. J. Mach. Learn. Cybern. 2020, 11, 2149–2163. [Google Scholar] [CrossRef]
  16. Xu, S.P.; Yang, X.B.; Yu, H.L.; Yu, D.-J.; Yang, J.; Tsang, E.C.C. Multi-label learning with label-specific feature reduction. Knowl.-Based Syst. 2016, 104, 52–61. [Google Scholar] [CrossRef]
  17. Liu, K.Y.; Yang, X.B.; Fujita, H. An efficient selector for multi-granularity attribute reduction. Inf. Sci. 2019, 505, 457–472. [Google Scholar] [CrossRef]
  18. Liu, K.Y.; Yang, X.B.; Yu, H.L.; Mi, J.S.; Wang, P.X.; Chen, X.J. Rough set based semi-supervised feature selection via ensemble selector. Knowl.-Based Syst. 2020, 165, 282–296. [Google Scholar] [CrossRef]
  19. MacQueen, J. Some methods for classification and analysis of multivariate observations. In Proceedings of the Fifth Berkeley Symposium on Mathematical Statistics and Probability, Volume 1: Statistics; University of California Press: Berkeley, CA, USA, 1967; pp. 281–297. [Google Scholar]
  20. Zhang, G.; Zhang, C.C.; Zhang, H.Y. Improved k-means algorithm based on density canopy. Knowl.-Based Syst. 2018, 145, 289–297. [Google Scholar] [CrossRef]
  21. Wang, P.X.; Shi, H.; Yang, X.B.; Mi, J.S. Three-way k-means: Integrating k-means and three-way decision. Int. J. Mach. Learn. Cybern. 2019, 10, 2767–2777. [Google Scholar] [CrossRef]
  22. Yao, Y.Y. Three-way decisions with probabilistic rough sets. Inf. Sci. 2010, 180, 341–353. [Google Scholar] [CrossRef]
  23. Yao, Y.Y. The superiority of three-way decisions in probabilistic rough set models. Inf. Sci. 2011, 181, 1080–1096. [Google Scholar] [CrossRef]
  24. Colorni, A.; Dorigo, M.; Maniezzo, V. Distributed 0ptimization by ant colonies. In Proceedings of the European Conference on Artificial Life, Paris, France, 11–13 December 1991. [Google Scholar]
  25. Yao, Y.Y. Three-way decision and granular computing. Int. J. Approx. Reason. 2018, 103, 107–123. [Google Scholar] [CrossRef]
  26. Luo, J.F.; Hu, M.J.; Qin, K.Y. Three-way decision with incomplete information based on similarity and satisfiability. Int. J. Approx. Reason. 2020, 120, 151–183. [Google Scholar] [CrossRef]
  27. Xu, J.F.; Zhang, Y.J.; Miao, D.Q. Three-way confusion matrix for classification: A measure driven view. Inf. Sci. 2020, 507, 772–794. [Google Scholar] [CrossRef]
  28. Qi, J.J.; Qian, T.; Wei, L. The connections between three-way and classical concept lattices. Knowl.-Based Syst. 2016, 91, 143–151. [Google Scholar] [CrossRef]
  29. Li, J.H.; Huang, C.C.; Qi, J.J.; Qian, Y.H.; Liu, W.Q. Three-way cognitive concept learning via multi-granularity. Inf. Sci. 2017, 378, 244–263. [Google Scholar] [CrossRef]
  30. Yuan, K.H.; Xu, W.H.; Li, W.T.; Ding, W.P. An incremental learning mechanism for object classification based on progressive fuzzy three-way concept. Inf. Sci. 2022, 584, 127–147. [Google Scholar] [CrossRef]
  31. Li, X.N. Three-way fuzzy matroids and granular computing. Int. J. Approx. Reason. 2019, 114, 44–50. [Google Scholar] [CrossRef]
  32. Fujita, H.; Gaeta, A.; Loia, V.; Orciuoli, F. Improving awareness in early stages of security analysis: A zone partition method based on GrC. Appl. Intell. 2019, 49, 1063–1077. [Google Scholar] [CrossRef]
  33. Yang, X.; Li, T.R.; Liu, D.; Fujita, H. A temporal-spatial composite sequential approach of three-way granular computing. Inf. Sci. 2019, 486, 171–189. [Google Scholar] [CrossRef]
  34. Hu, C.X.; Zhang, L. Incremental updating probabilistic neighborhood three-way regions with time-evolving attributes. Int. J. Approx. Reason. 2020, 120, 1–23. [Google Scholar] [CrossRef]
  35. Yu, H. A framework of three-way cluster analysis. Proceeding of the International Joint Conference on Rough Sets, Olsztyn, Poland, 3–7 July 2017; Volume 425, pp. 300–312. [Google Scholar]
  36. Shah, A.; Azam, N.; Ali, B.; Khan, M.T.; Yao, J.T. A three-way clustering approach for novelty detection. Inf. Sci. 2021, 569, 650–668. [Google Scholar] [CrossRef]
  37. Wang, P.X.; Yao, Y.Y. CE3: A three-way clustering method based on mathematical morphology. Knowl.-Based Syst. 2018, 155, 54–65. [Google Scholar] [CrossRef]
  38. Jia, X.Y.; Rao, Y.; Li, W.W.; Yang, S.C.; Yu, H. An automatic three-way clustering method based on sample similarity. Int. J. Mach. Learn. Cybern. 2021, 12, 1545–1556. [Google Scholar] [CrossRef]
  39. Fan, J.C.; Wang, P.X.; Jiang, C.M.; Yang, X.B.; Song, J.J. Ensemble learning using three-way density-sensitive spectral clustering. Int. J. Approx. Reason. 2022, 149, 70–84. [Google Scholar] [CrossRef]
  40. Shah, A.; Azam, N.; Alanazi, E.; Yao, J.T. Image blurring and sharpening inspired three-way clustering approach. Appl. Intell. 2022. [Google Scholar] [CrossRef]
  41. Afridi, M.K.; Azam, N.; Yao, J.T. A three-way clustering approach for handling missing data using gtrs. Int. J. Approx. Reason. 2018, 98, 11–24. [Google Scholar] [CrossRef]
  42. Wang, P.X.; Chen, X.J. Three-way ensemble clustering forincomplete data. IEEE Access 2020, 8, 91855–91864. [Google Scholar] [CrossRef]
  43. Wang, P.X.; Yang, X.B. Three-way clustering method based on stability theory. IEEE Access 2021, 9, 33944–33953. [Google Scholar] [CrossRef]
  44. Yu, H.; Chen, L.Y.; Yao, J.T. A three-way density peak clustering method based on evidence theory. Knowl.-Based Syst. 2021, 211, 106532. [Google Scholar] [CrossRef]
  45. Fan, J.C.; Wang, X.X.; Wu, T.F.; Zhu, J.; Wang, P.X. Three-way ensemble clustering based on sample’s perturbation theory. Mathematics 2022, 10, 2598. [Google Scholar] [CrossRef]
  46. Wu, T.F.; Fan, J.C.; Wang, P.X. An improved three-way clustering based on ensemble strategy. Mathematics 2022, 10, 1457. [Google Scholar] [CrossRef]
  47. Vinh, N.X.; Epps, J.; Bailey, J. Information theoretic measures for clusterings comparison: Variants, properties, normalization and correction for chance. J. Mach. Learn. Res. 2010, 11, 2837–2854. [Google Scholar]
  48. Bezdek, J.C. Pattern recognition with fuzzy objective function algorithms. Adv. Appl. Pattern Recognit. 1981, 22, 203–239. [Google Scholar]
Figure 1. The TAO of three-way decision (adapted from [25]).
Symmetry 14 01821 g001
Figure 2. An illustrative three-way clustering result.
Symmetry 14 01821 g002
Figure 3. A flowchart of the proposed algorithm.
Symmetry 14 01821 g003
Figure 4. Time comparison of different algorithms on UCI datasets. (1) Wine. (2) Class. (3) Ecoli. (4) Forest. (5) Bank. (6) Iris. (7) Contraceptive. (8) Molecular Biology. (9) Libras. (10) Caffeine Consumption.
Symmetry 14 01821 g004aSymmetry 14 01821 g004b
Table 1. A description of dataset used.
IDDatasetsSamplesAttributesClasses
1Wine178133
2Class21496
3Ecoli36678
4Forest523274
5Bank137242
6Iris15043
7Contraceptive147393
8Molecular Biology106522
9Libras3609015
10Caffeine Consumption1885127
Table 2. The performances of average A c c value.
IDData Setsk-MeansFCMThree-Way k-MeansProposed Algorithm
1Wine0.65730.66920.68310.6911
2Class0.59810.60070.61120.6366
3Ecoli0.63390.63350.66520.6773
4Forest0.77950.75400.78070.8294
5Bank0.57580.59690.61230.6131
6Iris0.88660.89330.90400.9040
7Contraceptive0.21450.21790.28220.2826
8Molecular Biology0.60370.62260.65470.6659
9Libras0.86110.91620.92560.9240
10Caffeine Consumption0.20050.19600.24110.2422
Table 3. The performances of average D B I value.
IDData Setsk-MeansFCMThree-Way k-MeansProposed Algorithm
1Wine1.78351.69221.55421.5431
2Class1.04751.22330.78550.7596
3Ecoli1.15041.02730.96670.9425
4Forest1.27741.22531.2001.1879
5Bank1.19131.19521.13321.1267
6Iris0.76090.75070.72360.7355
7Contraceptive1.27161.25391.23231.2220
8Molecular Biology4.95884.82364.67834.6689
9Libras1.92401.91261.90331.9023
10Caffeine Consumption1.91161.80721.66551.6048
Table 4. The performances of average A S value.
IDData Setsk-MeansFCMThree-Way k-MeansProposed Algorithm
1Wine0.33830.23370.33470.3574
2Class0.53090.55430.58870.6038
3Ecoli0.44190.43260.44330.4524
4Forest0.40290.43020.45590.4669
5Bank0.50000.49540.51110.5280
6Iris0.69590.70910.71140.7188
7Contraceptive0.42360.43090.45970.4672
8Molecular Biology0.05530.05380.05580.0585
9Libras0.35190.30000.35330.3556
10Caffeine Consumption0.31500.34910.35170.3563
Publisher’s Note: MDPI stays neutral with regard to jurisdictional claims in published maps and institutional affiliations.

