
Highly Sensitive Terahertz Dielectric Sensor for Liquid Crystal
 ,
,
Abstract
:1. Introduction
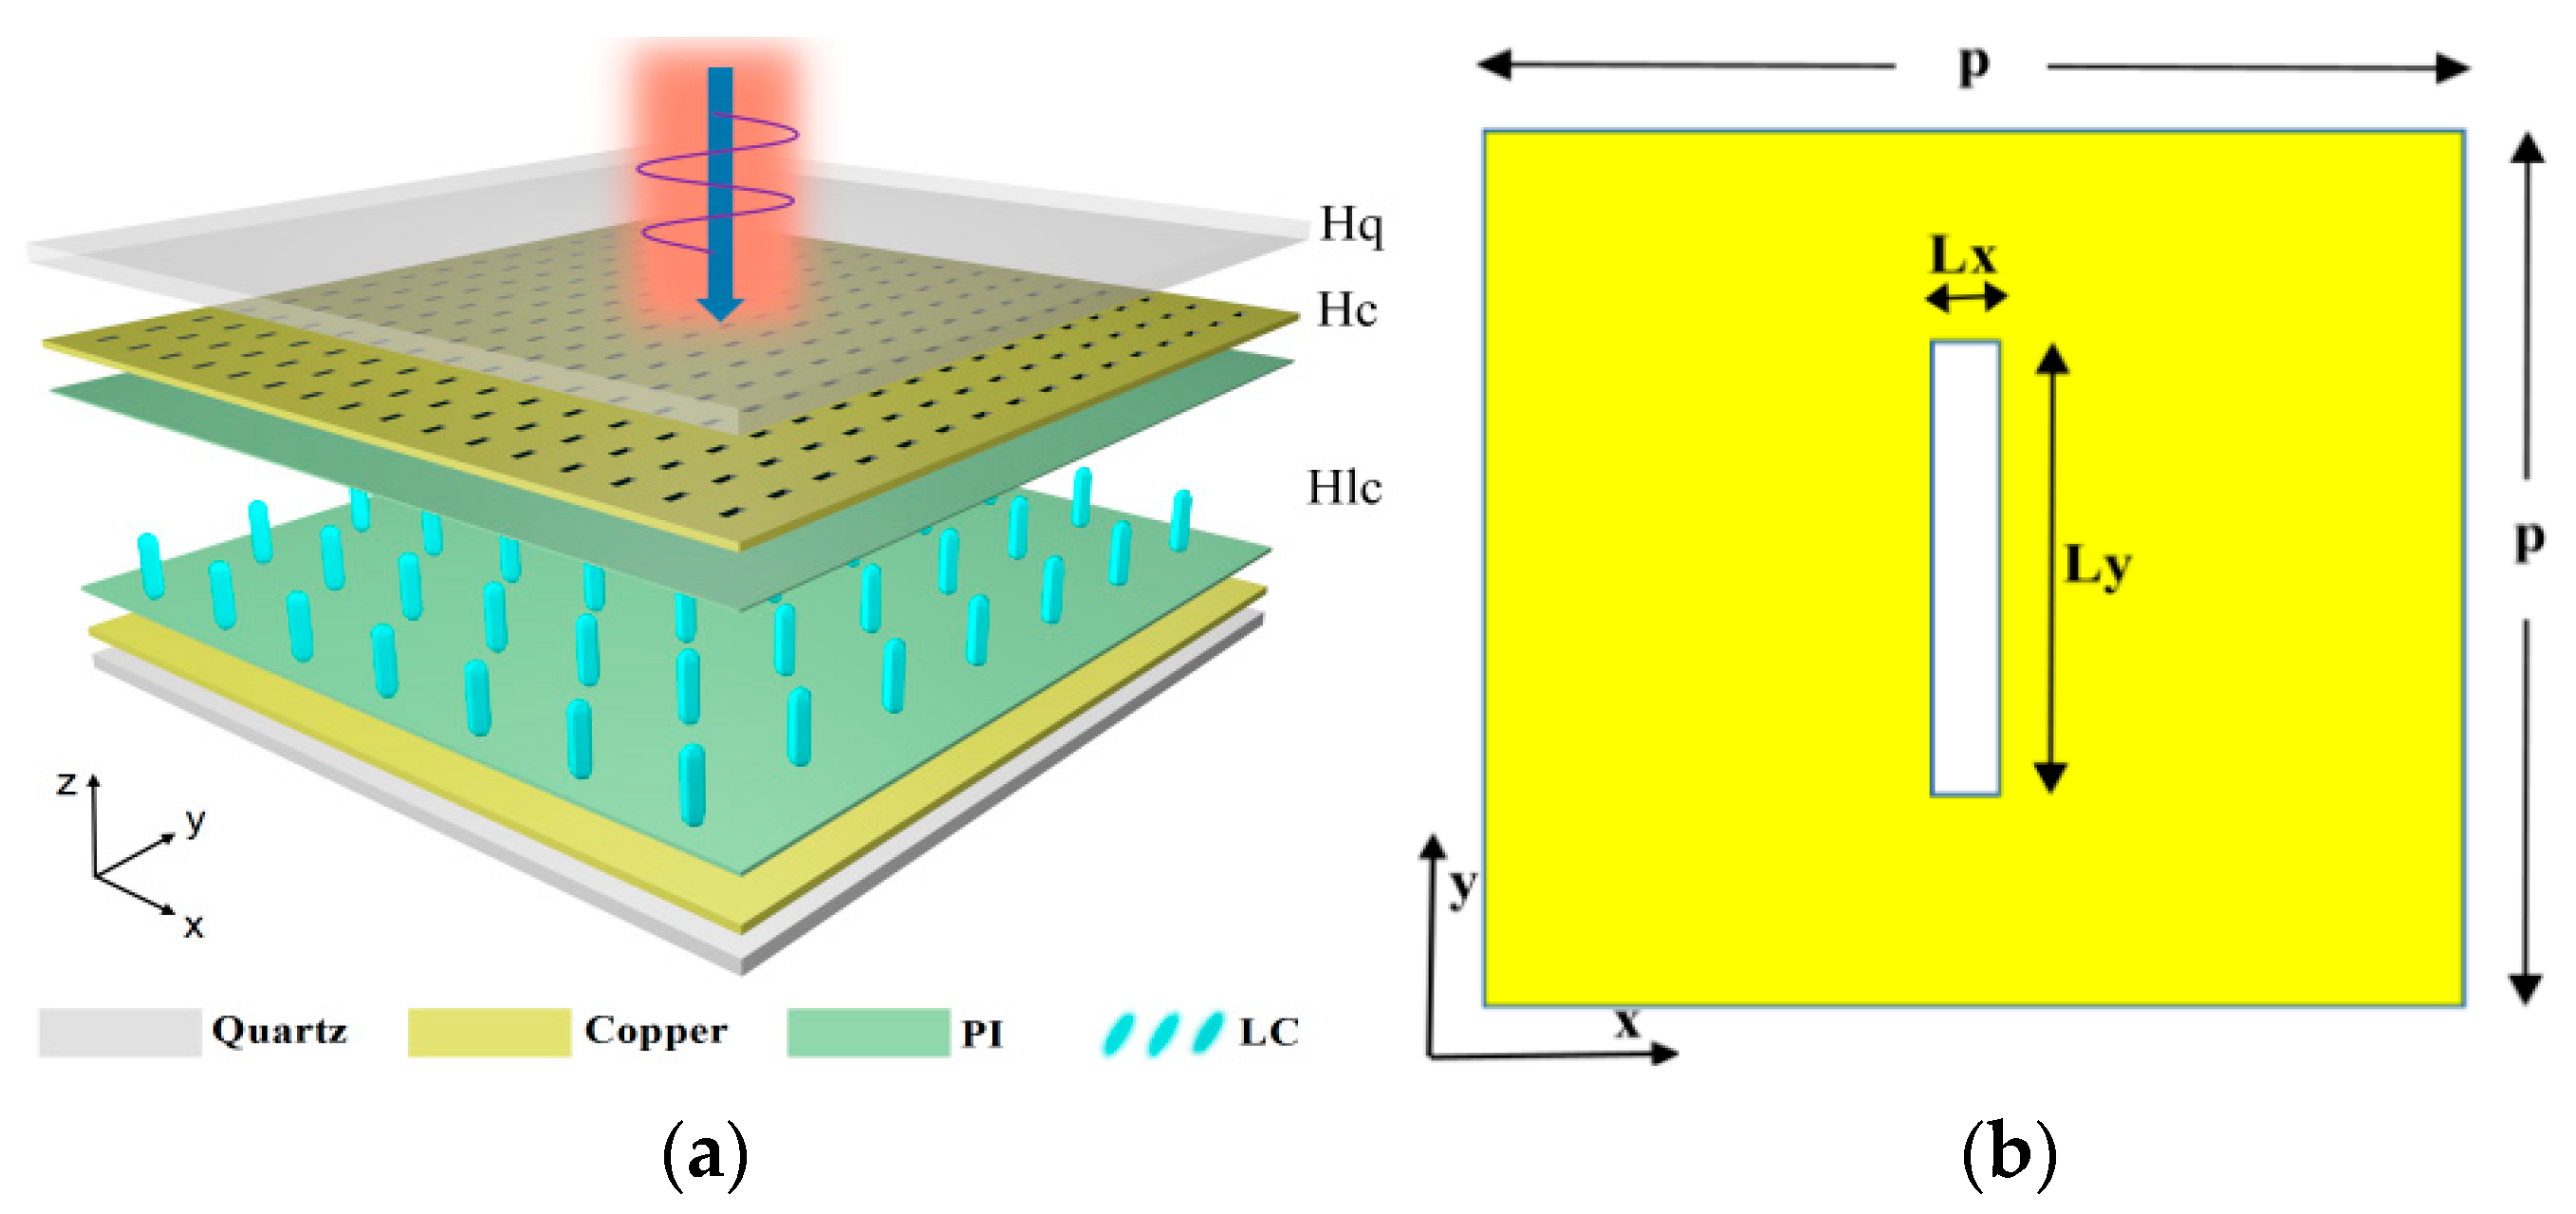
2. Sensor Design, Theoretical Analysis, and Manufacturing
3. Measurement and Experimental Analysis

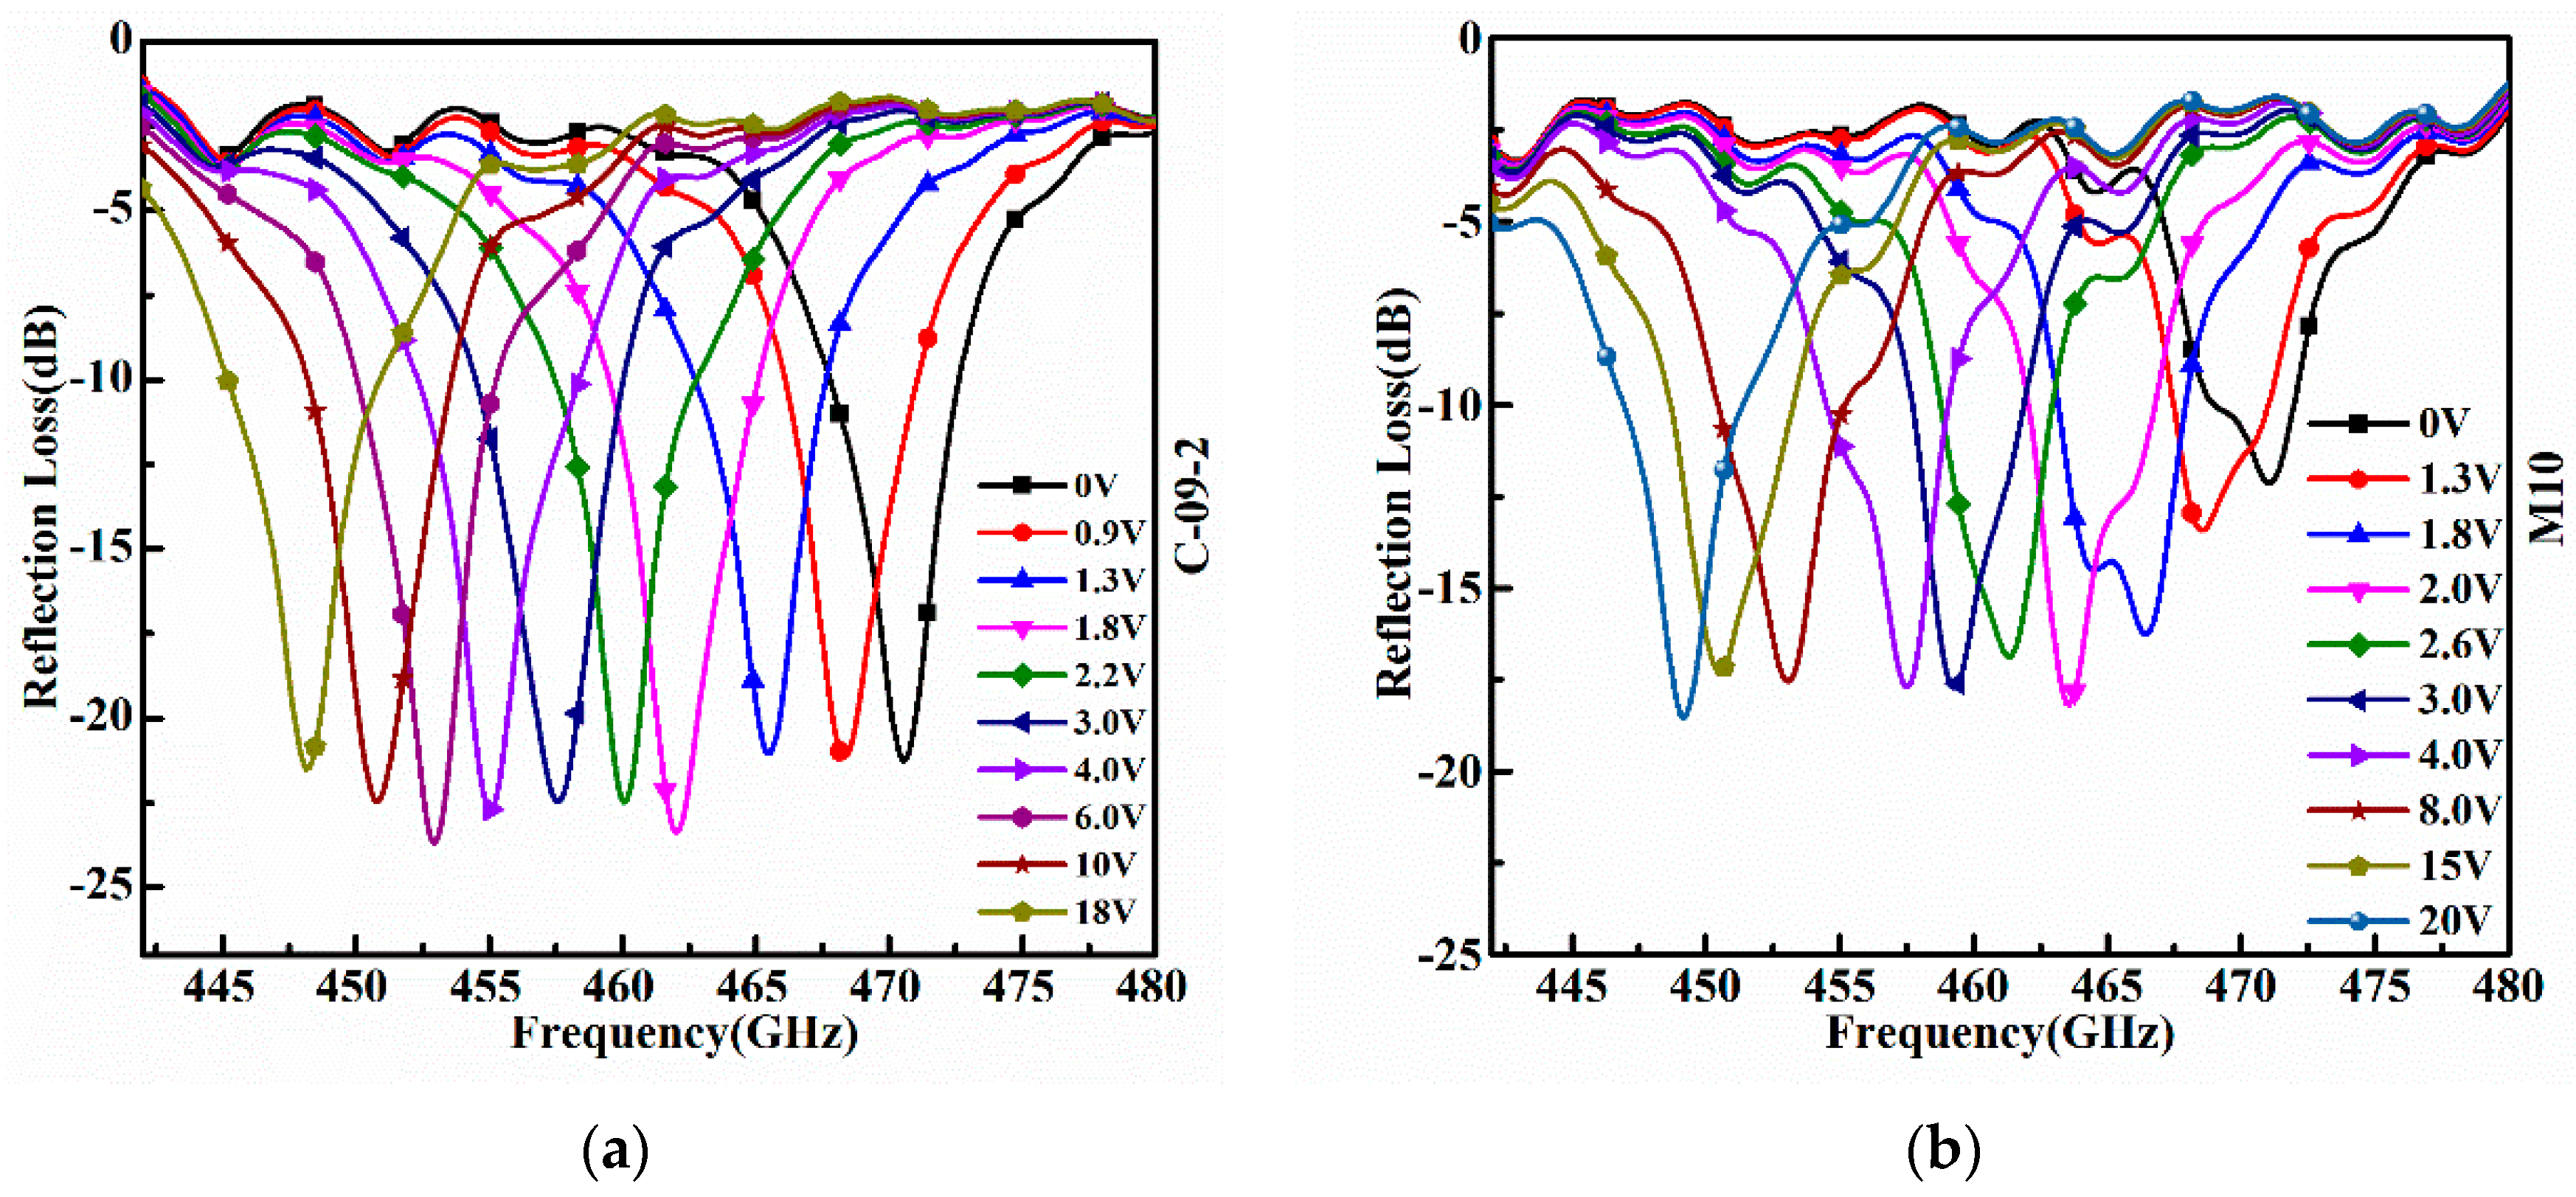
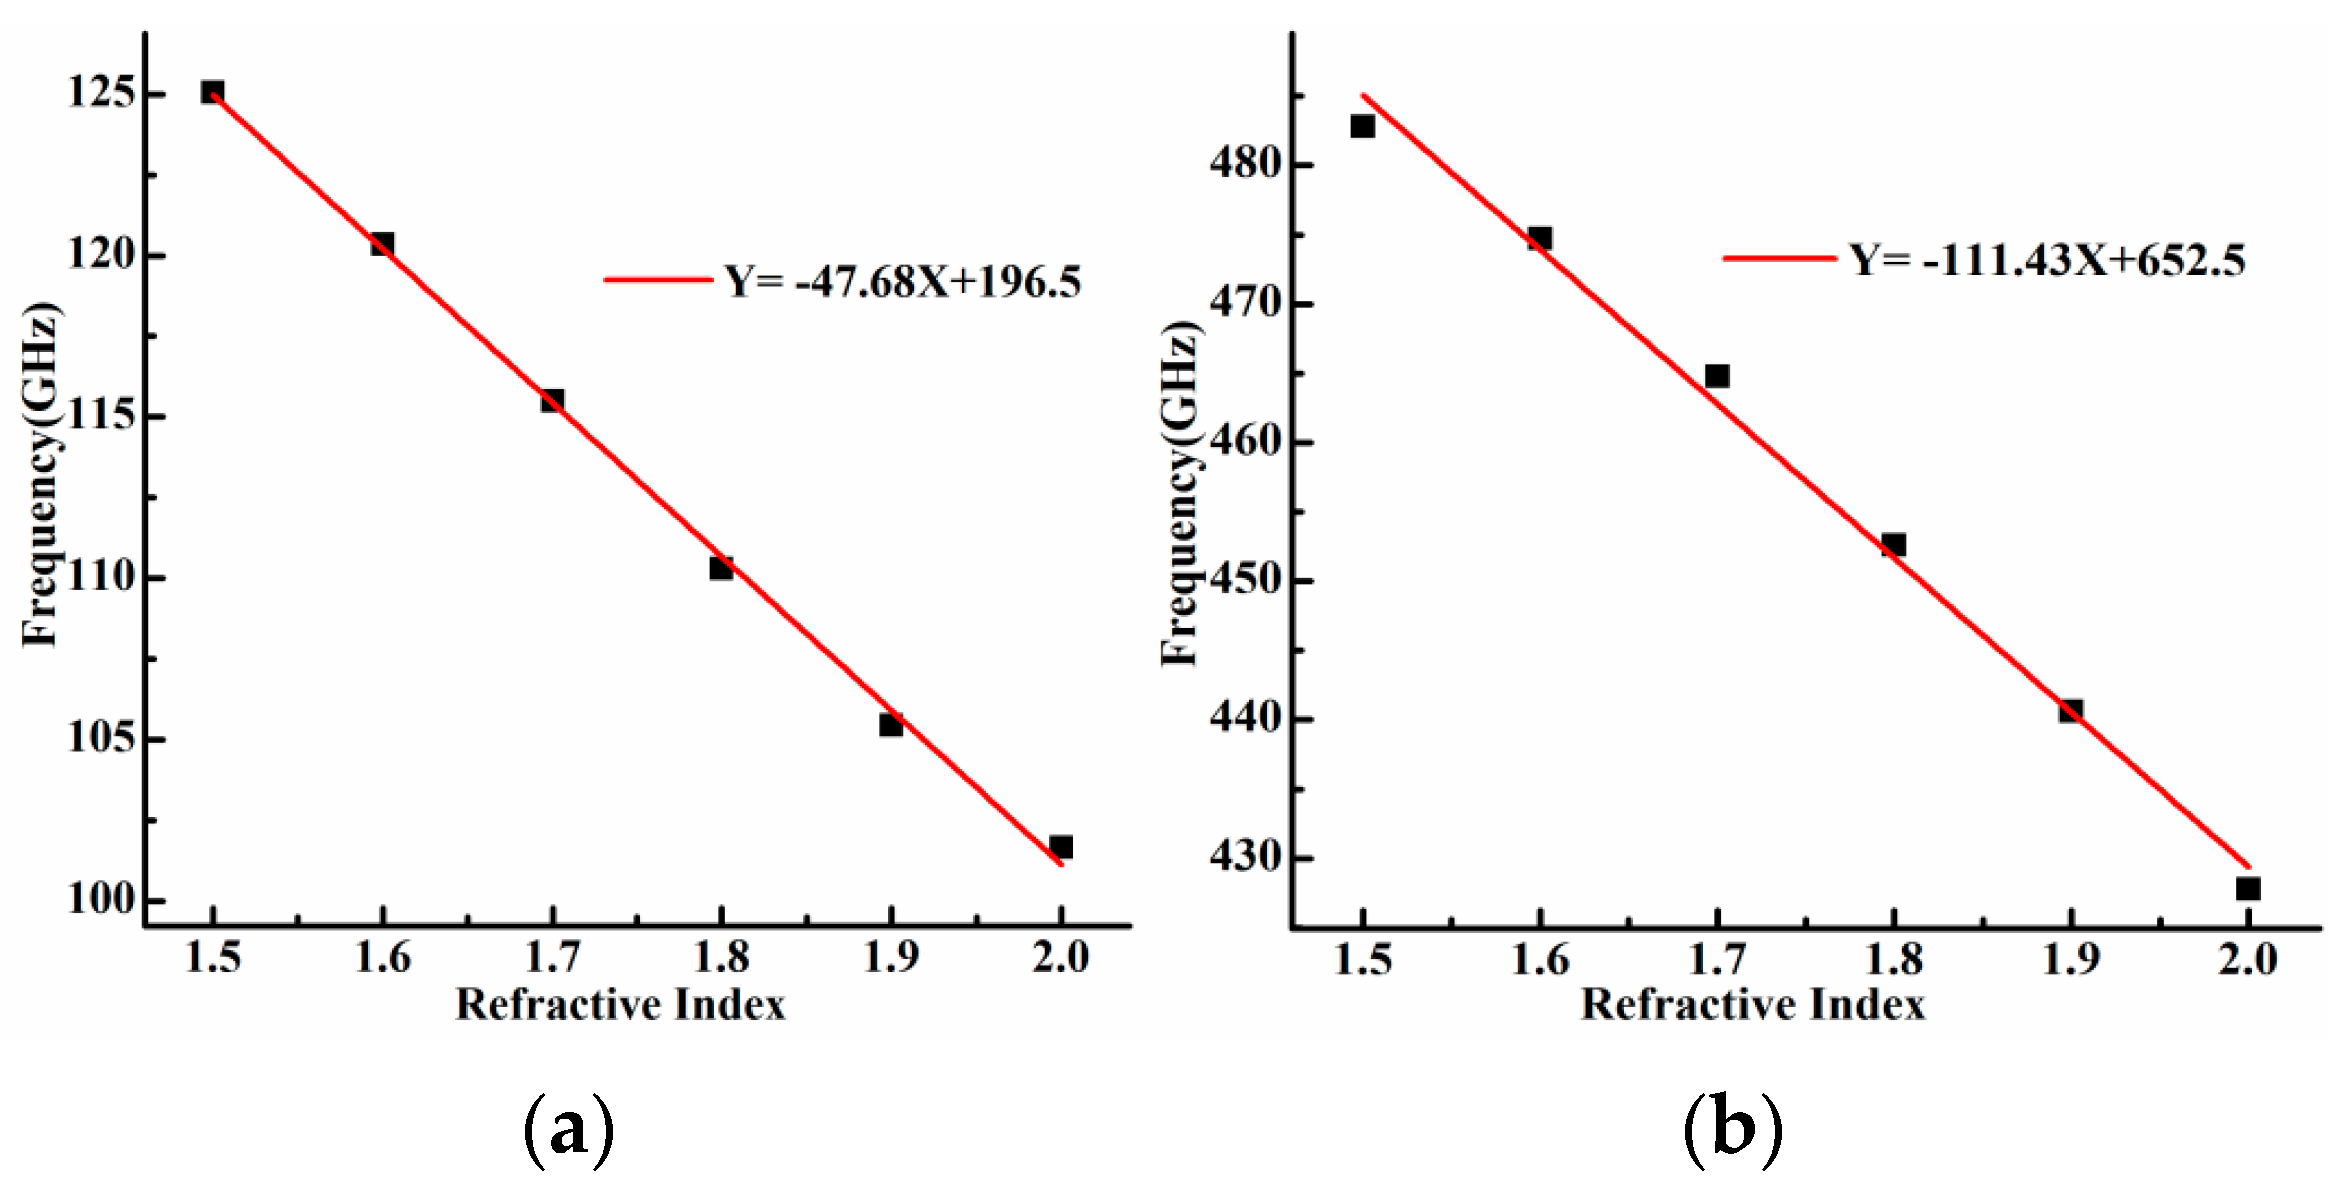
| Voltage | 0 V | 1.3 V | 1.6 V | 1.9 V | 2.5 V | 5 V | 9 V | 18 V |
|---|---|---|---|---|---|---|---|---|
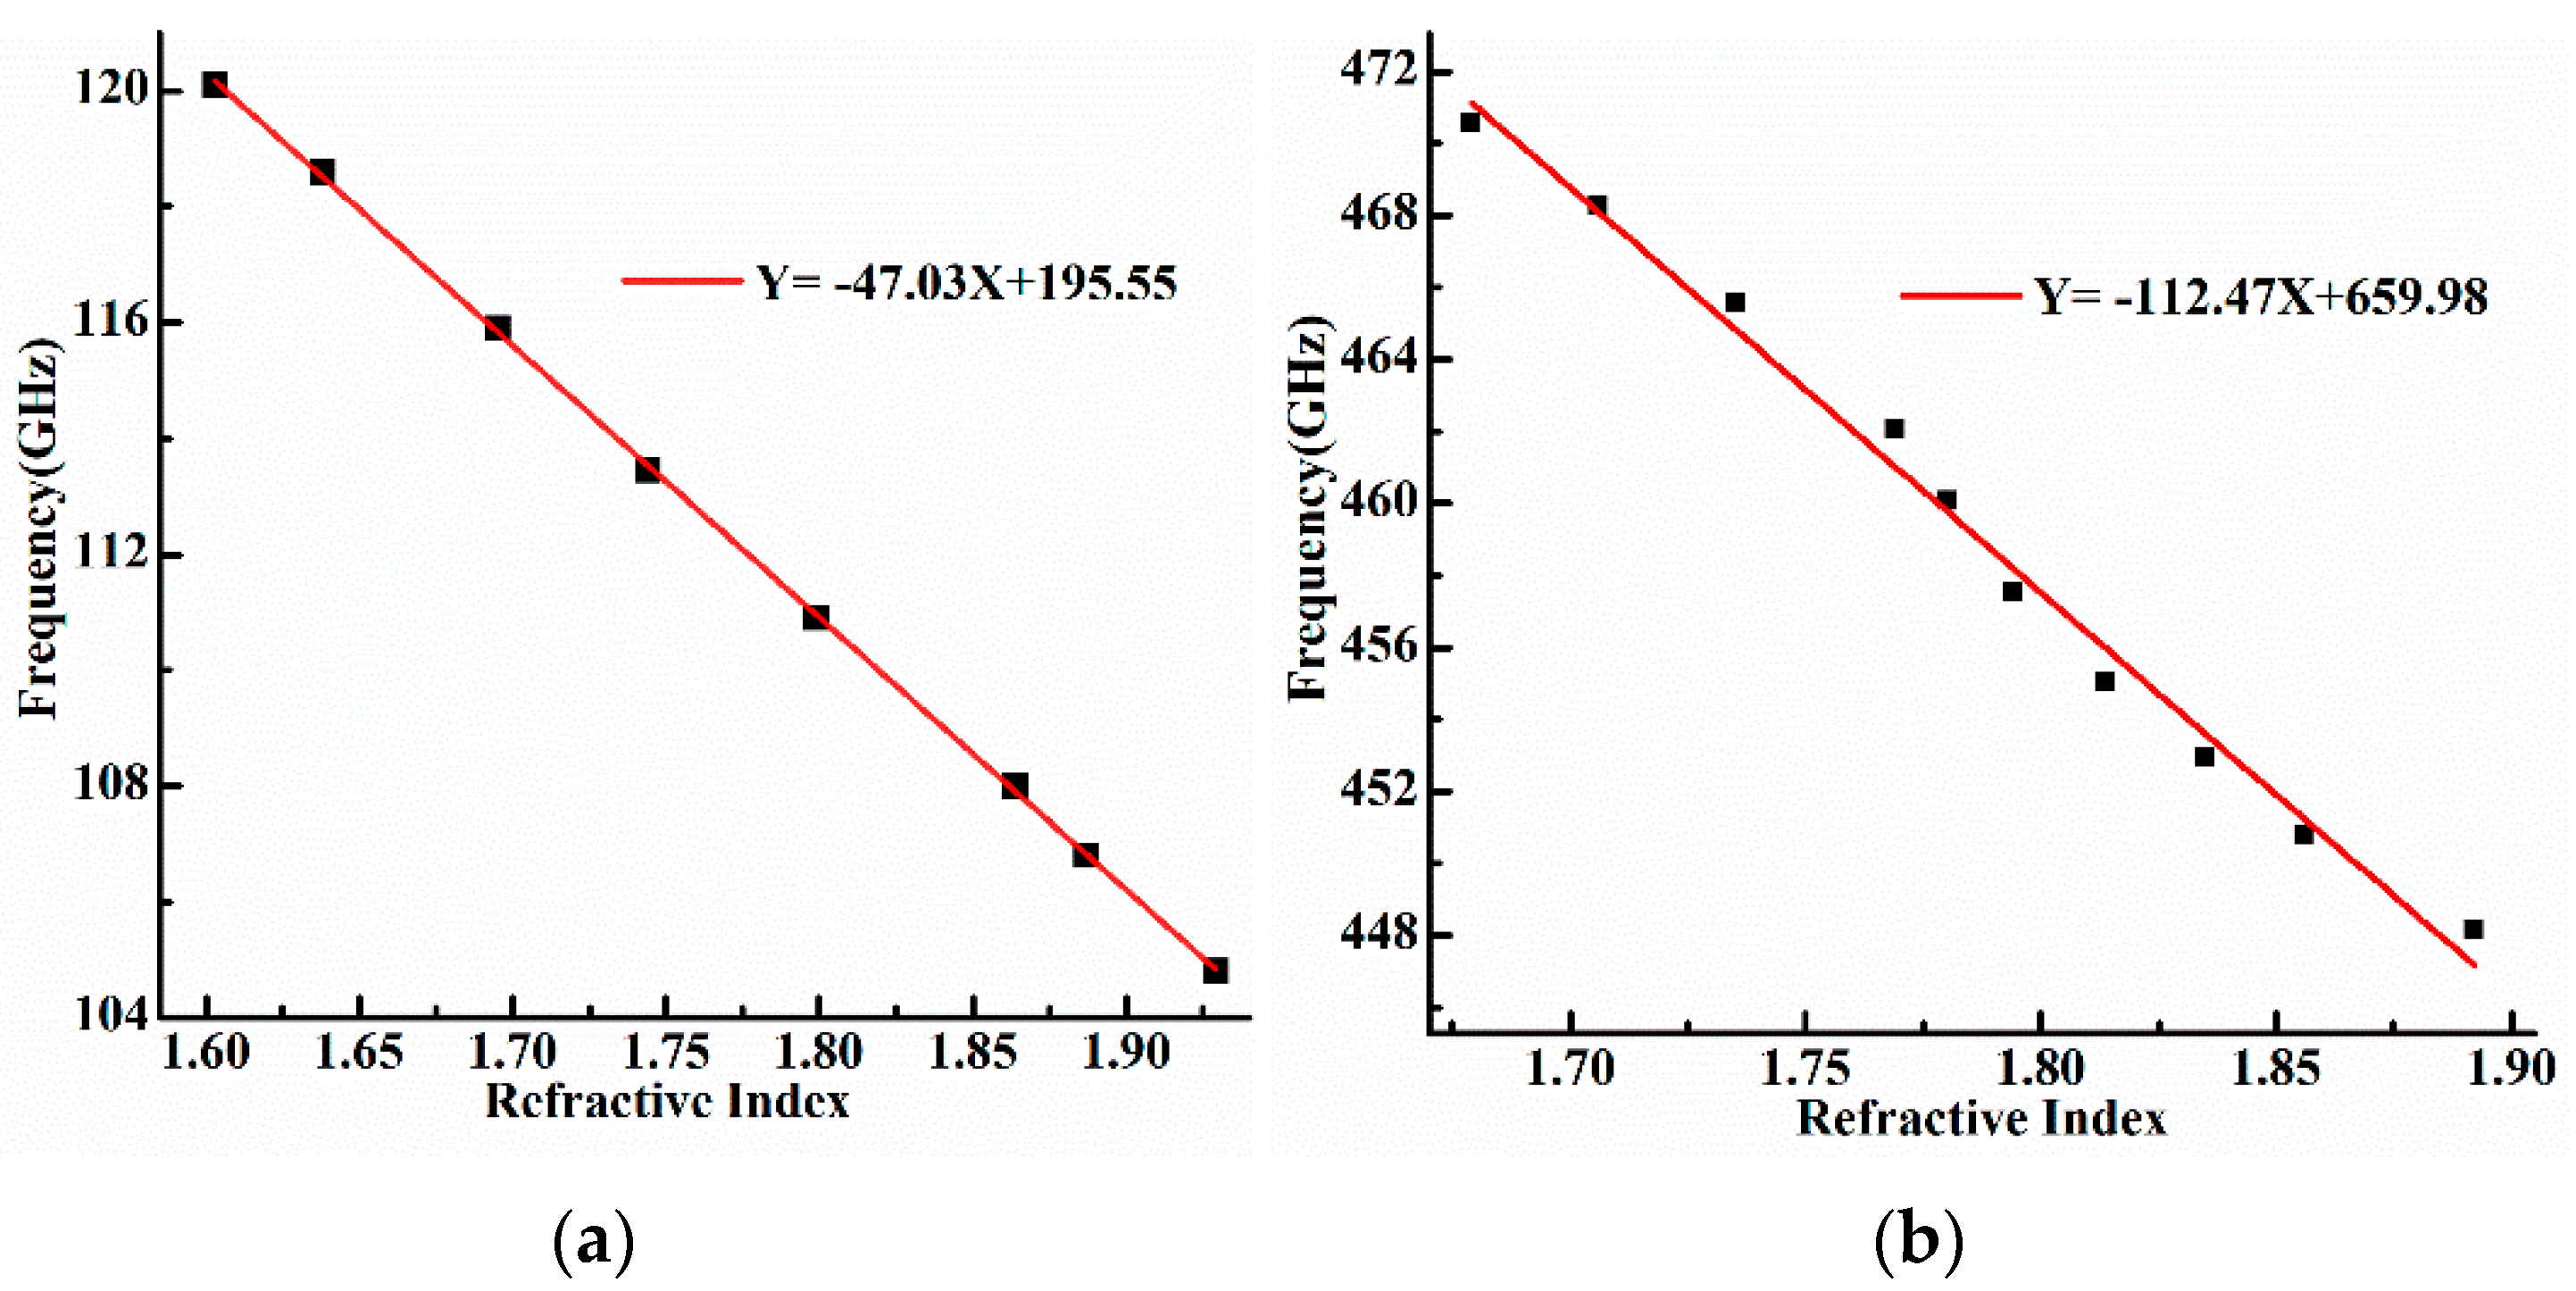
| Resonance frequency (GHz) | 120.1 | 118.6 | 115.9 | 113.45 | 110.9 | 108 | 106.8 | 104.8 |
| Permittivity | 2.570 | 2.684 | 2.873 | 3.040 | 3.238 | 3.475 | 3.562 | 3.720 |
| Refractive index | 1.603 | 1.638 | 1.695 | 1.744 | 1.799 | 1.864 | 1.887 | 1.929 |
| Voltage | 0 V | 0.9 V | 1.3 V | 1.8 V | 2.2 V | 3 V | 4 V | 6 V | 10 V | 18 V |
|---|---|---|---|---|---|---|---|---|---|---|
| Resonance frequency (GHz) | 470.58 | 468.28 | 465.55 | 462.05 | 460.08 | 457.56 | 455.05 | 452.97 | 450.78 | 448.15 |
| Permittivity | 2.820 | 2.912 | 3.011 | 3.129 | 3.168 | 3.220 | 3.290 | 3.367 | 3.446 | 3.580 |
| Refractive index | 1.679 | 1.706 | 1.735 | 1.769 | 1.780 | 1.794 | 1.814 | 1.835 | 1.856 | 1.892 |
4. Summary
Author Contributions
Funding
Data Availability Statement
Conflicts of Interest
References
- Peng, Y.; Huang, J.; Luo, J.; Yang, Z.; Wang, L.; Wu, X.; Zang, X.; Yu, C.; Gu, M.; Hu, Q.; et al. Three-step one-way model in terahertz biomedical detection. PhotoniX 2021, 2, 12. [Google Scholar] [CrossRef]
- Alsharif, M.H.; Kelechi, A.H.; Albreem, M.A.; Chaudhry, S.A.; Zia, M.S.; Kim, S. Sixth Generation (6G) Wireless Networks: Vision, Research Activities, Challenges and Potential Solutions. Symmetry 2020, 12, 676. [Google Scholar] [CrossRef]
- Krügener, K.; Ornik, J.; Schneider, L.M.; Jäckel, A.; Koch-Dandolo, C.L.; Castro-Camus, E.; Riedl-Siedow, N.; Koch, M.; Viöl, W. Terahertz Inspection of Buildings and Architectural Art. Appl. Sci. 2020, 10, 5166. [Google Scholar] [CrossRef]
- Duran, C.A.; Gusten, R.; Risacher, C.; Gorlitz, A.; Klein, B.; Reyes, N.; Ricken, O.; Wunsch, H.-J.; Graf, U.U.; Jacobs, K.; et al. 4GREAT—A Four-Color Receiver for High-Resolution Airborne Terahertz Spectroscopy. IEEE Trans. Terahertz Sci. Technol. 2021, 11, 194–204. [Google Scholar] [CrossRef]
- Habib, A.; Rashed, A.N.Z.; El-Hageen, H.M.; Alatwi, A.M. Extremely Sensitive Photonic Crystal Fiber–Based Cancer Cell Detector in the Terahertz Regime. Plasmonics 2021, 16, 1297–1306. [Google Scholar] [CrossRef]
- Zhang, X.; Xu, Q.; Xia, L.; Li, Y.; Gu, J.; Tian, Z.; Ouyang, C.; Han, J.; Zhang, W. Terahertz surface plasmonic waves: A review. Adv. Photonics 2020, 2, 014001. [Google Scholar] [CrossRef]
- Lee, I.-S.; Lee, J.W. Nondestructive Internal Defect Detection Using a CW–THz Imaging System in XLPE for Power Cable Insulation. Appl. Sci. 2020, 10, 2055. [Google Scholar] [CrossRef]
- Liu, X.; Wang, H.; Luo, C.; Peng, L. Terahertz coded-aperture imaging for moving targets based on an incoherent detection array. Appl. Opt. 2021, 60, 6809–6817. [Google Scholar] [CrossRef]
- Sun, L.; Zhao, L.; Peng, R.Y. Research progress in the effects of terahertz waves on biomacromolecules. Mil. Med. Res. 2021, 8, 28. [Google Scholar] [CrossRef]
- Damari, R.; Weinberg, O.; Krotkov, D.; Demina, N.; Akulov, K.; Golombek, A.; Schwartz, T.; Fleischer, S. Strong coupling of collective intermolecular vibrations in organic materials at terahertz frequencies. Nat. Commun. 2019, 10, 3248. [Google Scholar] [CrossRef] [Green Version]
- Habib, M.A.; Reyes-Vera, E.; Villegas-Aristizabal, J.; Anower, M.S. Numerical Modeling of a Rectangular Hollow-Core Waveguide for the Detection of Fuel Adulteration in Terahertz Region. Fibers 2020, 8, 63. [Google Scholar] [CrossRef]
- Honjo, M.; Suizu, K.; Yamaguchi, M.; Ikari, T. Distance Measurement of a Frequency-Shifted Sub-Terahertz Wave Source. Photonics 2022, 9, 128. [Google Scholar] [CrossRef]
- Xiong, W.; Li, L.; Ren, J.; Gu, J.; Zhang, D.; Xue, J. Terahertz Multiple Echoes Correction and Non-Destructive Testing Based on Improved Wavelet Multi-Scale Analysis. Sensors 2022, 22, 3477. [Google Scholar] [CrossRef]
- Wang, J.; Lindley-Hatcher, H.; Chen, X.; Pickwell-MacPherson, E. THz Sensing of Human Skin: A Review of Skin Modeling Approaches. Sensors 2021, 21, 3624. [Google Scholar] [CrossRef]
- Zhang, M.; Cheng, Q.; Wang, B.; Yang, L.; Wang, J.; Wu, R.; Hou, W. Highly sensitive terahertz sensors based on polarization independent and multiple resonance. Opt. Commun. 2022, 507, 127519. [Google Scholar] [CrossRef]
- Taleb, F.; Al-Naib, I.; Koch, M. Free-Standing Complementary Asymmetric Metasurface for Terahertz Sensing Applications. Sensors 2020, 20, 2265. [Google Scholar] [CrossRef]
- Zhang, S.; Park, Y.S.; Li, J.; Lu, X.; Zhang, W.; Zhang, X. Negative refractive index in chiral metamaterials. Phys. Rev. Lett. 2009, 102, 023901. [Google Scholar] [CrossRef]
- Zhou, T.; Chen, S.; Zhang, X.; Zhang, X.; Hu, H.; Wang, Y. Electromagnetically induced transparency based on a carbon nanotube film terahertz metasurface. Opt. Express 2022, 30, 15436–15445. [Google Scholar] [CrossRef]
- Deng, X.; Shen, Y.; Liu, B.; Song, Z.; He, X.; Zhang, Q.; Ling, D.; Liu, D.; Wei, D. Terahertz Metamaterial Sensor for Sensitive Detection of Citrate Salt Solutions. Biosensors 2022, 12, 408. [Google Scholar] [CrossRef]
- Agarwal, S.; Prajapati, Y.K. Metamaterial based sucrose detection sensor using transmission spectroscopy. Optik 2020, 205, 164276. [Google Scholar] [CrossRef]
- Herbko, M.; Lopato, P. Application of a Single Cell Electric-SRR Metamaterial for Strain Evaluation. Materials 2021, 15, 291. [Google Scholar] [CrossRef]
- Cardoso, M.P.; Silva, A.O.; Romeiro, A.F.; Giraldi, M.T.R.; Costa, J.C.W.A.; Santos, J.L.; Baptista, J.M.; Guerreiro, A. Tunable Plasmonic Resonance Sensor Using a Metamaterial Film in a D-Shaped Photonic Crystal Fiber for Refractive Index Measurements. Appl. Sci. 2022, 12, 2153. [Google Scholar] [CrossRef]
- Wu, J.; Shen, Z.; Ge, S.; Chen, B.; Shen, Z.; Wang, T.; Zhang, C.; Hu, W.; Fan, K.; Padilla, W.; et al. Liquid crystal programmable metasurface for terahertz beam steering. Appl. Phys. Lett. 2020, 116, 131104. [Google Scholar] [CrossRef]
- Ding, C.; Meng, F.-Y.; Mu, H.-L.; Lv, J.-F.; Liu, Y.-H.; Fang, Q.-Y.; Xu, S.-S.; Wu, Q. Bifunctional co-design of liquid crystal phase shifter and band-stop filter. J. Phys. D Appl. Phys. 2019, 52, 415002. [Google Scholar] [CrossRef]
- Deng, G.; Hu, H.; Mo, H.; Yin, Z.; Lu, H.; Hu, M.; Li, J.; Yang, J. Liquid crystal-based wide-angle metasurface absorber with large frequency tunability and low voltage. Opt. Express 2022, 30, 22550. [Google Scholar] [CrossRef]
- Wang, J.; Tian, H.; Li, S.; Wang, G.; Wang, Y.; Li, L.; Zhou, Z. Dual-band terahertz switch with stretchable Bloch-mode metasurface. New J. Phys. 2020, 22, 113008. [Google Scholar] [CrossRef]
- Nickpay, M.-R.; Danaie, M.; Shahzadi, A. Highly Sensitive THz Refractive Index Sensor Based on Folded Split-Ring Metamaterial Graphene Resonators. Plasmonics 2021, 17, 237–248. [Google Scholar] [CrossRef]
- Niu, R.; Zhang, C.; Li, X.; Ma, H.; Sun, Y. Wide viewing angle polarization interference filter using double liquid crystal layers with opposite twisted direction. Opt. Express 2021, 29, 40310–40322. [Google Scholar] [CrossRef]
- Li, X.-S.; Feng, N.; Xu, Y.; Huang, Z.; Wen, K.; Xiong, X. Theoretical and simulation study of dynamically tunable sensor based on liquid crystal-modulated Fano resonator in terahertz band. Opt. Laser Technol. 2022, 155, 108350. [Google Scholar] [CrossRef]
- Fu, X.; Yang, F.; Liu, C.; Wu, X.; Cui, T.J. Terahertz Beam Steering Technologies: From Phased Arrays to Field-Programmable Metasurfaces. Adv. Opt. Mater. 2019, 8, 1900628. [Google Scholar] [CrossRef]
- Gao, S.; Yang, J.; Wang, P.; Zheng, A.; Lu, H.; Deng, G.; Lai, W.; Yin, Z. Tunable Liquid Crystal Based Phase Shifter with a Slot Unit Cell for Reconfigurable Reflectarrays in F-Band. Appl. Sci. 2018, 8, 2528. [Google Scholar] [CrossRef]
- Perez-Palomino, G.; Encinar, J.A.; Barba, M.; Carrasco, E. Design and evaluation of multi-resonant unit cells based on liquid crystals for reconfigurable reflectarrays. IET Microw. Antennas Propag. 2012, 6, 348–354. [Google Scholar] [CrossRef]
- Li, J.; Hu, M.; Chen, R.; Zhu, S.; Li, J.; An, Z.; Zhang, L.; Shi, F. Low dielectric loss and good miscibility of the tolane liquid crystals by tuning their lateral substituents. J. Mol. Liq. 2021, 325, 115236. [Google Scholar] [CrossRef]
- Mao, R.; Zhang, G.; Xu, L.; Gao, H.; Yang, J.; Yin, Z.; Deng, G.; Lu, H. Dielectric Properties of Liquid Crystal Polymer Substrates in the Region from 90 to 140 GHz. Crystals 2022, 12, 170. [Google Scholar] [CrossRef]


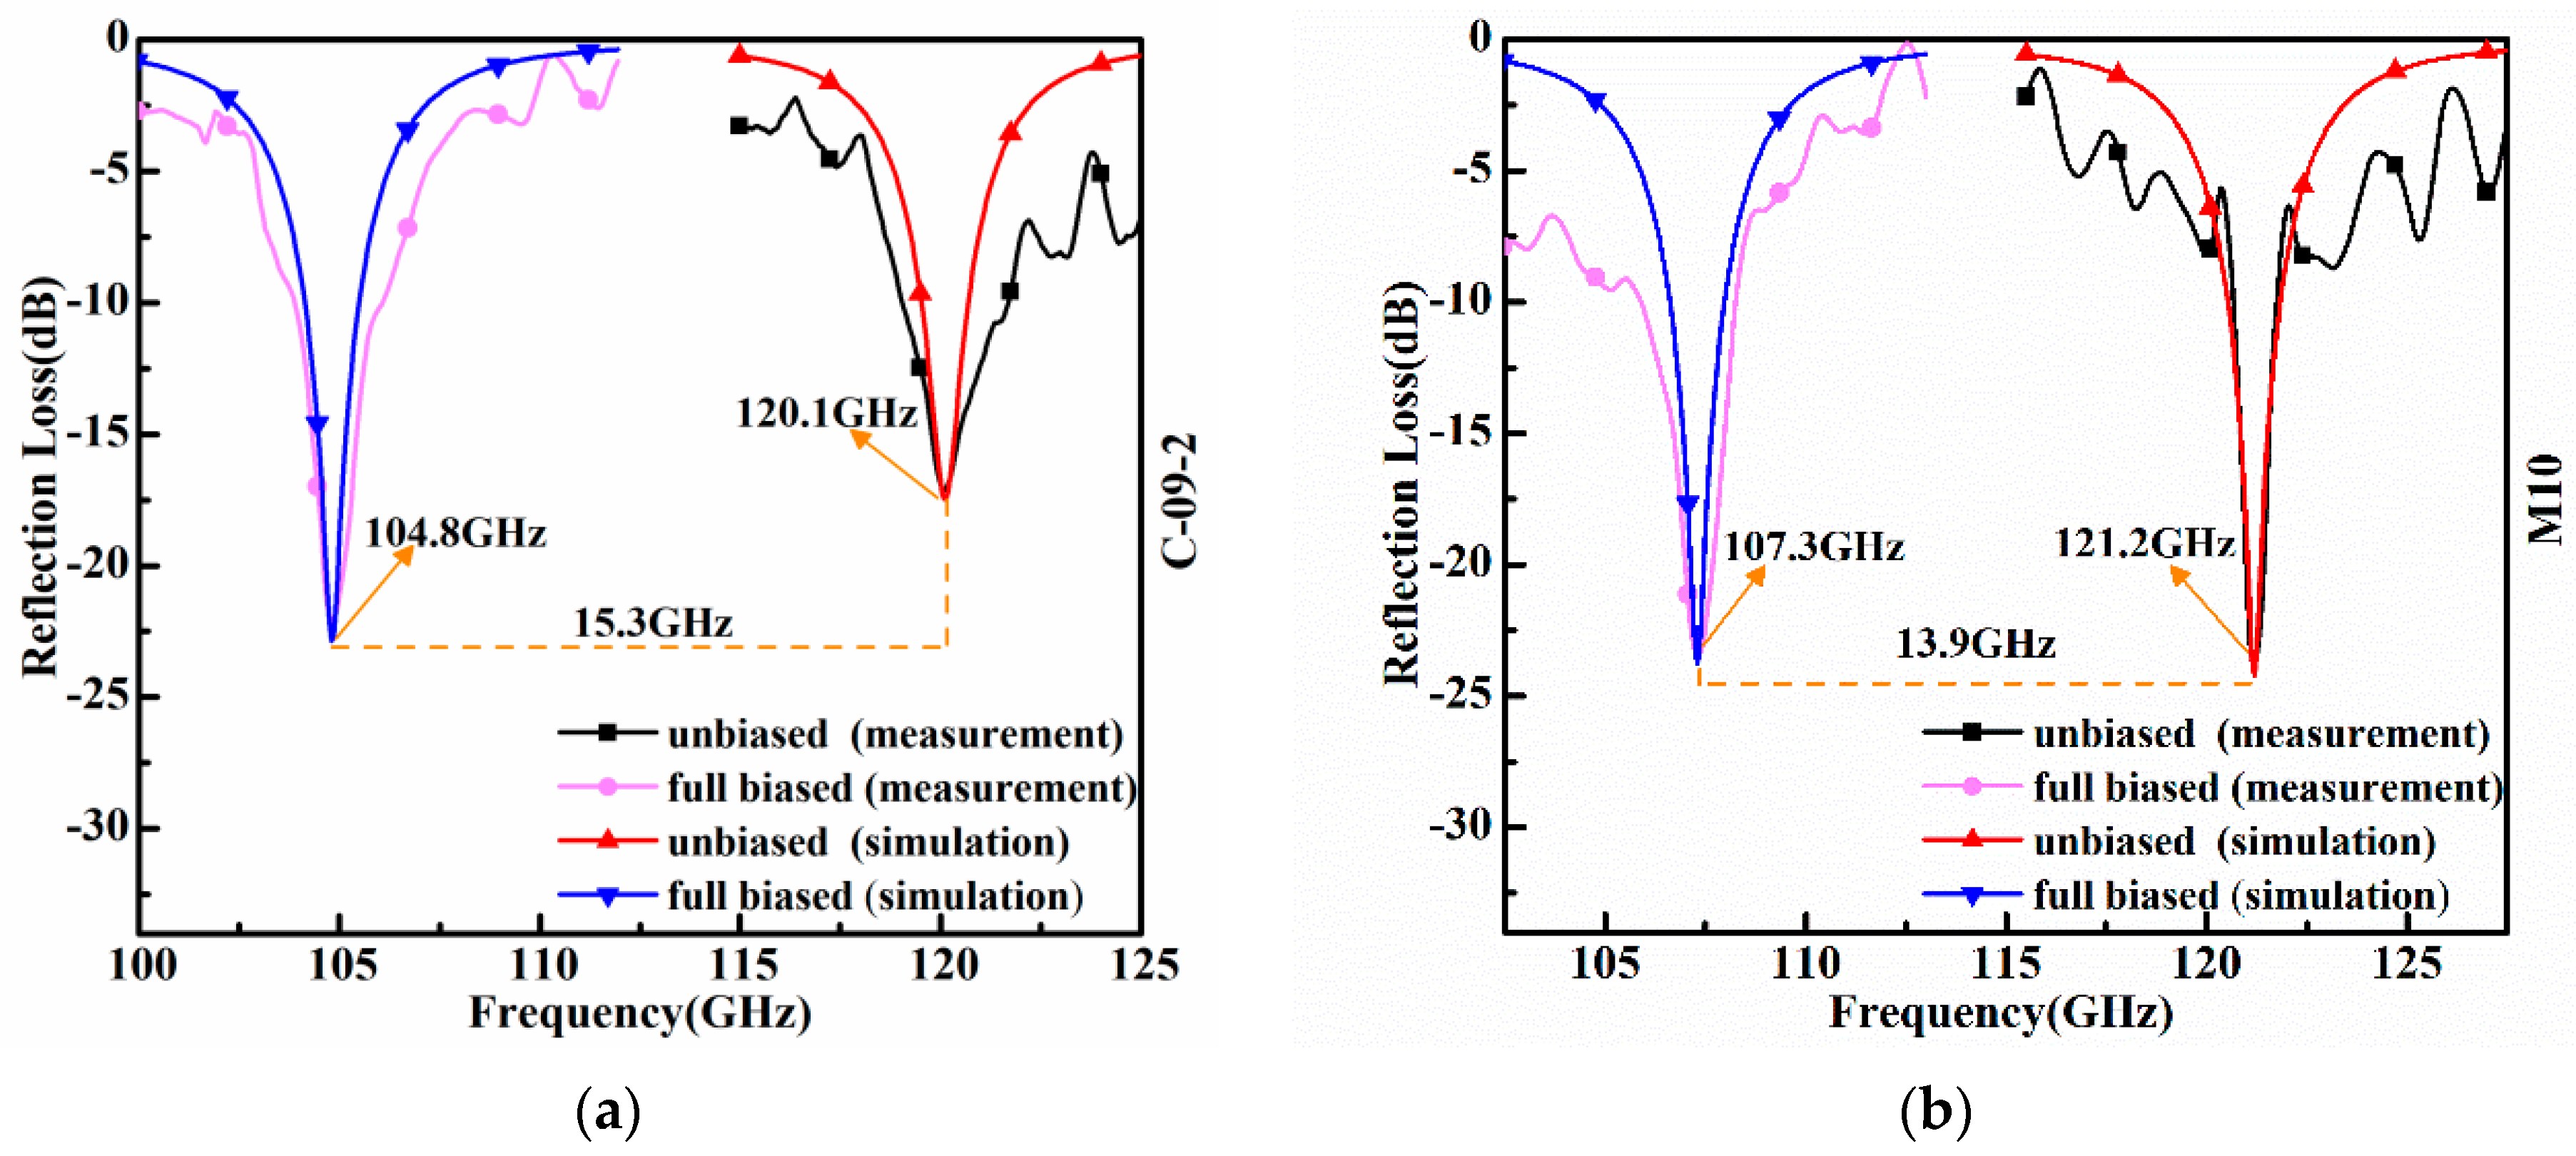
| LC | Frequency (GHz) | Frequency Shift Range (GHz) | εmin | εmax | Δε | Birefringence |
|---|---|---|---|---|---|---|
| C-09-2 | 120.10–104.80 | 15.30 | 2.57 | 3.72 | 1.16 | 0.33 |
| M10 | 121.20–107.30 | 13.90 | 2.50 | 3.52 | 1.02 | 0.30 |
| C-09-2 | 470.58–448.16 | 22.43 | 2.82 | 3.58 | 0.76 | 0.21 |
| M10 | 471.02–449.14 | 21.88 | 2.81 | 3.51 | 0.70 | 0.20 |
Publisher’s Note: MDPI stays neutral with regard to jurisdictional claims in published maps and institutional affiliations. |
© 2022 by the authors. Licensee MDPI, Basel, Switzerland. This article is an open access article distributed under the terms and conditions of the Creative Commons Attribution (CC BY) license (https://creativecommons.org/licenses/by/4.0/).
Share and Cite
Li, X.; Zheng, G.; Zhang, G.; Yang, J.; Hu, M.; Li, J.; Li, Y.; Lu, H.; Yin, Z. Highly Sensitive Terahertz Dielectric Sensor for Liquid Crystal. Symmetry 2022, 14, 1820. https://doi.org/10.3390/sym14091820
Li X, Zheng G, Zhang G, Yang J, Hu M, Li J, Li Y, Lu H, Yin Z. Highly Sensitive Terahertz Dielectric Sensor for Liquid Crystal. Symmetry. 2022; 14(9):1820. https://doi.org/10.3390/sym14091820
Chicago/Turabian StyleLi, Xianping, Guanghong Zheng, Guozhen Zhang, Jun Yang, Minggang Hu, Jian Li, Ying Li, Hongbo Lu, and Zhiping Yin. 2022. "Highly Sensitive Terahertz Dielectric Sensor for Liquid Crystal" Symmetry 14, no. 9: 1820. https://doi.org/10.3390/sym14091820
APA StyleLi, X., Zheng, G., Zhang, G., Yang, J., Hu, M., Li, J., Li, Y., Lu, H., & Yin, Z. (2022). Highly Sensitive Terahertz Dielectric Sensor for Liquid Crystal. Symmetry, 14(9), 1820. https://doi.org/10.3390/sym14091820