Article

Application of Wavelet Characteristics and GMDH Neural Networks for Precise Estimation of Oil Product Types and Volume Fractions

by
Abdulilah Mohammad Mayet
1,
Seyed Mehdi Alizadeh
2,
Karwan Mohammad Hamakarim
3,
Ali Awadh Al-Qahtani
1,
Abdullah K. Alanazi
4,
John William Grimaldo Guerrero
5,*,
Hala H. Alhashim
6 and
Ehsan Eftekhari-Zadeh
7,*
1
Electrical Engineering Department, King Khalid University, Abha 61411, Saudi Arabia
2
Petroleum Engineering Department, Australian College of Kuwait, West Mishref 13015, Kuwait
3
Department of Information Technology, College of Science and Technology, University of Human Development, Kurdistan Region 46001, Iraq
4
Department of Chemistry, Faculty of Science, Taif University, P.O. Box 11099, Taif 21944, Saudi Arabia
5
Department of Energy, Universidad de la Costa, Barranquilla 080001, Colombia
6
Department of Physics, College of Science, Imam Abdulrahman Bin Faisal University, P.O. Box 1982, Dammam 31441, Saudi Arabia
7
Institute of Optics and Quantum Electronics, Friedrich Schiller University Jena, Max-Wien-Platz 1, 07743 Jena, Germany
*
Authors to whom correspondence should be addressed.
Symmetry 2022, 14(9), 1797; https://doi.org/10.3390/sym14091797
Submission received: 18 July 2022 / Revised: 19 August 2022 / Accepted: 26 August 2022 / Published: 30 August 2022
(This article belongs to the Special Issue Computer Vision, Pattern Recognition, Machine Learning, and Symmetry)

Abstract

:
Given that one of the most critical operations in the oil and gas industry is to instantly determine the volume and type of product passing through the pipelines, in this research, a detection system for monitoring oil pipelines is proposed. The proposed system works in such a way that the radiation from the dual-energy source which symmetrically emits radiation, was received by the NaI detector after passing through the shield window and test pipeline. In the test pipe, four petroleum products—ethylene glycol, crude oil, gasoil, and gasoline—were simulated in pairs in different volume fractions. A total of 118 simulations were performed, and their signals were categorized. Then, feature extraction operations were started to reduce the volume of data, increase accuracy, increase the learning speed of the neural network, and better interpret the data. Wavelet features were extracted from the recorded signal and used as GMDH neural network input. The signals of each test were divided into details and approximation sections and characteristics with the names STD of A3, D3, D2 and were extracted. This described structure is modelled in the Monte Carlo N Particle code (MCNP). In fact, precise estimation of oil product types and volume fractions were done using a combination of symmetrical source and asymmetrical neural network. Four GMDH neural networks were trained to estimate the volumetric ratio of each product, and the maximum RMSE was 0.63. In addition to this high accuracy, the low implementation and computational cost compared to previous detection methods are among the advantages of present investigation, which increases its application in the oil industry.

1. Introduction

Pipelines are responsible for the transportation of various petroleum products, and in this regard, the reduction of transportation costs is greatly valued. When there is a product in the pipe and another product enters the pipe, these two products are mixed in a cross-section, which is called the interface area. This is where the importance of implementing a control system to determine the type and volume of the product comes into play. In previous studies, gamma ray–based systems were used as reputable systems for the detection of two-phase [1,2,3] and three-phase [4,5,6] flows. Distinct neural networks such as adaptive fuzzy neural inference systems, RBF neural networks, MLP, and GMDH were responsible for predicting volume percentage and type of flow regime in these studies. In [7,8], researchers used MLP and GMDH, which are popular neural networks, in order to ameliorate accuracy in determining volume percentages through characteristic extraction techniques. The characteristics of Compton continuum counting, count under photopeaks of 1.333 MeV and 1.173 MeV, and the average value have been investigated by Roshani et al. [9]. The kind of flow regime and the volume percentage of two-phasic flows were detected with great accuracy using the GMDH neural network. If the conditions are such that the scale settles inside the pipe and the two-phase flow passes in different volume percentages and flow regimes, the conditions are slightly different. The authors experienced a similar situation in [10], finding that characteristics of counts under photopeaks of Ba-133 and Cs-137 in addition to the RBF neural network are quite effective in determining the thickness of the scale inside the pipe. Ref. [11] proposed a structure consisting of a dual-energy source, a test pipe, and a detector; this did not provide precise control over the type and amount of petroleum products. The non-use of feature extraction techniques (although the amount and type of volumetric percentage were not indistinguishable in this research) prevented the achievement of a high-accuracy system. In references [12,13], research was conducted to determine the volume ratio. In former studies, X-ray pipes were used more than radioisotopes because of their extinguishing ability and the health of employees. In some research projects, such as [14,15], the proposed structure consisted of an X-ray tube that predicted the volume percentage and type of multiphase flow regimes. In [14], the temporal characteristics of variance, skewness, kurtosis, the sum of square roots (SSR), and the sum of roots of variable power (SVER) were extracted from the signal acquired from a detector and used as the input of the neural network. Detection of all flow regimes and prediction of volume percentages with a MAPE of 1.16 are the achievements of this research. In [15], a three-phase flow was investigated. In addition to the test pipe, there was an X-ray tube and a pair of NaI detectors in the structure of the system. Fast Fourier transform (FFT) was responsible for transferring the signals of two detectors to the frequency domain, and in this procedure, the frequency characteristics of the first and second dominant frequencies were procured. The training of three RBF neural networks responsible for detecting the type of flow regimes and volume percentage was done using these features. In another study, a detection system based on X-ray tubes was designed and presented; however, a lack of extraction techniques was one of the disadvantages of this system [16]. In [17], researchers used the features of wavelet transformation to develop previous research, such as [16], which lacked this procedure. In reference [17] researchers extracted the details of the first to fifth stages and the approximation of the fifth stage features using wavelet transform and delivered them as the input of the MLP neural network. In [18], various temporal characteristics were extracted, with the aim of helping the process of detecting the type and amount of petroleum products passing through the pipeline. Finally, after calculating the correlation of these features with each other, the inputs of the MLP neural network became the features that had the least similarity with each other. Although the feature extraction technique was used in this study, the proposed system RMSE was 1.21. The systems that benefit from the gamma source have been introduced in previous research as systems with a high-reliability factor in determining the parameters of multiphase flows. In all of the mentioned studies, the researchers were forced to use a greater number of detectors due to the lack of extracting the proper characteristics from the received signals; in addition, the accuracy of their presented systems was not very high. The use of multiple detectors raises the cost and complexity of the system design. In this study, by using the wavelet transform technique, an attempt has been made to optimize the configuration of the measuring system, reduce the number of detectors, and reduce the system error. The contributions of this research are as follows:
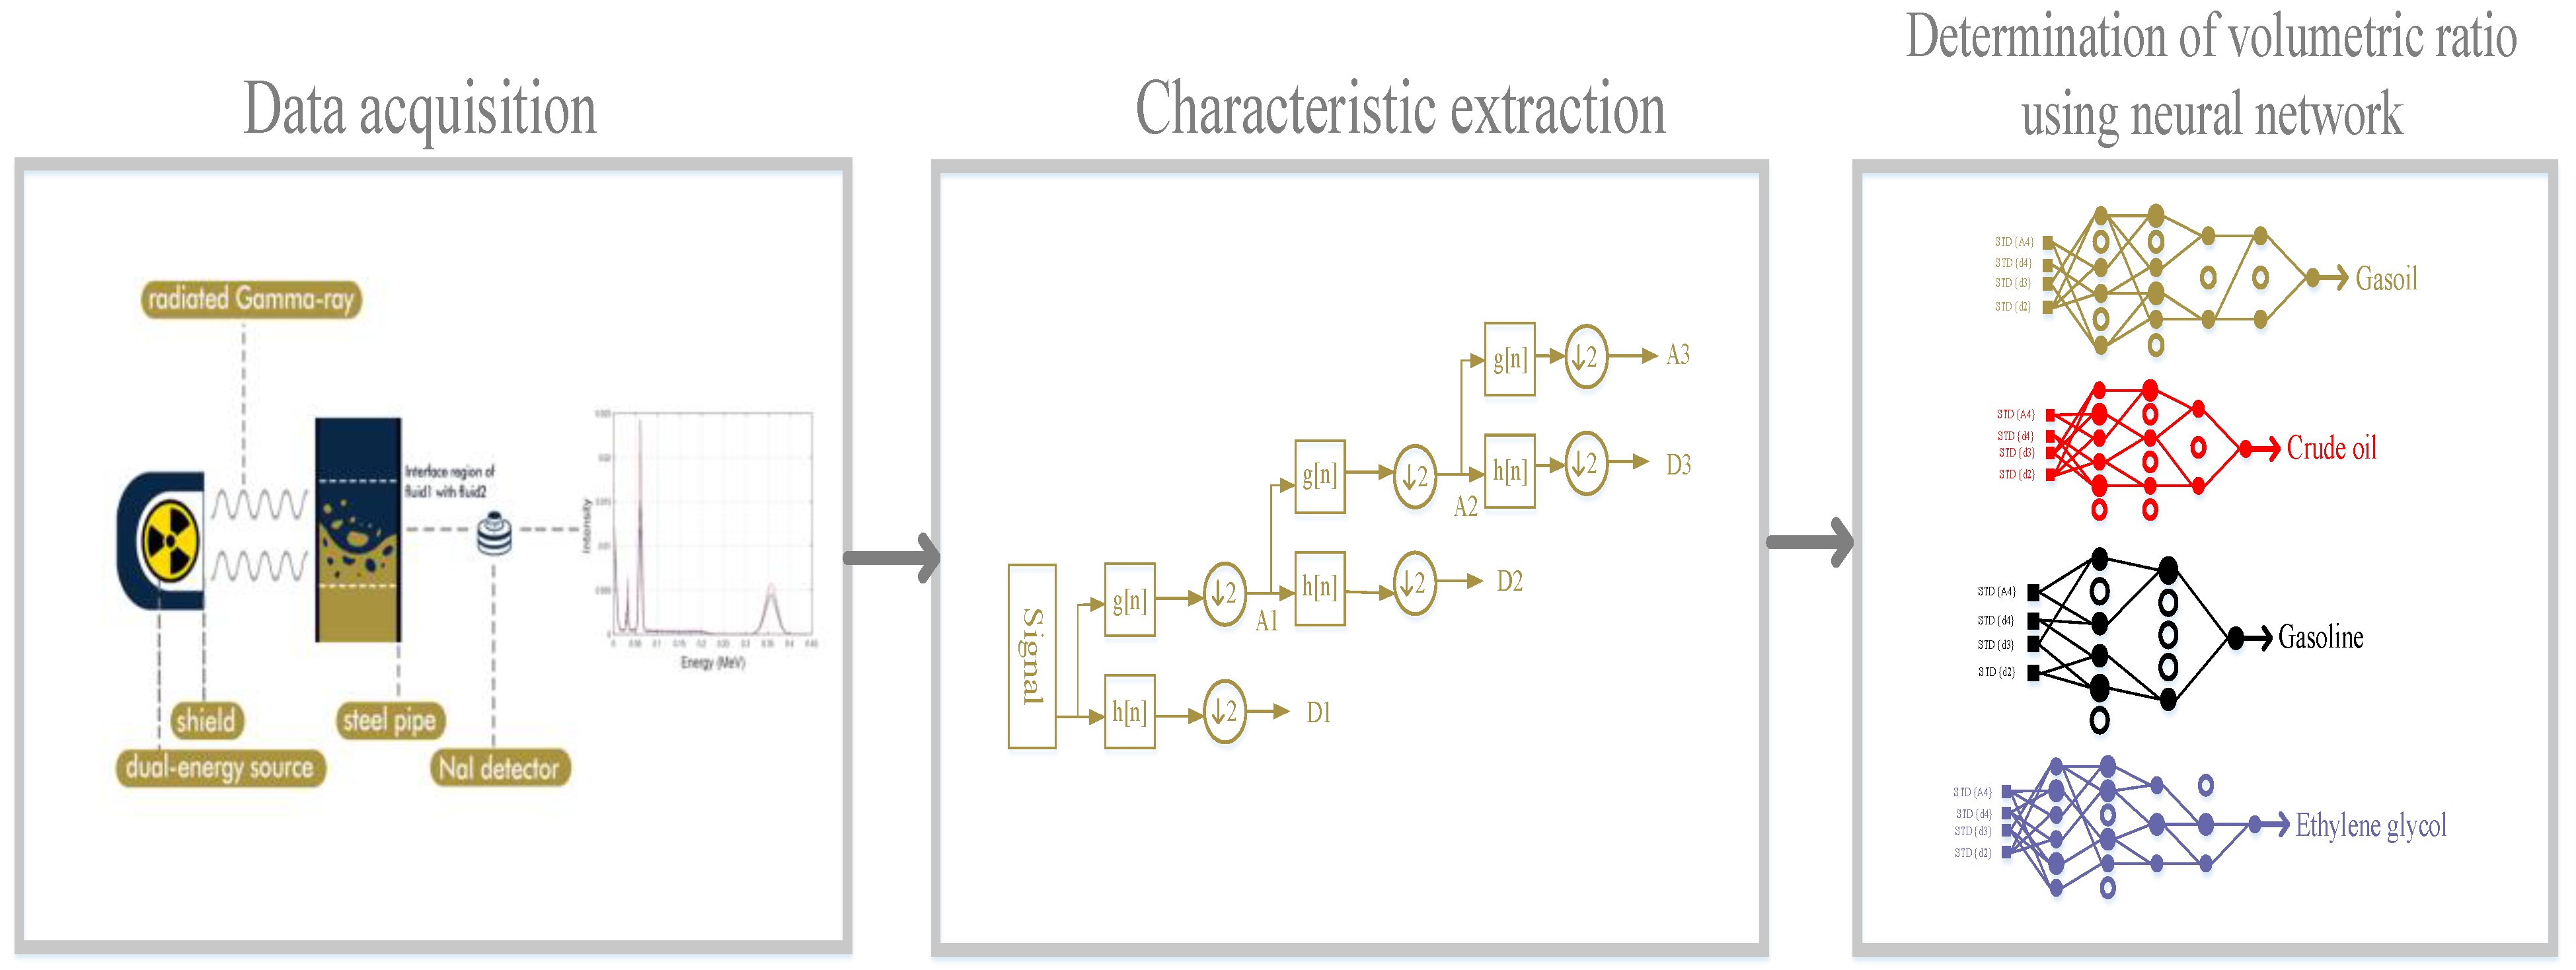
  • Using wavelet transform to extract signal characteristics.
  • Reducing costs and complexity of the detection system structure by using only one detector.
  • Increasing accuracy in determining volume rates, which is due to extracting useful characteristics from received signals.
  • Using the GMDH neural network as a network organizes itself for volume rate determination.
In present investigation, a dual energy source with a detector and test pipeline is suggested, after implementing an accurate system for discerning the type and volume fraction of each petroleum product contained in the pipeline. The difference between the existing research and the suggested system is obtaining the wavelet characteristics of the recorded signal and implementing the GMDH neural network using these characteristics. As a result, it can be said that the accuracy of the detection system has been greatly improved.

2. Simulation Geometry

In this paper, utilization of a detection system to determine the type and amount of the oil product inside the pipe was the aim. A binary energy source, a detector, and a test pipe placed between the source and the detector make up the structure of the detection system. The products examined in this research include gasoline, crude oil, ethylene glycol, and gasoil, which have densities of 1.114, 0.975, 0.721, and 0.826 g/cm3, respectively. Monte Carlo N Particle (MCNP) code, as a very practical tool in the design of radiation-based systems, is used in this research to implement the structure of the detection system. As different oil products pass through the oil pipelines, two products are combined in a cross section. The four introduced oil products were simulated in conditions where they were mixed together in pairs and at different volume rates inside the test pipe. In total, six different composition states and nineteen different volume percentages in the range of 5% to 95% and four states with just one product inside the tube were simulated. The dual energy gamma source was made of americium-241 and barium-133, which symmetrically emit radiation. The detector, which was placed on the other side of the pipe, was responsible for recording the transmitted photons sent by the source. Muhammad’s law is used to describe the attenuation rate of the narrow gamma photon in collision with different objects. If a narrow gamma ray hits an object, the attenuation rate is calculated based on LamberteBeer’s law:
I = I 0 e μ ρ x
where the flux of un-collided is addressed by I, I0 is the primary photon, µ and ρ represent of the mass attenuation coefficient and density of the absorber material, and the beam path length through the material is shown by x. Equation (1) states that gamma rays will behave differently when they hit different things. This difference in behavior is important in determining what kind, and how much, of a substance is in the environment. In this investigation, a 2.54 cm × 2.54 cm NaI detector was applied to record the transmitted photons. Pulse height tally was applied to record gamma ray energy spectra. The reproduction after-effects of this study were established by past examinations [1]. In this review, a few research laboratory structures were executed and compared with the outcomes from the MCNP code. The structure of the detection system and the signals recorded by the detector are depicted in Figure 1.

3. Characteristic Elicitation

3.1. Discrete Wavelet Transform

The purpose of this research is to improve the accuracy and optimization of the volumetric rate detection system of petroleum products. For this purpose, the feature extraction technique is used to better interpret the available data using neural networks and reduce the volume of calculations. In addition, increasing the learning speed and reducing the system error are among the advantages of effective feature extraction. The feature extraction technique allows us to use multiple features extracted from the signal of one detector instead of using multiple detectors, which will reduce costs, simplify the system, and increase accuracy. Discrete wavelet transform (DWT) is one of the numerical and applied analyses in which the wavelet is sampled as discrete. The most crucial advantage of the discrete wavelet transform over Fourier transform is that in addition to frequency characteristics, time characteristics are also available. To calculate the DWT of a signal, first a low-pass filter with an impulse response g is applied to the signal, which results in the convolution of the two, as follows:
y [ n ] = ( x × g ) [ n ] = k = x [ k ] g [ n k ]
Another high-pass filter (h) simultaneously decomposes the signal. Approximate coefficients (low-pass filter output) and detailed coefficients (high-pass filter output) are the output of this process. Figure 2 shows the signal decomposition process. As can be seen from this figure, a downsampler by 2 is located at the output of the filters at each stage. The downsampled results of the low-pass filter provide the approximation (A), and the output of the downsamplers of the high-pass filter provides details (D). The approximation part of each stage can be decomposed over and over again. In this research, the decomposition has continued up to three stages.
The wavelet operation is the calculation of the wavelet coefficients of a discrete set of child wavelets for a given mother wavelet ψ ( t ) . The mother wavelet in the case of discrete wavelet transform is displaced and scale-changed by powers of two [19,20]:
ψ j , k = 1 2 j ψ ( t k 2 j 2 j )
where j is the parameter of scale and k represents the parameter of shift.
The wavelet coefficients γ obtained from the x(t) signal can be interpreted as the projection of x(t) onto a wavelet, and x(t) is a signal with a length of 2N. In the case of a child wavelet in the discrete family above,
γ j k = x ( t ) 1 2 j ψ ( t k 2 j 2 j ) d t
Then, j is fixed, and the γ j k is obtained only in terms of a function of k. In the above equation, γ j k can be obtained as the convolution of the x(t) with the mother wavelet signal, h ( t ) = 1 2 j ψ ( t 2 j ) , sampled at the points 1, 2j. 22j, …, 2N. These are details of discrete wavelet coefficients at level j. Therefore, for the proper selection of h[n] and g[n], the detailed coefficients of the filter bank, correspond to a wavelet coefficient of a discrete set of child wavelets for a given parent wavelet ψ(t).
The decomposition process of the signal obtained by the detector is illustrated in Figure 3. According to this figure, from the third stage onwards, no significant high-frequency information is obtained, and the approximation signal no longer correctly approximates the original signal; thus, in this study, the signal decomposition continues only until the third stage. MATLAB software was used to perform wavelet-related processes. In the MATLAB software, there is a toolbox called ‘WaveMenu’; the appearance of this toolbox and the division of the signal into details and approximation parts are shown in Figure 3. After using this toolbox, approximation and detailed signals were obtained, and it was determined that significant high-frequency information will not be obtained from the third approximate signal onwards, so it continued until the third stage of wavelet. After that, to provide suitable data for network input, the STD feature of A3, D3, D2, and D1 were calculated. The matrix obtained from this step is a 4 × 118 matrix with 4 rows and 118 columns. Four rows indicating 4 extracted features and 118 columns indicating 118 different tests were performed in different volume percentages. This matrix is considered as input, and the outputs of the network are 118 × 4 matrices; each of the rows is assigned to the output of a GMDH neural network. In past research [17,21,22], these characteristics were introduced as useful characteristics, so the mentioned characteristics were applied for improving the accuracy and optimizing the structure of the volumetric rate detection system.
S T D = 1 N 1 i = 1 N | x i μ | 2
μ = 1 N i = 1 N x i
where x i is the primary data, and N is the number of data.

3.2. GMDH Neural Network

In 1968, a Ukrainian mathematician developed a method for learning inductive statistics, called the Group Method of Data Handling (GMDH) [23]. A self-control model was developed with the power to monitor the synthesis and related system problems and to solve predictions and classifications. In GMDH operations, the hidden layer, neuron values, effective input profiles, and efficient network construction were determined independently. Polynomiality, orderliness, and meaningfulness are the basic premises of the input–output system relations, which are shown below as the Kolmogorov-Gabor polynomial.
y = a 0 + i = 1 m a i x i + i = 1 m j = 1 m a i j x i x j + i = 1 m j = 1 m k = 1 m a i j k x i x j x k +
where a (a1, a2, …, am) are weights or coefficients of the vector, X (x1, x2, …, xm) are also vector inputs or the same extracted features, and y is the output of the network. The steps of the GMDH algorithm are as follows:
Step A: generating novel variants z 1 , z 2 , …, z ( m 2 ) . In this part, for the total non-dependent variables (x1, x2, …, xm), two synchronic polynomials, and for any ( m 2 ) admixture, the quadratic regression polynomials are computed by considering Equation (8).
Z = c 1 + c 2 x i + c 3 x j + c 4 x i 2 + c 5 x j 2 + c 6 x i x j
This step aims to achieve the c i coefficients. The least squares algorithm was applied to acquire the coefficients. Every ( m 2 ) compiled quadratic regression polynomial approximates the insignificant output.
Step B: Screening for non-significant z is such that the error of each output in the given neurons (each neuron must be approximated by a quadratic regression polynomial) is calculated with the desired output; the outputs with the maximum amount errors are not based on this. On a scale of options, another is applied to build the following layer. Here, the first latent layer is produced, and the affected neurons are systematically selected.
Step C: applying modern variables ( z 1 , z 2 , …, z ( m 2 ) ) as the quadratic regression polynomial inputs to generate modern variables. This means that the novel polynomial is obtained from the bygone polynomial ( z 1 , z 2 , …, z ( m 2 ) ); by making a polynomial of a polynomial, the high-order polynomial is retained for solving intricate and nonlinear issues. Then step B was repeated, and the outputs were considered with the best estimate of the desired outputs. After creating the hidden layer, the production of new polynomials and their best approximation takes enough time to obtain the best input–output relations and finally results in Kolmogorov-Gabor polynomials.
Step D: checking the GMDH neural network. At this stage, the final model is evaluated against the experimental data set to determine whether a specific input–output relationship is established. In this study, 83 data were used for training data (approximately 70%) and 35 data were used for network testing. To estimate the volume fraction of each phase in this investigation, a GMDH network was used, and the derived features (as discussed in the previous step) were considered as inputs of the GMDH neural network for testing and training. Recently, numerical calculations [24,25,26,27,28,29,30,31,32,33,34,35,36,37,38], as a powerful mathematical tool, were used in several engineering problems, chiefly artificial networks [39,40,41,42,43,44].

4. Result and Discussion

The features extracted in the previous step were considered as the input of the GMDH neural network. As explained, four petroleum products—gasoline, crude oil, ethylene glycol, and gasoil—were examined in combination with each other in two by two at various volume rates. The aim of present investigation is to determine the volumetric rates of these products. Four GMDH networks were developed to define the relationship between inputs (extracted features) and outputs (volume rates). Regression diagrams and error diagrams are two ways to show the performance of neural networks; in the regression diagram, lines and circles show the target output and neural network output, respectively, and in error diagram, the difference between target output and neural network output is shown. The structure of the designed networks, regression diagram, and the error diagram for each network are shown in Figure 4, Figure 5, Figure 6 and Figure 7. The specifications of trained neural networks are shown in Table 1. Simultaneous working of four neural networks makes the type and amount of product passing through the pipeline recognizable. The steps of determining volume rates in this research can be seen in general in Figure 8. The comparison of the precision of the proposed system with former investigations is shown in Table 2.
Using the following equations, two error criteria, the mean square error (MSE) and root mean square error (RMSE), are calculated, and the results are shown in Table 1. These values are important for calculating the precision of the designed neural networks.
MSE = j = 1 N ( X j ( E x p ) X j ( P r e d ) ) 2 N
RMSE = [ j = 1 N ( X j ( E x p ) X j ( P r e d ) ) 2 N ] 0.5

5. Conclusions

It can be said that designing and applying a trustworthy and efficacious control system is one of the most important elements of the oil industry. In this regard, a structure was simulated, which consisted of three main parts: the NaI detector, the energy source, and the pipe under test. The pipeline was also used in the simulation of petroleum products in various combinations. After the simulation was complete, involving a 2 × 2 combination of four various petroleum products with different volume fractions, the signal received from the detector was processed. From each recorded signal, four wavelet features of approximation of the third stage and ingredients of the first to third stages were extracted and ascertained as inputs of neural networks. The design of GMDH neural networks is intended to detect the production volume of each oil. By running four neural networks simultaneously, we could quickly measure the amount and type of product in the pipeline. The mentioned engineered network has a maximum RMSE value of 0.63, which is a tiny error number for the volume ratio prediction. The low error of the introduced system is due to the use of proper characteristics of the recorded signals, that made the interpretation of the data smoother for the neural network. In addition, reducing the amount of data and increasing the learning speed of the neural network are among the advantages of the proposed detection system. Moreover, in this research, by extracting the effective characteristics, the need to use multiple detectors was eliminated; only one detector was used to determine the volume rates, which reduces the complexity of the presented system. What can make a system succeed in its task in the oil industry is a low detection error; the low error value in the proposed system shows that this system is a proper option for controlling oil products passing through the pipeline.

Author Contributions

Formal analysis, A.K.A.; Funding acquisition, A.M.M.; Investigation, K.M.H.; Methodology, A.M.M., A.A.A.-Q., H.H.A. and S.M.A.; Software, H.H.A., A.A.A.-Q. and A.M.M.; Supervision, J.W.G.G.; Visualization, E.E.-Z., J.W.G.G. and A.M.M.; Writing—original draft, S.M.A. and A.K.A. All authors have read and agreed to the published version of the manuscript.

Funding

This work was supported by the Deanship of Scientific Research at King Khalid University (Grant numbers RGP.1/243/42). The authors acknowledge support from the German Research Foundation and the Open Access Publication Fund of the Thueringer Universitaets-und Landesbibliothek Jena Projekt-Nr. 433052568.

Institutional Review Board Statement

Not applicable.

Informed Consent Statement

Not applicable.

Data Availability Statement

Not applicable.

Conflicts of Interest

The authors declare no conflict of interest.

References

  1. Nazemi, E.; Roshani, G.H.; Feghhi, S.A.H.; Setayeshi, S.; Zadeh, E.E.; Fatehi, A. Optimization of a method for identifying the flow regime and measuring void fraction in a broad beam gamma-ray attenuation technique. Int. J. Hydrog. Energy 2016, 41, 7438–7444. [Google Scholar] [CrossRef]
  2. Nazemi, E.; Feghhi, S.A.H.; Roshani, G.H.; Peyvandi, R.G.; Setayeshi, S. Precise void fraction measurement in two-phase flows independent of the flow regime using gamma-ray attenuation. Nucl. Eng. Technol. 2016, 48, 64–71. [Google Scholar] [CrossRef]
  3. Roshani, G.H.; Nazemi, E.; Feghhi, S.A.H. Investigation of using 60 Co source and one detector for determining the flow regime and void fraction in gas–liquid two-phase flows. Flow Meas. Instrum. 2016, 50, 73–79. [Google Scholar] [CrossRef]
  4. Roshani, G.H.; Karami, A.; Nazemi, E.; Shama, F. Volume fraction determination of the annular three-phase flow of gas-oil-water using adaptive neuro-fuzzy inference system. Comput. Appl. Math. 2018, 37, 4321–4341. [Google Scholar] [CrossRef]
  5. Roshani, M.; Phan, G.; Roshani, G.H.; Hanus, R.; Nazemi, B.; Corniani, E.; Nazemi, E. Combination of X-ray tube and GMDH neural network as a nondestructive and potential technique for measuring characteristics of gas-oil–water three phase flows. Measurement 2021, 168, 108427. [Google Scholar] [CrossRef]
  6. Roshani, G.H.; Karami, A.; Nazemi, E. An intelligent integrated approach of Jaya optimization algorithm and neuro-fuzzy network to model the stratified three-phase flow of gas–oil–water. Comput. Appl. Math. 2019, 38, 5. [Google Scholar] [CrossRef]
  7. Sattari, M.A.; Roshani, G.H.; Hanus, R. Improving the structure of two-phase flow meter using feature extraction and GMDH neural network. Radiat. Phys. Chem. 2020, 171, 108725. [Google Scholar] [CrossRef]
  8. Sattari, M.A.; Roshani, G.H.; Hanus, R.; Nazemi, E. Applicability of time-domain feature extraction methods and artificial intelligence in two-phase flow meters based on gamma-ray absorption technique. Measurement 2021, 168, 108474. [Google Scholar] [CrossRef]
  9. Roshani, M.; Sattari, M.A.; Ali, P.J.M.; Roshani, G.H.; Nazemi, B.; Corniani, E.; Nazemi, E. Application of GMDH neural network technique to improve measuring precision of a simplified photon attenuation based two-phase flowmeter. Flow Meas. Instrum. 2020, 75, 101804. [Google Scholar] [CrossRef]
  10. Alamoudi, M.; Sattari, M.A.; Balubaid, M.; Eftekhari-Zadeh, E.; Nazemi, E.; Taylan, O.; Kalmoun, E.M. Application of Gamma Attenuation Technique and Artificial Intelligence to Detect Scale Thickness in Pipelines in Which Two-Phase Flows with Different Flow Regimes and Void Fractions Exist. Symmetry 2021, 13, 1198. [Google Scholar] [CrossRef]
  11. Roshani, M.; Phan, G.; Faraj, R.H.; Phan, N.H.; Roshani, G.H.; Nazemi, B.; Corniani, E.; Nazemi, E. Proposing a gamma radiation based intelligent system for simultaneous analyzing and detecting type and amount of petroleum by-products. Nucl. Eng. Technol. 2021, 53, 1277–1283. [Google Scholar] [CrossRef]
  12. Mayet, A.M.; Nurgalieva, K.S.; Al-Qahtani, A.A.; Narozhnyy, I.M.; Alhashim, H.H.; Nazemi, E.; Indrupskiy, I.M. Proposing a high precision petroleum pipeline’s monitoring system for identifying the type and amount of oil products using extraction of frequency characteristics and MLP neural network. Mathematics 2022, 10, 2916. [Google Scholar] [CrossRef]
  13. Mayet, A.M.; Alizadeh, S.M.; Kakarash, Z.A.; Al-Qahtani, A.A.; Alanazi, A.K.; Grimaldo Guerrero, J.W.; Alhashimi, H.H.; Eftekhari-Zadeh, E. Increasing the Efficiency of a Control System for Detecting the Type and Amount of Oil Product Passing through Pipelines Based on Gamma-ray Attenuation, Time Domain Feature Extraction, and Artificial Neural Networks. Polymers 2022, 14, 2852. [Google Scholar] [CrossRef]
  14. Basahel, A.; Sattari, M.A.; Taylan, O.; Nazemi, E. Application of Feature Extraction and Artificial Intelligence Techniques for Increasing the Accuracy of X-ray Radiation Based Two Phase Flow Meter. Mathematics 2021, 9, 1227. [Google Scholar] [CrossRef]
  15. Taylan, O.; Sattari, M.A.; Elhachfi Essoussi, I.; Nazemi, E. Frequency Domain Feature Extraction Investigation to Increase the Accuracy of an Intelligent Nondestructive System for Volume Fraction and Regime Determination of Gas-Water-Oil Three-Phase Flows. Mathematics 2021, 9, 2091. [Google Scholar] [CrossRef]
  16. Roshani, G.H.; Ali, P.J.; Mohammed, S.; Hanus, R.; Abdulkareem, L.; Alanezi, A.A.; Sattari, M.A.; Amiri, S.; Nazemi, E.; Eftekhari-Zadeh, E.; et al. Simulation Study of Utilizing X-ray Tube in Monitoring Systems of Liquid Petroleum Products. Processes 2021, 9, 828. [Google Scholar] [CrossRef]
  17. Balubaid, M.; Sattari, M.A.; Taylan, O.; Bakhsh, A.A.; Nazemi, E. Applications of Discrete Wavelet Transform for Feature Extraction to Increase the Accuracy of Monitoring Systems of Liquid Petroleum Products. Mathematics 2021, 9, 3215. [Google Scholar] [CrossRef]
  18. Mayet, A.M.; Alizadeh, S.M.; Nurgalieva, K.S.; Hanus, R.; Nazemi, E.; Narozhnyy, I.M. Extraction of Time-Domain Characteristics and Selection of Effective Features Using Correlation Analysis to Increase the Accuracy of Petroleum Fluid Monitoring Systems. Energies 2022, 15, 1986. [Google Scholar] [CrossRef]
  19. Daubechies, I. The wavelet transform, time-frequency localization and signal analysis. IEEE Trans. Inf. Theory 1990, 36, 961–1005. [Google Scholar] [CrossRef]
  20. Soltani, S. On the use of the wavelet decomposition for time series prediction. Neurocomputing 2002, 48, 267–277. [Google Scholar] [CrossRef]
  21. Eftekhari-Zadeh, E.; Bensalama, A.S.; Roshani, G.H.; Salama, A.S.; Spielmann, C.; Iliyasu, A.M. Enhanced Gamma-ray Attenuation-Based Detection System Using an Artificial Neural Network. Photonics 2022, 9, 382. [Google Scholar] [CrossRef]
  22. Mayet, A.M.; Alizadeh, S.M.; Kakarash, Z.A.; Al-Qahtani, A.A.; Alanazi, A.K.; Alhashimi, H.H.; Eftekhari-Zadeh, E.; Nazemi, E. Introducing a Precise System for Determining Volume Percentages Independent of Scale Thickness and Type of Flow Regime. Mathematics 2022, 10, 1770. [Google Scholar] [CrossRef]
  23. Ivakhnenko, A.G. Polynomial theory of complex systems. IEEE Trans. Syst. Man Cybern. 1971, 4, 364–378. [Google Scholar] [CrossRef]
  24. Lalbakhsh, A.; Mohamadpour, G.; Roshani, S.; Ami, M.; Roshani, S.; Sayem, A.S.; Alibakhshikenari, M.; Koziel, S. Design of a compact planar transmission line for miniaturized rat-race coupler with harmonics suppression. IEEE Access 2021, 9, 129207–129217. [Google Scholar] [CrossRef]
  25. Hookari, M.; Roshani, S.; Roshani, S. High-efficiency balanced power amplifier using miniaturized harmonics suppressed coupler. Int. J. RF Microw. Comput.-Aided Eng. 2020, 30, e22252. [Google Scholar] [CrossRef]
  26. Lotfi, S.; Roshani, S.; Roshani, S.; Gilan, M.S. Wilkinson power divider with band-pass filtering response and harmonics suppression using open and short stubs. Frequenz 2020, 74, 169–176. [Google Scholar] [CrossRef]
  27. Jamshidi, M.; Siahkamari, H.; Roshani, S.; Roshani, S. A compact Gysel power divider design using U-shaped and T-shaped resonators with harmonics suppression. Electromagnetics 2019, 39, 491–504. [Google Scholar] [CrossRef]
  28. Khaibullina, K. Technology to remove asphaltene, resin and paraffin deposits in wells using organic solvents. In Proceedings of the SPE Annual Technical Conference and Exhibition 2016, Dubai, United Arab Emirates, 26–28 September 2016. [Google Scholar] [CrossRef]
  29. Tikhomirova, E.A.; Sagirova, L.R.; Khaibullina, K.S. A review on methods of oil saturation modelling using IRAP RMS. IOP Conf. Ser. Earth Environ. Sci. 2019, 378, 012075. [Google Scholar] [CrossRef]
  30. Hosseinzadeh-Bandbafha, H.; Nazemi, F.; Khounani, Z.; Ghanavati, H.; Shafiei, M.; Karimi, K.; Lam, S.S.; Aghbashlo, M.; Tabatabaei, M. Safflower-based biorefinery producing a broad spectrum of biofuels and biochemicals: A life cycle assessment perspective. Sci. Total Environ. 2021, 802, 149842. [Google Scholar] [CrossRef]
  31. Nazemi, F.; Karimi, K.; Denayer, J.F.; Shafiei, M. Techno-economic aspects of different process approaches based on brown macroalgae feedstock: A step toward commercialization of seaweed-based biorefineries. Algal Res. 2021, 58, 102366. [Google Scholar] [CrossRef]
  32. Khaibullina, K.S.; Korobov, G.Y.; Lekomtsev, A.V. Development of an asphalt-resin-paraffin deposits inhibitor and substantiation of the technological parameters of its injection into the bottom-hole formation zone. Period. Tche Quim. 2020, 17, 769–781. [Google Scholar] [CrossRef]
  33. Khaibullina, K.S.; Sagirova, L.R.; Sandyga, M.S. Substantiation and selection of an inhibitor for preventing the formation of asphalt-resin-paraffin deposits. Period. Tche Quim. 2020, 17, 541–551. [Google Scholar] [CrossRef]
  34. Mayet, A.; Smith, C.E.; Hussain, M.M. Energy reversible switching from amorphous metal based nanoelectromechanical switch. In Proceedings of the 13th IEEE International Conference on Nanotechnology (IEEE-NANO 2013), Beijing, China, 5–8 August 2013; pp. 366–369. [Google Scholar]
  35. Khounani, Z.; Hosseinzadeh-Bandbafha, H.; Nazemi, F.; Shaeifi, M.; Karimi, K.; Tabatabaei, M.; Aghbashlo, M.; Lam, S.S. Exergy analysis of a whole-crop safflower biorefinery: A step towards reducing agricultural wastes in a sustainable manner. J. Environ. Manag. 2021, 279, 111822. [Google Scholar] [CrossRef] [PubMed]
  36. Shukla, N.K.; Mayet, A.M.; Vats, A.; Aggarwal, M.; Raja, R.K.; Verma, R.; Muqeet, M.A. High speed integrated RF–VLC data communication system: Performance constraints and capacity considerations. Phys. Commun. 2022, 50, 101492. [Google Scholar] [CrossRef]
  37. Mayet, A.; Hussain, A.; Hussain, M. Three-terminal nanoelectromechanical switch based on tungsten nitride—An amorphous metallic material. Nanotechnology 2016, 27, 035202. [Google Scholar] [CrossRef]
  38. Mayet, A.; Hussain, M. Amorphous WNx Metal For Accelerometers and Gyroscope. In Proceedings of the MRS Fall Meeting, Boston, MA, USA, 30 November–5 December 2014. [Google Scholar]
  39. Gao, H.; Xu, K.; Cao, M.; Xiao, J.; Xu, Q.; Yin, Y. The Deep Features and Attention Mechanism-Based Method to Dish Healthcare Under Social IoT Systems: An Empirical Study With a Hand-Deep Local–Global Net. IEEE Trans. Comput. Soc. Syst. 2021, 9, 336–347. [Google Scholar] [CrossRef]
  40. Gao, H.; Xiao, J.; Yin, Y.; Liu, T.; Shi, J. A Mutually Supervised Graph Attention Network for Few-Shot Segmentation: The Perspective of Fully Utilizing Limited Samples. IEEE Trans. Neural Netw. Learn. Syst. 2022, 1–13. [Google Scholar] [CrossRef]
  41. Roshani, S.; Jamshidi, M.B.; Mohebi, F.; Roshani, S. Design and modeling of a compact power divider with squared resonators using artificial intelligence. Wirel. Pers. Commun. 2021, 117, 2085–2096. [Google Scholar] [CrossRef]
  42. Roshani, S.; Azizian, J.; Roshani, S.; Jamshidi, M.B.; Parandin, F. Design of a miniaturized branch line microstrip coupler with a simple structure using artificial neural network. Frequenz 2022, 76, 255–263. [Google Scholar] [CrossRef]
  43. Khaleghi, M.; Salimi, J.; Farhangi, V.; Moradi, M.J.; Karakouzian, M. Application of Artificial Neural Network to Predict Load Bearing Capacity and Stiffness of Perforated Masonry Walls. CivilEng 2021, 2, 48–67. [Google Scholar] [CrossRef]
  44. Dabiri, H.; Farhangi, V.; Moradi, M.J.; Zadehmohamad, M.; Karakouzian, M. Applications of Decision Tree and Random Forest as Tree-Based Machine Learning Techniques for Analyzing the Ultimate Strain of Spliced and Non-Spliced Reinforcement Bars. Appl. Sci. 2022, 12, 4851. [Google Scholar] [CrossRef]
  45. Roshani, M.; Ali, P.J.; Roshani, G.H.; Nazemi, B.; Corniani, E.; Phan, N.H.; Tran, H.N.; Nazemi, E. X-ray tube with artificial neural network model as a promising alternative for radioisotope source in radiation based two phase flowmeters. Appl. Radiat. Isot. 2020, 164, 109255. [Google Scholar] [CrossRef] [PubMed]
  46. Peyvandi, R.G.; Rad, S.I. Application of artificial neural networks for the prediction of volume fraction using spectra of gamma rays backscattered by three-phase flows. Eur. Phys. J. Plus 2017, 132, 511. [Google Scholar] [CrossRef]
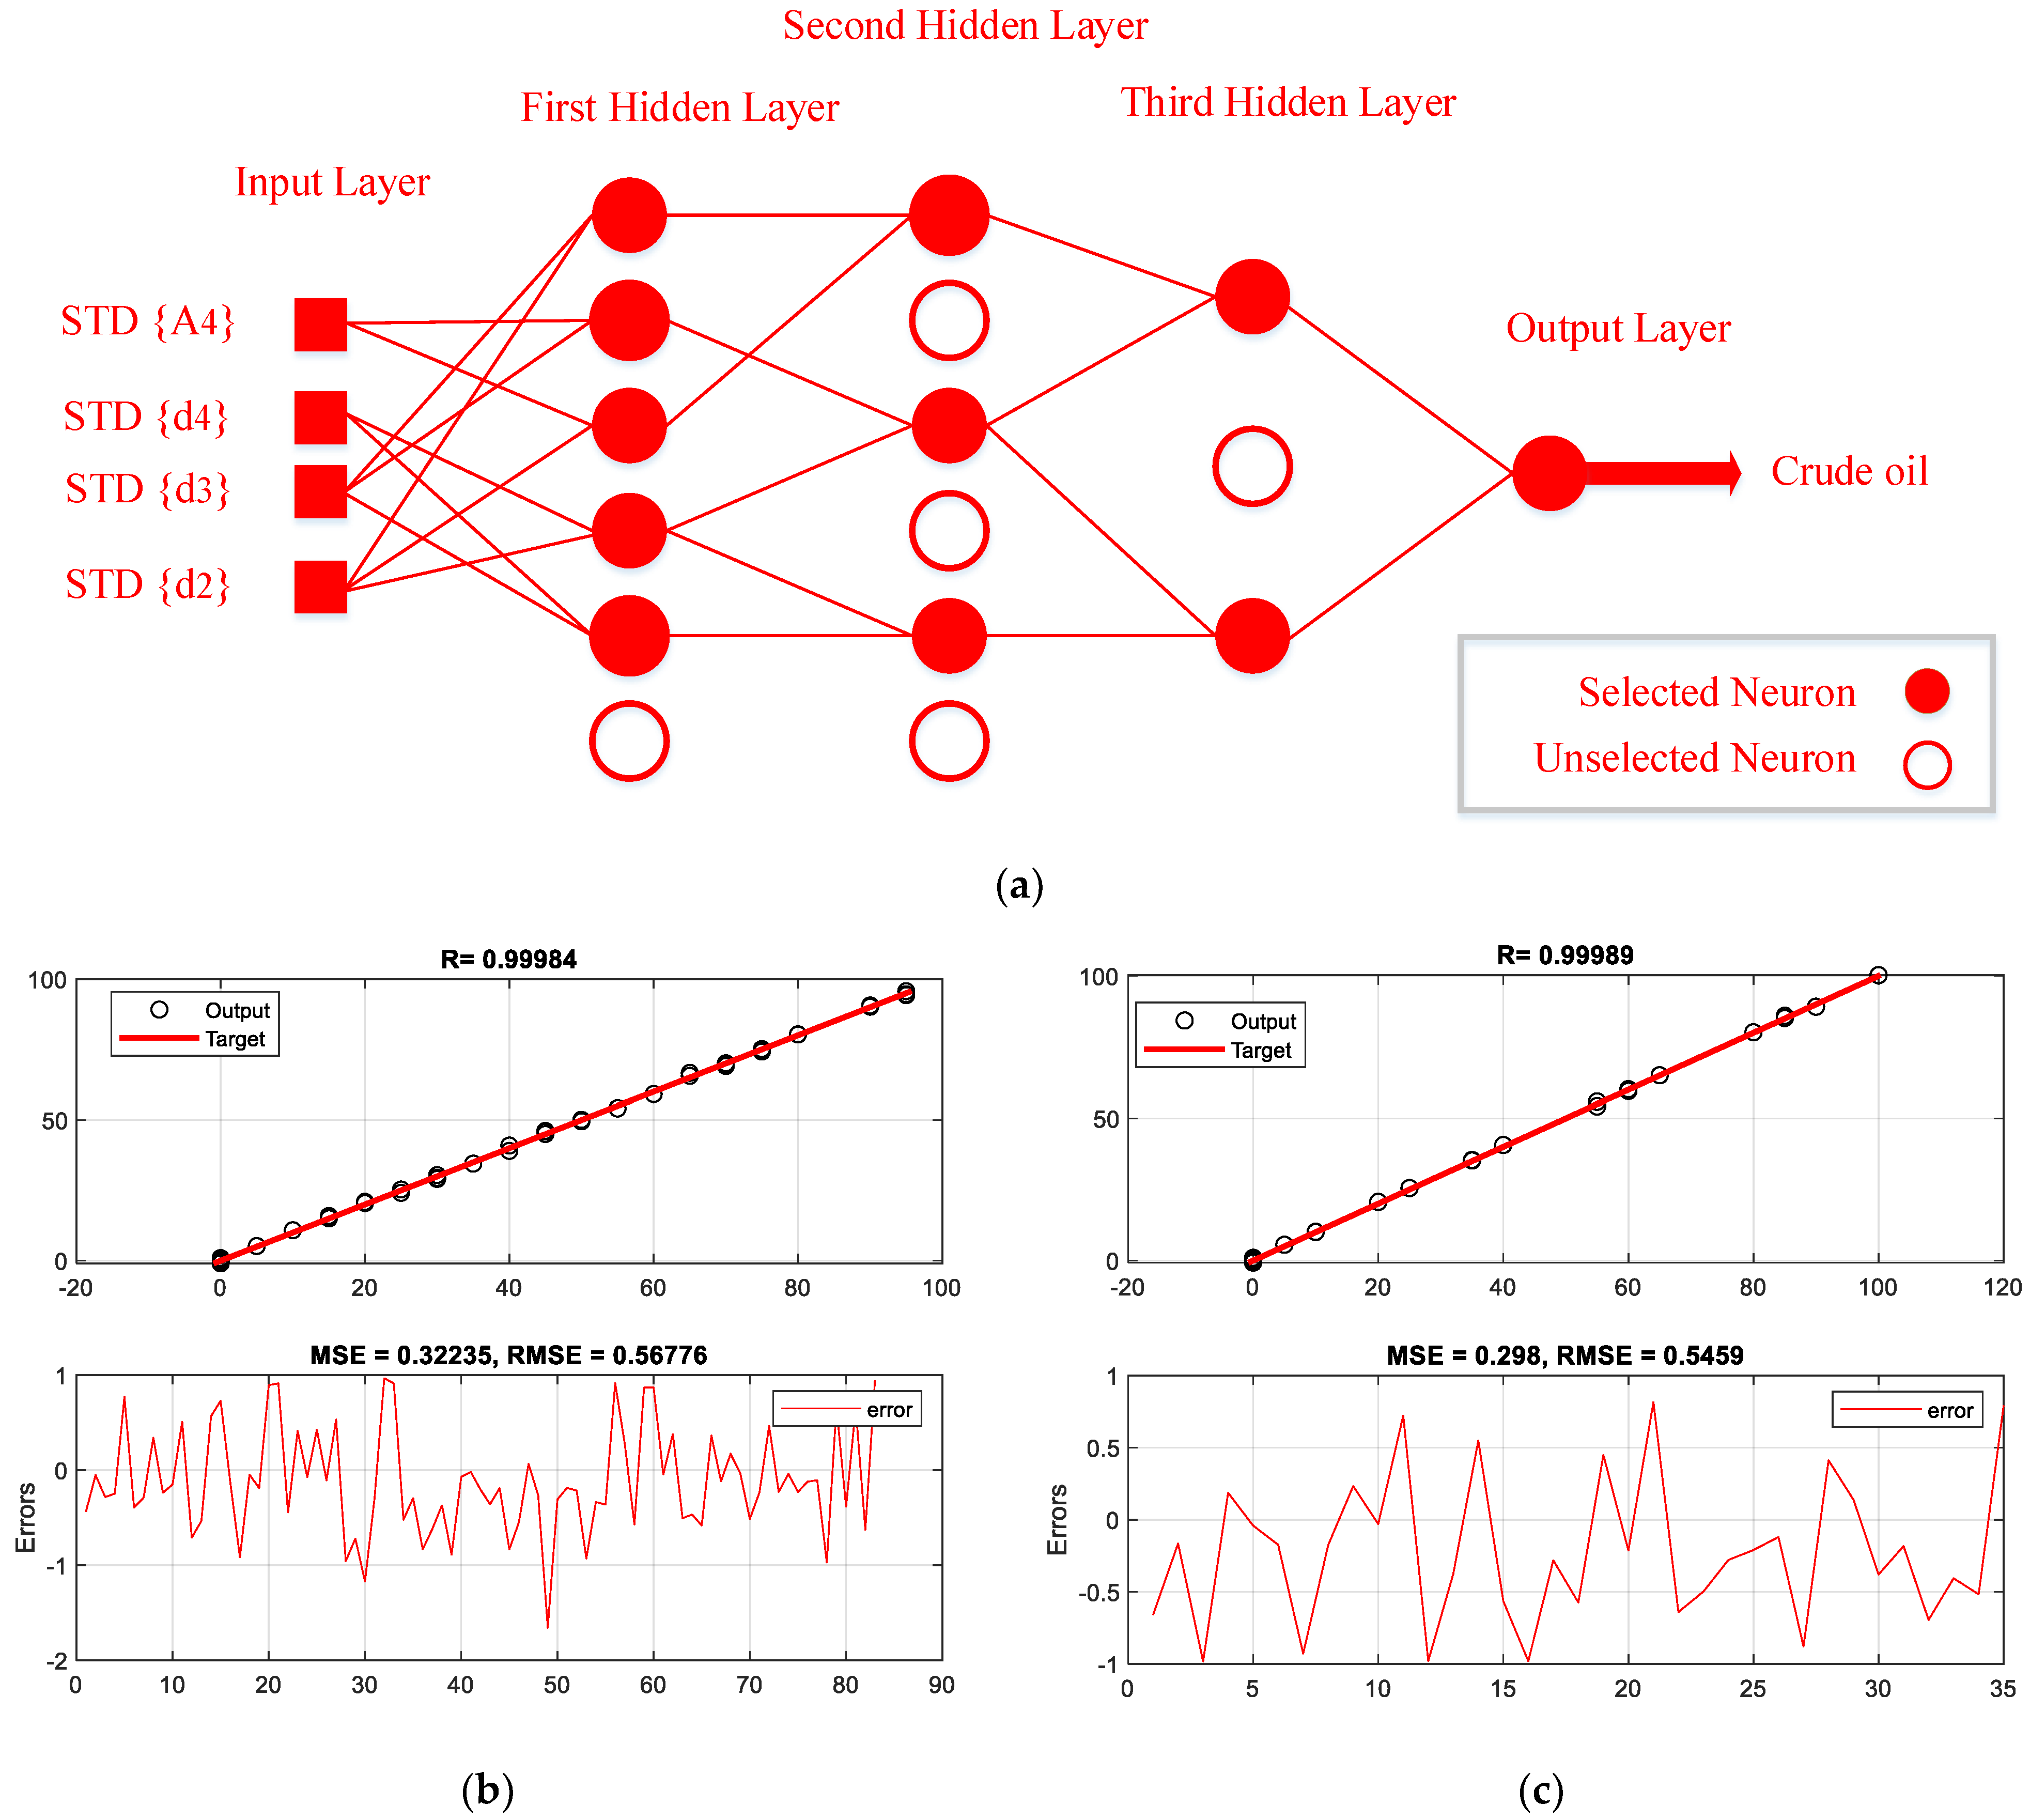
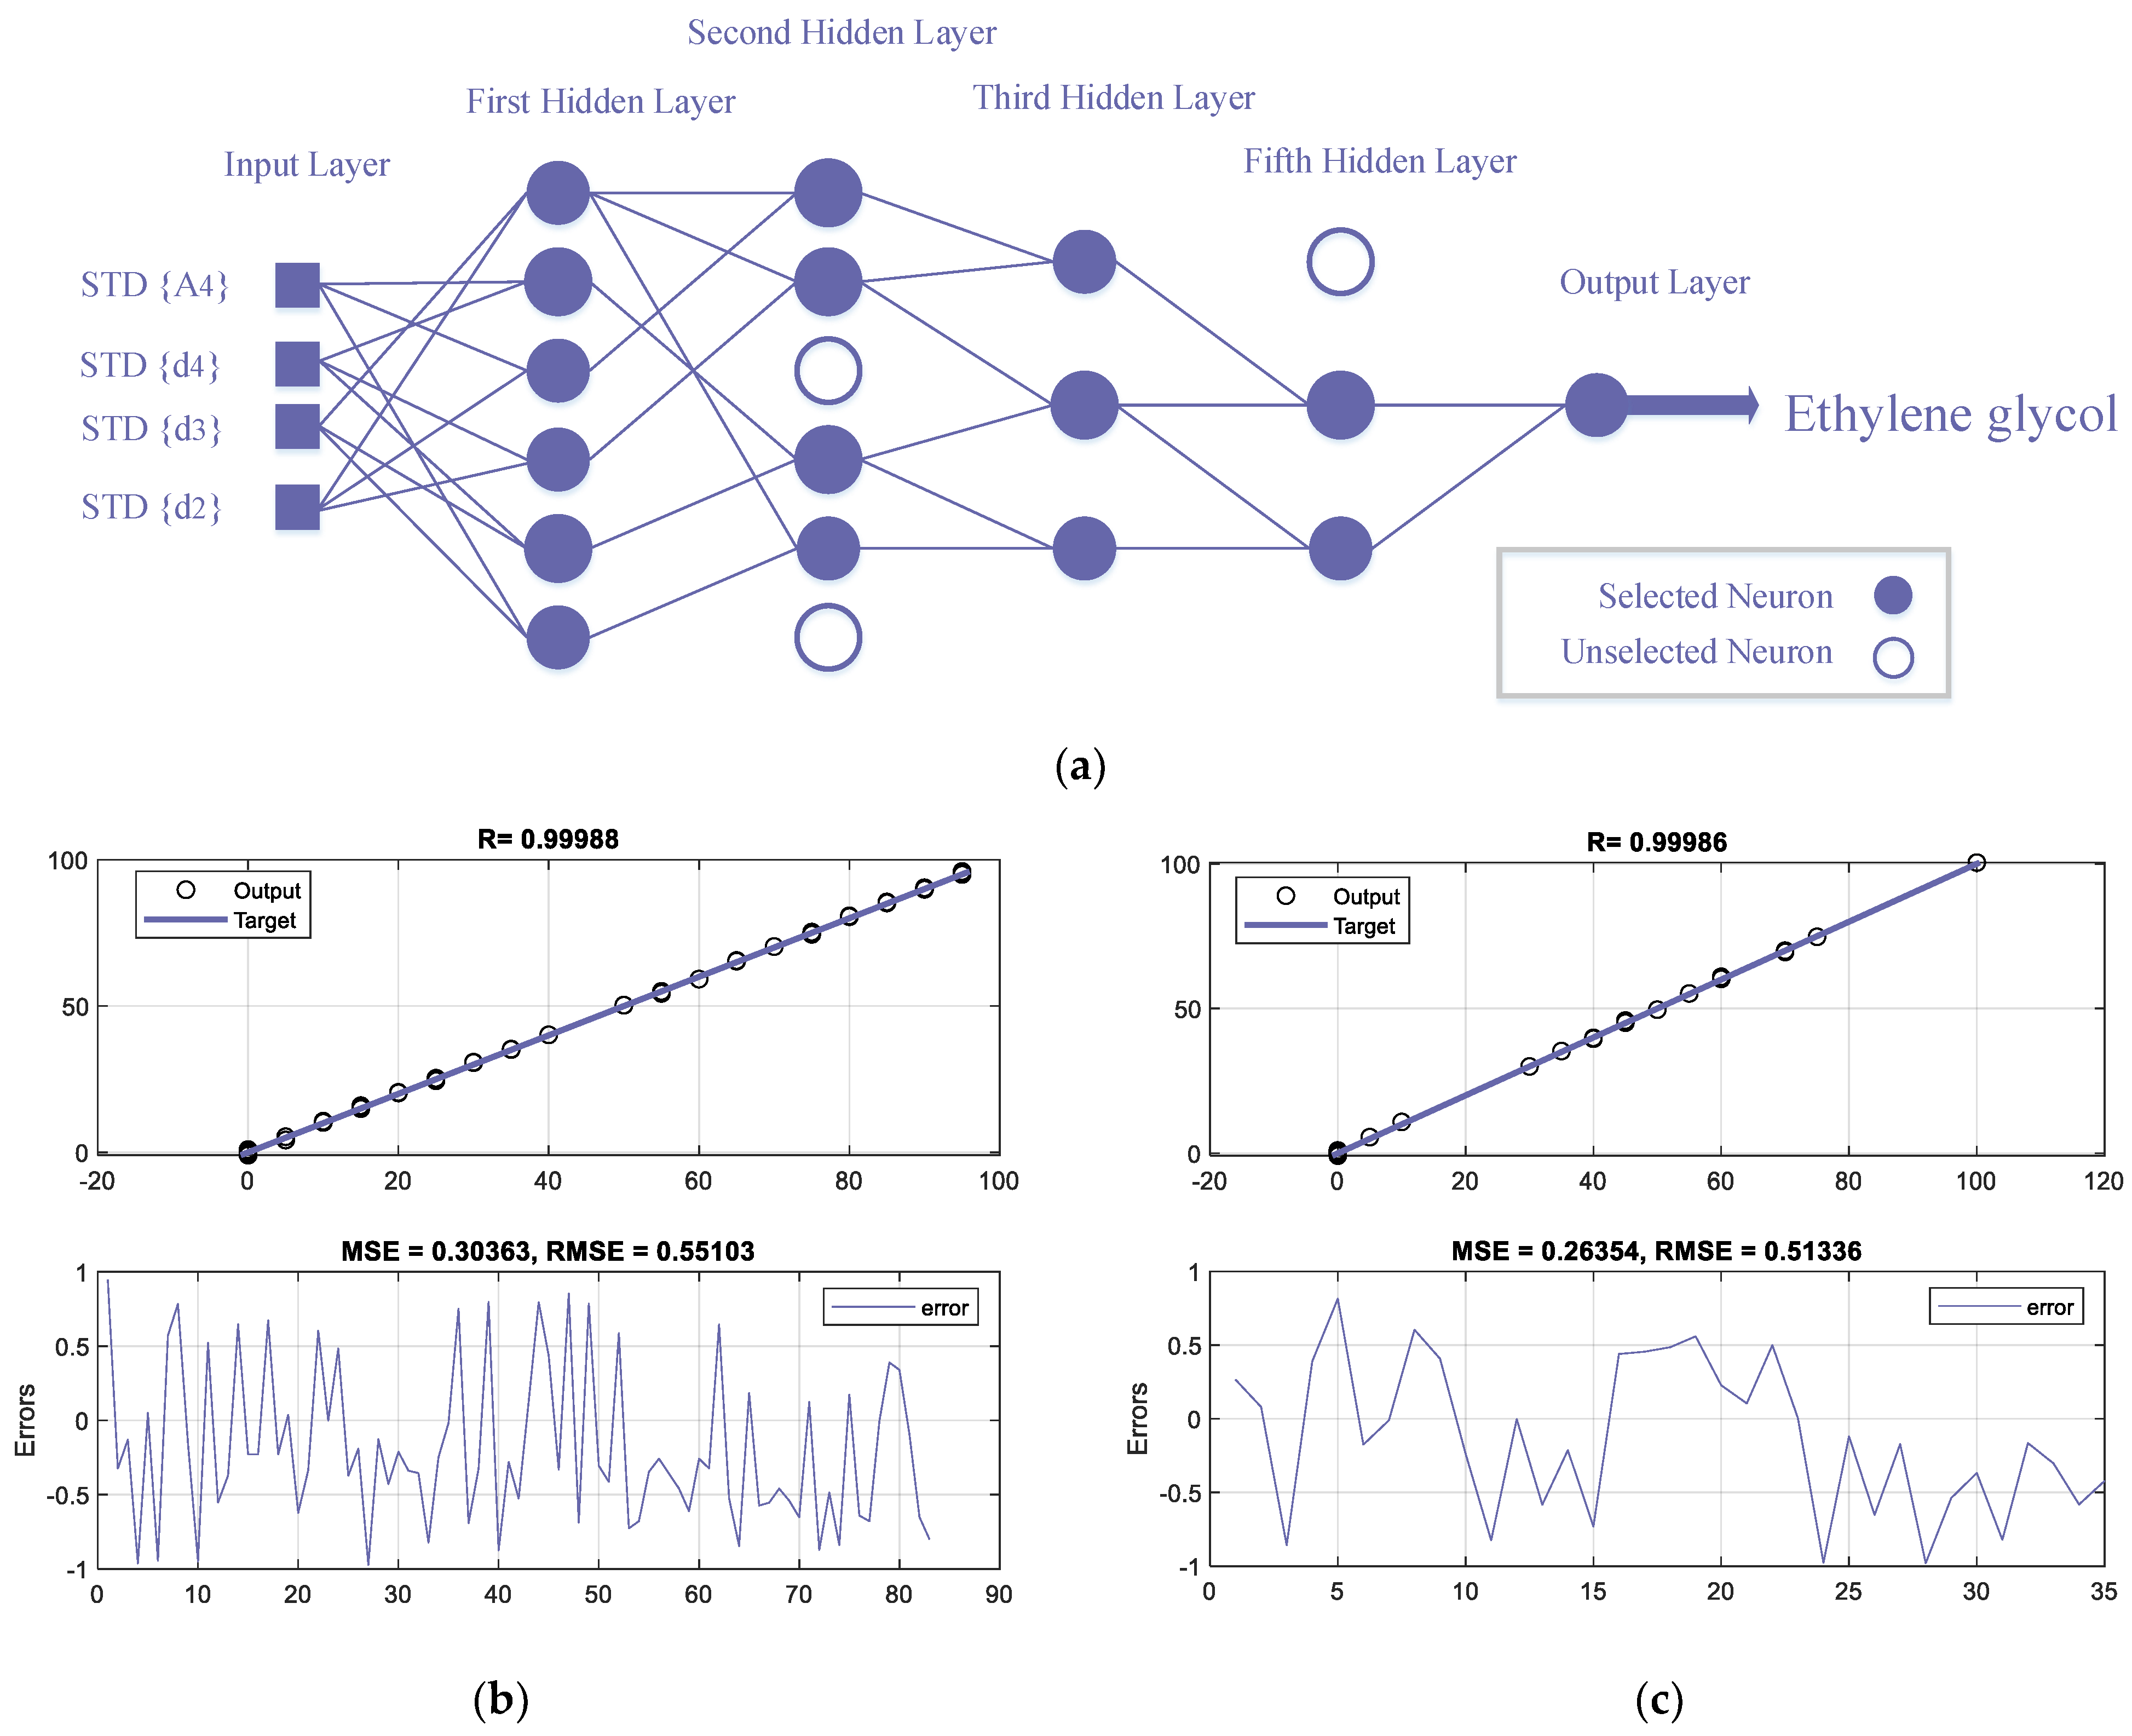
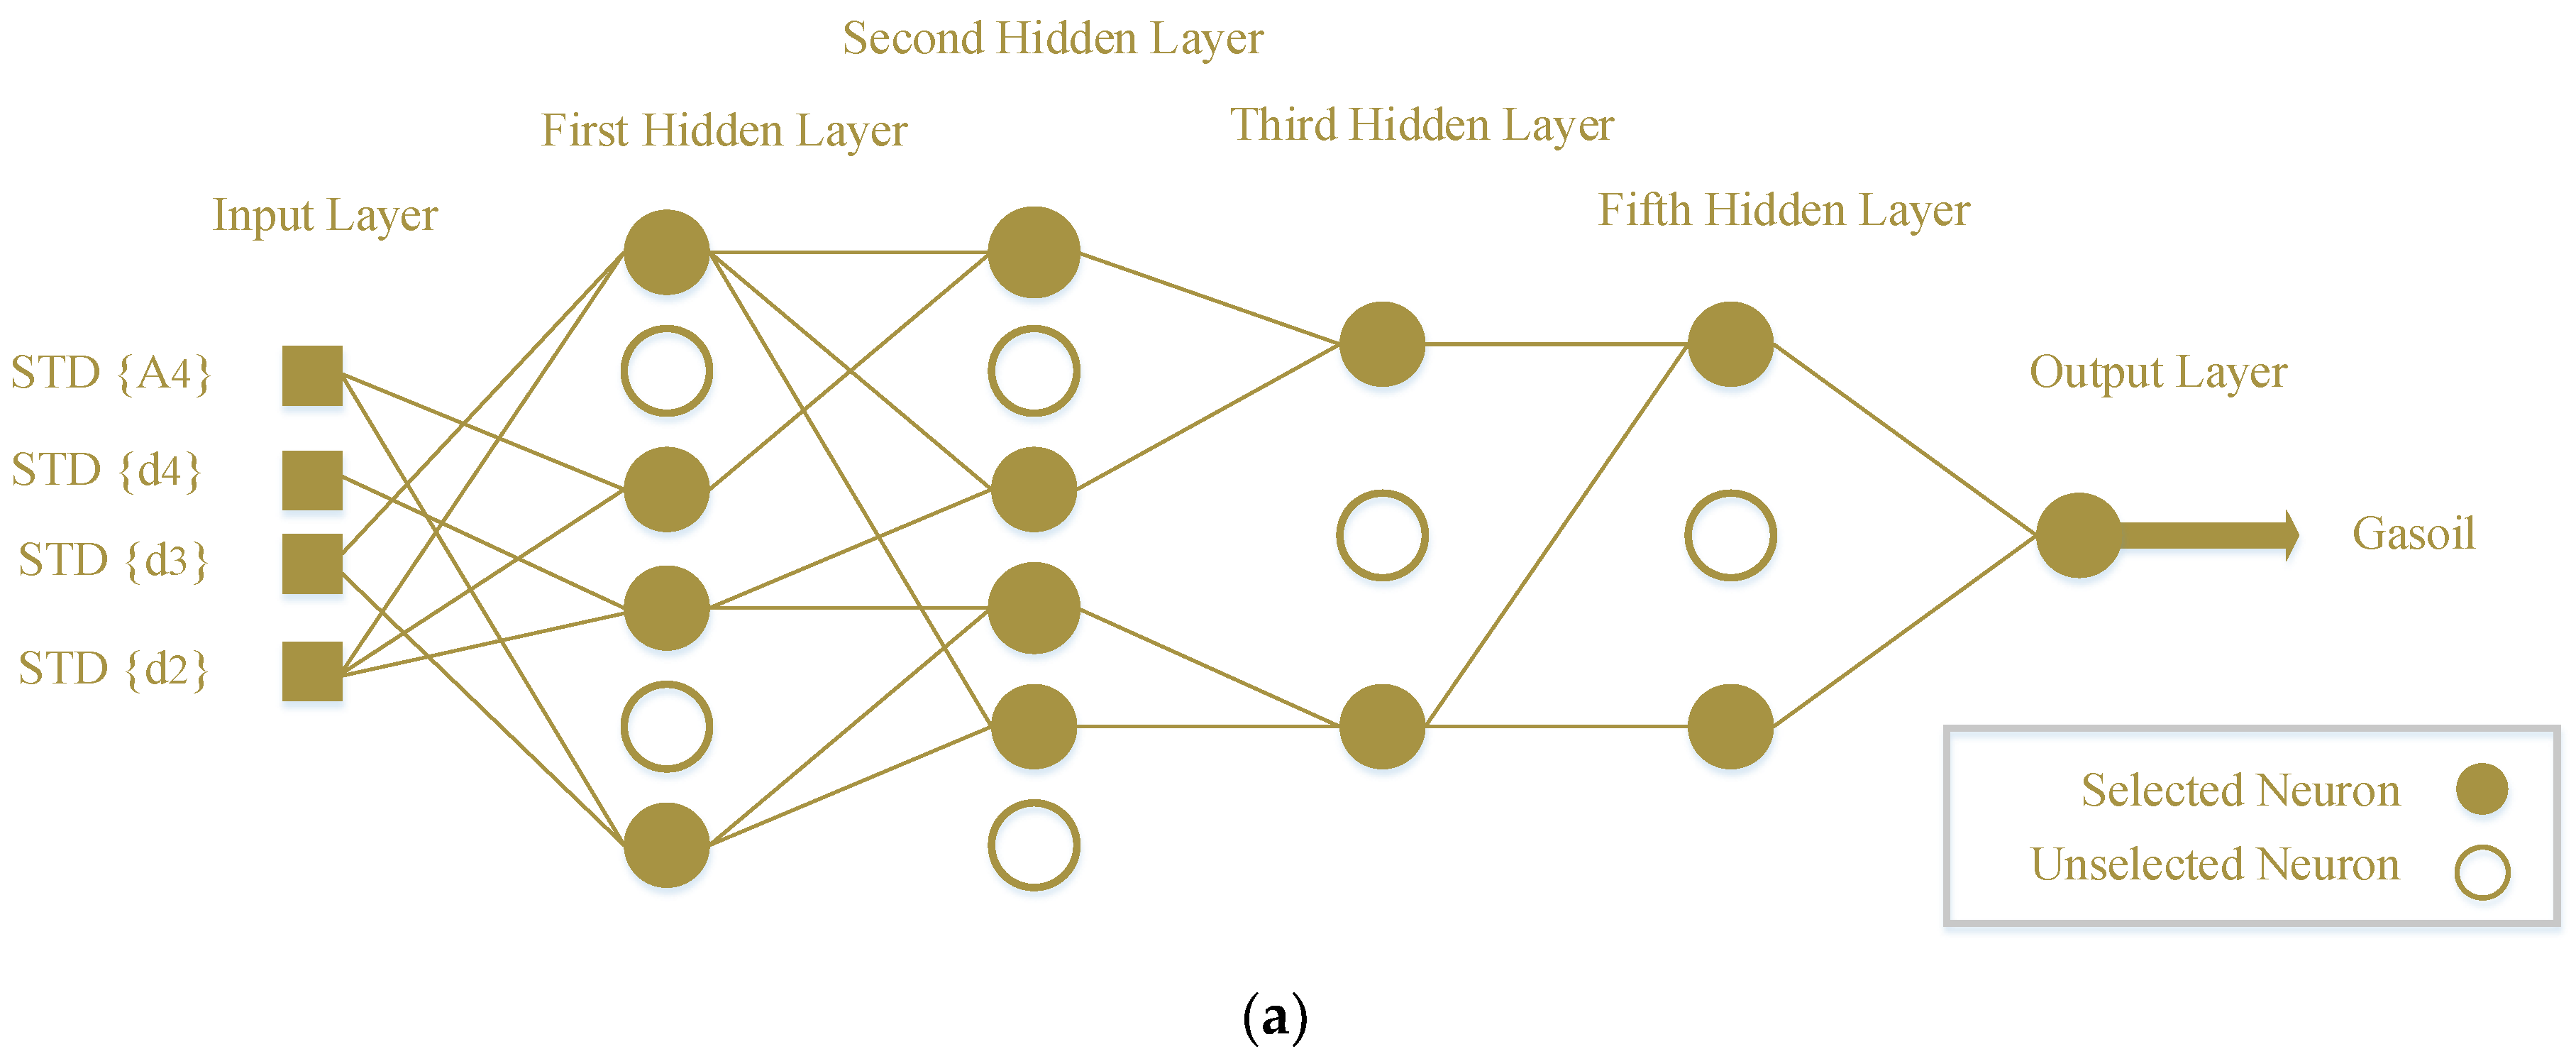
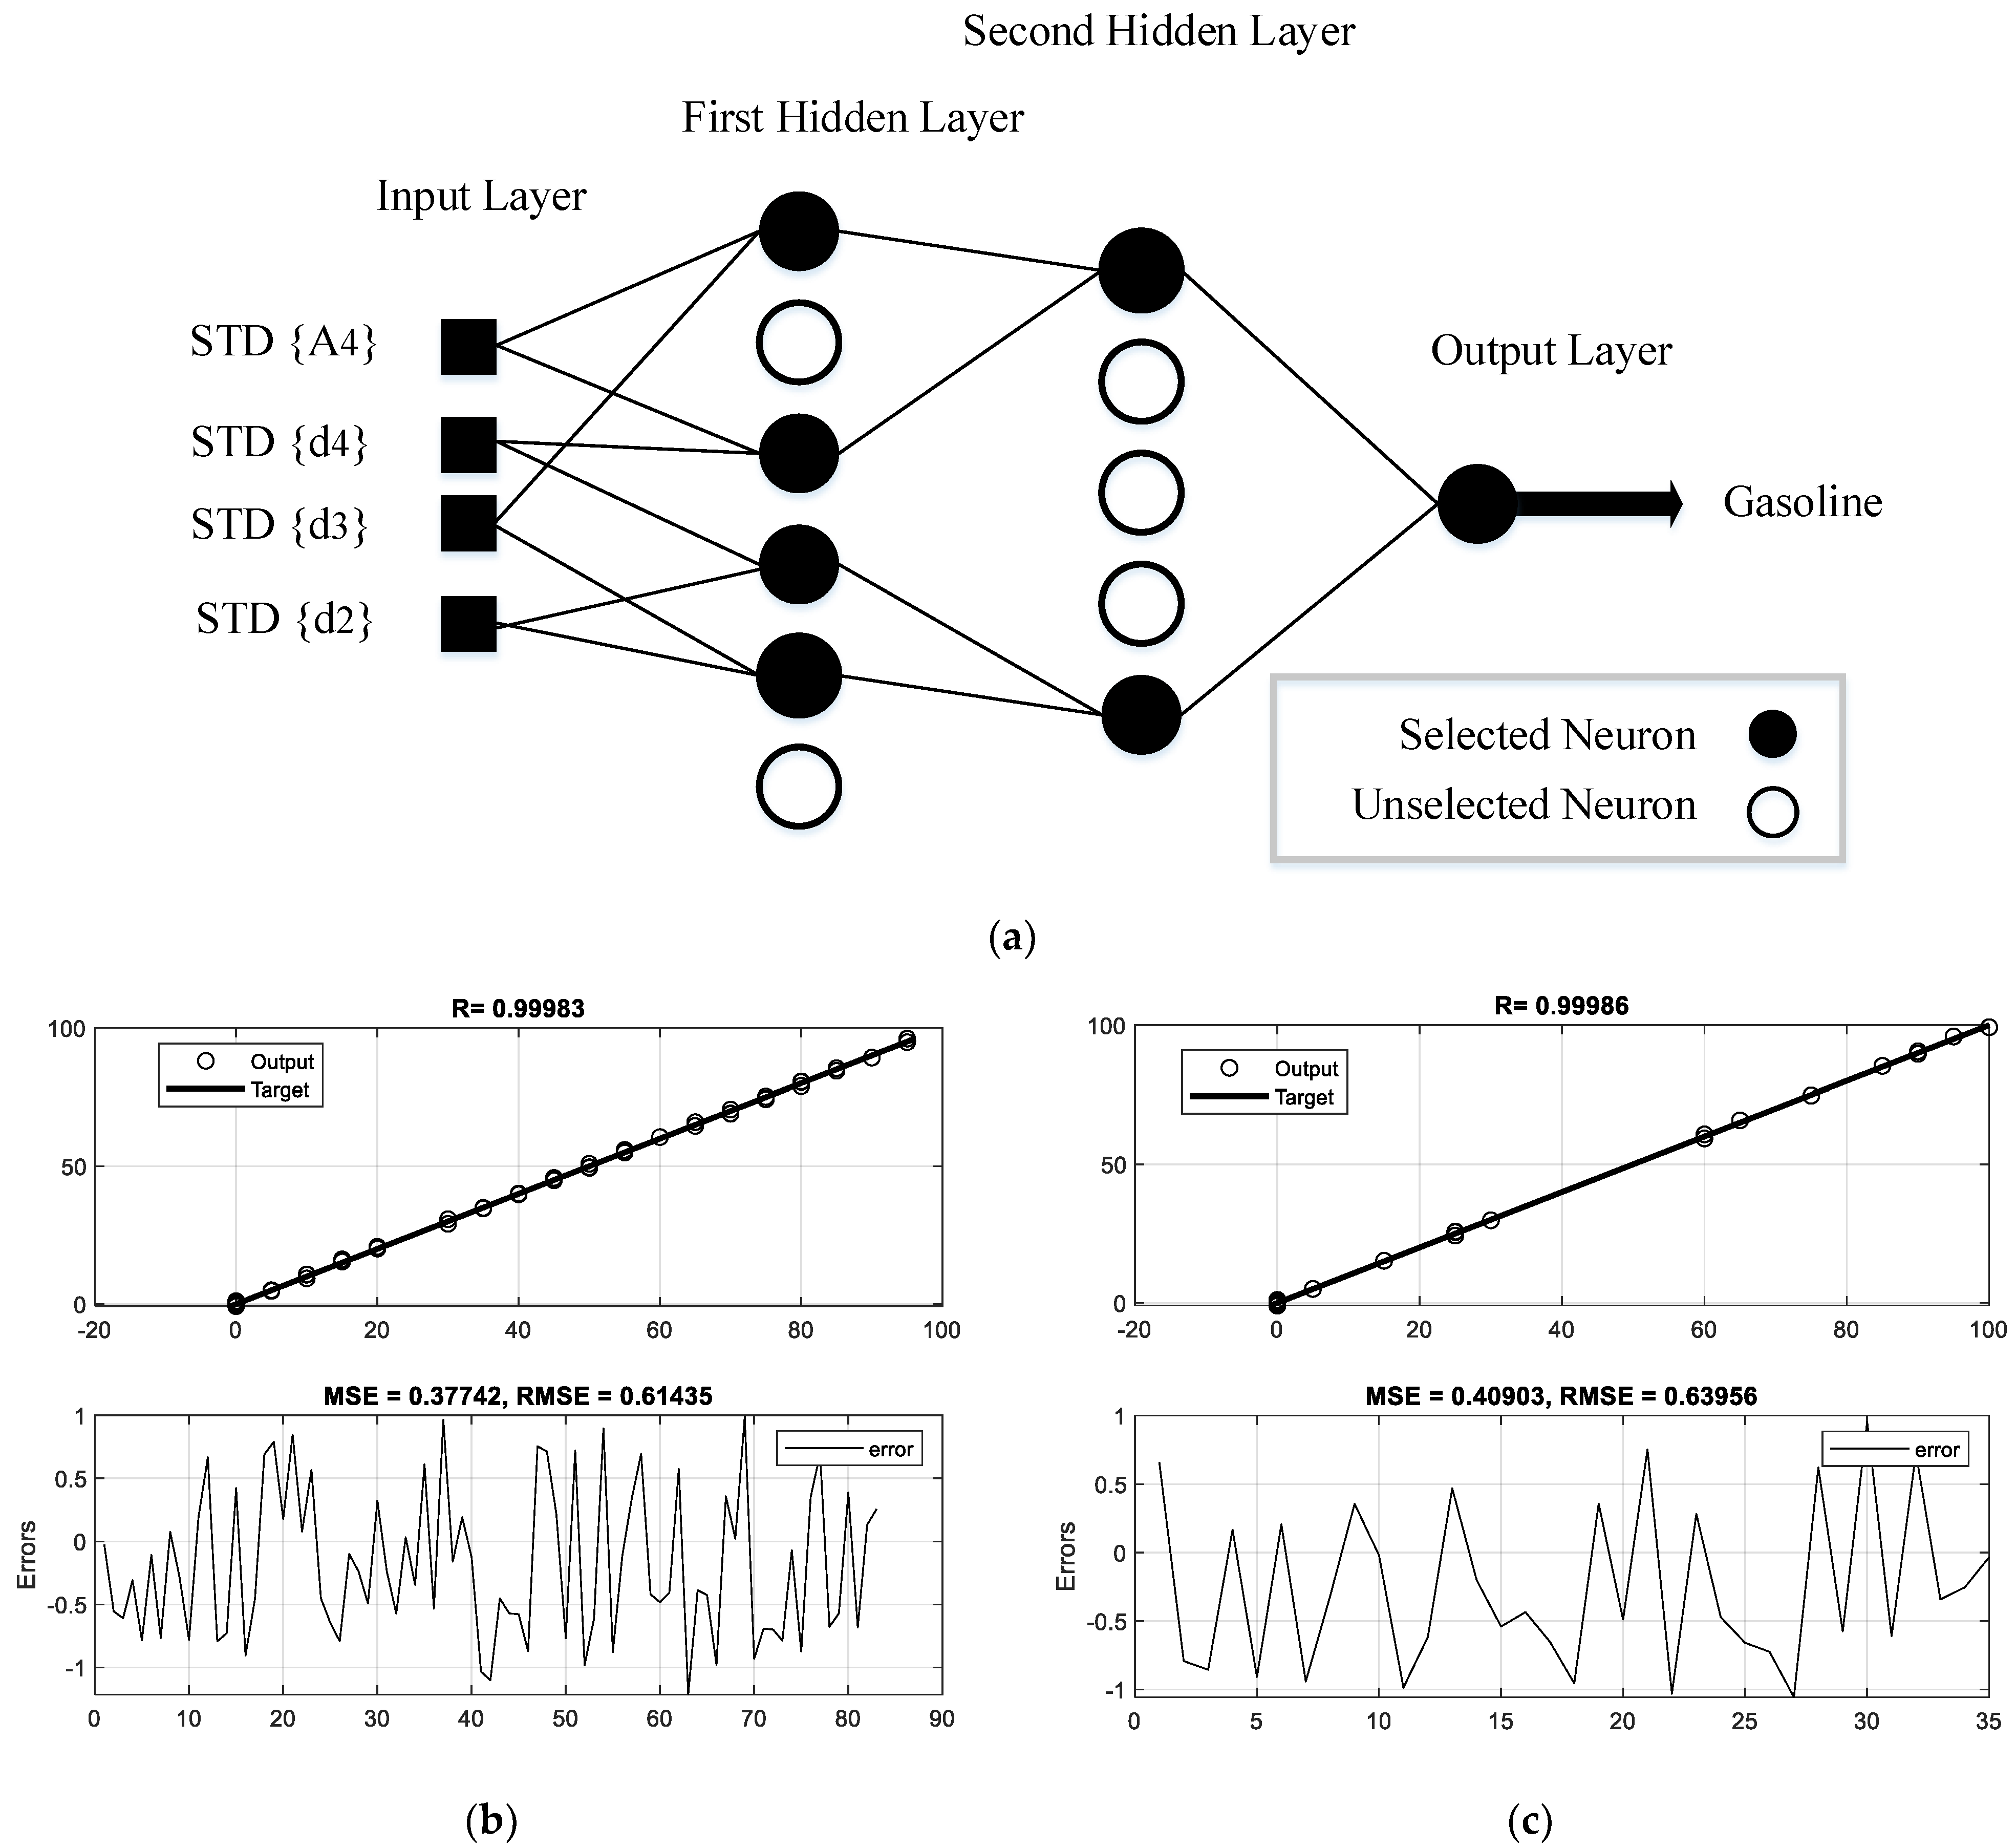
Figure 1. The structure of the detection system and the signals recorded by the detector.
Symmetry 14 01797 g001
Figure 2. The signal decomposition process using DWT; g[n] is the low-pass filter, h[n] is the high-pass filter.
Symmetry 14 01797 g002
Figure 3. The results of signal decomposition into parts of approximation and detail. S represents the main signal, a1 to a5 represents the approximate signals of the first to fifth stages, and the detail signals of the first to fifth stages are shown by d1 to d5.
Symmetry 14 01797 g003
Figure 4. (a) The network structure that predicts the volume of ethylene glycol; (b) the performance of the neural network in the training phase and (c) testing phase.
Symmetry 14 01797 g004
Figure 5. (a) The network structure that predicts the volume of gasoil; (b) the performance of the network in the training phase and (c) testing phase.
Symmetry 14 01797 g005aSymmetry 14 01797 g005b
Figure 6. (a) The network structure that predicts the volume of crude oil; (b) the performance of the network in the training phase and (c) testing phase.
Symmetry 14 01797 g006
Figure 7. (a) The network structure that predicts the volume of gasoline; (b) the performance of the network in the training phase and (c) testing phase.
Symmetry 14 01797 g007
Figure 8. General schematic of the process of distinguishing the quantity and type of petroleum products.
Symmetry 14 01797 g008
Table 1. Characteristics of trained neural networks.
OutputEthylene GlycolGasoilCRUDE OILGasoline
Input neuron4444
The first hidden layer neuron6454
The second hidden layer neuron4432
The third hidden layer neuron322-
The fourth hidden layer neuron22--
Calculated MSETrainTestTrainTestTrain TestTrain Test
0.300.260.280.310.320.290.370.40
Calculated RMSE0.550.510.530.560.560.540.610.63
Table 2. A comparison of the accuracy of the proposed detection system and previous studies.
Ref.Extracted FeaturesType of Neural NetworkMSERMSE
TrainingTestingTrainingTesting
[7]Time-domainGMDH1.241.201.111.09
[8]Time-domainMLP0.210.0360.460.6
[9]Lack of feature extractionGMDH7.344.922.712.21
[10]Lack of feature extractionRBF0.0490.370.220.19
[12]Frequency-domainMLP0.410.450.660.67
[13]Time-domainRBF0.440.460.670.68
[45]Lack of feature extractionMLP17.059.854.133.14
[46]Lack of feature extractionMLP2.562.561.61.6
[current study]Wavelet feature extractionGMDH0.370.40.610.63
Publisher’s Note: MDPI stays neutral with regard to jurisdictional claims in published maps and institutional affiliations.

