Article

Extracting the Parameters of Three-Diode Model of Photovoltaics Using Barnacles Mating Optimizer

1
Department of Electrical Engineering, Faculty of Engineering, Al-Azhar University, Cairo 11651, Egypt
2
Department of Electrical Engineering, College of Engineering, Northern Border University, Arar 1321, Saudi Arabia
3
Department of Electrical Engineering, College of Engineering, Taif University, P.O. Box 11099, Taif 21944, Saudi Arabia
*
Author to whom correspondence should be addressed.
Symmetry 2022, 14(8), 1569; https://doi.org/10.3390/sym14081569
Submission received: 2 July 2022 / Revised: 24 July 2022 / Accepted: 25 July 2022 / Published: 29 July 2022

Abstract

:
Modeling of solar generating systems (SGSs) is necessary for recognizing their performance under various conditions of solar irradiance, temperature, and loading. There are nine unbeknown parameters (UPs) in the three-diode model (3-DM); if they are accurately determined, it can exactly identify the real characteristics of SGSs. Parametrization of the 3-DM of SGSs is a nonlinear problem that can be solved via optimization due to its effectivity in determining the optimal parameters to a variety of symmetrical and asymmetrical problems with nonlinearity. Root-mean-squared errors amongst measured and extracted electric current points are the fitness functions to be minimized. The main contributions of this article are the innovative utilization of the barnacles mating optimization algorithm (BMOA) for precise parametrizing of the 3-DM of SGSs and the experimental validation of the SGS. The optimization procedure is based on real measurements of I/V at specific circumstances, in which BMOA is employed to identify the nine UPs of 3-DM of SGSs. Two SGSs are under study, the first of which (Kyocera KC200GT) is widely utilized in the literature for performing comparisons, and the second (Copex P-120) is experimentally set up during different sun irradiances and temperatures. The results of BMOA emphasize its preference over other optimizers for identifying the nine UPs of 3-DM of SGSs.

1. Introduction

Solar generating systems (SGSs) are promising tools for converting renewable solar energy into electrical energy. SGSs are distinct from other tools since they have shorter setup time, simpler design, longer life, no moving mechanical parts, and no noise [1]. SGSs can be employed either standalone with storage energy or grid-connected. The individual SGS cells generate very low power and voltage (0.5~0.65 V) [2], so groups of standard numbers of SGS cells are connected in series to create a module, which for the same reason is connected in series and parallel groups to create an array [3]. Bifacial SGS can yield energy from both the front side and back side, which can increase the yield energy up to 30% in comparison with traditional monofacial SGS; thus, the energy cost will decrease. Consequently, the SGS industries have recently paid attention to this technology [4].
Three main points (TMP) on the I/V relationship of SGS are commonly declared in datasheets at regular atmospheric condition (RAC) (ambient temperature Tam = 20 °C and irradiance G = 1 kW/m2), namely no-load voltage (Vn-l), short-circuit current (Is-c), and voltage (Vm-p) with current (Im-p) at maximum power (Pmax). The aforesaid stated points do not suffice to characterize SGS as proven in the results of this article. The atmospheric conditions vary continuously, so a perfect I/V relationship of SGS at entire statuses is essential to assure an acceptable functioning analysis of SGS during different statuses. The I/V plots of SGSs can be modeled by one-, two-, and three-diode models (3-DM), which have five, seven, and nine unbeknown parameters (UPs), respectively. The higher the number of diodes in the SGS model, the more precise modeling of the losses [5], so we chose 3-DM for modeling the SGS.
Meanwhile, the application of one of the newest metaheuristic algorithms for parametrizing the 3-DM of SGSs is treated in this article; similar efforts exerted in this regard are surveyed. Many studies have been directed to identify the UPs of the SGS model via numerous optimization algorithms because of its effectiveness in defining the optimum parameters to symmetrical and asymmetrical problems, such as the particle swarm approach [1,6,7,8,9,10], differential evolution (DE) [11,12,13,14], farmlands fertility approach [15], support vector machine [16], and counteraction-based sine–cosine approach [17]. Additional modern meta-heuristic-based optimizers, e.g., cuckoo seeking optimizer [18,19], backtracking seeking algorithm [20], imperialist competitive optimizer [21], highest likelihood estimator [22], approximating and correcting procedure [23], Jaya approach [24], interior seeking approach [25], Levenberg–Marquardt optimizer [26], coot optimizer [27], gaining–sharing knowledge algorithm [28], drone squadron algorithm [29], gorilla optimizer [30], and gray wolf optimizer [31] have been utilized to parametrize the SGS model. All of the abovementioned articles treated parametrization of one- and/or two-diode models of SGSs, while some algorithms were employed to parametrize 3-DM of SGSs, namely the sunflower approach (SFA) [5], manta-rays foraging approach (MRFA) [32], Harris hawks algorithm [33], grasshopper optimizer (GO) [34], coyote approach (CA) [35], whale optimizer (WO) [36], marine predator approach [37], and artificial electrical field optimizer [38].
Regarding the above abridged review and complying with the no-free-launch theorem [39], it remains a likelihood to ameliorate the parametrization of the SGS model. For this purpose, this research treats the employment of the barnacles mating optimization algorithm (BMOA) to parametrize the 3-DM of the SGSs. BMOA is one alternative of a metaheuristic; other potential alternatives include the adapted tabu search [40], simulated annealing [41], genetic algorithms [42], and ant colony optimization [43]. BMOA is chosen as it has been innovated recently [44]; in addition, its issued results are encouraging and attest its vantage over other approaches. BMOA is inspired by the mating manner of barnacles in nature to solve optimization topics. Employment of BMOA was successful in optimum reactive power dispatch [44] in addition to economical and emissions dispatch [45].
The contributions of this research are: (i) Innovative employment of BMOA to optimally parametrize the 3-DM of the SGSs; (ii) comparison of BMOA with other approaches via the results of parametrizing 3-DM of the SGS commonly used in the literature; (iii) experimental validation of an actual case study of a commercial SGS module, viz. P-120; (iv) comparison of the 3-DM of the SGS with one- and two-diode models (1- and 2-DMs) via the results of parametrizing them.
The paper is organized as follows: Section 2 displays 3-DM of the SGSs. The fitness function (FF) as well as the constraints are expressed in 
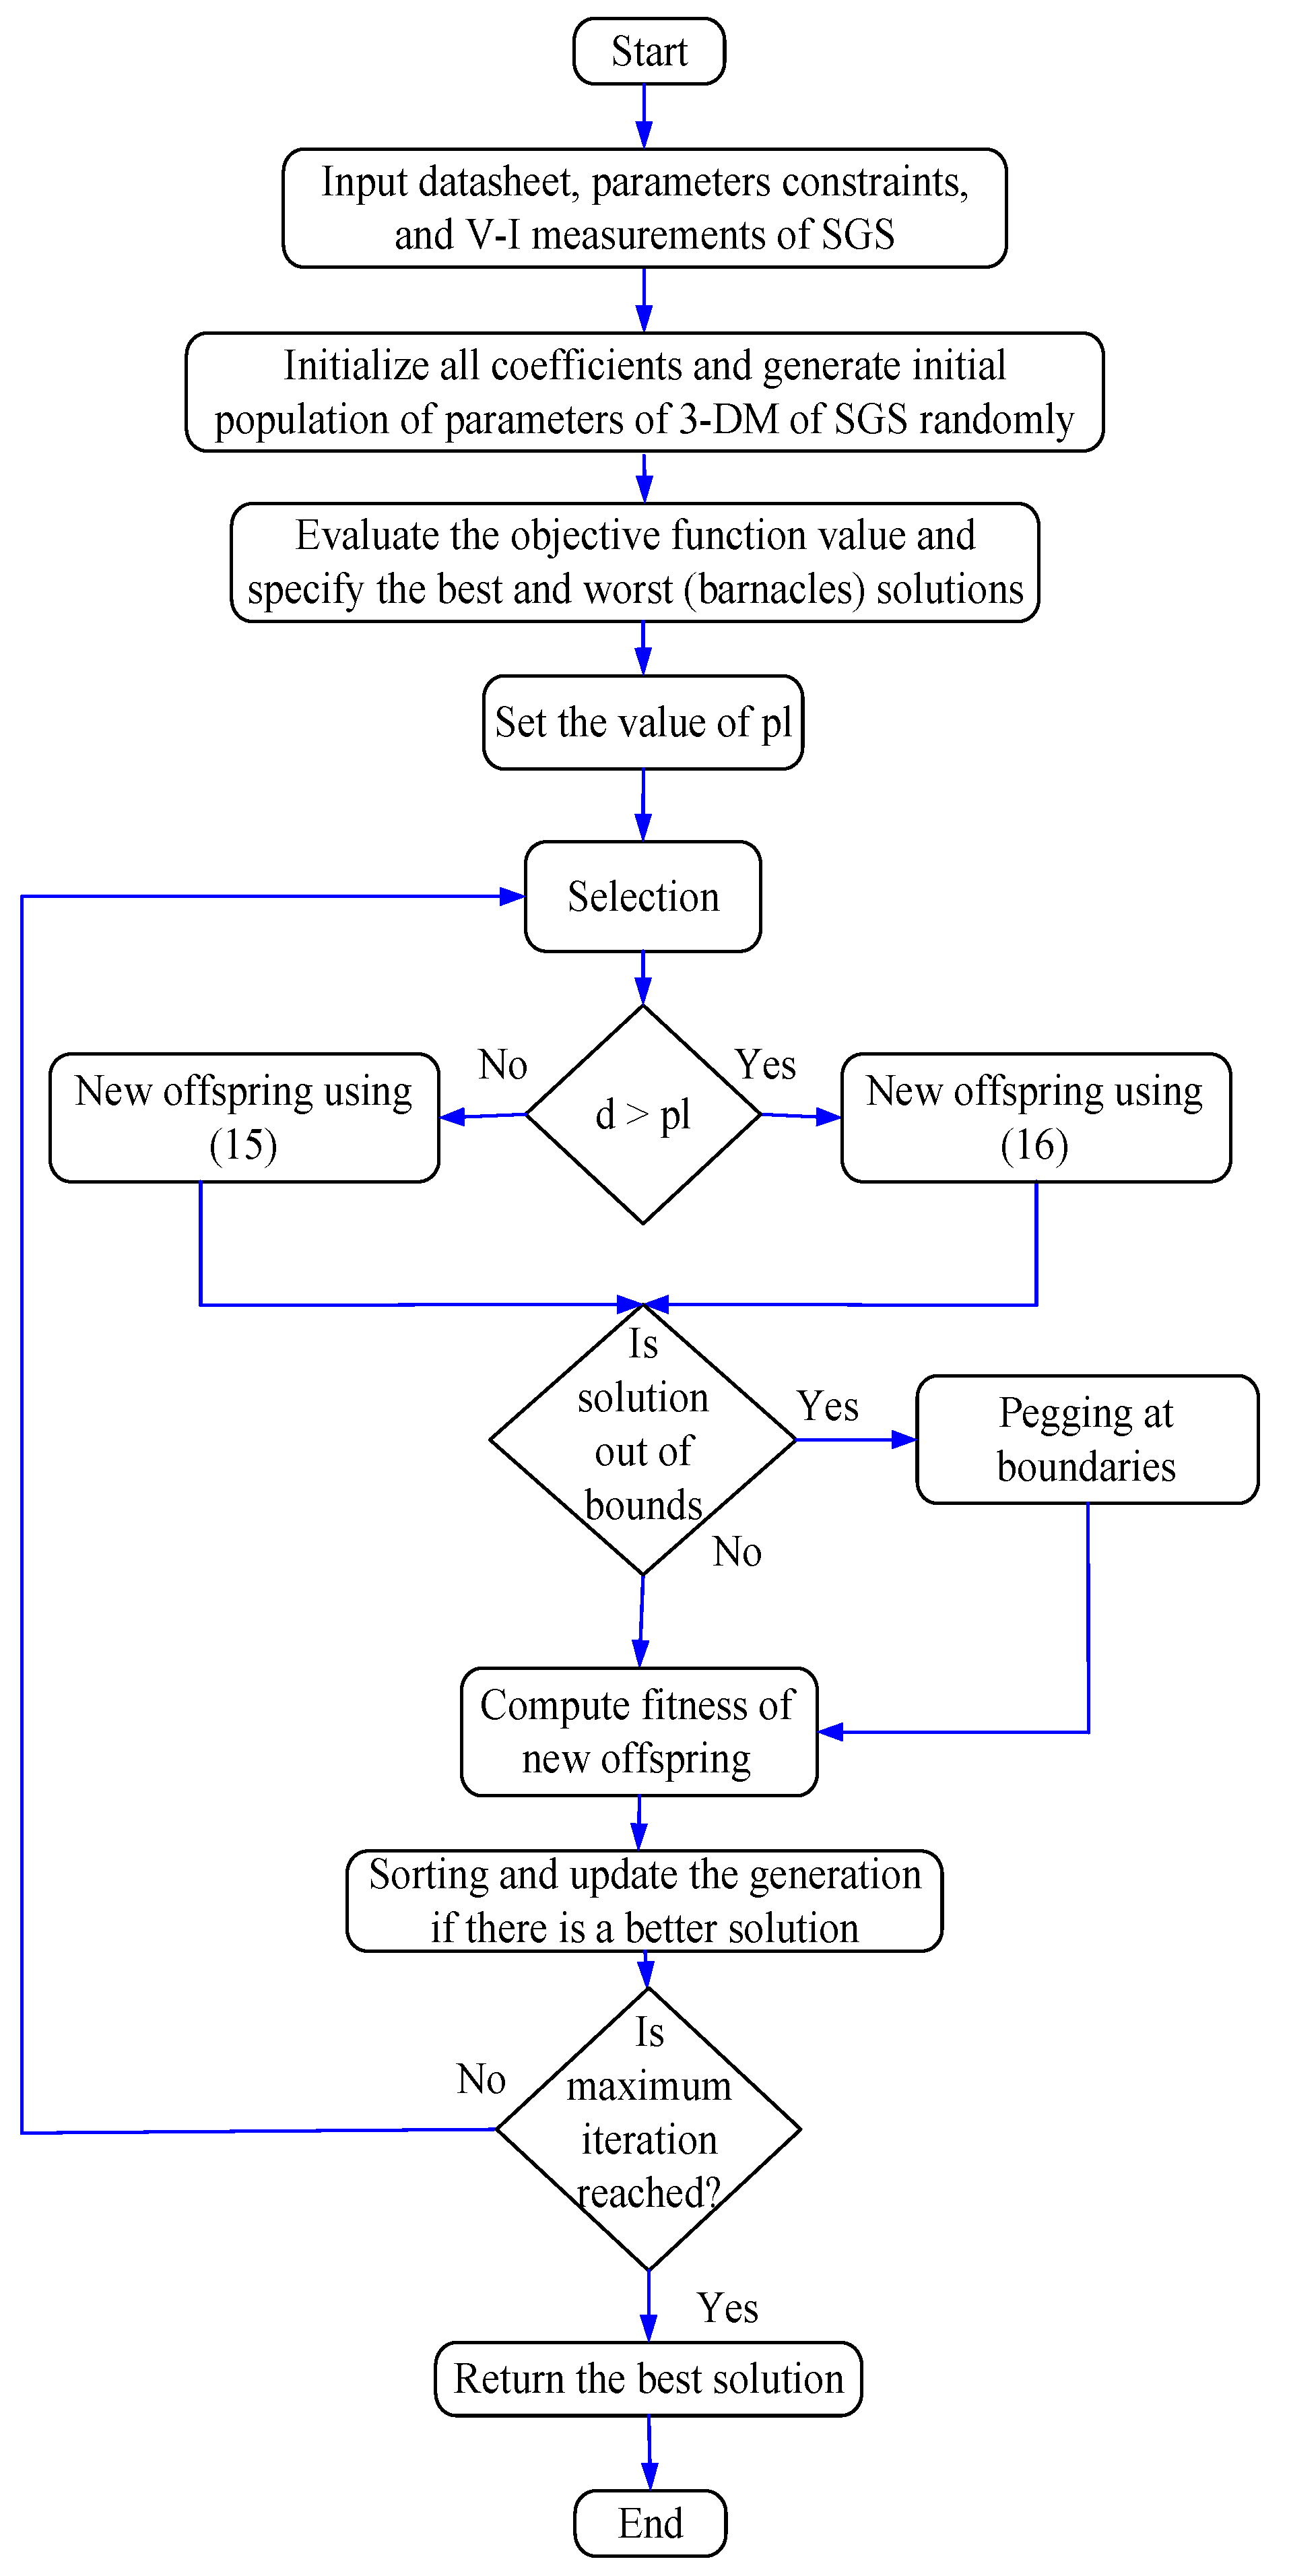
Section 3. BMOA procedures are stated in Section 4. Materials and methods are presented in Section 5. The yielded results are discussed in Section 6. Validations at changed conditions are presented in Section 7. Conclusions are briefed in Section 8.

2. Modeling the SGS via 3-DM

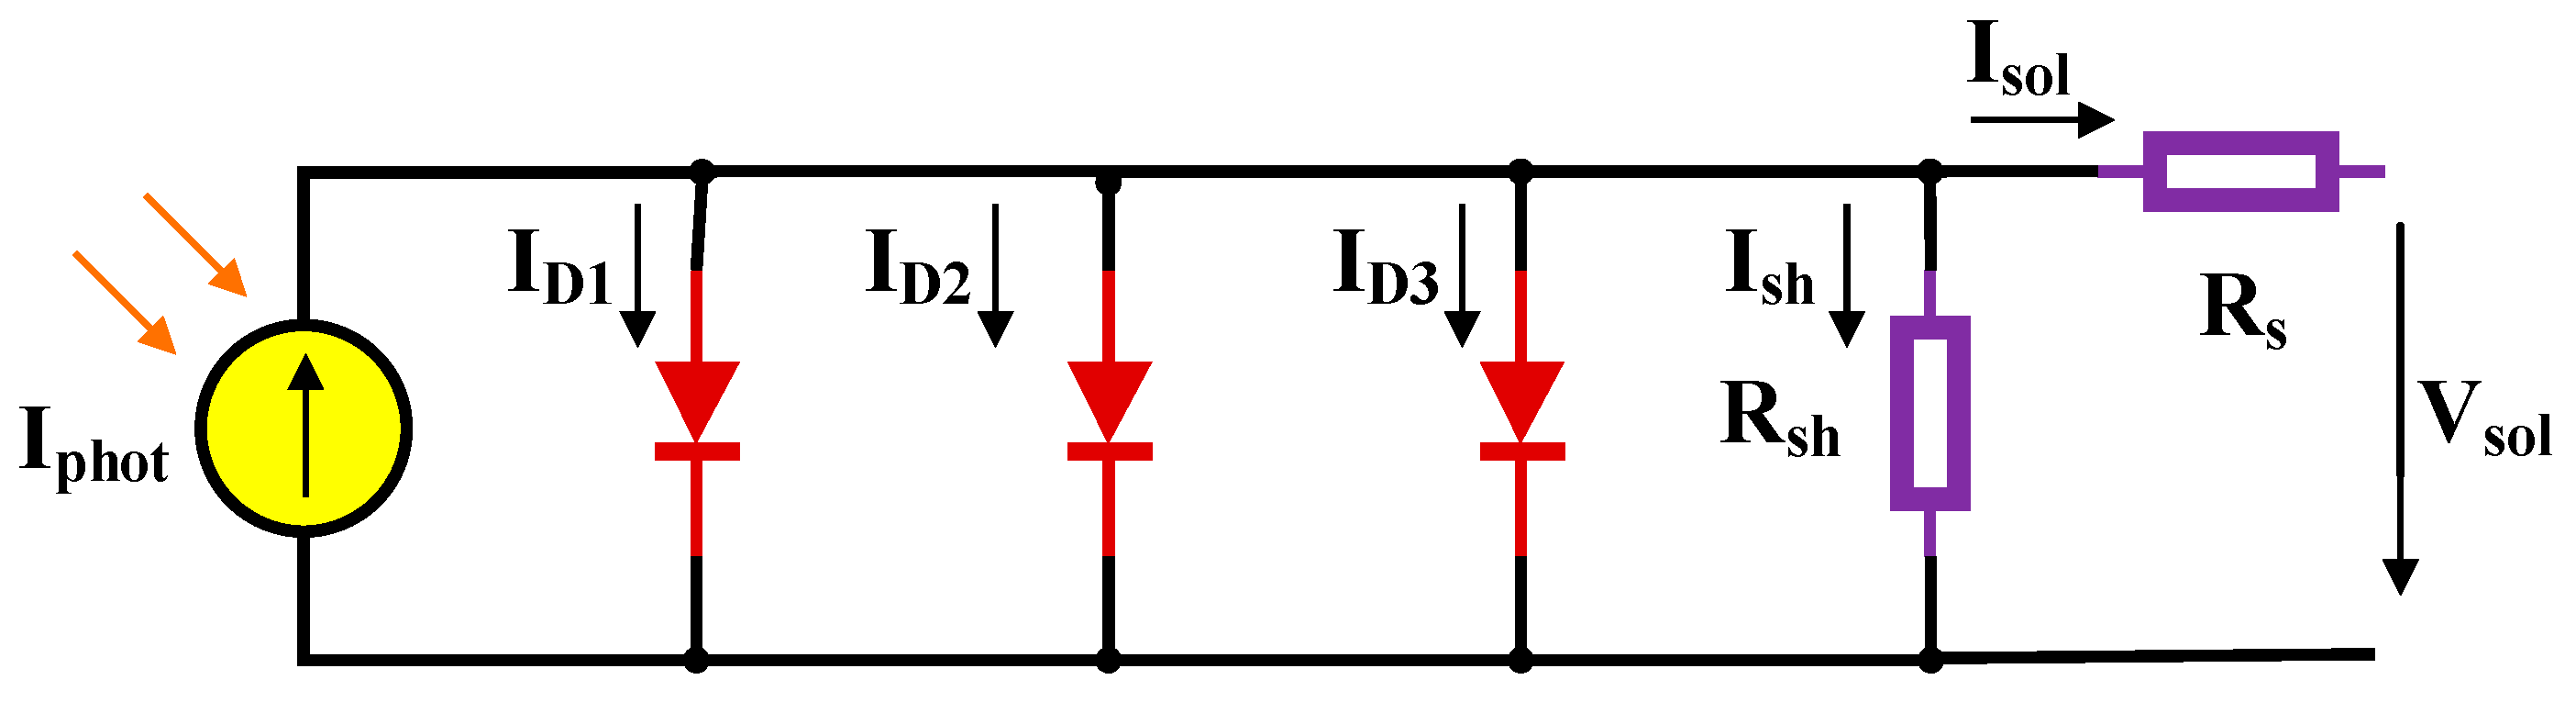
The nonlinearity of the 3-DM of the SGSs, which is the cause of orientation to optimization for identifying its UPs, is illustrated in this section. The 3-DM of the SGSs, as displayed in Figure 1, is comprised of an electric current source in parallel with three diodes and shunt resistance ( R sh ). There exist series resistances ( R s ) with the mentioned elements. The power losses inside the cell are embodied via R sh and R s . Applying the current law of Kirchhoff on the equivalent circuit of 3-DM of the SGS leads to:
I sol = I phot I D 1 I D 2 I D 3 V sol + I sol · R s R sh
I D 1 - 3 = I rs 1 - 3 [ e ( V sol + I sol · R s M 1 - 3 · V th ) 1 ]
V th = K · T K q
where:
I sol is generated current of SGS cell;
I phot is photo-produced current;
I D is the current passing in a diode;
V sol is generated voltage of SGS cell;
M is diode quality coefficient, which interprets various mechanisms responsible for moving carriers across the diode junction, M = 1 if the transport process is wholly diffusion, and M 2 if it is mainly recombination in the depletion zone;
I rs is diode opposite saturated current;
V th is thermic voltage;
K is Boltzmann constant = 1.38065 × 10 23 J/K;
TK is the cell temperature (K);
q is the electron charge = 1.60217646 × 10 19   C .
The module owns N ce series linked cells with gross module voltage ( V mo ) of N ce · V sol and the module current ( I mo ) equals I sol , the relationship in module is obtained via modifying (2) as stated in (4).
I D 1 - 3 = I rs 1 - 3 [ e ( N ce · V sol + I sol · N ce · R s N ce · M 1 - 3 · V th ) 1 ]
Figure 1. Equivalent circuit of 3-DM of the SGS.
Symmetry 14 01569 g001
The shunt resistance current for the module ( I sh ) is calculated using (5).
I sh = V mo + I sol · N ce · R s N ce · R sh
It is recognized that M and R s do not count on neither G nor T variants [46]. Nevertheless, other variables, viz. I phot , I rs , E g and R sh count on either G and/or T as detailed below.
I phot   principally counts on G and T [47], as stated in (6), knowing that the regular cell temperature throughout testing is 25 °C.
I phot = I phot _ n · [ 1 + K i · ( T 25 ) ] · G 1000
where:
I phot _ n is the photo-produced current at RAC;
K i is the temperature factor of the current;
T is the cell temperature (°C);
I rs counts on T [47,48,49], as depicted in (7).
I rs = I rs n ( T 25 ) 3 e ( q · E g M · K ) ( 1 25 1 T )
where:
I rs _ n is diode reverse-saturation current at RAC;
E g is band-gap energy;
E g counts on T that can be modified via (8). The open-circuit voltage is reliant on T as stated in (9).
E g = E g n [ 1 2.668 × 10 4 ( T 25 ) ]
V n - l = V n - l _ n [ 1 + K v · ( T 25 ) ]
where:
E g _ n is band-gap energy at RAC;
V n - l _ n is no-load voltage at RAC;
K v is the temperature factor of voltage;
Shunt resistance counts on G [46,50] as stated in (10).
R sh = R sh n ( 1000 G )
where R sh n is shunt resistance at RAC.
The cell working temperature is nearly defined [51] as depicted in (11).
T = T am + ( RFCT 20 800 ) · G
where RFCT is regular functioning cell temperature ( ° C ).
Regarding (1) to (6), it is obvious that there exist nine Ups, viz. ( I phot ,   I rs 1 - 3 ,   R sh ,   R s ,   M 1 - 3 ) , which need to be identified since they are not prescribed in the datasheets. BMOA is employed to optimize the Ups for owning the fittest values inside their higher and lower limits. Optimization is performed for assurance of precise modeling of SGS aimed at simulation and analysis.

3. Formulating the FF and Its Constraints

The FF to be minimized by BMOA is formulated in this section. FF works toward minimizing the root of the mean-squared errors (RMSEs) amongst the analogous measured and computed electric currents of SGS as depicted in (12).
FF = min ( RMSEs ) = min { 1 N me · m = 1 N me ( I M me ( m ) I M co ( m ) ) 2 }
where:
N me is the number of measurements;
I M co   and   I M me are the computed and measured current of SGS, respectively.
While scrutinizing (1) and (2), we notice the nonlinearity in (1) as well as the existence of I sol on both sides of (1); this necessitates computing I sol numerically. The Newton–Raphson method is chosen to be utilized via rewriting (1) as zero formula F   ( I sol ) and calculating its derivative   F ( I sol ) with respect to I sol , then I sol can be computed as below:
I sol j + 1 = I sol j F ( I sol j )   F ( I sol j )
where j is the j th iteration.
The upper and lower limits of ( I photo ,   I rs 1 - 3 ,   R sh ,   R s ,   M 1 - 3 ) identify the constraints to which the FF is submitted.

4. Overview of the BMOA

Barnacles are aquatic microorganisms which have existed for millions of years. Barnacles ae famous for their penis length (pl) with respect to its body [52], which ranges from seven to eight times its body length to handle being sedentary with the tides. In this research, an innovative optimizer is inspired via the barnacles mating manner, where the elected solution is supposed to be the barnacles and the process is iterated until reaching a predefined number (itemax) as described below:

4.1. Initialization

The solutions are initiated by subjugating to the top and bottom limits, then the population array is written as below:
X = [ x 1 1 x 1 M x po 1 x po M ]
where:
po is the population number of barnacles;
M is the dimension of the problem to be optimized.
The solutions are sorted in descending arrangement by putting the finest at the top of the array X.

4.2. Selection

BMOA differs from other evolutionary optimizers, e.g., GA, DE, etc. in the selection for mating where a barnacle is selected depending on its pl [45]. The selection in BMOA imitates the barnacles’ manner in terms of (i) exploitation—a random selection of females located within the range of pl; (ii) exploration—when the selected female is at distance beyond pl, the sperm is released in the water to fertilize it.

4.3. Reproduction

Reproduction in BMOA has a slight difference from other evolutionary optimizers in that BMOA has no particular formulas for deriving the barnacles’ reproduction; offspring production in BMOA chiefly relies on the hereditary characteristics of parents as depicted below:
x i M _ new = p · x barnacle _ f M + q · x barnacle _ m M     d pl
x i M _ new = rand · x barnacle _ m M     d > pl
q = p 1
where:
p and rand are randomized numbers amongst 0 and 1;
p and q are the characteristic proportions of father and mother which are inserted during the generation of the next offspring, consecutively;
x barnacle _ f M ,   x barnacle _ m M are solutions of the selected father and mother, consecutively;
d is the distance from father to mother.
Equation (15) pertains exploitation while (16) concerns exploration.

4.4. Influence of pl in BMOA

In BMOA, the decision to change from exploitation and exploration is determined by adjustment of pl [53]. This decision is a significant matter in any optimizer since excess exploitation can cause adhesion in regional optima, whereas excess exploration can result in missing the universal optima [54]. It is found that adjusting the pl to 70% of po gives the best results [44]. All details of the BMOA can be found in [44]. The MATLAB code of BMOA can be found in [55]. Figure 2 exhibits the flowchart of the BMOA for 3-DM of SGS.

5. Materials and Methods

Two modules are under study to assess the efficacy of the proposed BMOA-based procedure in parametrizing the 3-DM of the SGSs. The studied modules are Kyocera KC200GT and Copex P-120. The data of the first module were obtained via ETAP library [56] and the second is experimentally employed and its specifications can be obtained from [57]. The electrical specifications of two SGSs are revealed in Table 1. The limits of the nine UPs of the 3-DM ( I phot ,   I rs 1 - 3 ,   R sh ,   R s ,   M 1 - 3 ) are listed in Table 2. The simulations are implemented using MATLAB installed on Fujitsu Laptop with an Intel(R) Core ™ i7-4702MQ CPU@ 2.2 GHz 2.2 GHz and RAM of 8 GB.
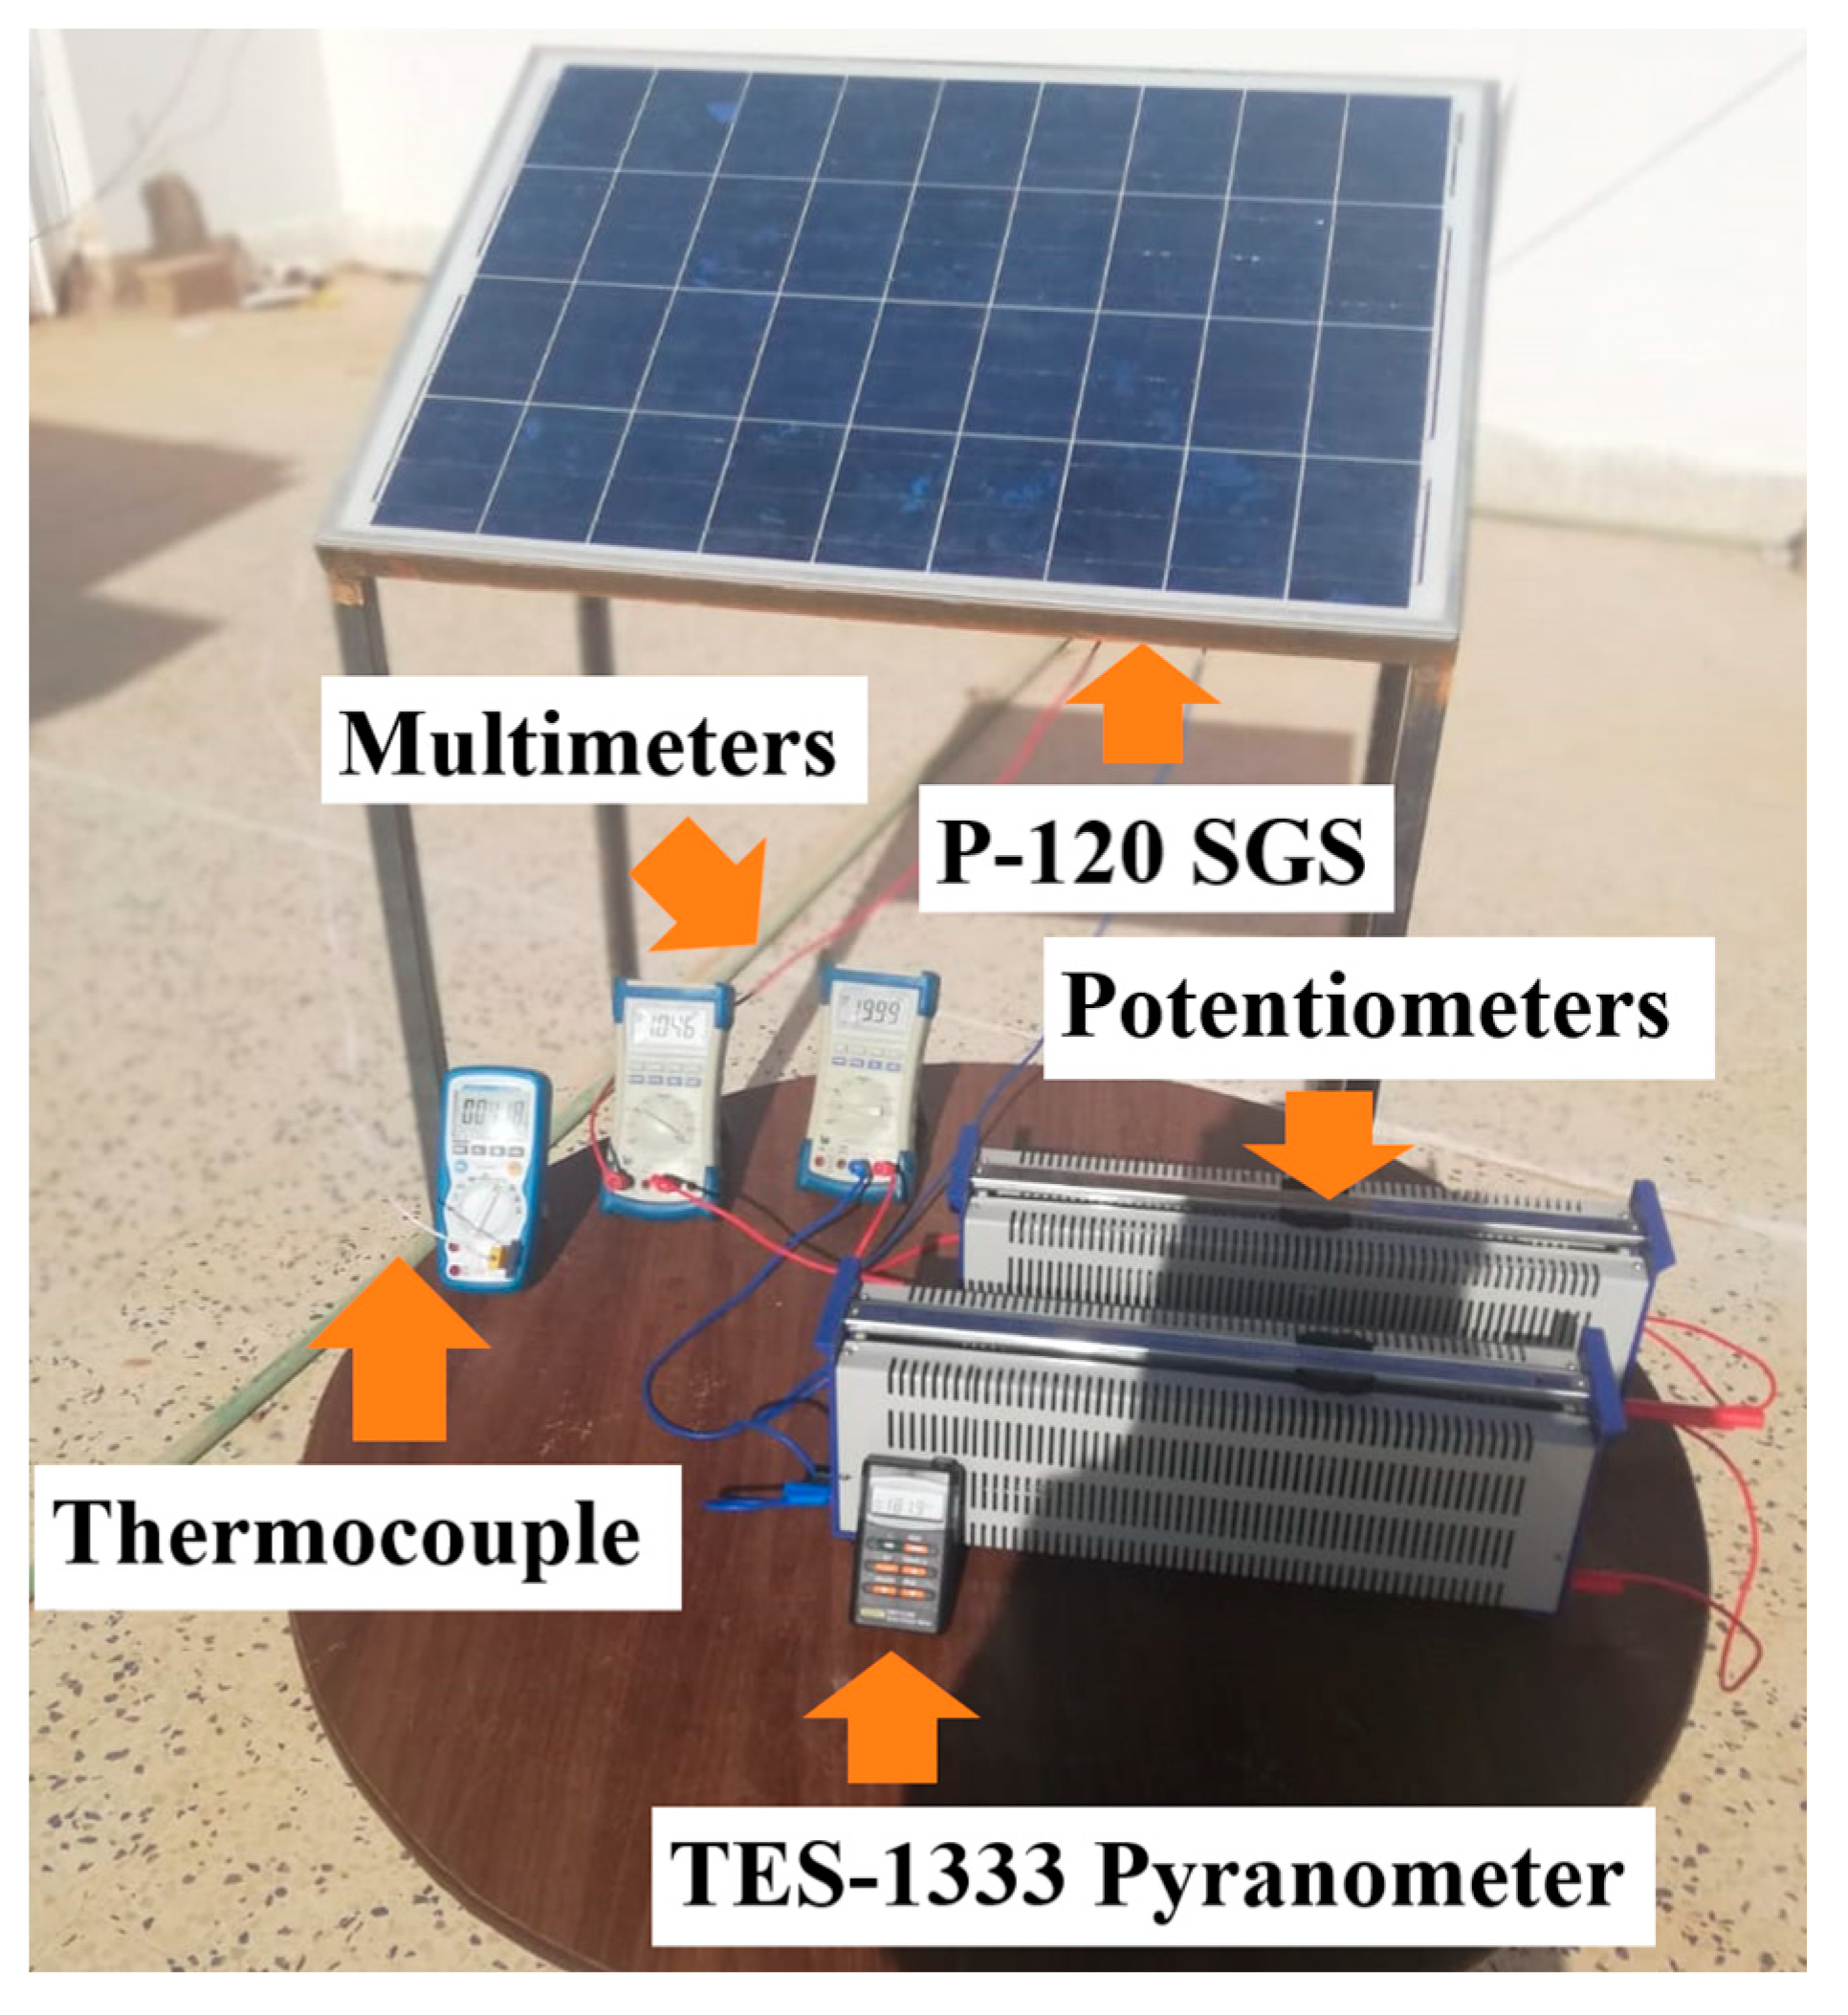
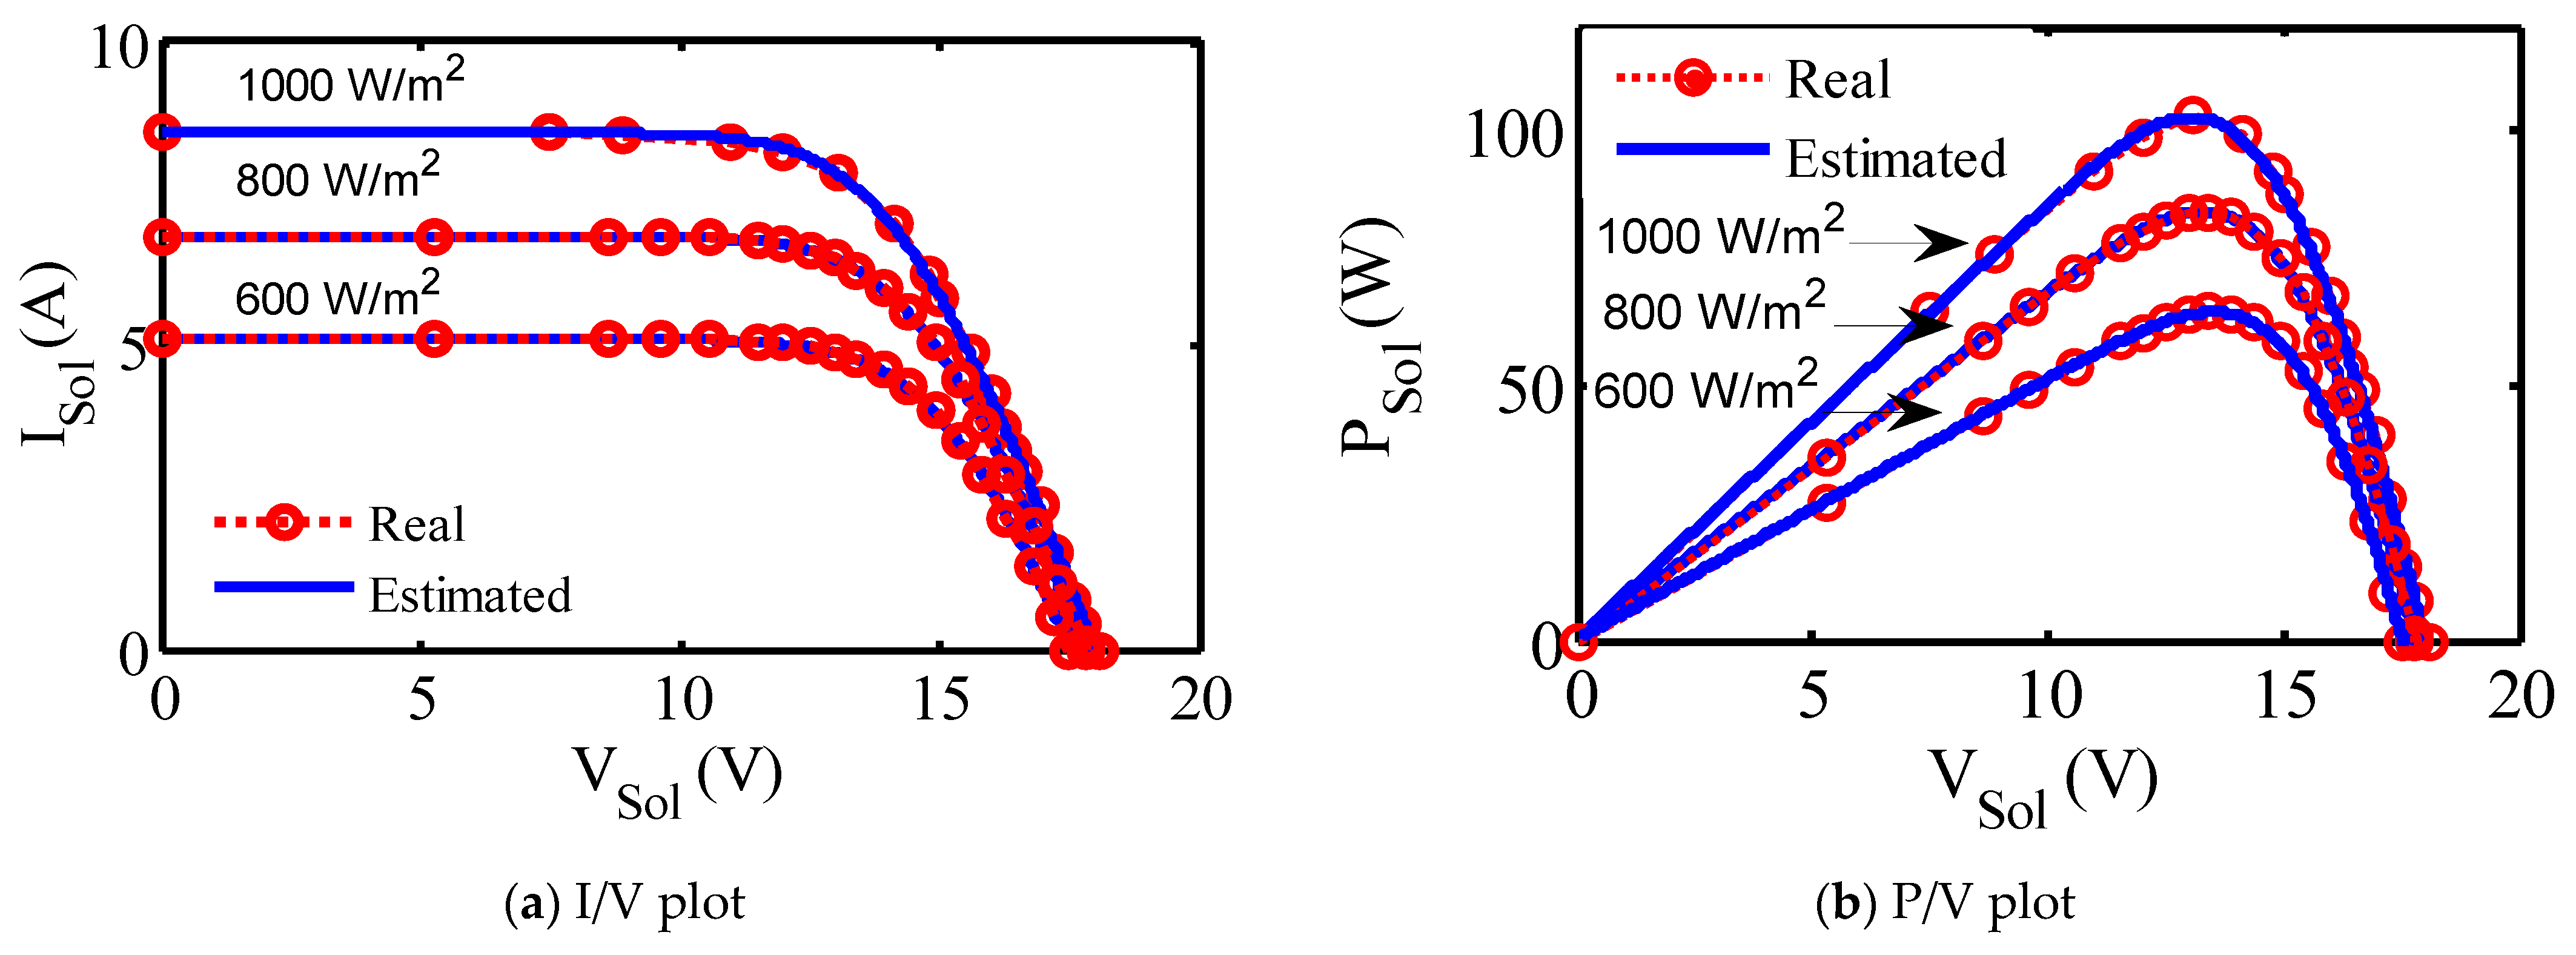
Figure 3 exhibits the experimental setup of P-120 SGS, which was held in September 2021 above the building of laboratories in Taif University. Firstly, in this Section, P-120 module is implemented at RAC where G and T are measured via pyranometer and thermometer, respectively. Secondly, P-120 module is implemented at various irradiances and temperatures to exhibit BMOA functioning at various conditions and the results are recorded in Section 6. Potentiometers are employed to load this SGS progressively up to 8 A. Digital multimeters are employed to measure V mo and   I mo . Twenty-one points of measurements of V/I are recorded. The equipment class and errors are revealed in Table 3.
The itemax is 1000. Table 4 reveals BMOA factors (po, pl) which are defined through trials and errors as followed in all metaheuristic-based optimizers.

6. Results and Discussion

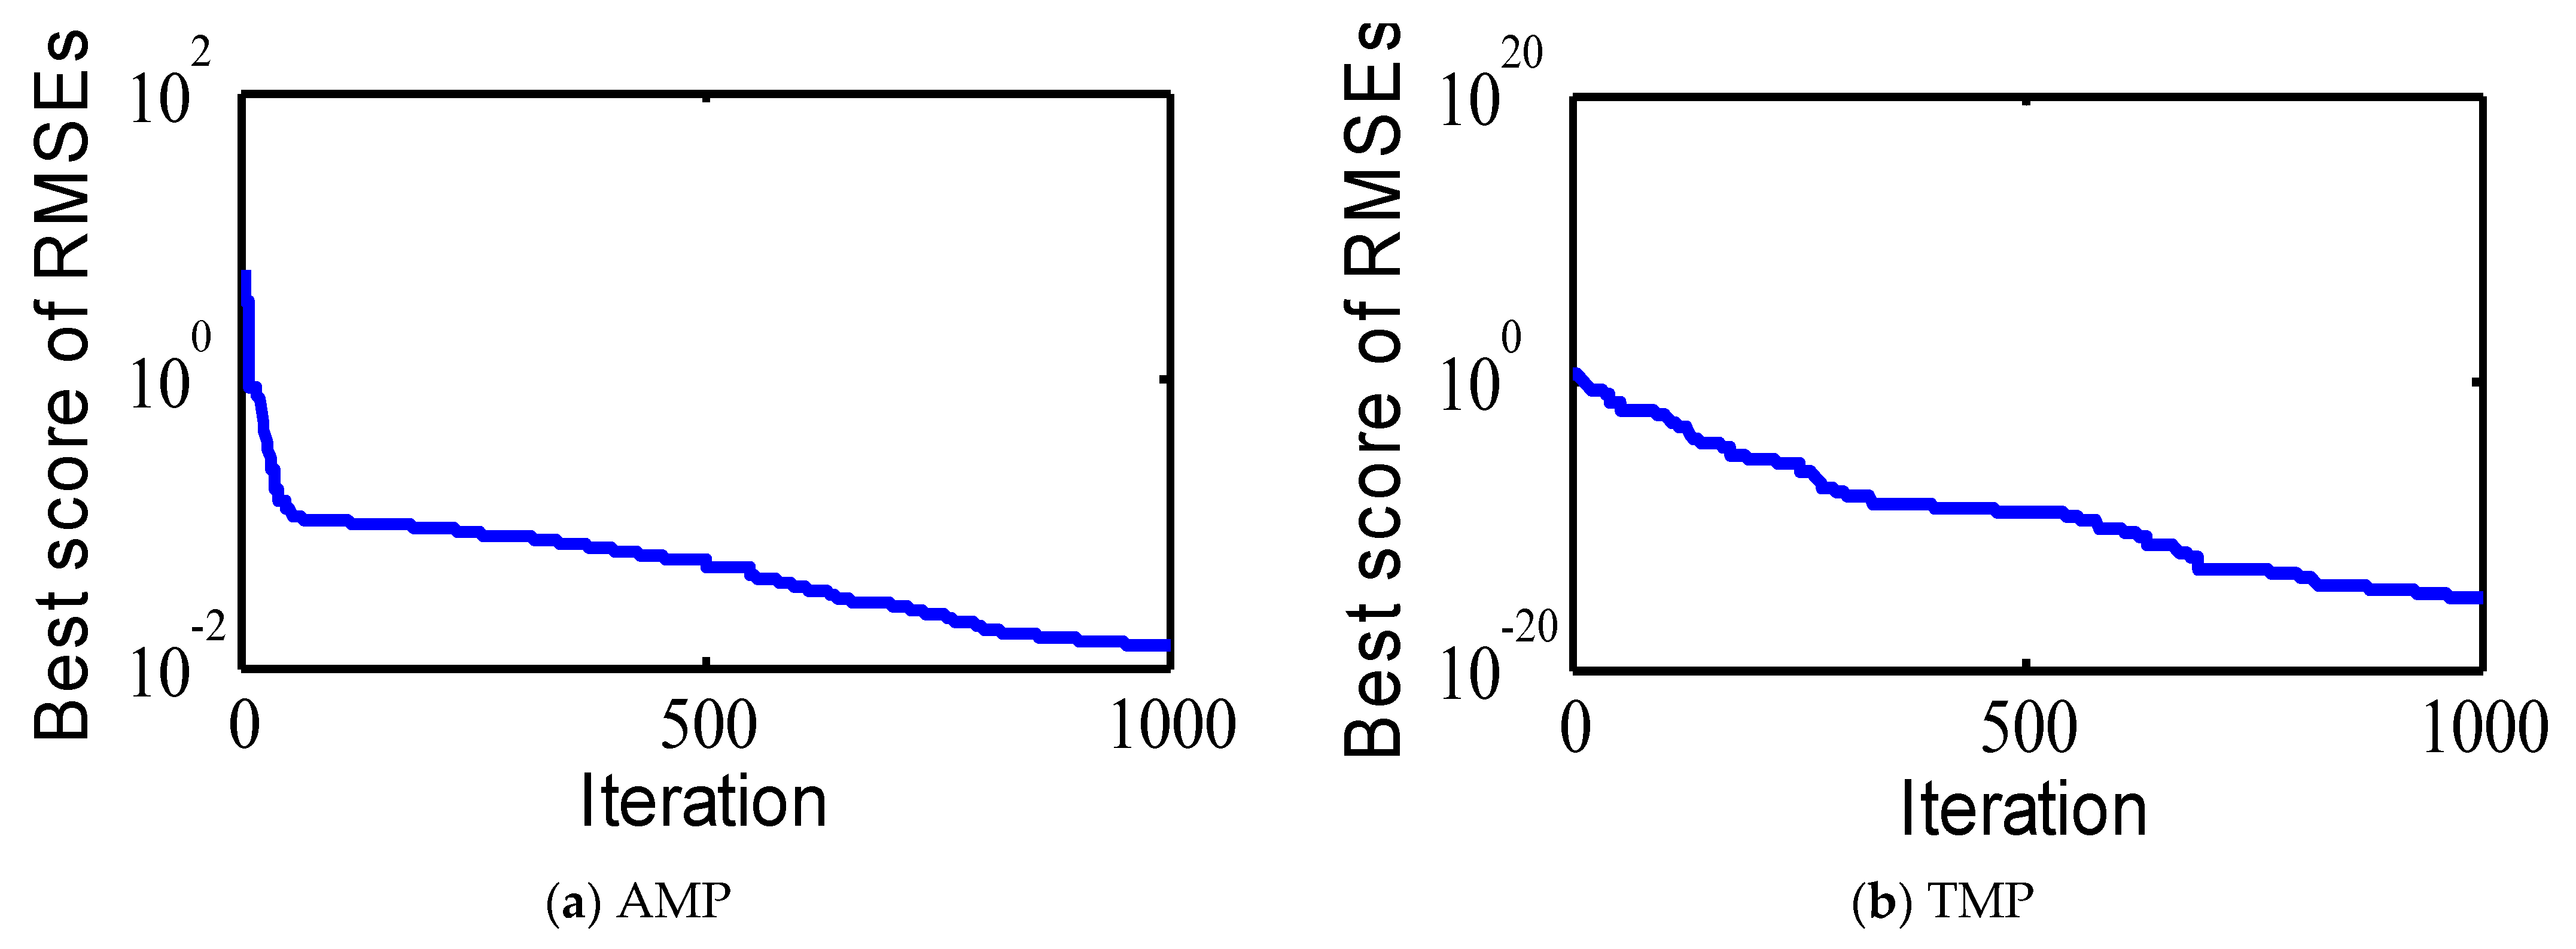
After employing BMOA, the electric currents are computed from the 3-DM; thereafter, RMSEs are calculated via (12), resulting in the smallest value of 9.22045 × 10⁻² using all measured points (AMP), which is less than that resulted from other optimizers in the literature by 35.05% to 87.73%, and when TMP is used, the resultant RMSEs are 3.55604 × 10⁻¹⁸, which are less than that resulted from other optimizers in the literature by 99.91% to 99.99%, as written in Table 5. The benefit of utilizing BMOA for identifying the nine UPs of the 3-DM of SGSs is obvious since the minimum decrease in RMSEs is 35.05% using AMP and 99.91% using TMP. The fittest values of the UPs of the 3-DM are acquired after numerous independent runs of BMOA producing minimum FF because of the stochastic nature of these optimizers. The convergence tendency of the RMSEs diagram is displayed in Figure 4.
There are no results in the literature about the P-120 module that was experienced for our article. For validating the BMOA results, two additional optimizers are used, viz. the equilibrium optimizer (EO) [58] and differential search optimizer (DSO) [59] with po = 30 and ite max = 1000 as adjusted for BMOA to associate the comparison with fairness.
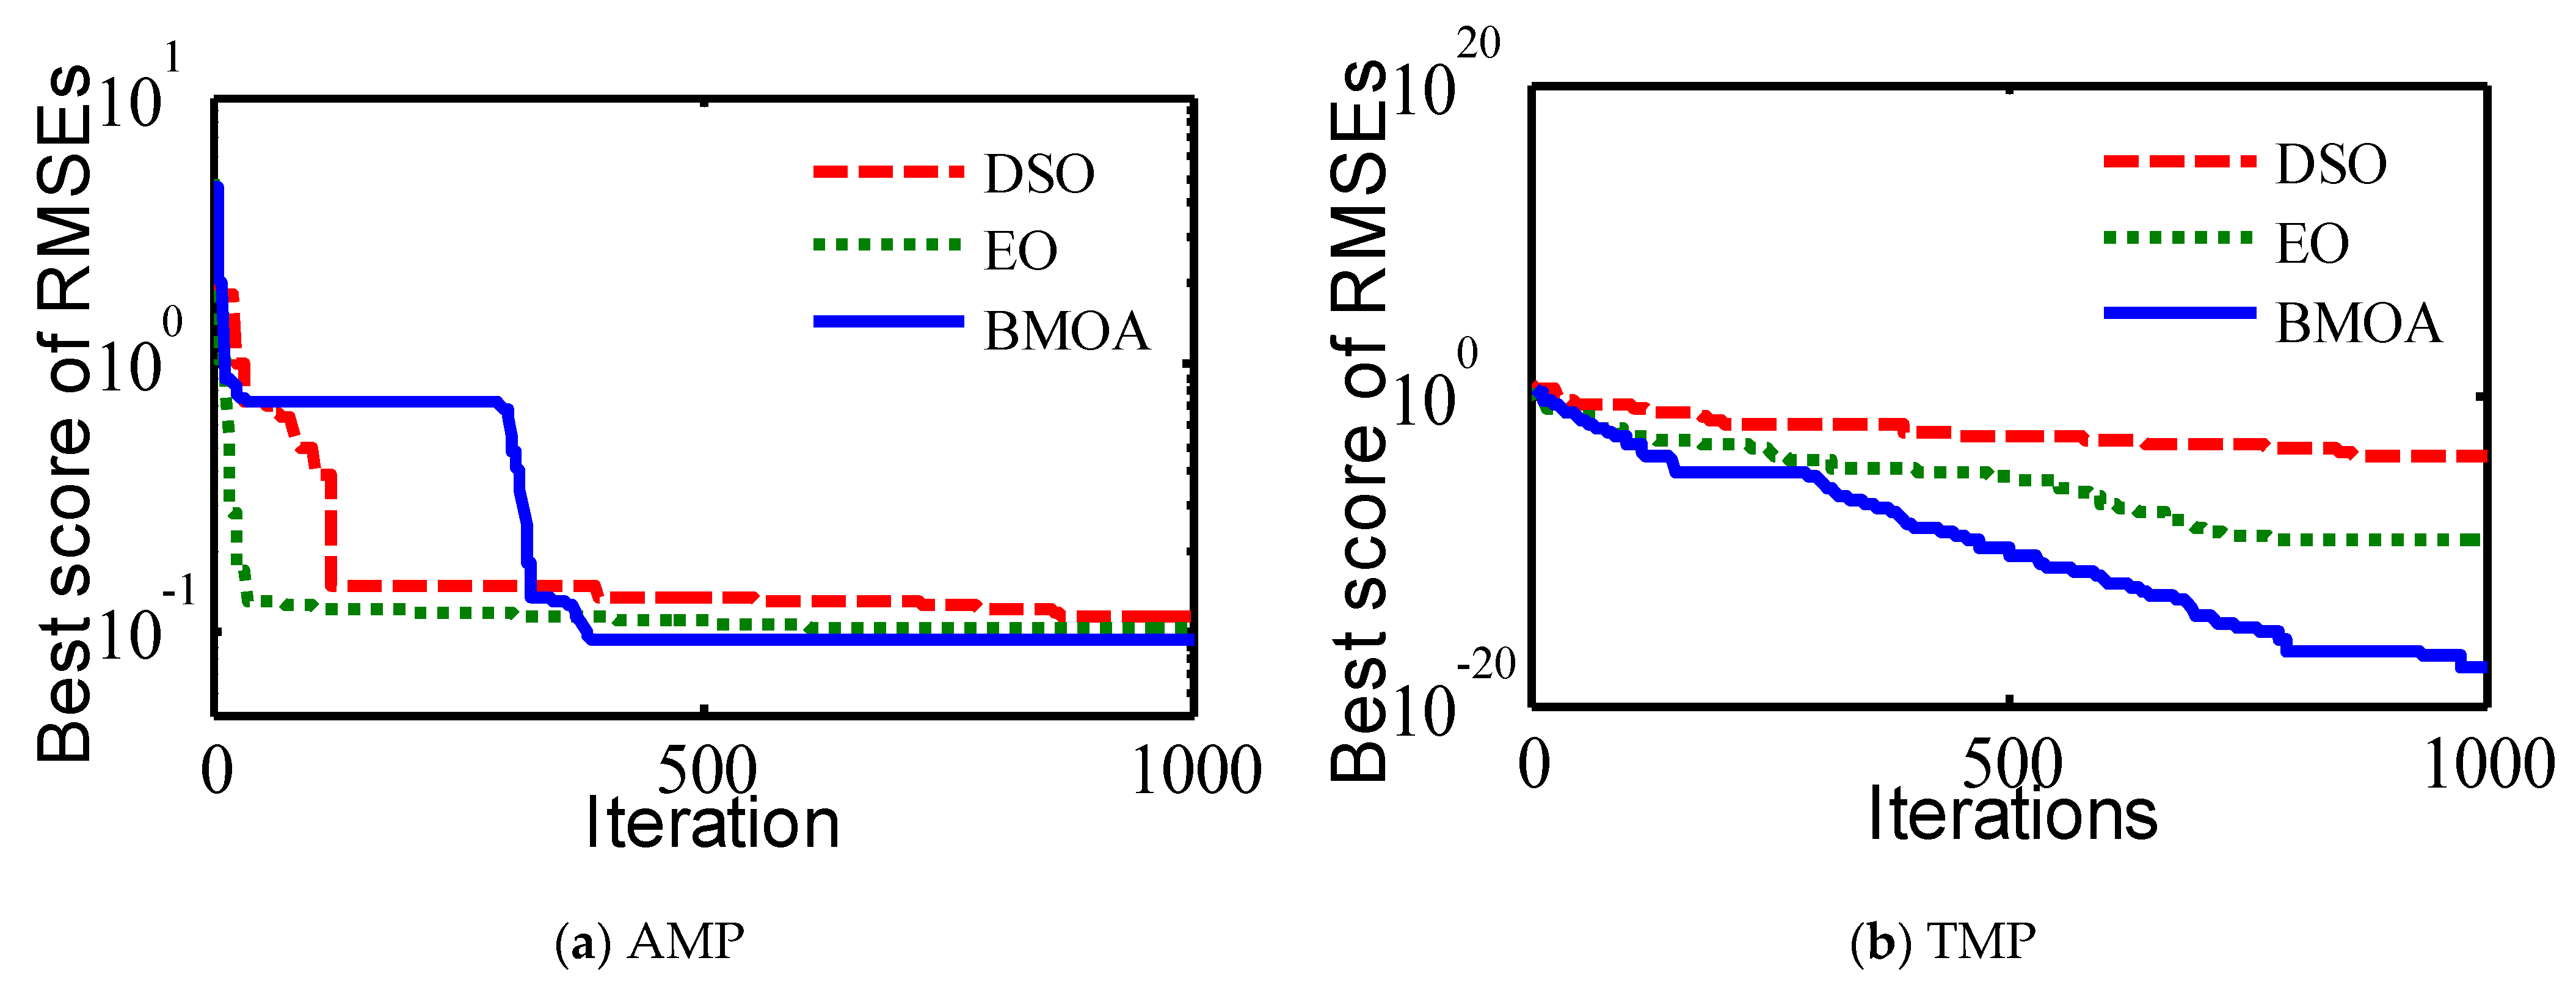
Comparisons between BMOA, EO, and DSO dependent on the results show that the obtained RMSEs by BMOA own the lowest value, namely 9.22045 × 10⁻² using AMP, which is less than that which resulted from other optimizers in the literature by 11.18% to 20.73%, and when TMP is used, the resultant RMSEs are 3.55604 × 10⁻¹⁸, which is less than that which resulted from other optimizers in the literature by 99.99%. The advantage of utilizing BMOA for identifying the nine UPs of the 3-DM of SGSs is clear, since the minimum decrease in RMSEs is 11.18% using AMP and 99.99% using TMP, as revealed in Figure 5 and Table 6.
Extracted UPs per cell of the 3-DM of the SGSs using AMP are written in Table 7. With reference to (5) and (6), it is clear that the total module parameters, namely shunt, series resistors, and diode quality coefficient, can be computed as Rsh/module = Nce × (Rsh/cell), Rs/module = Nce × (Rs/cell), and M1-3/module = Nce × (M1-3/cell), respectively. The RMSEs convergences are revealed in Figure 4 and Figure 5. The convergence variability among the different SGSs is due to different ratings of power, voltage, and current and accordingly different measurements. Additionally, the stochastic nature of the optimizer leads to convergence variability among the different SGSs.
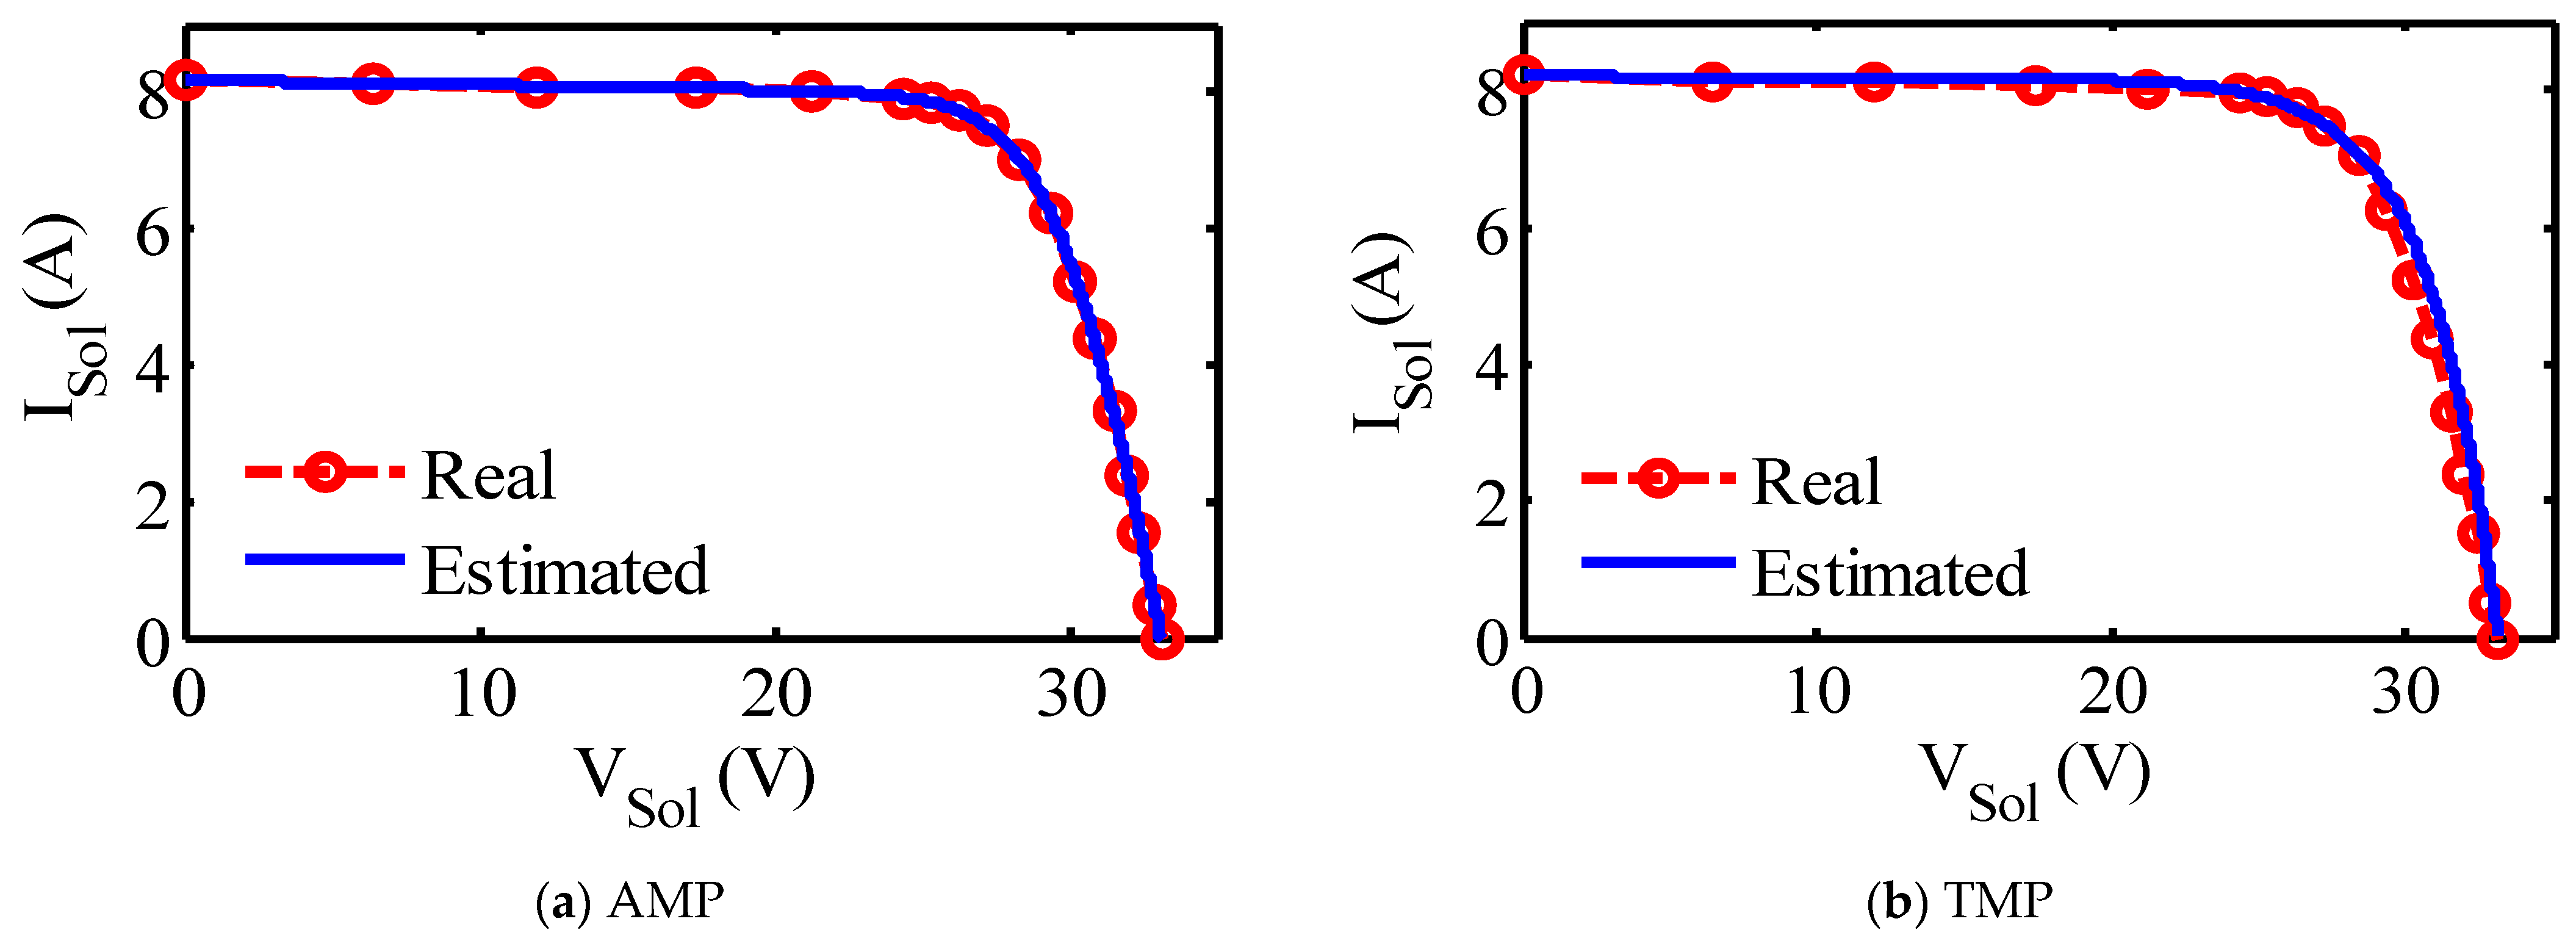
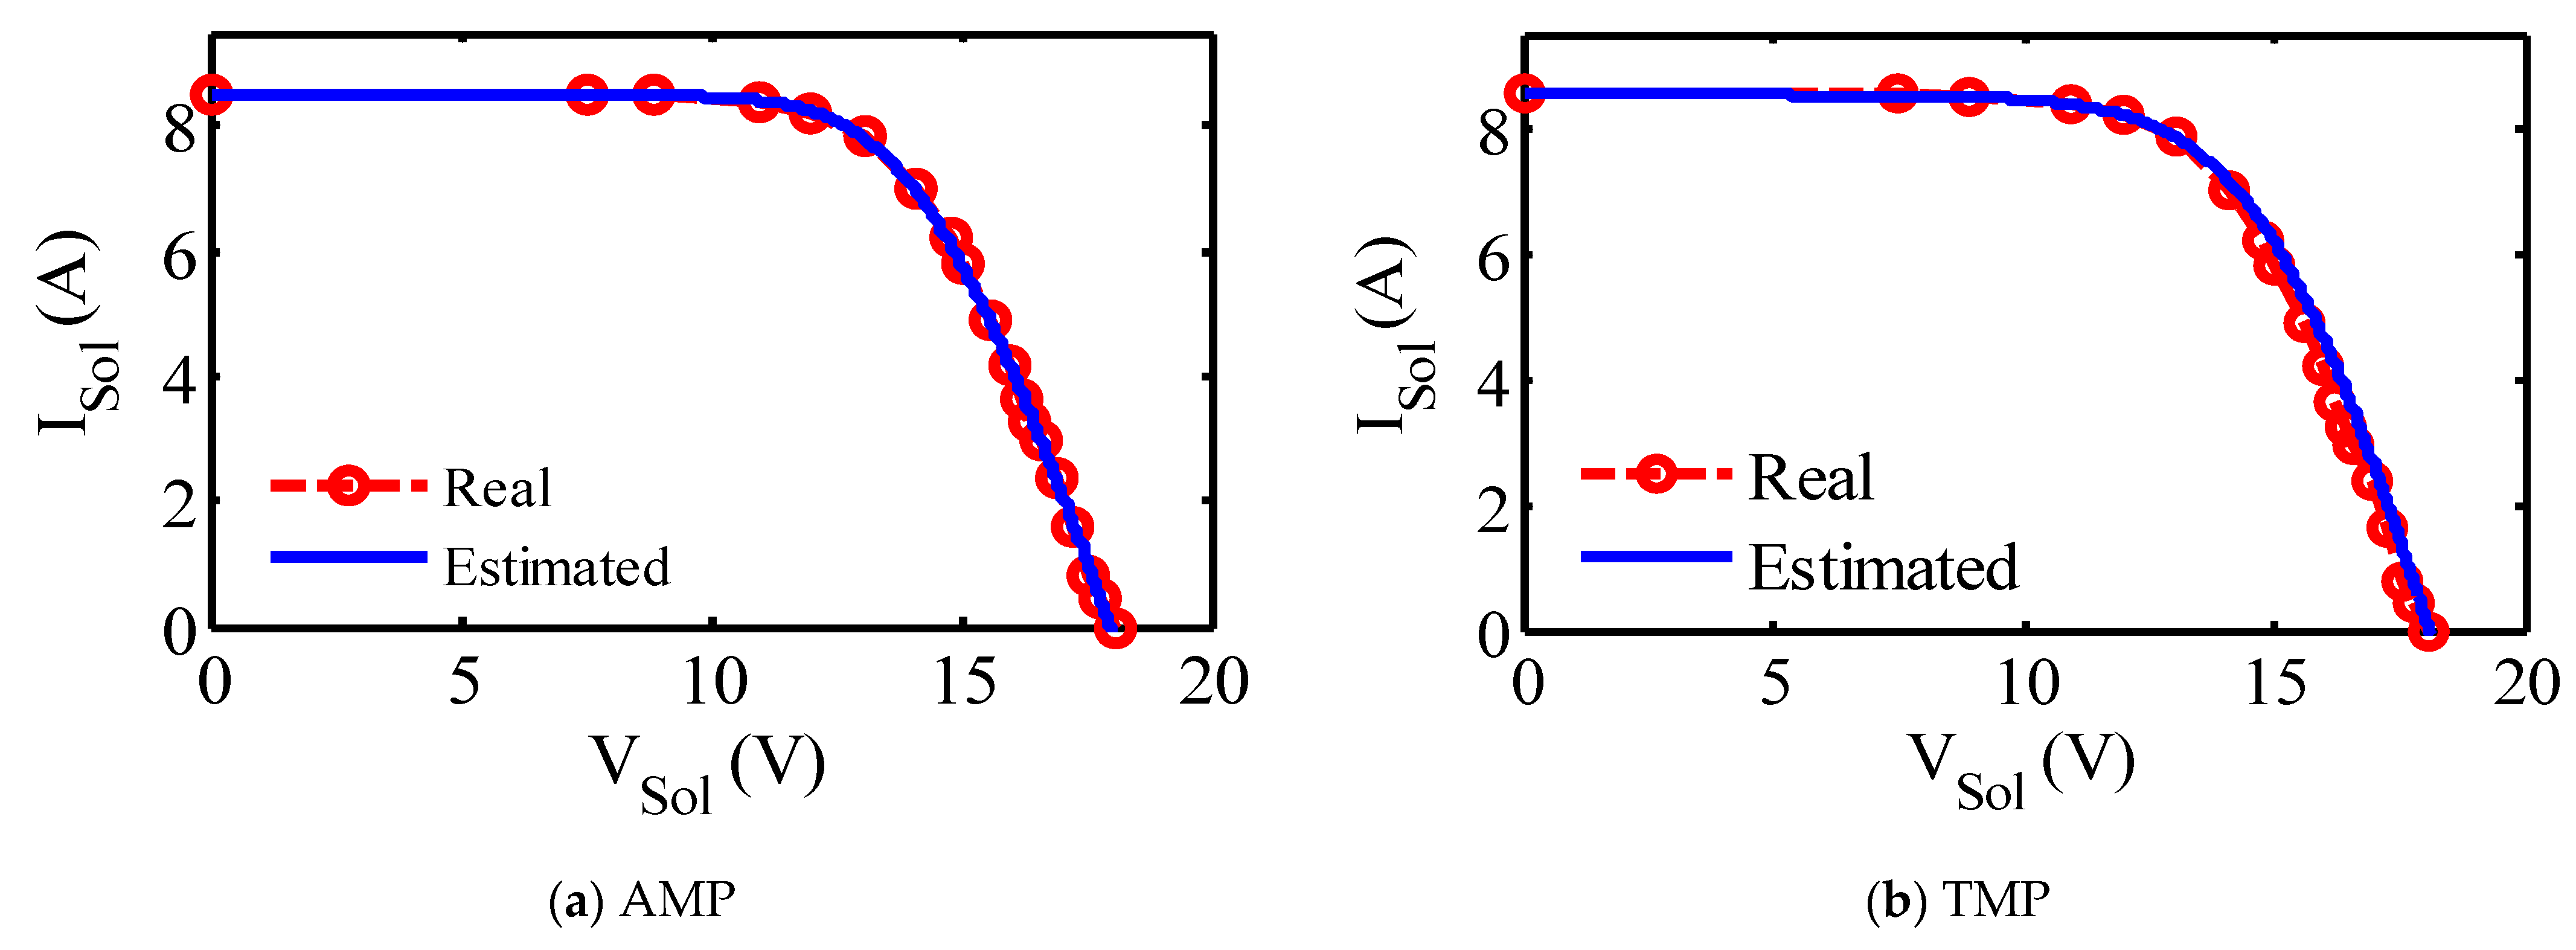
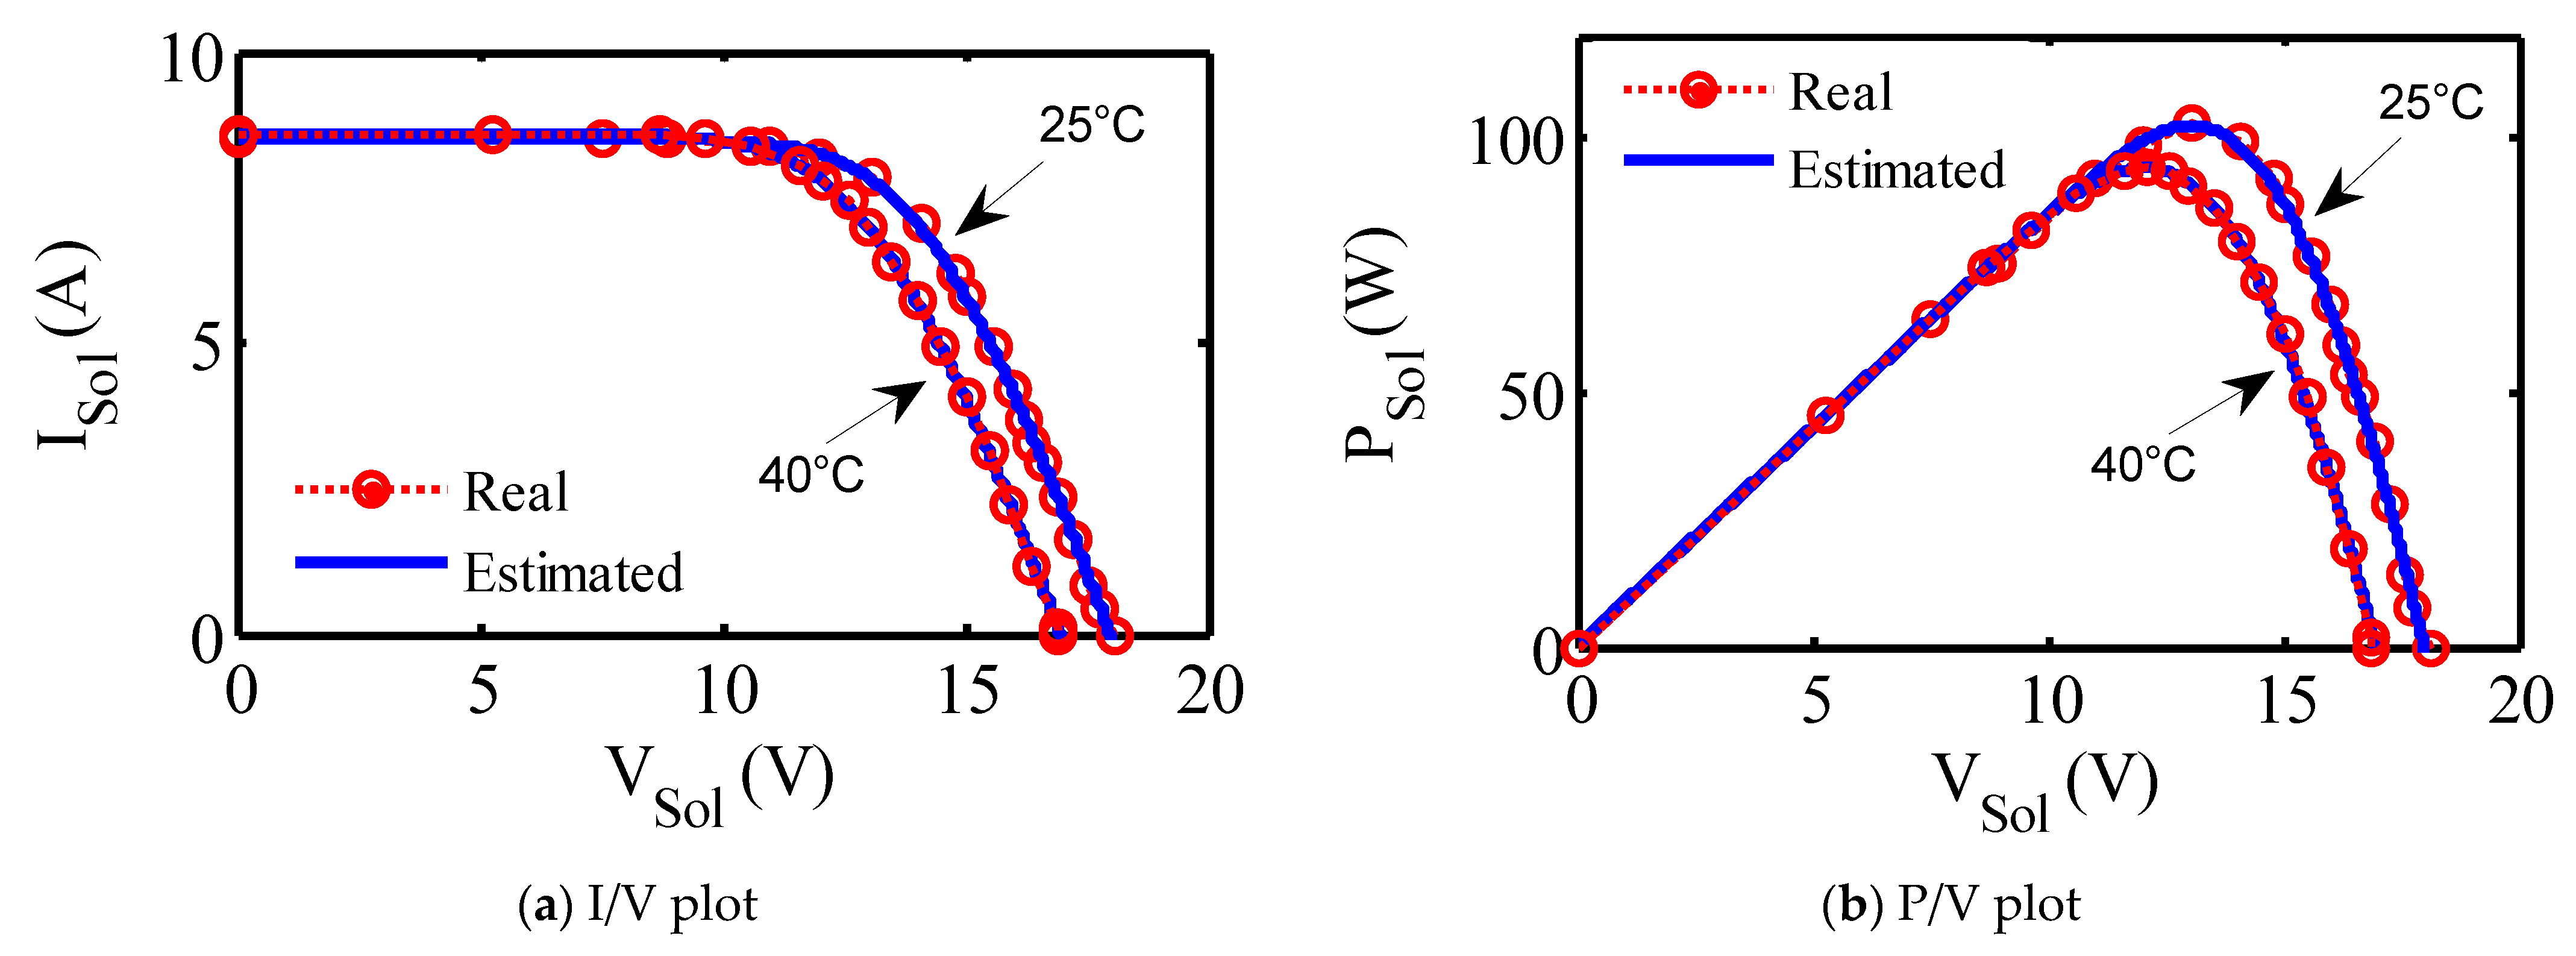
The yielded results for the I/V plot of SGS at RAC that are extracted by BMOA using AMP and the measured values are displayed in Figure 6a and Figure 7a, for KC200GT and P-120 modules, correspondingly. Closeness amongst the experienced electric currents and calculated electric currents by BMOA affirms the precision of the estimated UPs of the 3-DM of the SGSs. While similar results are extracted by BMOA using TMP (Figure 6b and Figure 7b), there is less closeness despite the RMSEs being smaller, since RMSEs are computed only at TMP, which prove that TMP does not suffice to characterize SGS, as mentioned in Section 1.
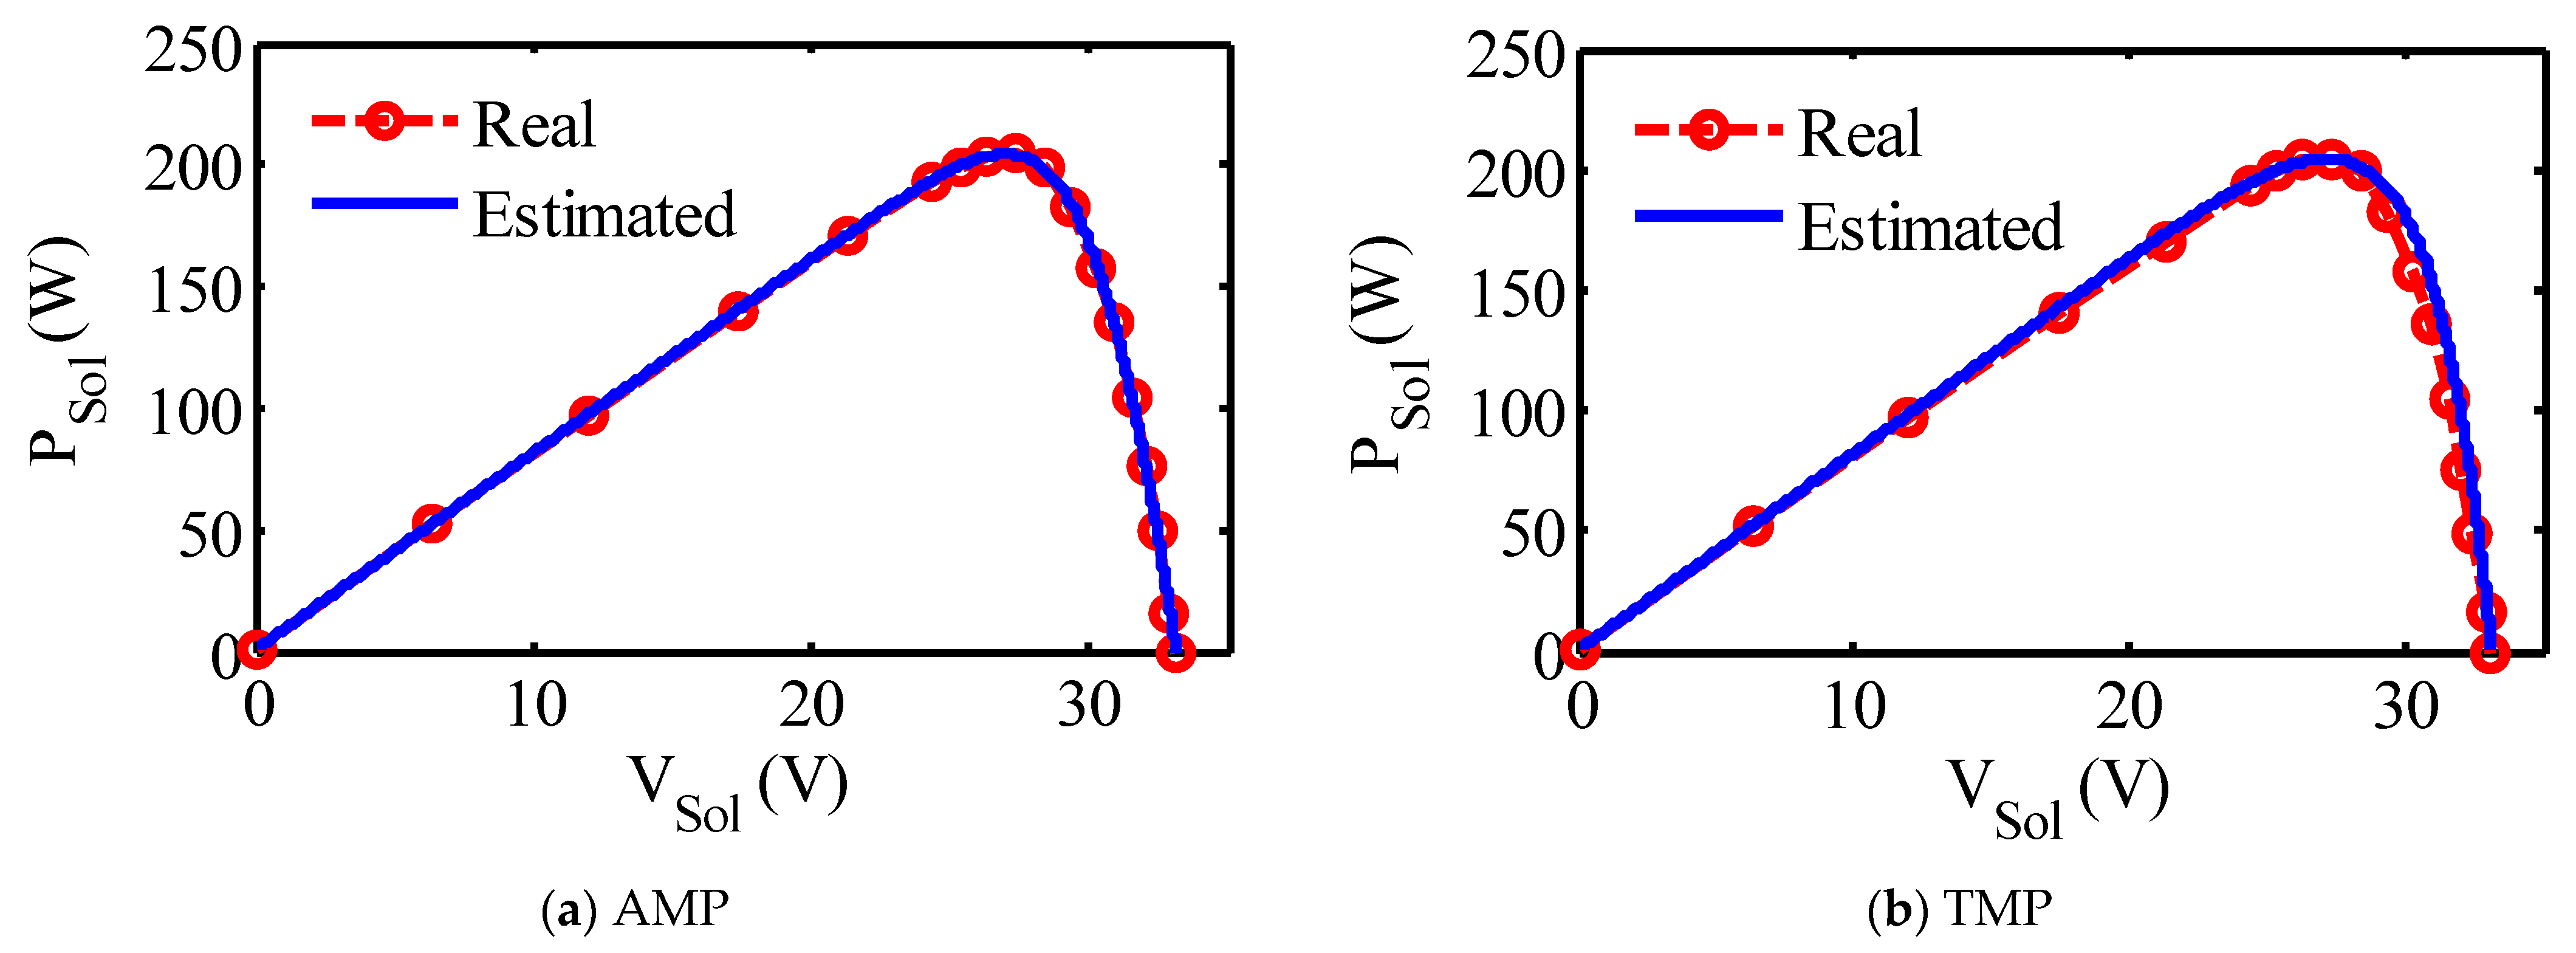
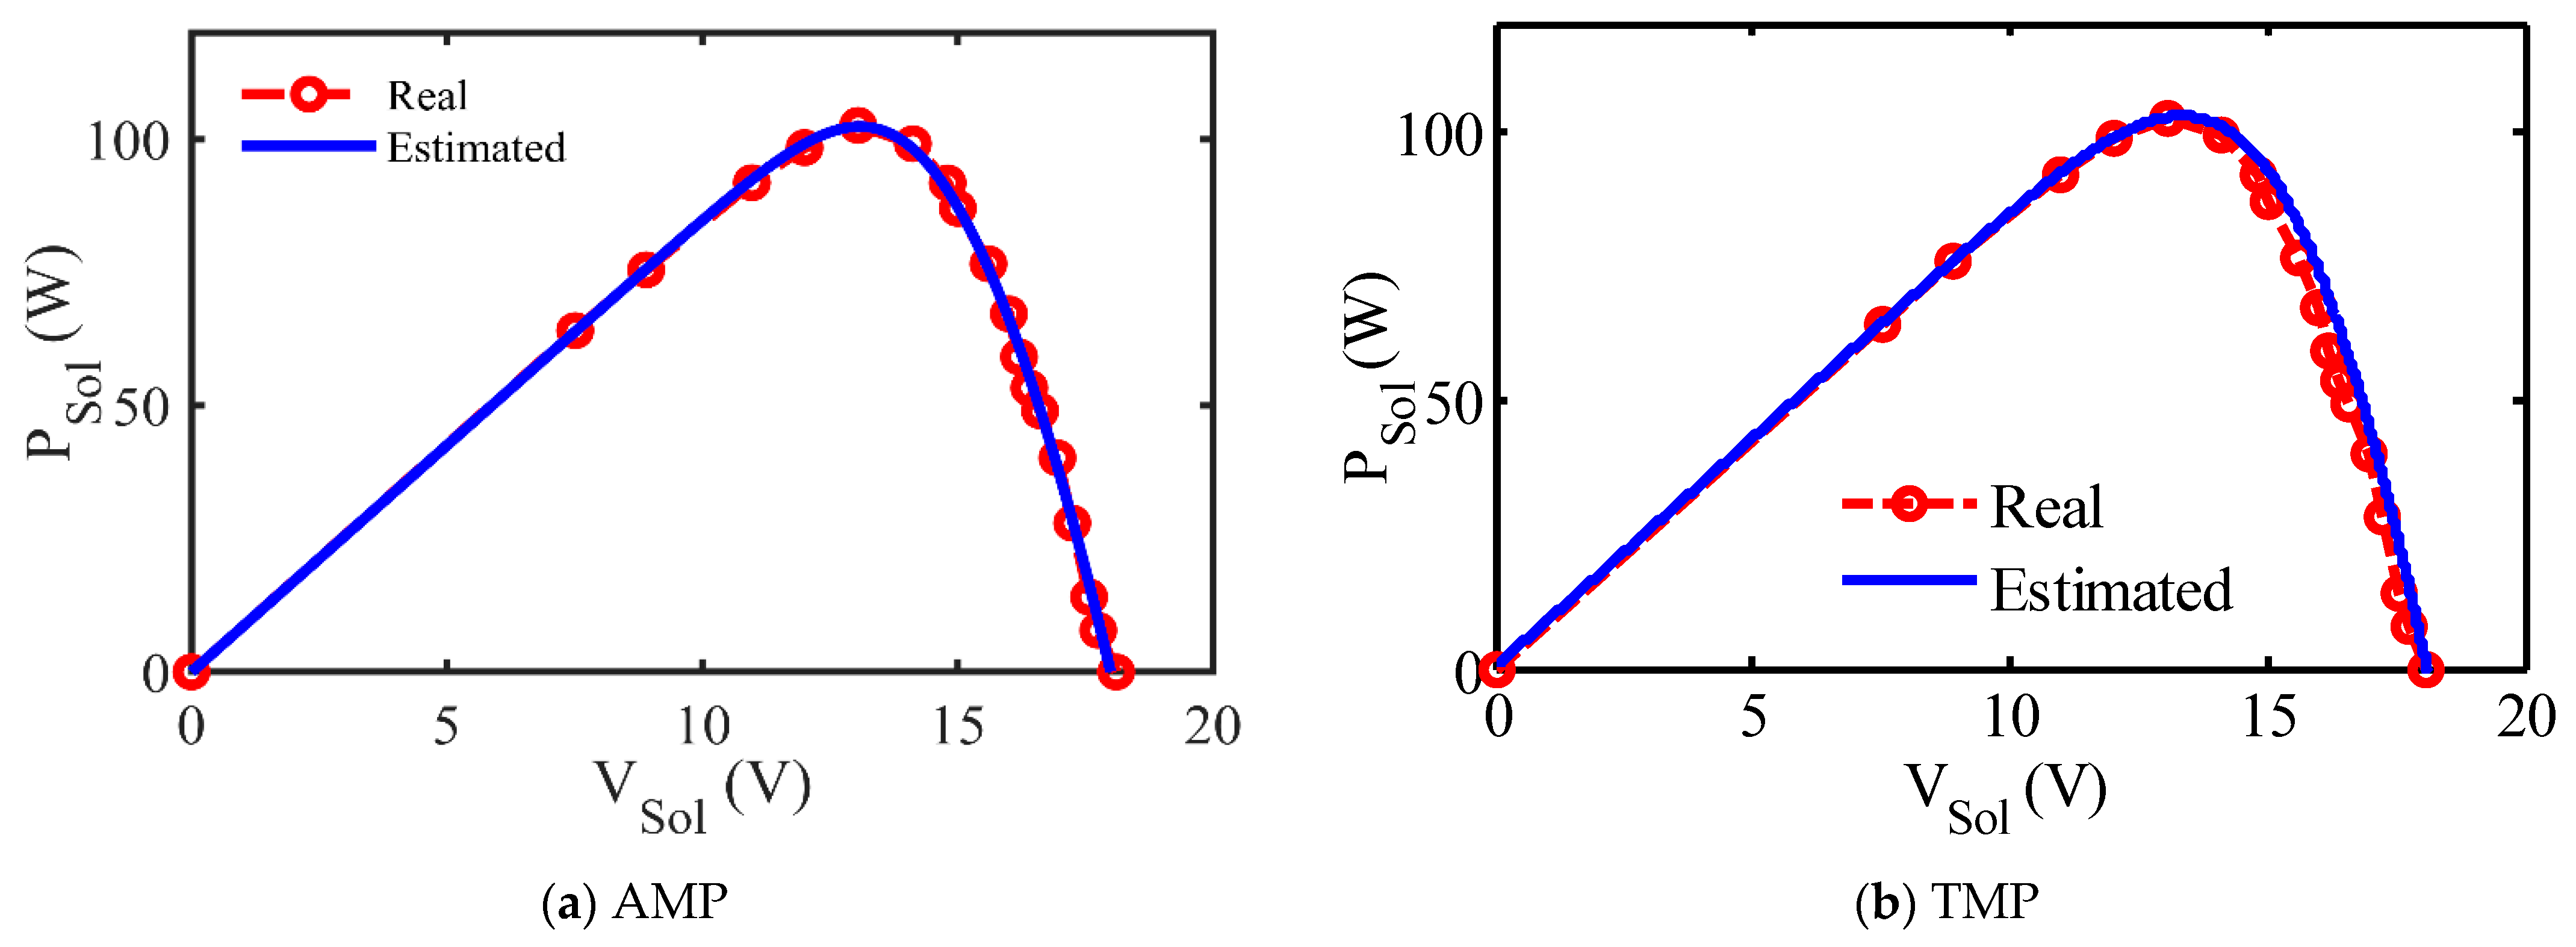
In the same manner, the P/V plots are displayed in Figure 8a and Figure 9a for KC200GT and P-120 modules using AMP, correspondingly, while Figure 8b and Figure 9b display the P/V plots using TMP. Once more, well-coinciding amongst 3-DM along with the analogous measured values is recognized when using AMP more than that when using TMP. Operational measures are prepared through parametric tests to attest the dynamism of the BMOA results using AMP.
Table 8 abridges the BMOA procedures along 100 autonomous runs and associated pointers, namely best, mean, worst, and standard deviation (SD) of RMSE values. It can be said that the lesser SDs affirm the dynamism of the cropped results and manifest the delicate choice of adjusted BMOA factors.
After comparing BMOA with other optimizers to identify the nine UPs of the 3-DM of SGSs, the 3-DM of SGSs needs to be proven to have the most precise modeling of the losses by comparing it with the 1- and 2-DMs of KC200GT, as written in Table 9. Comparisons between the 1-, 2-, and 3-DMs of SGSs dependent on the results show that the obtained RMSEs using BMOA via the 3-DM have the lowest value, namely 1.441 × 10⁻² which is less than that which resulted from the 1- and 2-DMs by 85.93% and 88.46%, respectively.

7. Validations at Different Solar Irradiances and Temperatures

The I/V and P/V plots of the P-120 SGS module need to be measured at various irradiances and temperatures to show that the extracted Ups of the 3-DM of SGSs using BMOA at RAC are functioning efficiently at various conditions. In Figure 10, G is 1000 W/m2, 800 W/m2, and 600 W/m2, while T has a constant value of 25 °C. It is seen that the irradiance augmentation leads to an increase in the produced current and power of SGS.
Subsequently, the influence of temperature variation is displayed in Figure 11, where T is 40 °C and 25 °C, (while G has a constant value of 1000 W/m2). It is apparent that the rise in temperature causes a reduction in the produced voltage and power of the SGS module.

8. Conclusions

In this research, the innovative employment of a newly designed BMOA approach was executed to extract the UPs of the 3-DM of SGSs. The purpose is the development of an efficacious model of the SGSs that provides accurate simulation and modeling during various conditions. The FF is to minimize the root of the mean-squared errors amongst the analogous measured and computed electric-current values of SGS succumbed to constraints, which are identified though the low and high bounds of parameters. Appraisal of the suggested model’s effectiveness has been carried out by comparing its estimated results with the experimental results of two commercial SGSs. The first SGS is obtained from the literature for comparisons, while the second SGS is experimentally set up. The estimated results are consistent with the experimental results in whole case studies. Moreover, comparisons amongst the BMOA-obtained results and other optimizers’ results have been conducted. The RMSEs that resulted from BMOA are lower than those which resulted from other optimizers by 11.18% to 87.73% using AMP and by 99.91% to 99.99% using TMP. Thus, the results display a high rivalry of the BMOA to other approaches in the literature and evidence its applicability. Finally, the 3-DM of SGSs has been proven to have the most precise modeling of the losses by comparing it with the 1- and 2-DMs, where the obtained RMSEs using BMOA via 3-DM are lower than those which resulted from the 1- and 2-DMs by 85.93% and 88.46%, respectively.

Author Contributions

Conceptualization, A.M.A.; Data curation, S.K.E. and E.E.E.; Validation, S.K.E. and E.E.E.; Formal analysis, A.M.A.; Funding acquisition, E.E.E.; Investigation, A.M.A.; Methodology, A.M.A.; Project administration, A.M.A.; Resources, S.K.E. and E.E.E.; Software, A.M.A.; Visualization, S.K.E.; Writing—original draft, A.M.A. and S.K.E.; Writing—review & editing, E.E.E. All authors have read and agreed to the published version of the manuscript.

Funding

This work was supported by Taif University Researchers Supporting Project number (TURSP-2020/86), Taif University, Taif, Saudi Arabia.

Data Availability Statement

Not applicable.

Acknowledgments

The authors would like to acknowledge the financial support received from Taif University Researchers Supporting Project Number (TURSP-2020/86), Taif University, Taif, Saudi Arabia.

Conflicts of Interest

The authors declare no conflict of interest.

References

  1. Yousri, D.; Allam, D.; Eteiba, M.; Suganthan, P.N. Static and dynamic photovoltaic models’ parameters identification using Chaotic Heterogeneous Comprehensive Learning Particle Swarm Optimizer variants. Energy Convers. Manag. 2019, 182, 546–563. [Google Scholar] [CrossRef]
  2. Al Tarabsheh, A.; Akmal, M.; Ghazal, M. Series Connected Photovoltaic Cells—Modelling and Analysis. Sustainability 2017, 9, 371. [Google Scholar] [CrossRef]
  3. Yang, W.; Prabhakar, R.R.; Tan, J.; Tilley, S.D.; Moon, J. Strategies for enhancing the photocurrent, photovoltage, and stability of photoelectrodes for photoelectrochemical water splitting. Chem. Soc. Rev. 2019, 48, 4979–5015. [Google Scholar] [CrossRef] [PubMed]
  4. Sun, X.; Khan, M.R.; Hanna, A.; Hussain, M.M.; Alam, M.A. The Potential of Bifacial Photovoltaics: A Global Perspective. In Proceedings of the 2017 IEEE 44th Photovoltaic Specialist Conference (PVSC), Washington, DC, USA, 25–30 June 2017; pp. 1055–1057. [Google Scholar] [CrossRef]
  5. Qais, M.H.; Hasanien, H.M.; Alghuwainem, S. Identification of electrical parameters for three-diode photovoltaic model using analytical and sunflower optimization algorithm. Appl. Energy 2019, 250, 109–117. [Google Scholar] [CrossRef]
  6. Nunes, H.; Pombo, J.; Bento, P.; Mariano, S.; Calado, M. Collaborative swarm intelligence to estimate PV parameters. Energy Convers. Manag. 2019, 185, 866–890. [Google Scholar] [CrossRef]
  7. Nunes, H.; Pombo, J.; Mariano, S.; Calado, M.; de Souza, J.F. A new high performance method for determining the parameters of PV cells and modules based on guaranteed convergence particle swarm optimization. Appl. Energy 2018, 211, 774–791. [Google Scholar] [CrossRef]
  8. Jordehi, A.R. Time varying acceleration coefficients particle swarm optimisation (TVACPSO): A new optimisation algorithm for estimating parameters of PV cells and modules. Energy Convers. Manag. 2016, 129, 262–274. [Google Scholar] [CrossRef]
  9. Ma, J.; Man, K.L.; Guan, S.-U.; Ting, T.O.; Wong, P.W.H. Parameter estimation of photovoltaic model via parallel particle swarm optimization algorithm. Int. J. Energy Res. 2016, 40, 343–352. [Google Scholar] [CrossRef]
  10. Liang, J.; Ge, S.; Qu, B.; Yu, K.; Liu, F.; Yang, H.; Wei, P.; Li, Z. Classified perturbation mutation based particle swarm optimization algorithm for parameters extraction of photovoltaic models. Energy Convers. Manag. 2020, 203, 112138. [Google Scholar] [CrossRef]
  11. Jiang, L.L.; Maskell, D.L.; Patra, J.C. Parameter estimation of solar cells and modules using an improved adaptive differential evolution algorithm. Appl. Energy 2013, 112, 185–193. [Google Scholar] [CrossRef]
  12. Chin, V.J.; Salam, Z. A New Three-point-based Approach for the Parameter Extraction of Photovoltaic Cells. Appl. Energy 2019, 237, 519–533. [Google Scholar] [CrossRef]
  13. Yang, X.; Gong, W.; Wang, L. Comparative study on parameter extraction of photovoltaic models via differential evolution. Energy Convers. Manag. 2019, 201, 112113. [Google Scholar] [CrossRef]
  14. Li, S.; Gu, Q.; Gong, W.; Ning, B. An enhanced adaptive differential evolution algorithm for parameter extraction of photovoltaic models. Energy Convers. Manag. 2020, 205, 112443. [Google Scholar] [CrossRef]
  15. Agwa, A.M.; El-Fergany, A.A.; Maksoud, H.A. Electrical characterization of photovoltaic modules using farmland fertility optimizer. Energy Convers. Manag. 2020, 217, 112990. [Google Scholar] [CrossRef]
  16. Harrou, F.; Dairi, A.; Taghezouit, B.; Sun, Y. An unsupervised monitoring procedure for detecting anomalies in photovoltaic systems using a one-class Support Vector Machine. Sol. Energy 2019, 179, 48–58. [Google Scholar] [CrossRef]
  17. Chen, H.; Jiao, S.; Heidari, A.A.; Wang, M.; Chen, X.; Zhao, X. An opposition-based sine cosine approach with local search for parameter estimation of photovoltaic models. Energy Convers. Manag. 2019, 195, 927–942. [Google Scholar] [CrossRef]
  18. Chen, X.; Yu, K. Hybridizing cuckoo search algorithm with biogeography-based optimization for estimating photovoltaic model parameters. Sol. Energy 2019, 180, 192–206. [Google Scholar] [CrossRef]
  19. Kang, T.; Yao, J.; Jin, M.; Yang, S.; Duong, T. A Novel Improved Cuckoo Search Algorithm for Parameter Estimation of Photovoltaic (PV) Models. Energies 2018, 11, 1060. [Google Scholar] [CrossRef]
  20. Zhang, Y.; Jin, Z.; Zhao, X.; Yang, Q. Backtracking search algorithm with Lévy flight for estimating parameters of photovoltaic models. Energy Convers. Manag. 2020, 208, 112615. [Google Scholar] [CrossRef]
  21. Fathy, A.; Rezk, H. Parameter estimation of photovoltaic system using imperialist competitive algorithm. Renew. Energy 2017, 111, 307–320. [Google Scholar] [CrossRef]
  22. Ayang, A.; Wamkeue, R.; Ouhrouche, M.; Djongyang, N.; Salomé, N.E.; Pombe, J.K.; Ekemb, G. Maximum likelihood parameters estimation of single-diode model of photovoltaic generator. Renew. Energy 2019, 130, 111–121. [Google Scholar] [CrossRef]
  23. Muhammad, F.F.; Sangawi, A.W.K.; Hashim, S.; Ghoshal, S.K.; Abdullah, I.K.; Hameed, S.S. Simple and efficient estimation of photovoltaic cells and modules parameters using approximation and correction technique. PLoS ONE 2019, 14, e0216201. [Google Scholar] [CrossRef] [PubMed]
  24. Yu, K.; Qu, B.; Yue, C.; Ge, S.; Chen, X.; Liang, J. A performance-guided JAYA algorithm for parameters identification of photovoltaic cell and module. Appl. Energy 2019, 237, 241–257. [Google Scholar] [CrossRef]
  25. Kler, D.; Goswami, Y.; Rana, K.; Kumar, V. A novel approach to parameter estimation of photovoltaic systems using hybridized optimizer. Energy Convers. Manag. 2019, 187, 486–511. [Google Scholar] [CrossRef]
  26. Blaifi, S.-A.; Moulahoum, S.; Taghezouit, B.; Saim, A. An enhanced dynamic modeling of PV module using Levenberg-Marquardt algorithm. Renew. Energy 2019, 135, 745–760. [Google Scholar] [CrossRef]
  27. Gouda, E.A.; Kotb, M.F.; Ghoneim, S.S.M.; Al-Harthi, M.M.; El-Fergany, A.A. Performance Assessment of Solar Generating Units Based on Coot Bird Metaheuristic Optimizer. IEEE Access 2021, 9, 111616–111632. [Google Scholar] [CrossRef]
  28. Sallam, K.M.; Hossain, A.; Chakrabortty, R.K.; Ryan, M.J. An improved gaining-sharing knowledge algorithm for parameter extraction of photovoltaic models. Energy Convers. Manag. 2021, 237, 114030. [Google Scholar] [CrossRef]
  29. Gnetchejo, P.J.; Essiane, S.N.; Dadjé, A.; Ele, P. A combination of Newton-Raphson method and heuristics algorithms for parameter estimation in photovoltaic modules. Heliyon 2021, 7, e06673. [Google Scholar] [CrossRef]
  30. Ginidi, A.; Ghoneim, S.M.; Elsayed, A.; El-Sehiemy, R.; Shaheen, A.; El-Fergany, A. Gorilla Troops Optimizer for Electrically Based Single and Double-Diode Models of Solar Photovoltaic Systems. Sustainability 2021, 13, 9459. [Google Scholar] [CrossRef]
  31. Xavier, F.J.; Pradeep, A.; Premkumar, M.; Kumar, C. Orthogonal learning-based Gray Wolf Optimizer for identifying the uncertain parameters of various photovoltaic models. Optik 2021, 247, 167973. [Google Scholar] [CrossRef]
  32. El-Hameed, M.A.; Elkholy, M.M.; El-Fergany, A.A. Three-diode model for characterization of industrial solar generating units using Manta-rays foraging optimizer: Analysis and validations. Energy Convers. Manag. 2020, 219, 113048. [Google Scholar] [CrossRef]
  33. Qais, M.H.; Hasanien, H.M.; Alghuwainem, S. Parameters extraction of three-diode photovoltaic model using computation and Harris Hawks optimization. Energy 2020, 195, 117040. [Google Scholar] [CrossRef]
  34. Elazab, O.S.; Hasanien, H.M.; Alsaidan, I.; Abdelaziz, A.Y.; Muyeen, S.M. Parameter Estimation of Three Diode Photovoltaic Model Using Grasshopper Optimization Algorithm. Energies 2020, 13, 497. [Google Scholar] [CrossRef]
  35. Qais, M.; Hasanien, H.M.; Alghuwainem, S.; Nouh, A.S. Coyote optimization algorithm for parameters extraction of three-diode photovoltaic models of photovoltaic modules. Energy 2019, 178, 116001. [Google Scholar] [CrossRef]
  36. Elazab, O.S.; Hasanien, H.M.; Elgendy, M.A.; Abdeen, A.M. Parameters estimation of single- and multiple-diode photovoltaic model using whale optimisation algorithm. IET Renew. Power Gener. 2018, 12, 1755–1761. [Google Scholar] [CrossRef]
  37. Soliman, M.A.; Hasanien, H.M.; Alkuhayli, A. Marine Predators Algorithm for Parameters Identification of Triple-Diode Photovoltaic Models. IEEE Access 2020, 8, 155832–155842. [Google Scholar] [CrossRef]
  38. Selem, S.I.; El-Fergany, A.A.; Hasanien, H.M. Artificial electric field algorithm to extract nine parameters of triple-diode photovoltaic model. Int. J. Energy Res. 2020, 45, 590–604. [Google Scholar] [CrossRef]
  39. Wolpert, D.H.; Macready, W.G. No free lunch theorems for optimization. IEEE Trans. Evol. Comput. 1997, 1, 67–82. [Google Scholar] [CrossRef]
  40. Fava, L.P.; Furtado, J.C.; Helfer, G.A.; Barbosa, J.L.V.; Beko, M.; Correia, S.D.; Leithardt, V.R.Q. A Multi-Start Algorithm for Solving the Capacitated Vehicle Routing Problem with Two-Dimensional Loading Constraints. Symmetry 2021, 13, 1697. [Google Scholar] [CrossRef]
  41. Yenchamchalit, K.; Kongjeen, Y.; Prabpal, P.; Bhumkittipich, K. Optimal Placement of Distributed Photovoltaic Systems and Electric Vehicle Charging Stations Using Metaheuristic Optimization Techniques. Symmetry 2021, 13, 2378. [Google Scholar] [CrossRef]
  42. Bolboacǎ, S.D.; Roşca, D.; Jäntschi, L. Structure-Activity Relationships from Natural Evolution. Match 2014, 71, 149–172. [Google Scholar]
  43. Lin, Z.; Cao, Y.; Liu, H.; Li, J.; Zhao, S. Research on Optimization of Urban Public Transport Network Based on Complex Network Theory. Symmetry 2021, 13, 2436. [Google Scholar] [CrossRef]
  44. Sulaiman, M.H.; Mustaffa, Z.; Saari, M.M.; Daniyal, H. Barnacles Mating Optimizer: A new bio-inspired algorithm for solving engineering optimization problems. Eng. Appl. Artif. Intell. 2020, 87, 103330. [Google Scholar] [CrossRef]
  45. Sulaiman, M.H.; Mustaffa, Z.; Aliman, O. An Application of Barnacles Mating Optimizer for Solving Economic Dispatch Problems. In Proceedings of the 2019 IEEE Jordan International Joint Conference on Electrical Engineering and Information Technology (JEEIT), Amman, Jordan, 9–11 April 2019; pp. 835–839. [Google Scholar] [CrossRef]
  46. Ghani, F.; Rosengarten, G.; Duke, M.; Carson, J. The numerical calculation of single-diode solar-cell modelling parameters. Renew. Energy 2014, 72, 105–112. [Google Scholar] [CrossRef]
  47. Laudani, A.; Fulginei, F.R.; Salvini, A. High performing extraction procedure for the one-diode model of a photovoltaic panel from experimental I–V curves by using reduced forms. Sol. Energy 2014, 103, 316–326. [Google Scholar] [CrossRef]
  48. Yahya-Khotbehsara, A.; Shahhoseini, A. A fast modeling of the double-diode model for PV modules using combined analytical and numerical approach. Sol. Energy 2018, 162, 403–409. [Google Scholar] [CrossRef]
  49. Al-Rashidi, M.R.; El-Naggar, K.M.; Al-Hajri, M.F. Heuristic Approach for Estimating the Solar Cell Parameters. In Proceedings of the 5th WSEAS World Congress on Applied Computing Conference (ACC ’12), Faro, Portugal, 2–4 May 2012; pp. 80–83. [Google Scholar]
  50. Carrero, C.; Ramírez, D.; Rodríguez, J.; Platero, C. Accurate and fast convergence method for parameter estimation of PV generators based on three main points of the I–V curve. Renew. Energy 2011, 36, 2972–2977. [Google Scholar] [CrossRef]
  51. Masters, G.M. Renewable and Efficient Electric Power Systems, 2nd ed.; John Wiley & Sons, Inc.: Hoboken, NJ, USA, 2013. [Google Scholar]
  52. Barazandeh, M.; Davis, C.; Neufeld, C.; Coltman, D.; Palmer, A.R. Something Darwin didn’t know about barnacles: Spermcast mating in a common stalked species. Proc. R. Soc. B Boil. Sci. 2013, 280, 20122919. [Google Scholar] [CrossRef] [PubMed]
  53. Sulaiman, M.H.; Mustaffa, Z.; Saari, M.M.; Mohamad, A.J. Barnacles Mating Optimizer for Loss Minimization of Optimal Reactive Power Dispatch. Prz. Elektrotechniczny 2022, 98, 59–63. [Google Scholar] [CrossRef]
  54. Sulaiman, M.H.; Mustaffa, Z.; Saar, M.M. Using the Barnacles Mating Optimizer for Economic Emission Load Dispatch Problems. Prz. Elektrotechniczny 2020, 96, 141–144. [Google Scholar] [CrossRef]
  55. Available online: https://drive.google.com/file/d/1OfV_lIWee97Gc2xVz1BGqSS7jHeQHCLd/view (accessed on 7 August 2021).
  56. ETAP Powering Success, “ETAP Ver. 18.00”. Available online: http://www.ETAP.com/ (accessed on 4 September 2021).
  57. Copex P-120, Module. Available online: https://www.enfsolar.com/pv/panel-datasheet/crystalline/32879 (accessed on 10 September 2021).
  58. Faramarzi, A.; Heidarinejad, M.; Stephens, B.; Mirjalili, S. Equilibrium optimizer: A novel optimization algorithm. Knowl.-Based Syst. 2019, 191, 105190. [Google Scholar] [CrossRef]
  59. Civicioglu, P. Transforming geocentric cartesian coordinates to geodetic coordinates by using differential search algorithm. Comput. Geosci. 2012, 46, 229–247. [Google Scholar] [CrossRef]
  60. Rizk-Allah, R.M.; El-Fergany, A.A. Conscious neighborhood scheme-based Laplacian barnacles mating algorithm for parameters optimization of photovoltaic single- and double-diode models. Energy Convers. Manag. 2020, 226, 113522. [Google Scholar] [CrossRef]
Figure 2. Flowchart of the BMOA for 3-DM of SGS.
Symmetry 14 01569 g002
Figure 3. Experimental setup of P-120 SGS module.
Symmetry 14 01569 g003
Figure 4. RMSEs’ convergence for KC200GT.
Symmetry 14 01569 g004
Figure 5. RMSEs’ convergence for P-120.
Symmetry 14 01569 g005
Figure 6. I/V plots of KC200Gtwith AMP and TMP using BMOA against actual measurements.
Symmetry 14 01569 g006
Figure 7. I/V plots of P-120 with AMP and TMP using BMOA against actual measurements.
Symmetry 14 01569 g007
Figure 8. P/V plots of KC200GT with AMP and TMP using BMOA against actual measurements.
Symmetry 14 01569 g008
Figure 9. P/V plots of P-120with AMP and TMP using BMOA against actual measurements.
Symmetry 14 01569 g009
Figure 10. Procedure characteristic of P-120 with 3-DM using BMOA at various irradiances.
Symmetry 14 01569 g010
Figure 11. Procedure characteristic of P-120 with 3-DM using BMOA at various temperatures.
Symmetry 14 01569 g011
Table 1. Electrical specifications of SGSs.
ModelKC200GT [56]P-120 [57]
Coefficient
P max   ( W ) 200120
V m - p   ( V ) 26.316.3
I m - p   ( A ) 7.617.37
V n - l   ( V ) 32.919.9
I s - c   ( A ) 8.217.96
N ce 5432
RFCT ( )4745
K i   ( % / ) 0.0003870.0006
K v   ( % / ) −0.003739−0.0035
Table 2. The bounds of SGS model parameters a cell.
ParameterLow BoundHigh Bound
I phot 0.9   I sc 1.1   I sc
I rs 1 - 3   ( μ A ) 0.00110
R sh   ( Ω ) 0500
  R s   ( Ω ) 00.5
M 1 12
M 2 1.22
M 3 1.42
Table 3. Equipment class and errors.
EquipmentClassError
PyranometerTES-13335%
PotentiometerLD-5373410%
Digital voltmeterPeakTech-33401.2%
Digital AmmeterPeakTech-33402.5%
Table 4. BMOA factors.
ModelKC200GTP-120
Parameter
po 3030
pl 2121
Table 5. RMSEs of 3-DM of KC200GT compared to other algorithms.
ApproachAMPTMP
itemaxRMSEs (A)BMOA Is Less byitemaxRMSEs (A)BMOA Is Less by
SFA [5]10003.1746 × 10−254.61%10001.23 × 10−1299.91%
MRFA [32]10,0002.2185 × 10−235.05%10,0007.0673 × 10−599.99%
GO [34]1000Not reportedNot reported10009.9775 × 10−1199.99%
CA [35]10008.6149 × 10−283.27%10003.357 × 10−1199.99%
WO [36]50011.74 × 10−287.73%5009.8488 × 10−899.99%
BMOA10001.441 × 10−210001.1471 × 10−15
Table 6. RMSEs of 3-DM of P-120 compared to other algorithms.
ApproachAMPTMP
itemaxRMSEs (A)BMOA Is Less byitemaxRMSEs (A)BMOA Is Less by
EO [51]100010.381 × 10−211.18%10004.87048 × 10−1099.99%
DSO [52] 100011.6317 × 10−220.73%10008.2725 × 10−599.99%
BMOA10009.22045 × 10−210003.55604 × 10−18
Table 7. Extracted UPs of the 3-DM of the SGSs.
ModelKC200GTP-120
Parameter
I phot   ( A ) 8.19968.5067
I rs 1   ( μ A ) 0.0010.0014
I rs 2   ( μ A ) 0.00160.0483
I rs 3   ( μ A ) 0.00370.0903
R sh   ( Ω ) 143.0839500
  R s   ( Ω ) 0.245390.0105
M 1 1.04751
M 2 1.96681.2
M 3 22
Table 8. RMSEs statistical results.
FactorKC200GTP-120
RMSE (Best)1.441 × 10−29.22045 × 10−2
RMSE (Mean)1.4783 × 10−29.54783 × 10−2
RMSE (Worst)1.5368 × 10−29.9369 × 10−2
RMSE (SD)2.8886 × 10−45.61615 × 10−4
Table 9. RMSEs using BMOA via 3-DM of KC200GT compared to 1- and 2-DMs.
ModelRMSEs (A)3-DM Is Less by
1-DM [60]10.244 × 10−285.93%
2-DM [60] 12.492 × 10−288.46%
3-DM1.441 × 10−2
Publisher’s Note: MDPI stays neutral with regard to jurisdictional claims in published maps and institutional affiliations.

