Abstract
The controller area network (CAN) bus has become one of the most commonly used protocols in automotive networks. Some potential attackers inject malicious data packets into the CAN bus through external interfaces for implementing illegal operations (intrusion). Anomaly detection is a technique for network intrusion detection which can detect malicious data packs by comparing the normal data packets with incoming data packets obtained from the network traffic. The data of a normal network is in a symmetric and stable state, which will become asymmetric when compromised. Considering the in-vehicle network, the CAN bus is symmetrically similar to the immune system in terms of internal network structure and external invasion threats. In this work, we use an intrusion detection method based on the dendritic cell algorithm (DCA). However, existing studies suggest the use of optimization methods to improve the accuracy of classification algorithms, and the current optimization of the parameters of the detection method mostly relies on the manual tuning of the parameters, which is a large workload. In view of the above challenges, this paper proposes a new detection algorithm based on the particle swarm optimization algorithm (PSO) and gravitational search algorithm (GSA) to improve the dendritic cell algorithm (PSO-GSA-DCA). PSO-GSA-DCA achieves adaptive parameter tuning and improves detection accuracy by mixing optimization algorithms and using them to optimize the dendritic cell algorithm classifier. Additionally, DCA-based CAN message attribute matching rules (measured by information gain and standard deviation of CAN data) are proposed for matching the three input signals (PAMP, DS, SS) of the DCA. The experimental results show that our proposed scheme has a significant improvement in accuracy, which can reach , and lower time loss compared with other correlation anomaly detection schemes. Our proposed method also enables adaptive tuning, which solves the problem that most models now rely on manual tuning.
1. Introduction
With the rapid development of big data, cloud computing, and mobile Internet technology, vehicles are gradually becoming more intelligent and network oriented [1]. The application of the CAN bus makes communication between vehicles more efficient. However, the CAN bus is designed with a lack of security functions thus making it susceptible to being attacked by various types such as tampering and replay [2]. In recent years, CAN networks have been subject to a series of attacks [3]. In 2015, the 360 company announced that they had achieved a crack of the remote control function and a millimeter-wave radar system on Tesla [4]. In 2017, the Keen Security Lab of Tencent implemented a remote attack on Tesla and eventually achieved unauthorized control of Tesla [5]. To prevent these potential attacks in vehicles [6], a variety of measures have been taken to establish security defenses such as encryption, authentication, anomaly detection system, and firewalls.
In anomaly detection technology research on the in-vehicle network, the CAN bus, has been widely used in recent years [7,8,9] such as physical characteristics [10], statistical approaches [11], feature-based intrusion detection technology [12], deep-learning [13], and so on. For the physical characteristics of the vehicle, legal ECU created a file containing signal and voltage signatures for comparing the traffic with the profiles of unusual traffic [14]. In [10], they built fingerprints based on the ECU periodic frequency which establishes the ECUs clock baseline through the recursive least squares algorithm (RLS). Their method was able to detect some attacks caused by frequency abnormality. Muter [15] and Asaj [16] proposed a statistical feature-based information entropy approach to design IDSs in three different attack scenarios. However, their method did not perform well for tampering attack detection.
Moreover, many machine learning techniques are also being investigated and widely used in anomaly detection technology for CAN networks. For example, Kang et al. [17] proposed an anomaly detection based on a deep neural network (DNN). The data packets exchanged between ECUs are trained to extract low-dimensional features that are used for classification, and this approach responded to attacks. In 2016, Taylor et al. [18] proposed an anomaly detection based on a recurrent neural network (RNN) to detect CAN bus attacks. This method works through learning and predicting the next data field which is transmitted on the CAN bus. Nevertheless, it can only detect exceptions for a single ID. In 2020, Hossain et al. [19] proposed an anomaly detection based on long short-term memory (LSTM) to detect and mitigate attacks on the CAN bus. The common problem of the aforementioned study is that it costs a lot of computation, which does not fit the CAN bus in a closed network with limited computing power, transmission bandwidth, and resources. Therefore, it is a very challenging work to study how to balance the security and high efficiency abnormally detection mechanism that can solve the problem of information security threats brought by external attacks in the resource-constrained vehicle interior network, which is also the significance of this paper and the core problem to be solved.
The human immune system (HIS) [20] is a self-organizing, robust, and fault-tolerant system. It can protect against bacterial invasion and regulates many bodily functions. The artificial immune system (AIS) is a computer system developed by drawing on the mechanisms and functions associated with cells in the human immune system. The AIS protects computer networks mainly by identifying self/non-self-mechanisms and intrusion [21]. Many artificial immune-based anomaly detection studies have also made some progress. For example, Igbe et al. [22] proposed an architecture for a distributed network intrusion detection system based on artificial immunity. In 2018, Vidal et al. [23] suggested an adaptive artificial immune network to mitigate DOS flooding attacks.
Through research and analysis, we have found that the HIS and in-vehicle network CAN bus share many symmetries in terms of system characteristics and safety such as the following: (1) there is a large number of ECU [24] nodes in an in-vehicle CAN network, the HIS is also a complex system that is subject to a myriad of cells acting together; (2) in terms of system characteristics, the in-vehicle CAN bus network is generally distributed, self-organizing and robust, which are also fundamental characteristics of the HIS; (3) in terms of security, the in-vehicle CAN bus is exposed to hacking and intrusion, while the HIS is exposed to threats such as bacteria and viruses, furthermore both the HIS and in-vehicle CAN bus networks need to maintain a relatively stable operating state in a constantly changing external environment. The similarities between the HIS, anomaly detection, and the in-vehicle CAN bus network are given in Table 1.

Table 1.
Similarities between HIS, Anomaly Detection, and In-Vehicle CAN bus.
Considering the above similarities, both will exhibit different levels of antibodies when an abnormal situation arises for protecting autologous security. At the same time, the method of immune systems can ensure high detection efficiency compared with deep learning. Therefore, this paper focus on the artificial immune algorithm for detecting the in-vehicle CAN bus anomaly instruction.
The immune algorithm is an information processing algorithm inspired by the principle of immunity, which mainly simulates the mechanisms and functions possessed by lymphocytes and antibodies in the human immune system, including antigen presentation, antibody production, immune regulation, and immune memory. Although there is no complete and universal theoretical system, classical immune algorithms have been widely used by domestic and international scholars, among which the more prominent ones are the negative selection algorithm proposed by Forrest [25] and the clonal selection algorithm proposed by Castrot [26], both representatives of the first generation immune algorithm, which are adaptive immune algorithms based on the autologous/non-autologous model.
The dendritic cell algorithm (DCA) [27] belongs to the second generation of artificial immune algorithms, which is designed according to the mechanism of the innate immune system, and get extensive usage in many fields, such as anomaly detection [28,29], vulnerability identification [30], earthquake magnitude prediction [31], big data classification [32], etc., among which the most widely applied is anomaly detection. Current research on the DCA and improved dendritic cell algorithm (IDCA) [33] has shown that the algorithm not only exhibits excellent detection accuracy but is also expected to help reduce the rate of misclassification and false alarms that occur in similar systems [34].
As far as the relevance of the DCA algorithm to the CAN bus is concerned, the intrusion detection of CAN data is performed for each CAN data attribute, and DCA correlates the antigen and the signal. Thus, it makes each CAN data represent an antigen and each attribute a signal of DCA. This indicates that CAN message attributes are more compatible with DCA.
With the above background, we propose an effective anomaly detection method for an in-vehicle CAN network based on enhanced DCA. The method focuses on the CAN bus data attributes used for intrusion detection. We use the particle swarm optimization algorithm (PSO) and gravitational search algorithm (GSA) to optimize the DCA classifier to improve its detection accuracy. In addition, since the input signal of DCA relies heavily on human experience, we design DCA-based CAN message attribute matching rules. In our experiments, we capture real vehicle datasets to validate the detection performance of our approach for various attacks. Our main contributions are as follows:
- In response to the unsatisfactory detection effect of the original DCA algorithm, we design an enhanced DCA algorithm based on particle swarm optimization (PSO) and the gravitational search algorithm (GSA) to improve the detection accuracy.
- We designed an intrusion detection model based on the enhanced DCA algorithm. The model consists of four layers: a data layer, signal selection layer, classification layer, and output layer.
- To address the problem that the input signal of the model signal selection layer is affected by the manual experience, a DCA-based CAN message attribute matching rule is proposed, which selects the most relevant features based on the information gain and standard deviation of CAN attributes to achieve adaptive signal selection.
2. The PSO-GSA-DCA Algorithm
2.1. Particle Swarm Optimization
Particle swarm optimization (PSO) is a population-based optimization method [35]. The basic idea of PSO is to imagine each optimization-seeking problem as a bird, called a “particle”. Each particle also has a velocity that determines the distance and direction of flight, which is dynamically adjusted according to its own flight experience and the flight experience of all particles in the population. Assuming that the search space is N and the sum of particles is n, the original PSO is described as follows:
where and denote the velocity and position of the ith particle at the tth iteration, respectively. and indicate the optimal position of the ith particle and the optimal position of the population, respectively. and are positive acceleration constants and denotes a random number between 0 and 1.
The modified PSO was originally proposed by Shi and Eberhart and changed velocity equation can be described by the following equation.
where is the inertia weight, the improved PSO is more efficient as the parameter is slowly decreasing. Shi and Eberhart adjust the inertia weights in a linear minimization step as follows:
where t indicates the current iteration value. T represents the maximum number of iterations. and denote the initial inertia weight and the final inertia weight, respectively.
2.2. Gravitational Search Algorithm
The gravitational search algorithm (GSA) is a heuristic optimization algorithm based on the law of gravity. In GSA, search agents accumulate masses, and agents are treated as objects whose performance is measured by their masses. The position of the masses corresponds to the solution of the problem and their gravitational and inertial masses are determined using the fitness function. The concept of GSA is explained in detail in a study by Rashedi et al. [36,37]
The gravitational force acting from agent j on agent i at a particular moment is defined as follows:
where denotes the passive gravitational mass associated with agent i and means the active gravitational mass associated with agent j. Represents the gravitational constant at moment t. and represent the position of the ith and jth agent in the search space d. is a very small constant and represents the Euclidean distance between agents i and j, defined as follows:
To provide the GSA algorithm with a stochastic characterization, it is assumed that the combined force acting on agent i in search space d is a random weighted summary of the forces exerted by the other agents.
where is a random number in the range .
Thus, according to Newton’s laws of motion, the acceleration of agent i at moment t along the direction of dth is:
where is the inertial mass of agent i.
Moreover, the agent’s next velocity is its current velocity plus a fraction of its acceleration, and its velocity and position are defined as follows:
This random number infuses randomized behavior into the search. At the onset, we initialize the gravity constant, G, which minimizes with time to control the accuracy of the search. G, which is a function of the initial value and time (t) is given by:
where is the diminishing coefficient, is the starting gravitational constant, and and are the current iteration and a maximum number of iterations respectively. A fitness assessment calculates gravity and inertial mass. The heavier the mass of an agent, the more efficient it is. This means that the best agents are more attractive and move more slowly.Because it is closest to the optimal solution, other agents will move closer to it to find the optimal solution, and the difference between it and the optimal solution is the lowest, and the value per move is smaller, i.e., attractive and slower moving.
Assuming gravity and inertial masses are equal, mass values are calculated using a fitness map. We update gravity and inertia masses by the equation:
where represents the fitness value of agent i at moment t, whereas:
- For minimization problems, and are defined as:
- For a maximization problem, and are defined as:
2.3. PSO-GSA-DCA
In population-based algorithms (e.g., PSO and GSA), two characteristics that must be considered are the ability of the algorithm to search space and the ability to develop optimal solutions. Although PSO exhibits a faster search speed, it is prone to local optimality early in the algorithm, leading to its lower search accuracy. On the other hand, GSA has a strong global search capability due to the slow movement of its agents. Therefore, combining PSO and GSA can provide better optimization results, and the combination of the two compensates for the inherent weaknesses of both algorithms. The proposed PSO-GSA method is described as follows:
where indicates agent i’s velocity at iteration t in d dimension, and are acceleration coefficients, is the inertial weight, is any random number within the interval , is agent i’s acceleration at iteration t in d dimension, and signifies the best solution obtained thus far around the global optimum solution.
From the above equation, we can see that the larger the value of velocity, the greater the particle flight speed; the smaller the velocity, the smaller the particle step size. The smaller the particle fitness value, the closer to the optimal solution, it is more necessary to reduce the value of velocity for local search, and the larger the fitness, the farther from the optimal solution, it is necessary to increase the value of velocity for global search. Although a larger weight factor is beneficial to jump out of local minima for global search, a smaller inertia factor is beneficial to perform an exact local search of the current search region for algorithm convergence. However, it being too large is likely to lead to premature convergence with the phenomenon of oscillation of the algorithm near the global optimal solution at a later stage. Therefore, we use the size of adaptive weight update, which is calculated as follows:
where and are the preset minimum and maximum inertia coefficients, is the fitness of the ith particle at the dth iteration, is the average fitness of all particles at the dth iteration, and is the minimum fitness of all particles at the dth iteration.
This paper attempts to enhance the diversity of the hybrid PSO-GSA algorithm by introducing a natural behavior of bird swarming into the algorithm, allowing it to explore a more comprehensive search space and avoid sub-optimal solutions being retained in the search space. The new position of the agent after each iteration is updated according to the following equation.
However, due to the rapid loss of diversity towards the later parts of the iteration, the algorithm has a high tendency of being trapped in a local optimum solution. To break free from the trap, we designed a new particle position update method to explore a wider area to avoid stagnation.
where is the new position after the overall response to . The new position can be found by calculating the average of the six nearest neighbor positions. The set holds the index of the six nearest neighbors of the particle .
The PSO-GSA algorithm obtained above is used to optimize the DCA algorithm, and the specific algorithm execution process is as follows. Initialize the population position x and velocity v within the allowable range of the migration threshold (MT) parameter of the DCA algorithm.
The DCA algorithm is used as the fitness evaluation function . The accuracy of the DCA algorithm detection is the fitness value of the population for population iteration, and the PSO-GSA optimization algorithm is executed and the DCA algorithm is executed internally.
In the late iteration of the population, its fitness value will converge to a stable value, which is the optimal migration threshold, and setting this value as the migration threshold of the DCA algorithm can improve the detection accuracy of the algorithm. Algorithm 1 outlines the process of PSO-GSA-DCA to obtain the optimal MT.
| Algorithm 1 PSO-GSA-DCA |
|
3. Intrusion Detection Model for In-Vehicle Bus Network
3.1. Overview
Our overall goal is to detect attacks on vehicles, or more precisely, to determine whether a vehicle is under attack by detecting anomalous sequences on the in-vehicle CAN bus. We propose an enhanced dendritic cell algorithm based on PSO-GSA and design the intrusion detection system IDS. the enhanced DCA-based intrusion detection model for in-vehicle CAN bus networks consists of four main layers of structure: a data layer, signal selection layer, classification layer, and output layer. The specific schematic diagram is shown in Figure 1.
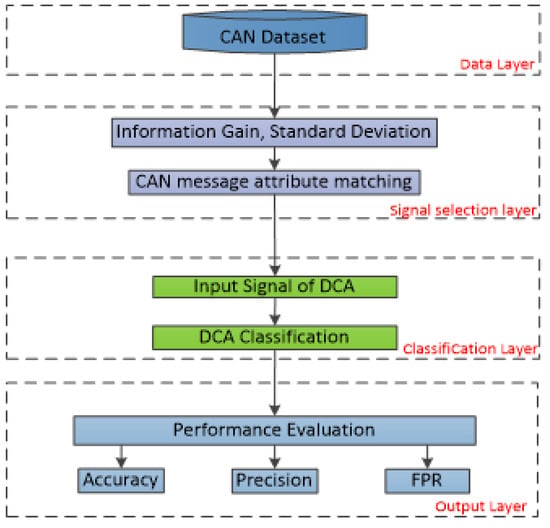
Figure 1.
Structure of the intrusion detection model.
3.2. Date Layer
The data layer mainly completes the collection of CAN bus data sets. The datasets used in the experiments were collected from the on-board CAN bus network of real cars, including attack-free data during normal driving of the car and attack datasets generated by injection attacks. To capture the CAN bus traffic in real time, we drove around the experiment building for about 2 h, connected the data collection device to the on-board diagnostic (OBD-II) port, and used an automotive bus simulation software (i.e., CAN Test) to monitor, store and inject abnormal messages from the on-board CAN network. This is shown in Figure 2.
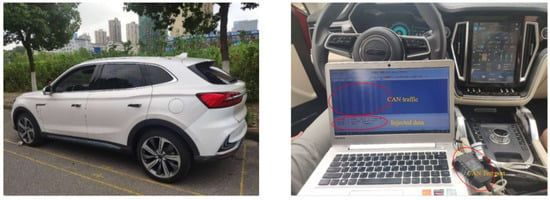
Figure 2.
Data acquisition setup with CAN Test software via the OBD-II port.
As shown in Figure 3, we inject three kinds of attacks: DoS attack, fuzzing attack, and replay attack. Each attack is defined as follows:
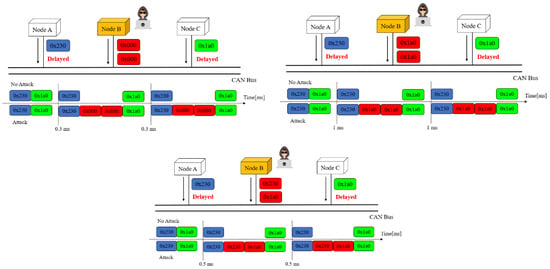
Figure 3.
Attack scenarios are assumed in this paper.
- DoS attack: Several high-priority CAN IDs (e.g., 0x000 CAN ID) are injected. We inject 0x000 CAN ID messages every 0.3 ms.
- Replay attack: Repeated already received CAN messages are transmitted to the target ECU in a short period. We inject CAN ID and CAN data messages every 1 ms.
- Fuzzy attack: Spoofed random CAN IDs and data values are injected into the CAN traffic. We injected CAN messages representing handbrake, steering, etc. into the messages with a period of 0.5 ms.
Table 2 shows the CAN bus dataset consisting of the training set and the test set. The “CAN messages” represent the total number of CAN packets. “Attack messages” indicate the number of packets containing at least one abnormal CAN data. The various types of data sets are independent of each other and are not of multiple classes. We allocate of the packet to the training data and the remaining to the test data to avoid overfitting problems during the training process.

Table 2.
Data type and size.
3.3. Signal Selection Layer
The task of matching CAN message attributes with the input signals of the DCA algorithm is accomplished in this layer. To address the problem that the input signal in the signal selection layer relies heavily on manual experience, we design an enhanced DCA-based attribute matching rule for in-vehicle CAN messages to achieve adaptive signal selection, i.e., by calculating the information gain and standard deviation of CAN messages, we select the attributes among them that are important and contribute significantly to anomaly detection to be assigned to the DCA input signal. For the on-board CAN bus, the antigen is each message of the CAN bus, and the DCA input signal is the attribute value corresponding to the CAN message.
The standard data frame of the CAN bus contains attributes such as time stamp, CAN channel, CAN ID, data length code (DLC), data field, etc. Figure 4 shows the standard data frame attributes of a CAN bus message.
Figure 4.
CAN message standard data frame properties.
For CAN bus data frames, the data field is the core content of the entire CAN data frame. This field represents the original information that needs to be sent by the ECU node, and a data field contains from 0 to 8 bytes of data. Figure 5 reflects the byte order and the bit order when the information is sent.

Figure 5.
CAN message text section sequence.
For the DCA algorithm, the more attributes available can filter the solution that better matches the input signal of the algorithm, so the attribute division of the CAN bus message data field is mainly the following method: we divide the 8 bytes of the data field attribute into 8 attributes and calculate the information gain and standard deviation together with the original attribute.
The proportion of the class samples in the current training sample set D is , , and the entropy of D for binary classification is referred to as the information entropy , then the information entropy of D is defined as:
Attribute in set D with information entropy , then the information entropy of attribute A included in the set of training samples D is defined as:
Information gain for A can be calculated as:
Standard deviation (SD) mainly characterizes the deviation of various types of data from the mean; the larger the SD, the larger the deviation of the data from the mean, and it is an important indicator of the degree of dispersion of a data set. Its calculation formula is
where denotes the mean value of employed.
We first calculate the information gain of each attribute of the CAN bus data and remove the attributes with low information gain from the dataset and extract the attributes with high information gain. Then we design matching rules to assign the extracted CAN message attributes to the three input signals of the DCA algorithm. Table 3 lists the information gained from each attribute of the message.

Table 3.
CAN message information gain for each attribute.
As can be seen from Table 3, the information gain of the timestamp attribute is small and the difference with other attributes is relatively obvious. Since the channel attribute takes only one value and does not have classification characteristics, these attributes cannot be used as the judgment basis for anomaly detection.
The standard deviations were found for each of the 10 attributes filtered by calculating the information gain, and Table 4 shows the standard deviations of the 10 attributes.

Table 4.
CAN message standard deviation for each attribute.
The information gain of an attribute related to a CAN bus message indicates the statistical relevance of the attribute in terms of classification. The higher the information gain of a CAN message attribute, the more classification characteristics the message attribute can provide. The smaller the standard deviation, the more stable and reliable the data are. Therefore, we design the signal matching rules based on the information gain and standard deviation.
In the DCA algorithm, since the PAMP indicates abnormal data and the SS signal indicates normal data, both signals embody deterministic behavior, while the DS signal indicates possible abnormal data, which represents a high degree of data dispersion. Therefore, the CAN bus data attributes with high information gain and relatively small standard deviation are chosen to be suitable for matching with the PAMP and SS input signals. The remaining attributes are matched with the DS signal. Finally, the matching of the on-board CAN message attributes with the DCA algorithm input signal is realized. The properties of its matching rules are specifically assigned as follows:
- PAMP: CAN ID, DLC;
- SS: CAN ID, DLC;
- DS: Date0, Date1, Date2, Date3, Date4, Date5.
A total of 25 types of CAN ID data messages are collected in our dataset, each type of message has a different identifier ID, so the 25 types of IDs are numbered to make them numerical. Each byte in the DATA field is a hexadecimal number, which is first converted to decimal and then normalized to a range of 0 to 100 using the normalization function together with other attributes; Equation (28) defines the normalized linear function.
3.4. Classification Layer
The classification layer mainly accomplishes the work of abnormal data detection. Using the designed matching rules to match the data of the dataset with the input signal of the enhanced DCA algorithm, the DCA algorithm is executed, and finally, the data are judged to be abnormal according to the output.
DCA is an abnormality detection algorithm that generates output signals by fusing input signals, then determines the status of DCs based on the output signals, and finally evaluates the abnormality of antigens based on the status of DCs. The input signals include pathogen-associated molecular patterns (PAMP), danger signals (DS), and safe signals (SS). The output signals include the co-stimulatory molecules (CSM), the semi-mature signal (sDC), and the mature signal (mDC). CSM is primarily used to determine whether the DC has reached the state transition condition, sDC indicates that the antigenic environment is safe, and mDC indicates that the antigenic environment is dangerous. The abstract model of DC signal processing is shown in Figure 6.
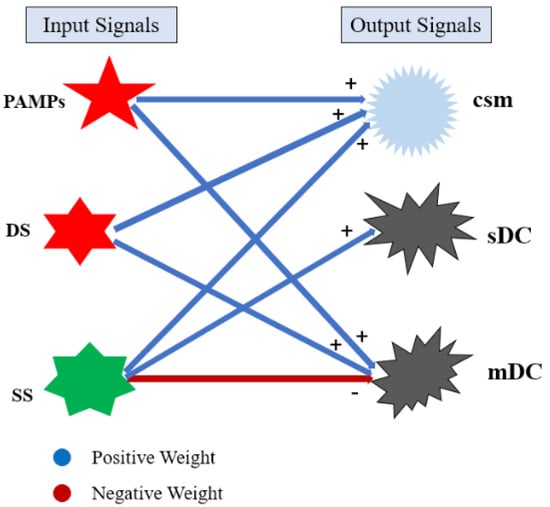
Figure 6.
Abstract model of DC signal processing.
From Figure 6, it can be seen that the inter-influence relationship between the input and output signals satisfies: PAMPs affect CSM, mDC; DS affects CSM, mDC; SS affects CSM, sDC, and mDC, where SS harms mDC. The degree of influence between the input and output signals is converted into the inter-signal weights, there are three main signal weight matrices available, as shown in Table 5.

Table 5.
Signal Weight Matrix.
For signal fusion processing, mainly through the signal weight matrix described above and using the weighted summation formula, the signal processing formula can be expressed by Equation (29).
Among them, represents the output, to indicates the three output signals: CSM, sDC, and mDC; means the input signals, which are PAMP, DS, and SS, respectively, and is the weight from to .
The output signals csm, sDC, and mDC are obtained by fusing the input signals using the weight matrix. If the CSM reaches the migration threshold (MT) which is set, the and will be compared, otherwise, the signal acquisition will continue. If , the DC is converted to a semi-mature state, indicating that the antigen is in a normal state when the antigen environment value is 0. Otherwise, the DC is converted to a mature state, indicating that the antigen is abnormal, with the antigen environment value of 1.
The comprehensive evaluation of the antigen is mainly based on the number of semi-mature DCs and mature DCs ultimately converted, then generates the abnormality degree evaluation index, i.e., mature context antigen value (MCAV), which indicates the proportion of the number of times the antigen was presented as semi-mature DCs to the total number of times it was presented.
where is the number of antigens converted to mDC, and is the conversion to sDC. MCAV is a range between 0 and 1, and the closer it is to 1, the more probability that the antigen is abnormal.
In the comprehensive evaluation module, we set an abnormality threshold, and by comparing the MCAV value of each antigen with the abnormality threshold, it gives a detection result of whether the antigen is abnormal or not. If the MCAV is greater than the abnormality threshold, the antigen is judged to be abnormal. In classical DCA, the abnormality threshold is a user-defined setting. However, in practice, it is impossible to set up several different abnormality thresholds for the same detection criteria, there is some relationship between the abnormality thresholds and the number of detected abnormal data. Therefore, we give a method to generate the abnormality threshold automatically according to the dataset.
where indicates the number of abnormal data in the CAN dataset and denotes the total amount of datasets used for training. Algorithm 2 outlines the DCA detection algorithm based on CAN bus messages.
| Algorithm 2 The DCA detection algorithm based on In-Vehicle CAN bus. |
|
4. Experiments and Results
Three indicators were employed to evaluate the performance of the scheme: , , and , as illustrated by the following equations.
For the operating state the car is in, indicates that previously normal vehicles were incorrectly detected as being under attack; denotes that the attack was successfully detected; represents that the vehicle was under attack without being detected; means that the vehicle is in normal condition but the detection result still indicates that the vehicle is normal.
In order to select the most suitable transformation weight matrix for the DCA input and output signals, we analyzed the influence of different weight matrices on the performance of the algorithm, and the DCA algorithms with three different weight matrices were optimized with PSO-GSA respectively. This is shown in Figure 7 below.
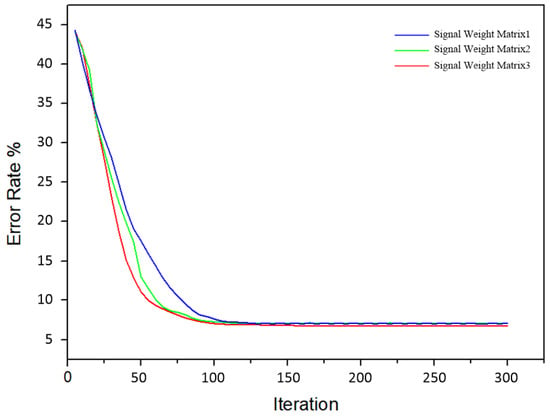
Figure 7.
Iterative trends of populations with different weight matrices.
Figure 7 shows the variation of error rate with PSO-GSA algorithm population iteration for three DCA algorithms with different weight matrices. Where the horizontal coordinate is the number of iterations and the vertical coordinate represents the error rate. From the experiments, it can be seen that the population iterates to 100 generations when all three schemes find the optimal solution and tend to stabilize the value at the later stage. The PSO-GSA-DCA detection algorithm based on weight matrix three is the most efficient and has the lowest error rate, and the detection error rates of the detection models based on weight matrix two and weight matrix three differ less but neither has a better performance than weight matrix three, so weight matrix three is used as the influence weight value of the input and output signals of the PSO-GSA-DCA intrusion detection system.
It is well known that the detection performance of an intrusion detection system is the key to an intrusion detection system. To check the detection performance of the IDS model for different types of attacks, we tested our proposed IDS model using three types of CAN bus packets including a DoS attack, fuzzy attack, and replay attack. This is shown in Figure 8 below.
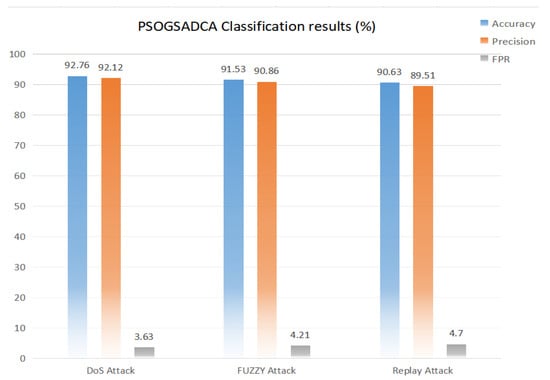
Figure 8.
Detection result for various types of attacks.
From Figure 8, we can see that PSO-GSA-DCA-IDS has good detection accuracy for several types of attacks. The detection accuracy of DoS attacks can be close to , and the detection accuracy of the other two types of attacks is no less than , indicating that the intrusion detection system model has good detection performance.
In Figure 9, the time cost of the model to detect CAN frames is shown. In the experiment, the test messages are divided into three different batches of 64, 128, and 256. The results show that the PSO-GSA-DCA-IDS model requires only 0.077 ms, 0.082 ms, and 0.08 ms time cost on average for the three batches. In addition, the model actually detects 64 messages continuously. This means that the model can reason in 1 s about 5 times the number of CAN transmission messages in 1 s. Therefore, the model is feasible for real-time detection.
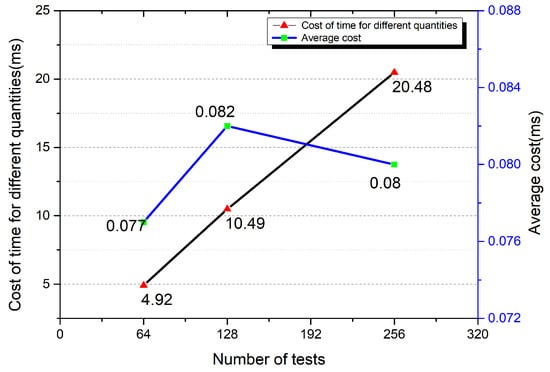
Figure 9.
Time cost of the PSO-GSA-DCA-IDS model.
To further evaluate the performance of the proposed IDS model, we compare PSO-GSA-DCA with the current in-vehicle CAN network intrusion detection model constructed by the classical immune algorithms NSA [25] and CSA [26], as well as the original DCA and IDCA in terms of detection accuracy. It is shown in Figure 10 and Figure 11 below.
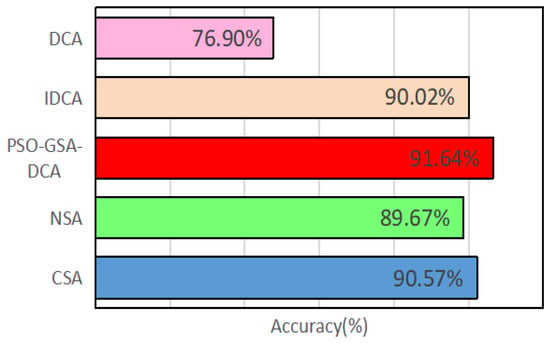
Figure 10.
Comparison of PSO-GSA-DCA with other IDS models.
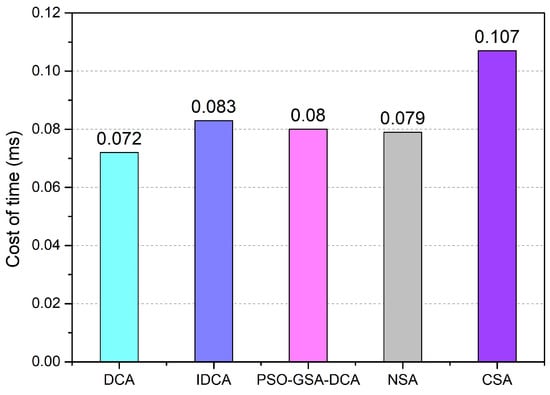
Figure 11.
Comparison of PSO-GSA-DCA with other IDS models in terms of time cost.
As shown in Figure 10 and Figure 11, PSO-GSA-DCA can reach more than in terms of detection accuracy, which is advantageous compared with other immune models. In terms of time overhead, our model takes slightly less time to perform anomaly detection than some anomaly detection models and is at a lower level of loss overall. Thus, our model is superior both in terms of detection accuracy and time overhead.
5. Conclusions and Future Work
In this paper, we propose an effective-strength DCA-based anomaly detection method for in-vehicle CAN buses. We merged the PSO and GSA algorithms to optimize the DCA classifier. Firstly, we match CAN message attributes with DCA input signals (PAMPs, DS, SS), mainly by calculating the information gain and standard deviation of CAN data attributes to set up matching rules. Then, the anomaly detection model is built to train the data for anomaly detection. We validate the experiments by capturing datasets from real vehicles, as well as injecting three kinds of attacks (DoD, fuzzy, replay) to generate attack datasets to verify the model’s detection performance on the attack datasets. Meanwhile, we conduct comparison experiments with other detection algorithms, and the results show that PSO-GSA-DCA has high detection accuracy and lower time cost. Thus our method has better performance in anomaly detection.
In our future work, we will consider the implementation of strengthened DCA-based anomaly detection in real CAN bus networks to evaluate the performance of anomaly detection in real-time. Moreover, we will investigate how to detect an unknown attack on a vehicle. Eventually, we will consider combining innate immune algorithms with adaptive immune algorithms to build a complete intrusion detection defense system, while the combination of DCA with other adaptive immune algorithms is to be further investigated.
Author Contributions
Conceptualization, X.L. and F.L.; methodology, F.L.; software, F.L.; validation, F.L.; formal analysis, D.L.; investigation, F.L.; resources, X.L.; data curation, F.L.; writing—original draft preparation, F.L.; writing—review and editing, X.L. and F.L.; visualization, F.L.; supervision, M.H. and T.H.; project administration, X.L.; funding acquisition, M.H. All authors have read and agreed to the published version of the manuscript.
Funding
This research is supported by the Key Research and Development Plan of Jiangsu province in 2017 (Industry Foresight and Generic Key Technology) (BE2017035) and the Project of Jiangsu University Senior Talents Fund (1281170019).
Institutional Review Board Statement
Not applicable.
Informed Consent Statement
Not applicable.
Data Availability Statement
Not applicable.
Conflicts of Interest
The authors declare no conflict of interest.
References
- Lin, B.; Chen, X.; Wang, L. A Cloud-Based Trust Evaluation Scheme Using a Vehicular Social Network Environment. In Proceedings of the 2017 24th Asia-Pacific Software Engineering Conference (APSEC), Nanjing, China, 4–8 December 2017. [Google Scholar]
- Duan, X.; Yan, H.; Tian, D.; Zhou, J.; Su, J.; Hao, W. In-Vehicle CAN Bus Tampering Attacks Detection for Connected and Autonomous Vehicles Using an Improved Isolation Forest Method. IEEE Trans. Intell. Transp. Syst. 2021, 10, 142–149. [Google Scholar] [CrossRef]
- Hoppe, T.; Kiltz, S.; Dittmann, J. Security threats to automotive CAN networks—Practical examples and selected short-term countermeasures. Reliab. Eng. Syst. Saf. 2011, 96, 11–25. [Google Scholar] [CrossRef]
- Othmane, L.B.; Weffers, H.; Mohamad, M.M.; Wolf, M. A Survey of Security and Privacy in Connected Vehicles. In Wireless Sensor and Mobile Ad-Hoc Networks; Springer: Berlin/Heidelberg, Germany, 2015; pp. 217–247. [Google Scholar]
- Nie, S.; Liu, L.; Du, Y. Free-fall: Hacking tesla from wireless to can bus. Brief. Black Hat USA 2017, 25, 1–16. [Google Scholar]
- Miller, C.; Valasek, C. A Survey of Remote Automotive Attack Surfaces. Black Hat USA 2014, 2014, 94. [Google Scholar]
- Han, M.; Wan, A.; Zhang, F.; Ma, S. An Attribute-Isolated Secure Communication Architecture for Intelligent Connected Vehicles. IEEE Trans. Intell. Veh. 2020, 5, 545–555. [Google Scholar] [CrossRef]
- Elshaer, A.M.; Elrakaiby, M.M.; Harb, M.E. Autonomous car implementation based on CAN bus protocol for IoT applications. In Proceedings of the Name of the 2018 13th International Conference on Computer Engineering and Systems (ICCES), Cairo, Egypt, 18–19 December 2018; pp. 275–278. [Google Scholar]
- Li, X.; Zhao, M.; Zeng, M.; Mumtaz, S.; Menon, V.G.; Ding, Z.; Dobre, O.A. Hardware impaired ambient backscatter NOMA systems: Reliability and security. IEEE Trans. Commun. 2021, 69, 2723–2736. [Google Scholar] [CrossRef]
- Cho, K.-T.; Shin, K.G. Fingerprinting electronic control units for vehicle intrusion detection. In Proceedings of the 25th USENIX Security Symposium (USENIX Security 16), Austin, TX, USA, 10–12 August 2016; pp. 911–927. [Google Scholar]
- Tomlinson, A.; Bryans, J.; Shaikh, S.A. Towards viable intrusion detection methods for the automotive controller area network. In Proceedings of the 2nd ACM Computer Science in Cars Symposium, Munich, Germany, 13–14 September 2018; pp. 1–9. [Google Scholar]
- Studnia, I.; Alata, E.; Nicomette, V.; Kaâniche, M.; Laarouchi, Y. A language-based intrusion detection approach for automotive embedded networks. Int. J. Embed. Syst. 2018, 10, 1–11. [Google Scholar] [CrossRef]
- Karatas, G.; Demir, O.; Sahingoz, O.K. Deep learning in intrusion detection systems. In Proceedings of the 2018 International Congress on Big Data, Deep Learning and Fighting Cyber Terrorism (IBIGDELFT), Ankara, Turkey, 3–4 December 2018; pp. 113–116. [Google Scholar]
- Cho, K.-T.; Shin, K.G. Viden: Attacker identification on in-vehicle networks. In Proceedings of the 2017 ACM SIGSAC Conference on Computer and Communications Security, Dallas, TX, USA, 1–3 November 2017; pp. 1109–1123. [Google Scholar]
- Müter, M.; Asaj, N. Entropy-based anomaly detection for in-vehicle networks. In Proceedings of the 2011 IEEE Intelligent Vehicles Symposium (IV), Baden-Baden, Germany, 5–9 June 2011; pp. 1110–1115. [Google Scholar]
- Song, H.M.; Kim, H.R.; Kim, H.K. Intrusion detection system based on the analysis of time intervals of CAN messages for in-vehicle network. In Proceedings of the 2016 International Conference on Information Networking (ICOIN), Kota Kinabalu, Malaysia, 13–15 January 2016; pp. 63–68. [Google Scholar]
- Kang, M.-J.; Kang, J.-W. Intrusion detection system using deep neural network for in-vehicle network security. PLoS ONE 2016, 11, e0155781. [Google Scholar] [CrossRef] [PubMed]
- Taylor, A.; Leblanc, S.; Japkowicz, N. Anomaly detection in automobile control network data with long short-term memory networks. In Proceedings of the 2016 IEEE International Conference on Data Science and Advanced Analytics (DSAA), Montreal, QC, Canada, 17–19 October 2016; pp. 130–139. [Google Scholar]
- Hossain, M.D.; Inoue, H.; Ochiai, H.; Fall, D.; Kadobayashi, Y. Lstm-based intrusion detection system for in-vehicle can bus communications. IEEE Access 2020, 8, 185489–185502. [Google Scholar] [CrossRef]
- Abdelhaq, M.; Alsaqour, R.; Algarni, A.; Alabdulhafith, M.; Alawi, M.; Taha, A.; Sharef, B.; Tariq, M. Human immune-based model for intrusion detection in mobile ad hoc networks. Peer-Netw. Appl. 2020, 13, 1046–1068. [Google Scholar] [CrossRef]
- Greensmith, J.; Aickelin, U. Artificial Dendritic Cells: Multi-Faceted Perspectives; Springer: Berlin/Heidelberg, Germany, 2009; pp. 375–395. [Google Scholar]
- Igbe, O.; Darwish, I.; Saadawi, T. Distributed network intrusion detection systems: An artificial immune system approach. In Proceedings of the 2016 IEEE First International Conference on Connected Health: Applications, Systems and Engineering Technologies (CHASE), Washington, DC, USA, 27–29 June 2016; pp. 130–139. [Google Scholar]
- Vidal, J.M.; Orozco, A.L.S.; Villalba, L.J.G. Adaptive artificial immune networks for mitigating DoS flooding attacks. Swarm Evol. Comput. 2018, 38, 94–108. [Google Scholar] [CrossRef]
- Sarwar, M.H.; Shah, M.A.; Umair, M.; Faraz, S.H. Network of ECUs Software Update in Future vehicles. In Proceedings of the 2019 25th International Conference on Automation and Computing (ICAC), Lancaster, UK, 5–7 September 2019; pp. 1–5. [Google Scholar]
- Forrest, S.; Perelson, A.S.; Allen, L.; Cherukuri, R. Self-nonself discrimination in a computer. In Proceedings of the 1994 IEEE Computer Society Symposium on Research in Security and Privacy, Oakland, CA, USA, 16–18 May 1994; pp. 202–212. [Google Scholar]
- De Castro, L.N.; Von Zuben, F.J. The clonal selection algorithm with engineering applications. In Proceedings of the GECCO, Las Vegas, NV, USA, 10–12 July 2000; pp. 36–39. [Google Scholar]
- Greensmith, J.; Aickelin, U. The Dendritic Cell Algorithm. Ph.D. Thesis, University of Nottingham, Nottingham, UK, 2007. [Google Scholar]
- Alaparthy, V.T.; Morgera, S.D. A multi-level intrusion detection system for wireless sensor networks based on immune theory. IEEE Access 2018, 6, 47364–47373. [Google Scholar] [CrossRef]
- Zhou, W.; Liang, Y. A new version of the deterministic dendritic cell algorithm based on numerical differential and immune response. Appl. Soft Comput. 2021, 102, 107055. [Google Scholar] [CrossRef]
- Luo, C.; Bo, W.; Kun, H.; Lou, Y. Study on Software Vulnerability Characteristics and Its Identification Method. Math. Probl. Eng. 2020, 2020, 1583132. [Google Scholar] [CrossRef]
- Zhou, W.; Dong, H.; Liang, Y. The deterministic dendritic cell algorithm with Haskell in earthquake magnitude prediction. Earth Sci. Inform. 2020, 13, 447–457. [Google Scholar] [CrossRef]
- Dagdia, Z.C. A scalable and distributed dendritic cell algorithm for big data classification. Swarm Evol. Comput. 2019, 50, 100432. [Google Scholar] [CrossRef]
- Farzadnia, E.; Shirazi, H.; Nowroozi, A. A new intrusion detection system using the improved dendritic cell algorithm. Comput. J. 2020, 64, 1193–1214. [Google Scholar] [CrossRef]
- Secker, A.; Freitas, A.A.; Timmis, J. A danger theory inspired approach to web mining. In Proceedings of the International Conference on Artificial Immune Systems, Nottingham, UK, 27 August 2013; pp. 156–167. [Google Scholar]
- Tian, D.; Shi, Z. MPSO: Modified particle swarm optimization and its applications. Swarm Evol. Comput. 2018, 41, 49–68. [Google Scholar] [CrossRef]
- Rashedi, E.; Nezamabadi-Pour, H.; Saryazdi, S. GSA: A gravitational search algorithm. Inf. Sci. 2009, 179, 2232–2248. [Google Scholar] [CrossRef]
- Rashedi, E.; Rashedi, E.; Nezamabadi-Pour, H. A comprehensive survey on gravitational search algorithm. Swarm Evol. Comput. 2018, 41, 141–158. [Google Scholar] [CrossRef]
Publisher’s Note: MDPI stays neutral with regard to jurisdictional claims in published maps and institutional affiliations. |
© 2022 by the authors. Licensee MDPI, Basel, Switzerland. This article is an open access article distributed under the terms and conditions of the Creative Commons Attribution (CC BY) license (https://creativecommons.org/licenses/by/4.0/).