Article

Efficient Sandstorm Image Color Correction Using Rank-Based Singular Value Recombination

Digital Media Engineering, Tongmyong University, Sin Seon Ro, Nam Gu, Busan 48520, Korea
Symmetry 2022, 14(8), 1501; https://doi.org/10.3390/sym14081501
Submission received: 12 June 2022 / Revised: 5 July 2022 / Accepted: 17 July 2022 / Published: 22 July 2022

Abstract

:
Sandstorm images have a color cast that is reddish or yellowish due to the attenuation of the color channel. When light propagates through sand particles, it is scattered. Additionally, if some sand particles have a certain color, the obtained image in this circumstance experiences a color shift because some color channels are attenuated. Therefore, sandstorm images have a symmetrically distributed color cast throughout the image. There have been many studies aiming to enhance sandstorm images. In many studies, to enhance color-casted images, researchers have used the various methods as with gamma correction. However, artificial color shift occurs in an enhanced image because these methods do not reflect the image’s adaptive feature. This paper proposes a sandstorm image enhancement method using singular value recombination based on rank. The singular value of an image reflects the image’s characteristics adaptively, and improved images using the singular values have no artificial color because the balanced image eliminates the degraded color cast. Because the balanced image has hazy or dusty features, the singular value ratio can be used to enhance the image. The enhanced images produced using the proposed method are superior compared to state-of-the-art methods, objectively and subjectively.

1. Introduction

Images that are obtained in sandstorm circumstances have a color cast that is reddish or yellowish. When the light propagates in sand particles, if the sand particles have a certain color, then the obtained image has an artificial color in accordance with the particle’s color. Because the distribution of color shift in sandstorm images is symmetrical, to apply sandstorm images in the computer vision and image recognition field, a compensation procedure for the degraded color channel is needed. There have been many studies aiming to enhance degraded sandstorm images. However, the existing methods cause an artificial color cast in the improved image. To enhance sandstorm images naturally, a color compensation procedure is needed. Because sandstorm images and hazy or dusty images have the same obtaining procedure, to enhance the degraded image, there are two categories of methods, namely, model-based methods and model-free improvement methods. Model-based methods use the haze image model [1,2,3,4,5], and model-free methods use image processing methods.
There are many studies that have aimed to enhance sandstorm images based on model-free methods. Cheng et al. [6] enhanced degraded sandstorm images using robust gray world [7] and guided image filter [8]. Ameen’s [9] method improves color-degraded sandstorm images using triple measures of images; however, the enhanced images produced using this method have an artificial color shift because the constant triple measurements do not adequately reflect the image’s features. Shi et al. enhanced sandstorm images using the mean shift of color components and adaptive CLAHE [10]. Although Shi et al.’s [10] method is able to correct the color, the enhanced images using this method have a new color in some cases. This method is able to improve sandstorm images; however, artificial color can appear in the enhanced image.
The model-based sandstorm image enhancement methods use the hazy image model [1,2,3,4,5]. Hazy images have the same obtaining procedure as dusty images. Therefore, hazy image enhancement methods are used in the dusty image enhancement area. He et al. [1] enhanced hazy images. This method enhances the hazy image using dark channel prior, which estimates the darkest region of image. However, because the constant kernel is used to estimate the darkest region of the image, a ringing effect occurs, and to compensate for this phenomenon, this method uses the guided image filter [8]. Meng et al. [11] enhanced dusty images using the refined transmission map. This method improves the dusty image using the refined transmission map which estimates the adaptive boundary region better than DCP [11]. Shi et al. [12] enhanced sandstorm images using the mean shift of color components and the transmission map. Shi et al.’s [12] method has a color correction operator; however, some of the enhanced images using this method have an artificial color shift because the color correction operator does not reflect the image’s features adaptively. Gao et al.’s method [13] enhances sandstorm images using the reversal of the color channel and an adaptive transmission map. Gao et al.’s method [13] also enhances sandstorm images; however, the enhanced images produced by this method seem hazy, even though the dehazing procedure is applied. T. Naseeba et al. enhanced sandstorm images using the merging of three techniques, namely the depth estimation module (DEM), the color analysis module (CAM), and the visibility restoration module (VRM) [14]. DEM uses the median filter and adaptive gamma correction technique. CAM uses the gray world assumption and analyzes the color features of hazy images. VRM applies the adjusted transmission map and color corrected image [14]. Dhara et al. enhanced hazy images using adaptive airlight refinement and nonlinear color balancing [15]. This method enhances the hazy image, even though the hazy image has a color cast. However, an artificial color cast appears in the enhanced image. Lee enhanced sandstorm images using the normalized eigenvalue and adaptive dark channel prior [16].
Recently, machine learning-based dehazing methods have been studied. Ren et al. enhanced hazy images using a convolutional neural network (CNN) [17]. This method uses two types of networks, one which predicts the transmission map and another which refines the result. This method enhances the images; however, the weak point is that in the case of nighttime images, a color shift occurs due to the color of lamplight. Wang et al. proposed a dehazing method using atmospheric illumination prior [18]. Zhu et al. improved hazy images using a color attenuation prior [19]. This method enhances hazy images by modeling their scene depth. However, the weak point of this method is that it needs a more flexible model to estimate the scattering coefficient [19]. Zhang et al. improved hazy images using multiscale CNN [20]. This method enhances hazy images; however, the weak point of this method is that the estimated transmission map has an incorrect region, and this causes the artificial effect [20].
Sandstorm images have a distorted color channel because of scattered light. Moreover, because degraded images have attenuated color channels, in order to enhance color-casted sandstorm images, a color correction procedure is needed. This paper proposes a sandstorm image enhancement method using rank-based singular value recombination. The corrected image produced using the proposed method has no color cast and hazy features. Because the color-corrected sandstorm images have hazy features, this paper applies dehazing methods to enhance the corrected image. There are many methods to enhance hazy images using dehazing algorithms. However, these methods cause an artificial effect in the enhanced image, such as the ringing effect and color shift. Additionally, the guided image filter [8] is able to provide an enhanced image. Cheng et al.’s method [6] uses the guided image filter [8] to enhance the image naturally. Therefore, this paper uses the guided image filter [8] to enhance balanced sandstorm images using the singular value ratio. The enhanced images produced using the proposed method seem to naturally be without color shift and ringing effect. Additionally, through comparison with state-of-the-art methods, the performance of the proposed method is shown to be superior to that of other methods both subjectively and objectively.

2. Proposed Method

Sandstorm images have a color cast that is reddish or yellowish due to the scattering of light by the color of sand particles. Additionally, images in sandstorm circumstances have attenuated color channels. Therefore, when a sandstorm image is enhanced, if the color correction procedure is skipped, then the improved image has an artificial color cast. Therefore, this paper proposes the color correction method using singular value recombination based on rank. Tripathi et al. used singular value decomposition to analyze images [21]. Li et al. denoised images using the images’ singular value [22]. The singular value of the color channel reflects the image’s features, such as contrast. If an image has low contrast, the singular value of the first order has a lower value than that of an image with high contrast, because the first-ranked singular value reflects the image’s background. Therefore, the singular value is able to show the features of an image, such as contrast.
This paper corrects the degraded color channel using the rank-based singular value, and this is described as:
[ U c , Σ c , V c ] = s v d ( I c ) ,  
where s v d ( · ) is the operator of singular value decomposition, I c is the input image, Σ c is the diagonal singular value matrix of color channel, c { r , g , b } , and U c and V c are orthogonal matrices. In Equation (1), the input image is decomposed into singular values. The singular value of each color channel shows the channel’s features based on rank. The singular value therefore shows the image’s features. If an image is degraded more, the maximum singular value is lower than that of a less degraded channel. Therefore, if the distribution of the singular value is uniform, the color-casted channel is able to be corrected. Figure 1 shows a dusty image and a color-distorted image, and the singular value of each color channel. As shown in Figure 1, the distribution of the singular value of a dusty channel is uniform and the color channels are not attenuated. However, the color-distorted sandstorm image does not have uniform color channels, and their singular values are not uniform; the singular value of the red channel is the highest, and the singular value of the blue channel is the lowest because the blue channel is the most attenuated and has low contrast in comparison with the red channel. Therefore, the singular value of the image is able to reflect the image’s condition.
As shown in Figure 1, because the singular value of the image reflects the image’s characteristics, this paper uses the recombined singular value based on rank to correct the image’s color. Figure 2 shows the diagram of the proposed method. As shown in Figure 2, this paper, based on the model-free sandstorm image enhancement method, improves a degraded sandstorm image using the image’s singular value, and to enhance the corrected image, the guided image filter is used.

2.1. Color Correction

As shown in Figure 1, because degraded sandstorm images have a color cast due to attenuated color channels, to correct sandstorm images, a color balancing procedure is needed. This paper uses the image’s singular value to balance the image, reflecting the image’s features. The obtaining procedure of the image’s singular value is shown in Equation (1). Because the image is attenuated more, the singular value of the image is lower, and to enhance the degraded image, recombination of the singular value is needed. The recombination of the singular value is described as:
Σ B c = Σ i n d c + α c · { m ( Σ i n d c ) Σ i n d c } ,  
α c = Σ 1 c Σ 1 c + Σ 2 c ,  
where Σ B c is the recombined singular value based on rank, Σ i n d c   is the rank of each color channel’s singular value, m ( · ) is the average operation on each color channel based on rank, and α c is the normalized singular value of the first ranked singular value via sum of first and second ranked singular value to prohibit all singular values being the same. Using Equations (2) and (3), the color-casted image is corrected and has no artificial color.
Figure 3 shows the input image and color-corrected image produced by Equations (2) and (3) and the distribution of the singular value of each color channel. As shown in Figure 3, the corrected image has no color cast and seems to have hazy features, and the distribution of the singular value is not the same but uniform in comparison with the distribution of the input image’s singular values. By decreasing the singular value of the red color channel, the contrast of the red channel is decreased. If the red channel’s contrast is maintained and the other channels such as green and blue are enhanced, a color shift can occur in the enhanced image because the intensity value of the red channel is superior to that of the other channels, and in some cases, the intensity value of the red channel is close to one. Therefore, to enhance sandstorm images naturally, the adjusting procedure of the red channel is also needed. As shown in Figure 3, the color correction performance of the proposed method is competitive.

2.2. Dehazing

The color-corrected sandstorm image seems hazy or dusty. Dusty images and hazy images look dimmed and unclear. Therefore, to enhance dimmed images, a dehazing procedure is needed. There are many methods that have been studied to improve hazy or dusty images. The dark channel prior (DCP) method [1] is frequently used to enhance hazy images. The DCP method estimates an image’s darkest region, and using this a transmission map is estimated. The estimation procedure of DCP is described as:
I d a r k ( x ) = min c ( min y Ω ( x ) ( I c ( y ) A c ) ) ,  
where I d a r k ( x ) is the estimated dark channel   c { r , g , b } , Ω ( x )   is the patch region, A c   is the backscattered light of each color channel [1], and x is the location of the pixel. He et al.’s method [1] estimates the darkest region in an image using constant patch, and because of this, the estimated image has a squared effect. Additionally, the transmission map which shows the propagation path of light also has a ringing effect due to the transmission map being estimated by reversing DCP; to compensate for this point, a guided image filter is used [8]. The description of the estimation of the transmission map is as follows:
t ( x ) = 1 ω · I d a r k ( x ) ,  
where t ( x ) is the transmission map, ω is a constant value to show the ‘aerial perspective’ [1,23,24], and is set to 0.95 in He et al.’s method [1]. As shown in Equation (5), the transmission map is estimated by reversing the dark channel. The dehazing method by He et al. [1] is useful. However, the constant patch value causes an artificial effect, such as a square effect. Additionally, this causes new distortion in the enhanced image. Cheng et al. [6] enhanced sandstorm images using the guided image filter [8]. The procedure of applying guided image filtering [8] in the dehazing area is described as:
I G c ( x ) = G f ( I B c ( x ) ,   k , e p s ) ,            
where I G c ( x ) is the guided filtered image, I B c ( x ) is the color-balanced image, k is a kernel and is set to 2, eps is set to 0.4 2 , and x is the location of the pixel. In Equation (6), the color-balanced image is blurred, and it acts as the initial procedure of dehazing using the guided image filter [8]. The dehazing procedure using the guided image filter [8] is described as:
I E c ( x ) = ( I B c ( x ) I G c ( x ) ) · w c + I G c ( x ) ,        
where I E c ( x ) is the enhanced image and w c is the controlling factor to produce the naturally enhanced image. In Equation (7), the color-balanced image is enhanced, and the image is clearly not dimmed. In Equation (7), the enhanced image is controlled by factor w c . To obtain the naturally enhanced image, the controlling factor is also applied to the image adaptively. As shown in the color balancing procedure, the singular value of the image reflects the image’s condition, such as contrast. If the image is enhanced, then the dusty components are also increased. Additionally, this is also reflected through the variation of the singular value. Therefore, this paper uses the variation of the singular value of the color channel to obtain the controlling factor, w c . The obtaining procedure of controlling factor w c is described as:
w r = 1 2 · ( max ( Σ B ,   1 r ,   Σ 1 r ) min ( Σ B , 1 r ,   Σ 1 r ) + w 0 )          
w c = 1 2 · ( Σ B , 1 c Σ 1   c + w 0 ) ,            
where w r is the controlling factor of the red channel, Σ B , 1 r is the first ranked singular value of the balanced red channel, Σ 1 r is the first ranked singular value of the input red channel, c { g , b } , and w 0 is the initial controlling factor and is set to 25. If the first ranked singular value of the balanced red channel is lower than the input image’s first- ranked singular value, then the controlling factor is lower than 1. Although the red channel is not as attenuated as other color channels, because of dusty components, the red channel also has many dusty particles. However, the controlling measure is lower than one because the effect of enhancement is not vivid, and therefore, through the comparison of the maximum and minimum singular value, the red channel’s controlling measure is obtained. In Equations (8) and (9), the balanced image is enhanced naturally by reflecting the image’s condition.
Figure 4 shows the comparison between the enhanced images produced using the DCP method [1] and the proposed method. Figure 4c shows the enhanced images produced using the DCP method [1]. As shown in Figure 4c, the enhanced images produced using the DCP method [1] demonstrate an artificial effect in the sky region. Figure 4d shows the enhanced images produced using the proposed method. As shown in Figure 4d, the enhanced images produced using the proposed method display no artificial effects or color distortion, and seem natural.
As shown in Figure 3 and Figure 4, to enhance sandstorm images naturally, color balancing and the image adaptive dehazing procedure are needed. Additionally, the enhanced images produced using the proposed method have no color shift or distorted areas. Therefore, the proposed method has sufficient performance to enhance the sandstorm image enhancement field.

3. Experimental Results and Discussion

Distorted sandstorm images demonstrate a color shift due to attenuated color channels. To enhance a degraded sandstorm image, the imbalanced color channel is compensated. The proposed method performs suitable balancing of the color components using the recombined singular value of each color channel. The balanced image produced using the proposed method seems natural, without any color distortion. This section shows the performance of the proposed method through comparison with state-of-the-art methods. To compare this method with state-of-the-art methods subjectively, this paper composes two categories. One is a comparison of the color-balanced result, and the other is a comparison of the enhanced image with sandstorm images from various environments in the Detection in Adverse Weather Nature (DAWN) dataset [25] and the Weather Phenomenon Database (WEAPD) [26]. Additionally, to assess the enhanced sandstorm images objectively using the proposed method and state-of-the-art methods, three metrics are used.

3.1. Color Correction

Color-degraded sandstorm images seem reddish and yellowish. To enhance sandstorm images naturally, a color compensation procedure is needed. If not, the enhanced image has an artificial color shift. This section presents the comparison of color-balanced images produced using the proposed method and state-of-the-art methods subjectively. Shi et al.’s [12] method enhances sandstorm images using the mean shift of color components. Shi et al. [10] improved the color components of degraded sandstorm images using mean shift and gamma correction. Al Ameen’s method [9] enhances color-degraded sandstorm images using the gamma correction. Lee enhanced degraded sandstorm images using the normalized eigenvalue [16].
Figure 5, Figure 6 and Figure 7 show color-balanced images produced using the proposed method and state-of-the-art methods. Figure 5 shows a variously degraded sandstorm image. Shi et al.’s [12] method enhances sandstorm images using the mean shift of color components. This method operates efficiently to balance the image’s color. However, artificial color shift can occur in the enhanced image because this method uses just the mean shift of color components. Shi et al. [10] improves the color components of degraded sandstorm images using mean shift and gamma correction. This method improves the distorted sandstorm image, but a new color shift can occur in the enhanced image because of the mean shift of color components. Al Ameen’s method [9] enhances color-degraded sandstorm images using the gamma correction. This method improves distorted sandstorm images; however, the weak point of this method is using a constant value to enhance sandstorm images, and it does not reflect images’ features adaptively. As shown in Figure 5, the color correction on the lightly degraded sandstorm image is not a tough task for Shi et al.’s [12] and Shi et al.’s [10] methods. The Al Ameen method [9] uses a constant value to enhance sandstorm images, and the enhanced image’s artificial color shift occurs because the constant value does not reflect the image’s feature adaptively. The enhanced images produced using the Lee method [16] seem bright, because to enhance the degraded sandstorm images, Lee’s method [16] uses the normalized eigenvalue, and due to this, the enhanced images have a bright region; the eigenvalue of the red channel is more abundant than that of other color channels. However, the enhanced images produced using the proposed method enhance the color components of degraded sandstorm images naturally without any color shift.
Figure 6 shows lightly degraded sandstorm images and severely distorted sandstorm images, along with enhanced images produced using the proposed method and state-of-the-art methods. Shi et al. [12] improved the degraded sandstorm images using the mean shift of color components. This method enhances the sandstorm images naturally, but the in case of greatly degraded sandstorm images, the enhanced images produced using this method have a blueish artificial color shift. The Shi et al. [10] method enhances the lightly degraded sandstorm images naturally. However, in the case of the much-distorted sandstorm images, the enhanced images demonstrate a new blueish color shift. The Shi et al. methods [10,12] enhance the sandstorm images in the case of light degradation, but in the case of the greatly degraded sandstorm images, an artificial color shift can occur in the enhanced images due to these methods not reflecting the image’s features adaptively. Al Ameen’s method [9] enhances the sandstorm images; however, the enhanced images using this method have an artificial color shift due to using a constant value to enhance the distorted color, and it does not reflect the image’s features. The improved images produced using the Lee method [16] have a bright region due to the abundant red channel. Meanwhile, the enhanced images produced using the proposed method have no artificial color shift.
Figure 7 shows variously degraded sandstorm images. Shi et al.’s [12] method enhances the sandstorm images; however, the enhanced images have a bluish color shift in the greatly degraded sandstorm images. Shi et al.’s [10] method enhances the sandstorm images. However, the enhanced images using this method have a blueish artificial color shift in some cases. The Al Ameen method [9] enhances the sandstorm images in cases of light degradation. However, in the case of the greatly degraded sandstorm images, the enhanced images have a yellowish artificial color shift. The enhanced images produced by means of Lee’s method [16] have a bright area due to the abundant red channel and rare color components. Meanwhile, the enhanced sandstorm images produced using the proposed method seem natural and without any color shift.
As shown in Figure 5, Figure 6 and Figure 7, the enhanced images produced using state-of-the-art methods have an artificial color shift in various types of sandstorm images. However, the enhanced images produced using the proposed method have no color shift and seem natural. Therefore, the color balancing algorithm of the proposed method is superior to the state-of-the-art method.

3.2. Enhanced Image

The color-imbalanced sandstorm images are corrected using the proposed method, and the balanced images seem natural. Because the balanced sandstorm images seem hazy, to enhance the image, a dehazing procedure is needed. To enhance the hazy image, dehazing algorithms are used frequently. He et al. enhanced hazy images using dark channel prior and a transmission map [1]. Meng et al. improved hazy images using a boundary-refined transmission map [11]. Ren et al. enhanced hazy images using a convolutional neural network (CNN) [17]. Gao et al. improved sandstorm images using the autoreversing blue channel compensation method and an adaptive transmission map [13]. Shi et al. enhanced sandstorm images using the mean shift of color components and an adjustable transmission map [12]. Al Ameen [9] improved sandstorm images using the gamma correction method. Shi et al. enhanced sandstorm images using the mean shift of color components and adaptive CLAHE [10]. Lee improved degraded sandstorm images using normalized eigenvalue and adaptive DCP [16]. Dhara et al. improved hazy images using adaptive airlight refinement and nonlinear color balancing [15]. Because sandstorm images resemble dusty or hazy images, to compare the enhanced images, existing dehazing methods were used.
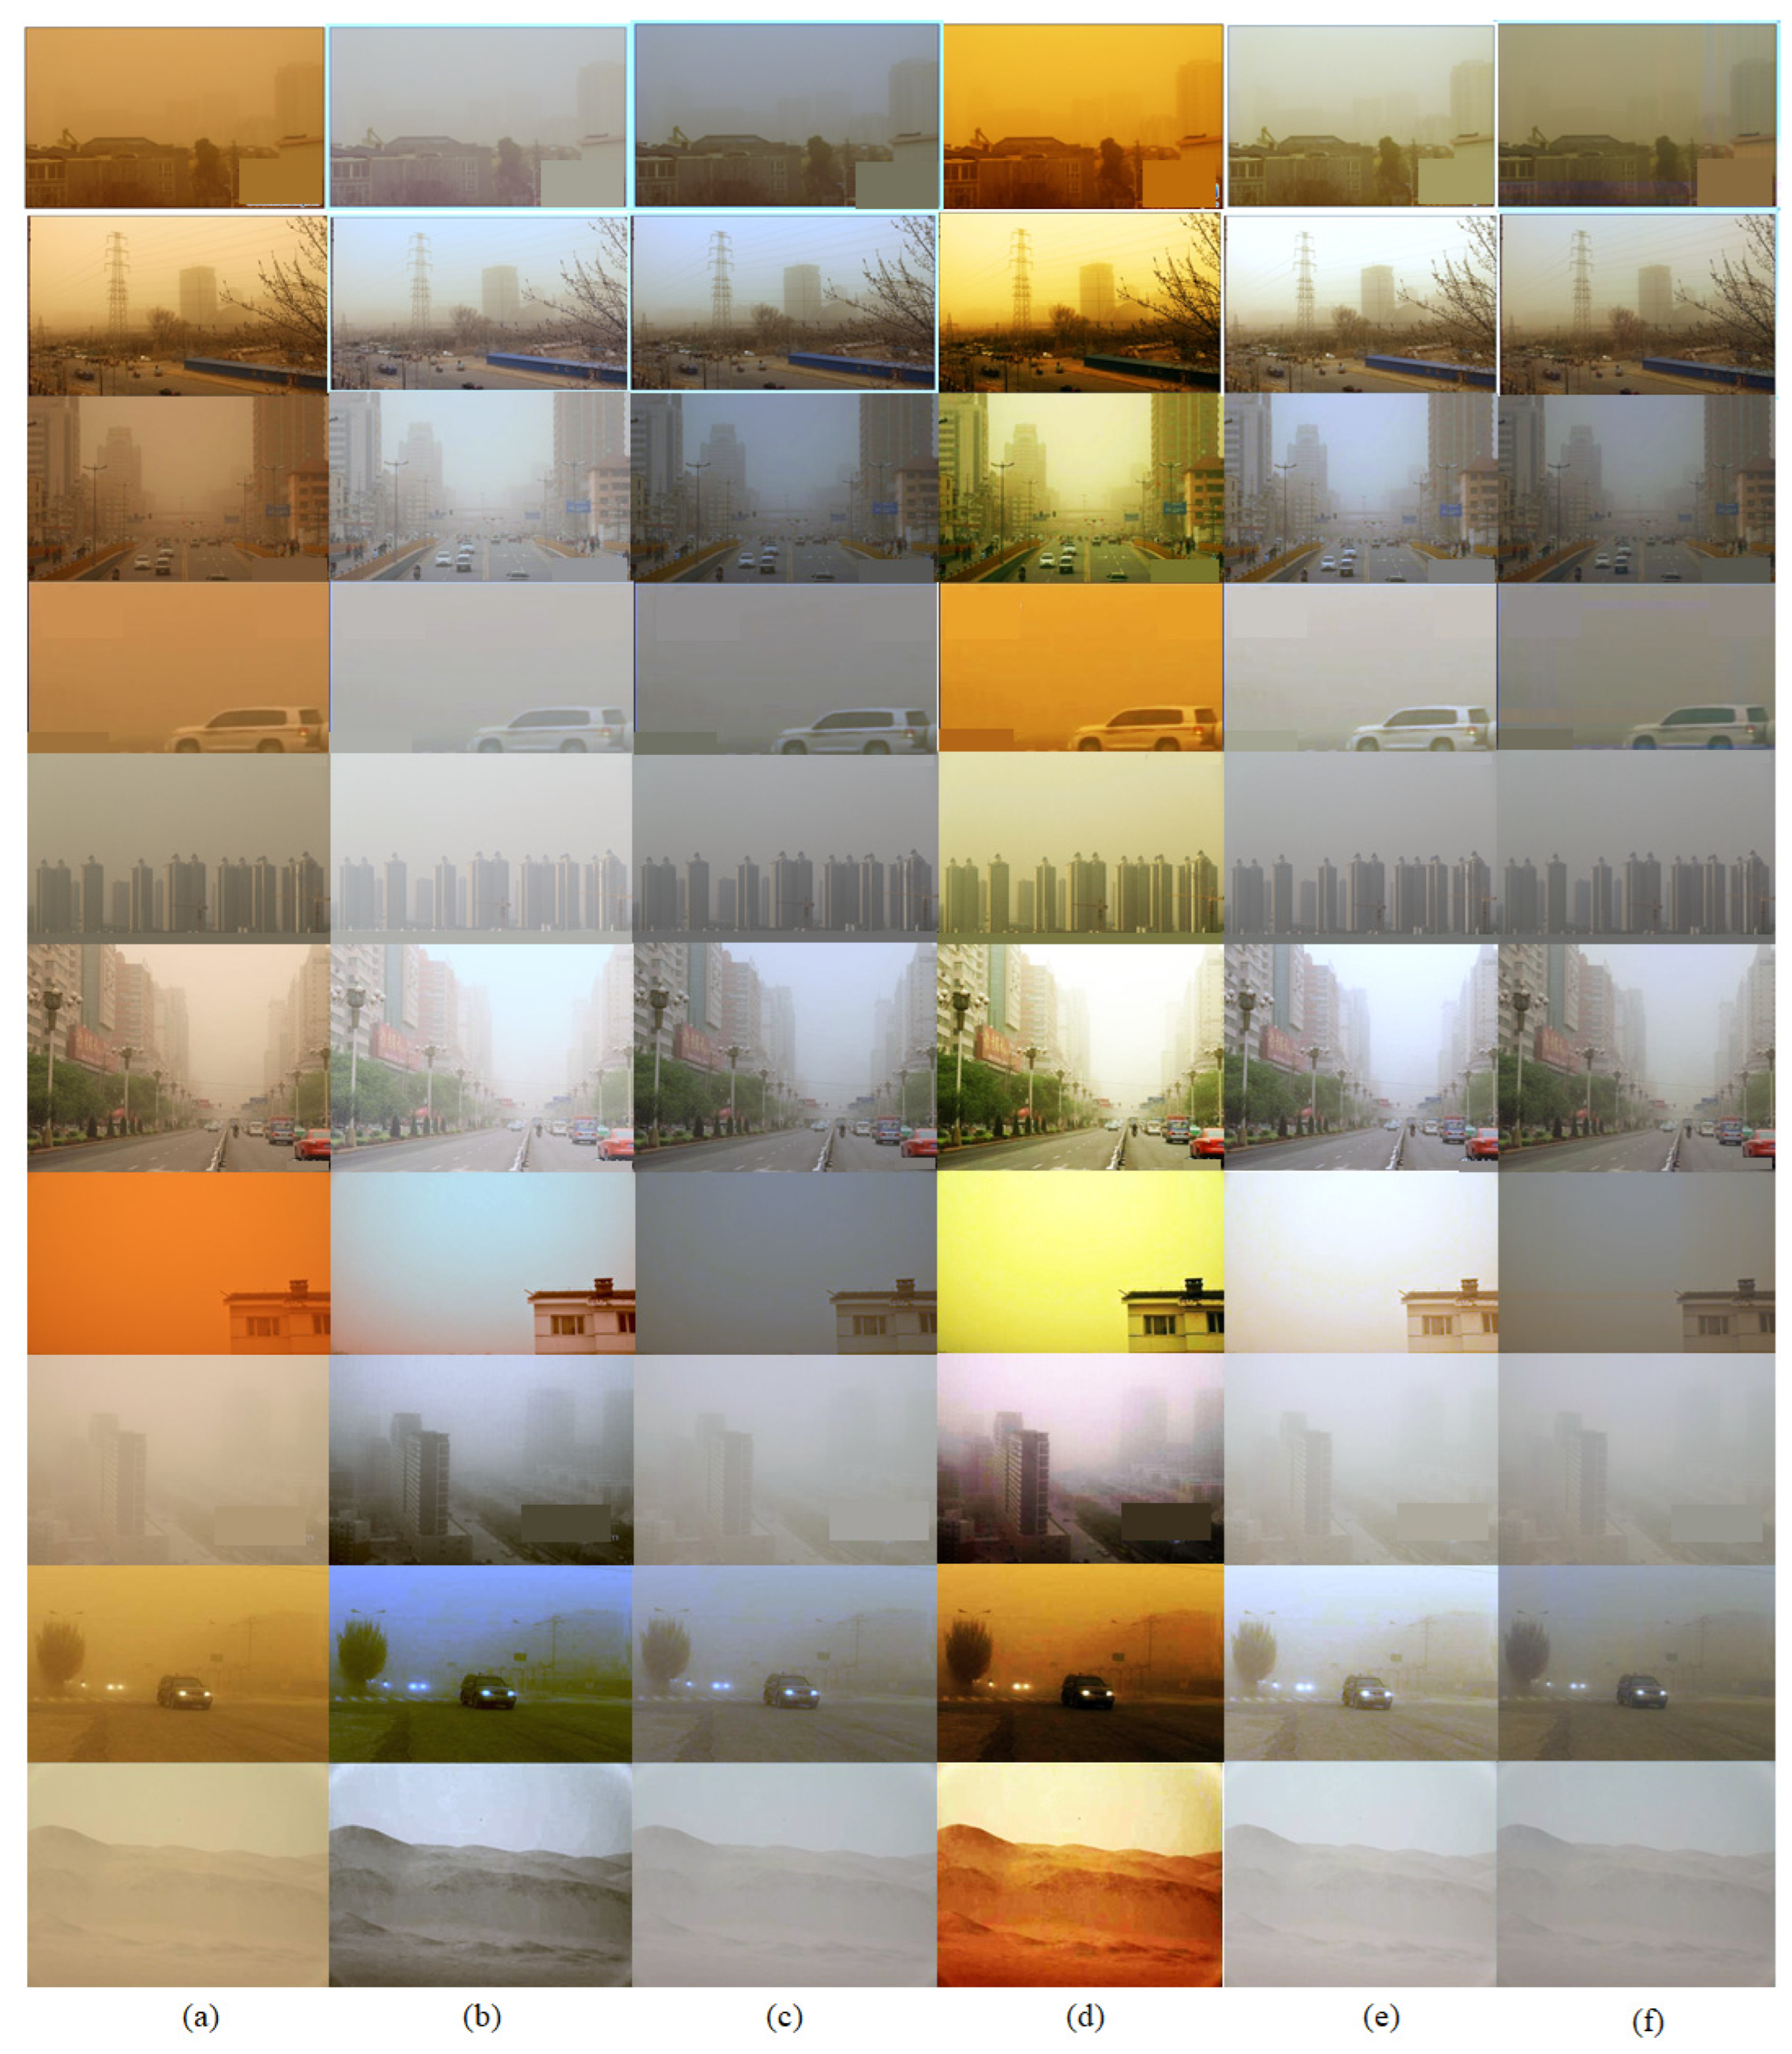
Figure 8, Figure 9, Figure 10, Figure 11, Figure 12 and Figure 13 show sandstorm images and enhanced sandstorm images using the proposed method and state-of-the-art methods.
Figure 8 and 
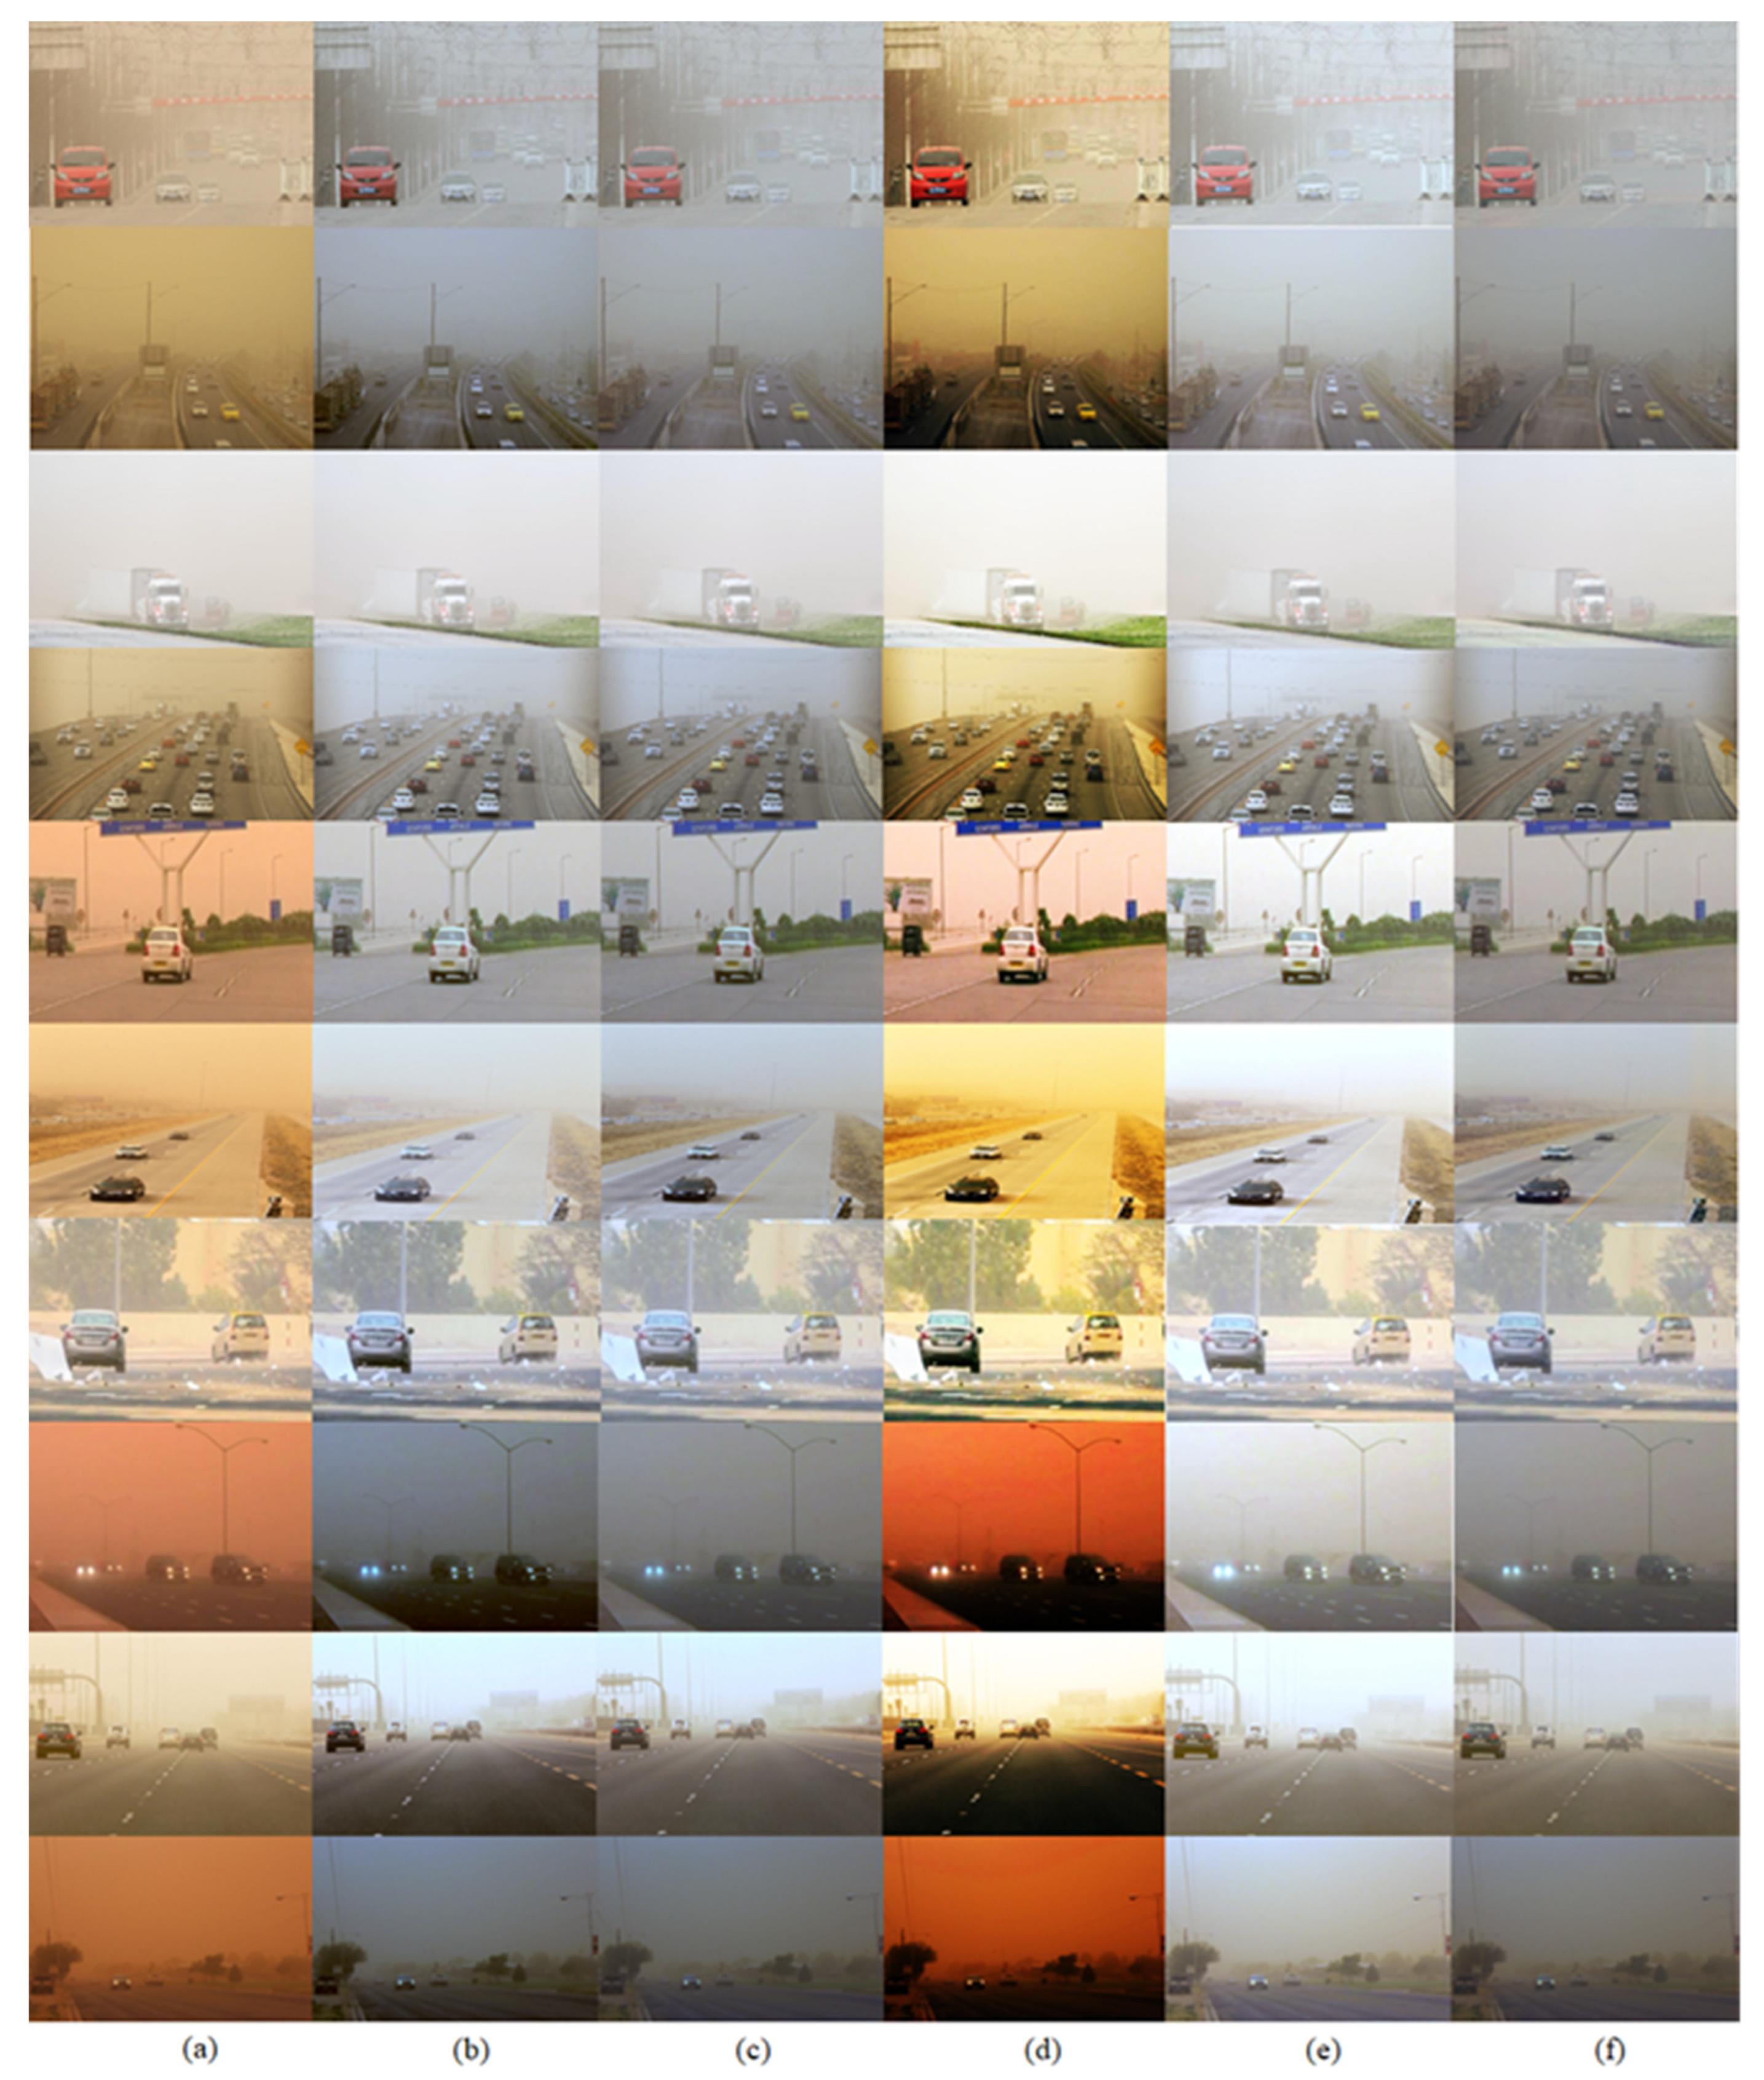
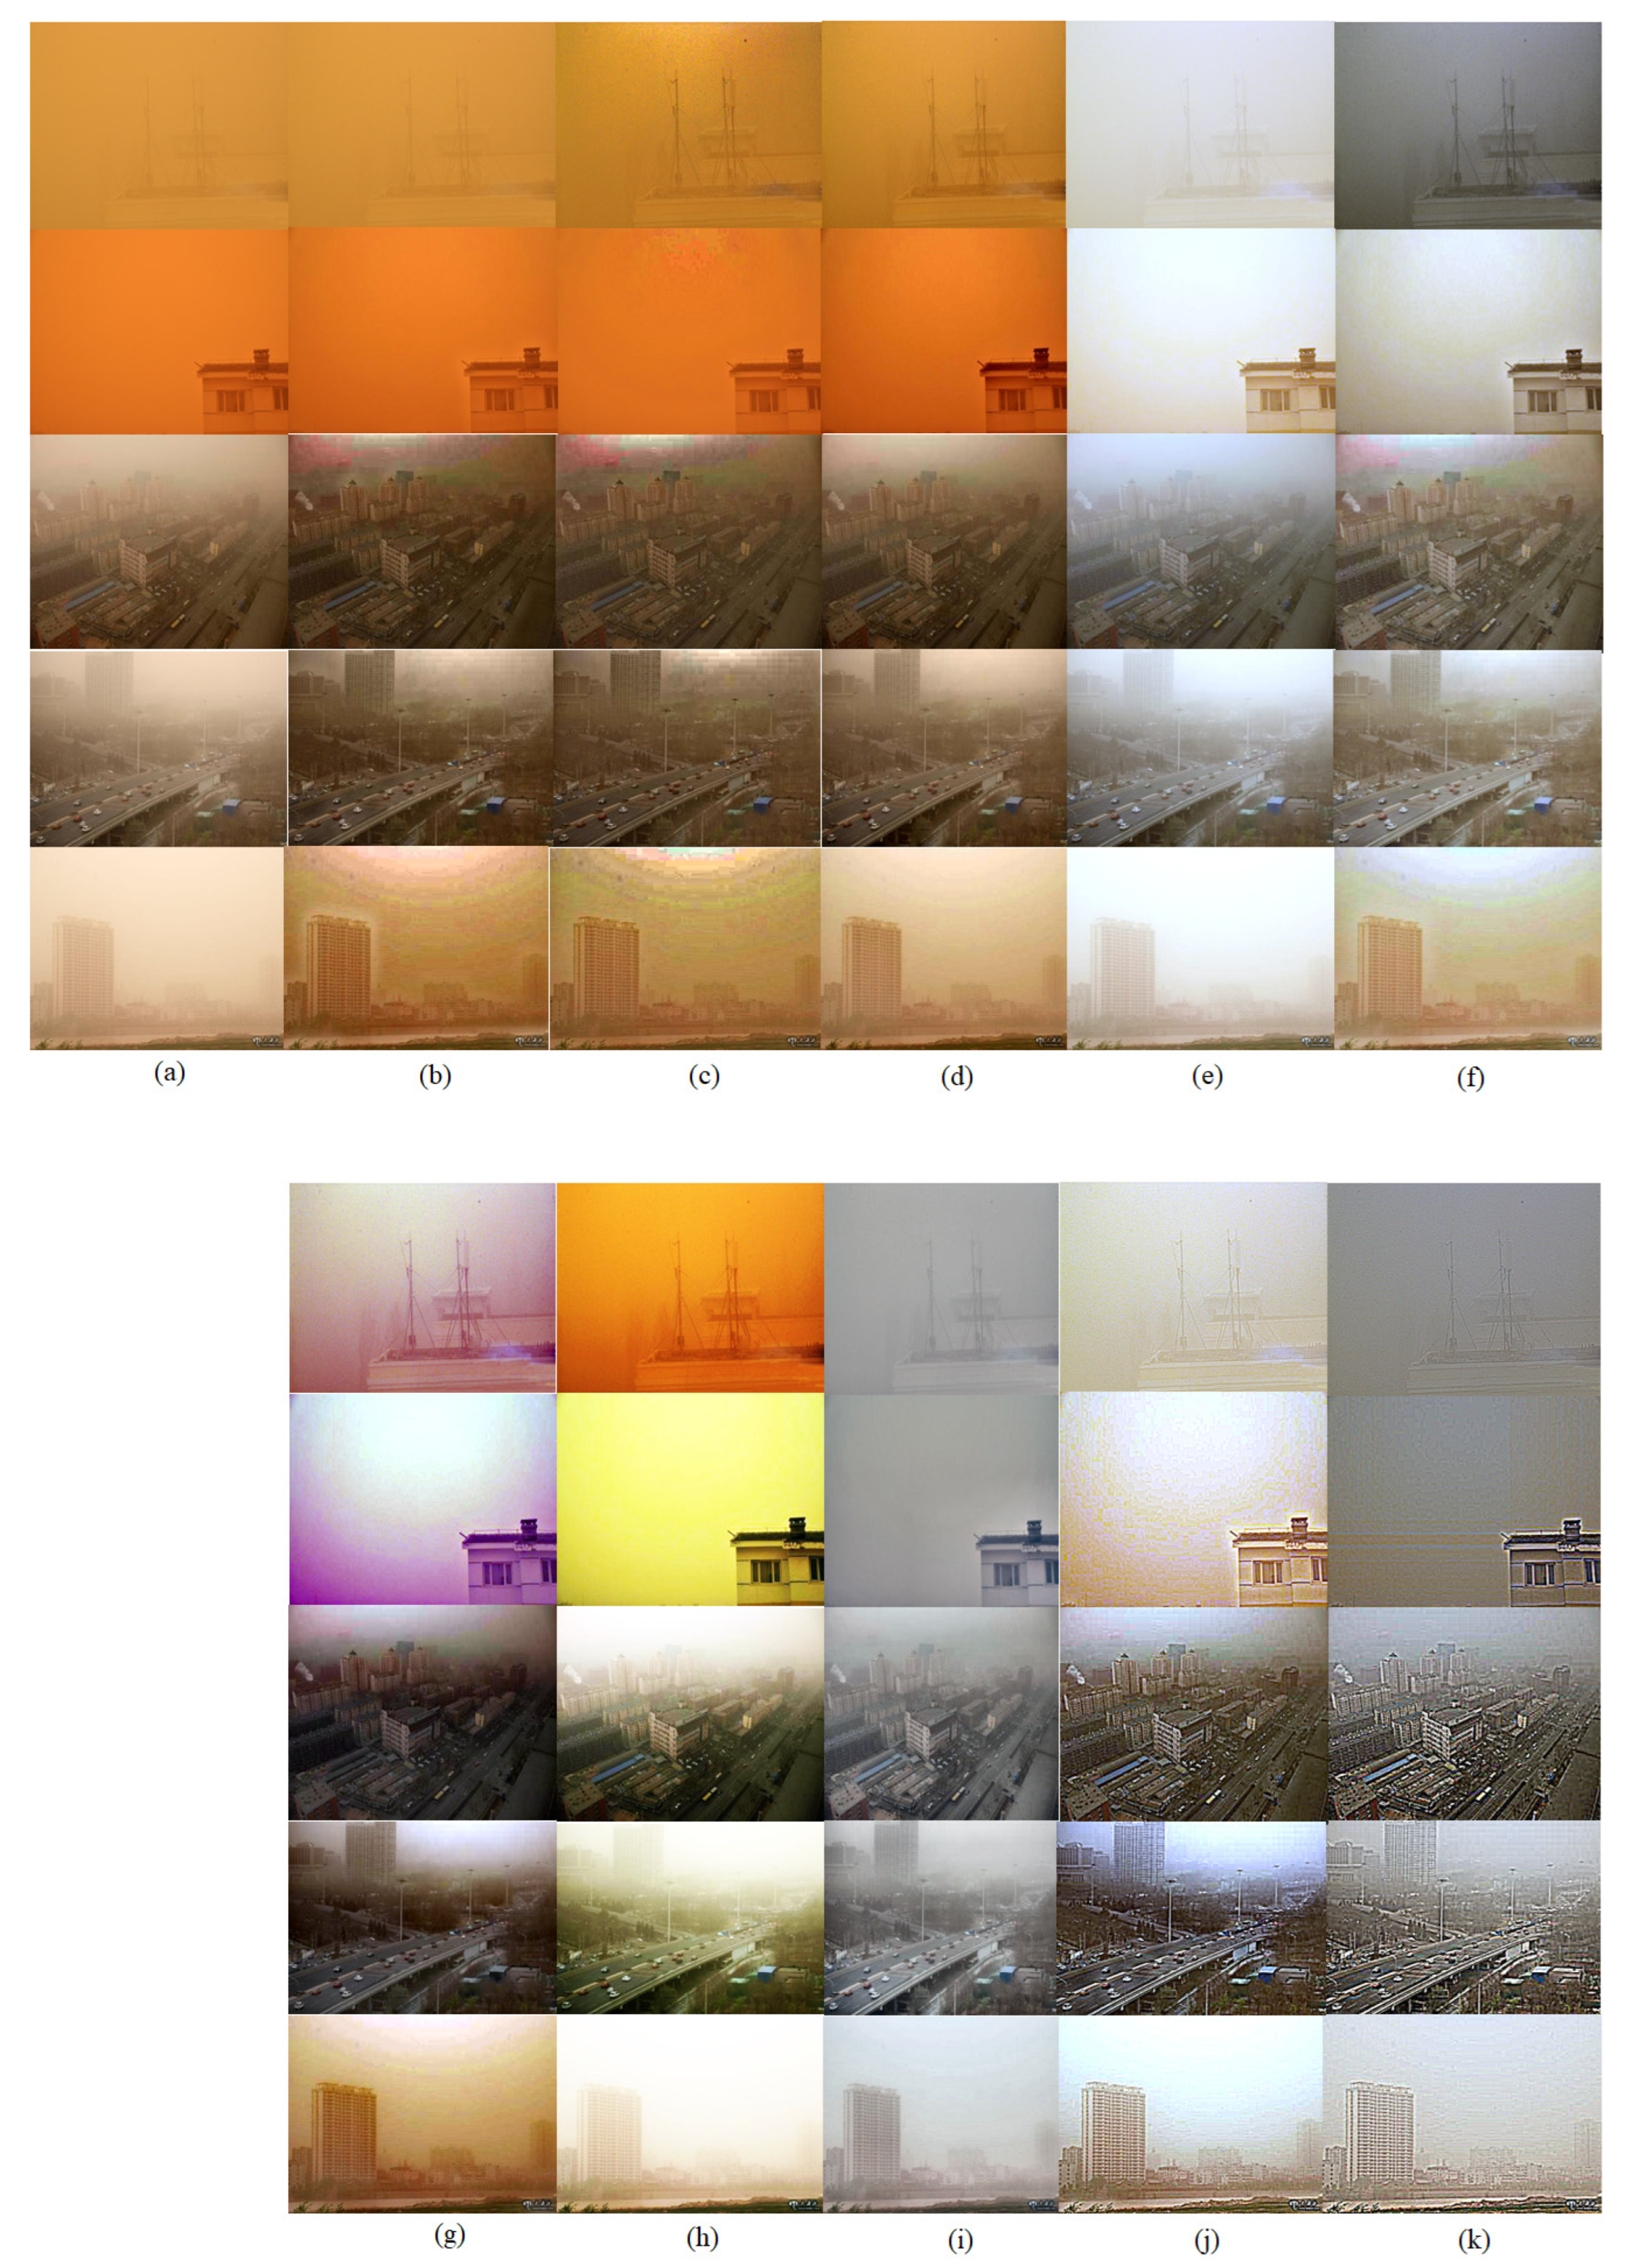
Figure 9 show lightly degraded sandstorm images and greatly degraded sandstorm images, as well as enhanced images produced using the proposed method and state-of-the-art methods. He et al.’s [1] method enhances the sandstorm images in the case of lightly degraded sandstorm images, because this method has no color balancing procedure and in the enhanced image, an artificial color shift occurs. Meng et al.’s [11] method improves the sandstorm images in the lightly distorted case. However, in the most degraded sandstorm images, the enhanced images produced using this method have an artificial color because this method has no color correction procedure. Ren et al.’s method [17] enhanced the lightly degraded sandstorm images because the lightly degraded sandstorm images resemble dusty images. However, in the most degraded sandstorm images, the enhanced images produced using this method have a new color shift. Gao et al.’s [13] method enhances the sandstorm images without color shift, and the improved images seem naturally. Shi et al.’s [12] method enhances the sandstorm images, but the enhanced images have color shift and a ringing effect because of the transmission map. When estimating the transmission map, a kernel of a certain size is used. Additionally, because of this, the enhanced images demonstrate a color shift and a ringing effect. Al Ameen’s [9] method enhances the degraded sandstorm images in the lightly degraded case. However, in the greatly degraded sandstorm images, the enhanced images have an artificial color shift. Because this method uses a constant value regardless of the image’s features to enhance sandstorm images, the enhanced images have a distorted region. The enhanced images produced using Dhara et al.’s method [15] have an artificial color in some cases, as although this method has a color balancing procedure, it does not sufficiently reflect the sandstorm images’ features. Lee’s method [16] improves the sandstorm images; however, due to the abundant red channel, a bright region is shown. Shi et al.’s method [10] improves the sandstorm images; however, a bluish color appears in some of the images due to the mean shift of color components. Meanwhile, the enhanced images produced using the proposed method have no color shift or ringing effect in both the lightly and greatly degraded sandstorm images.
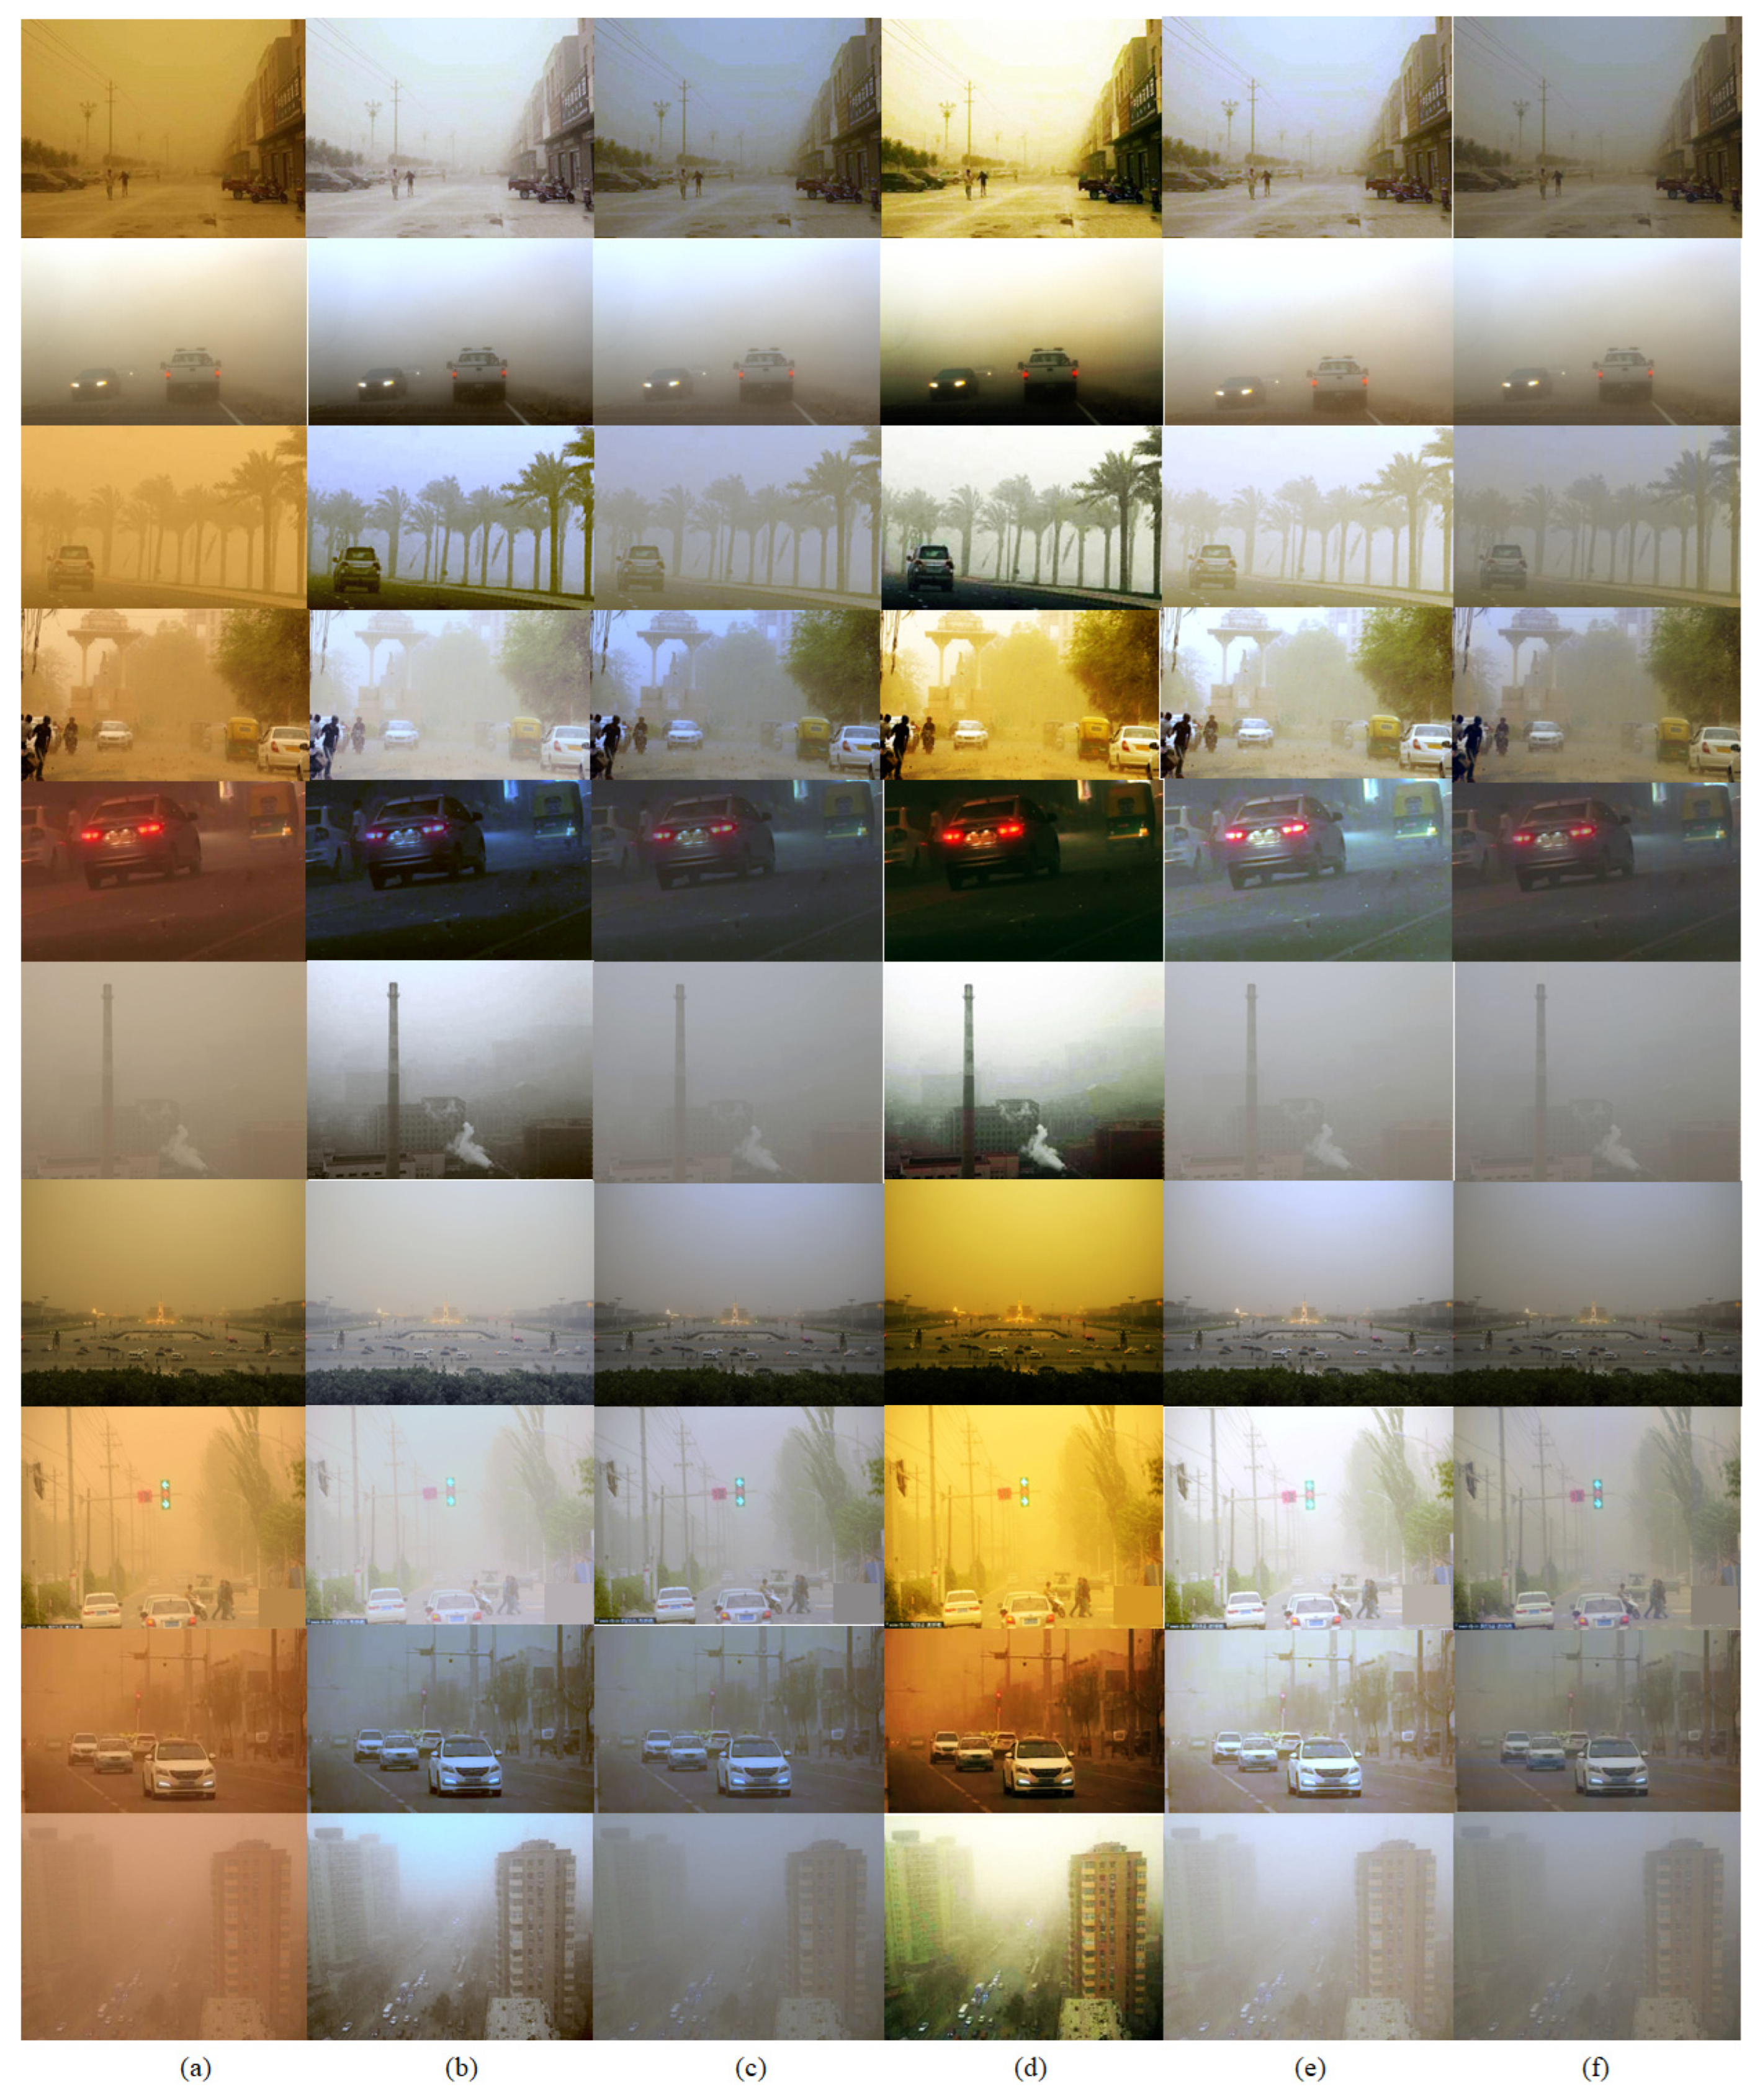
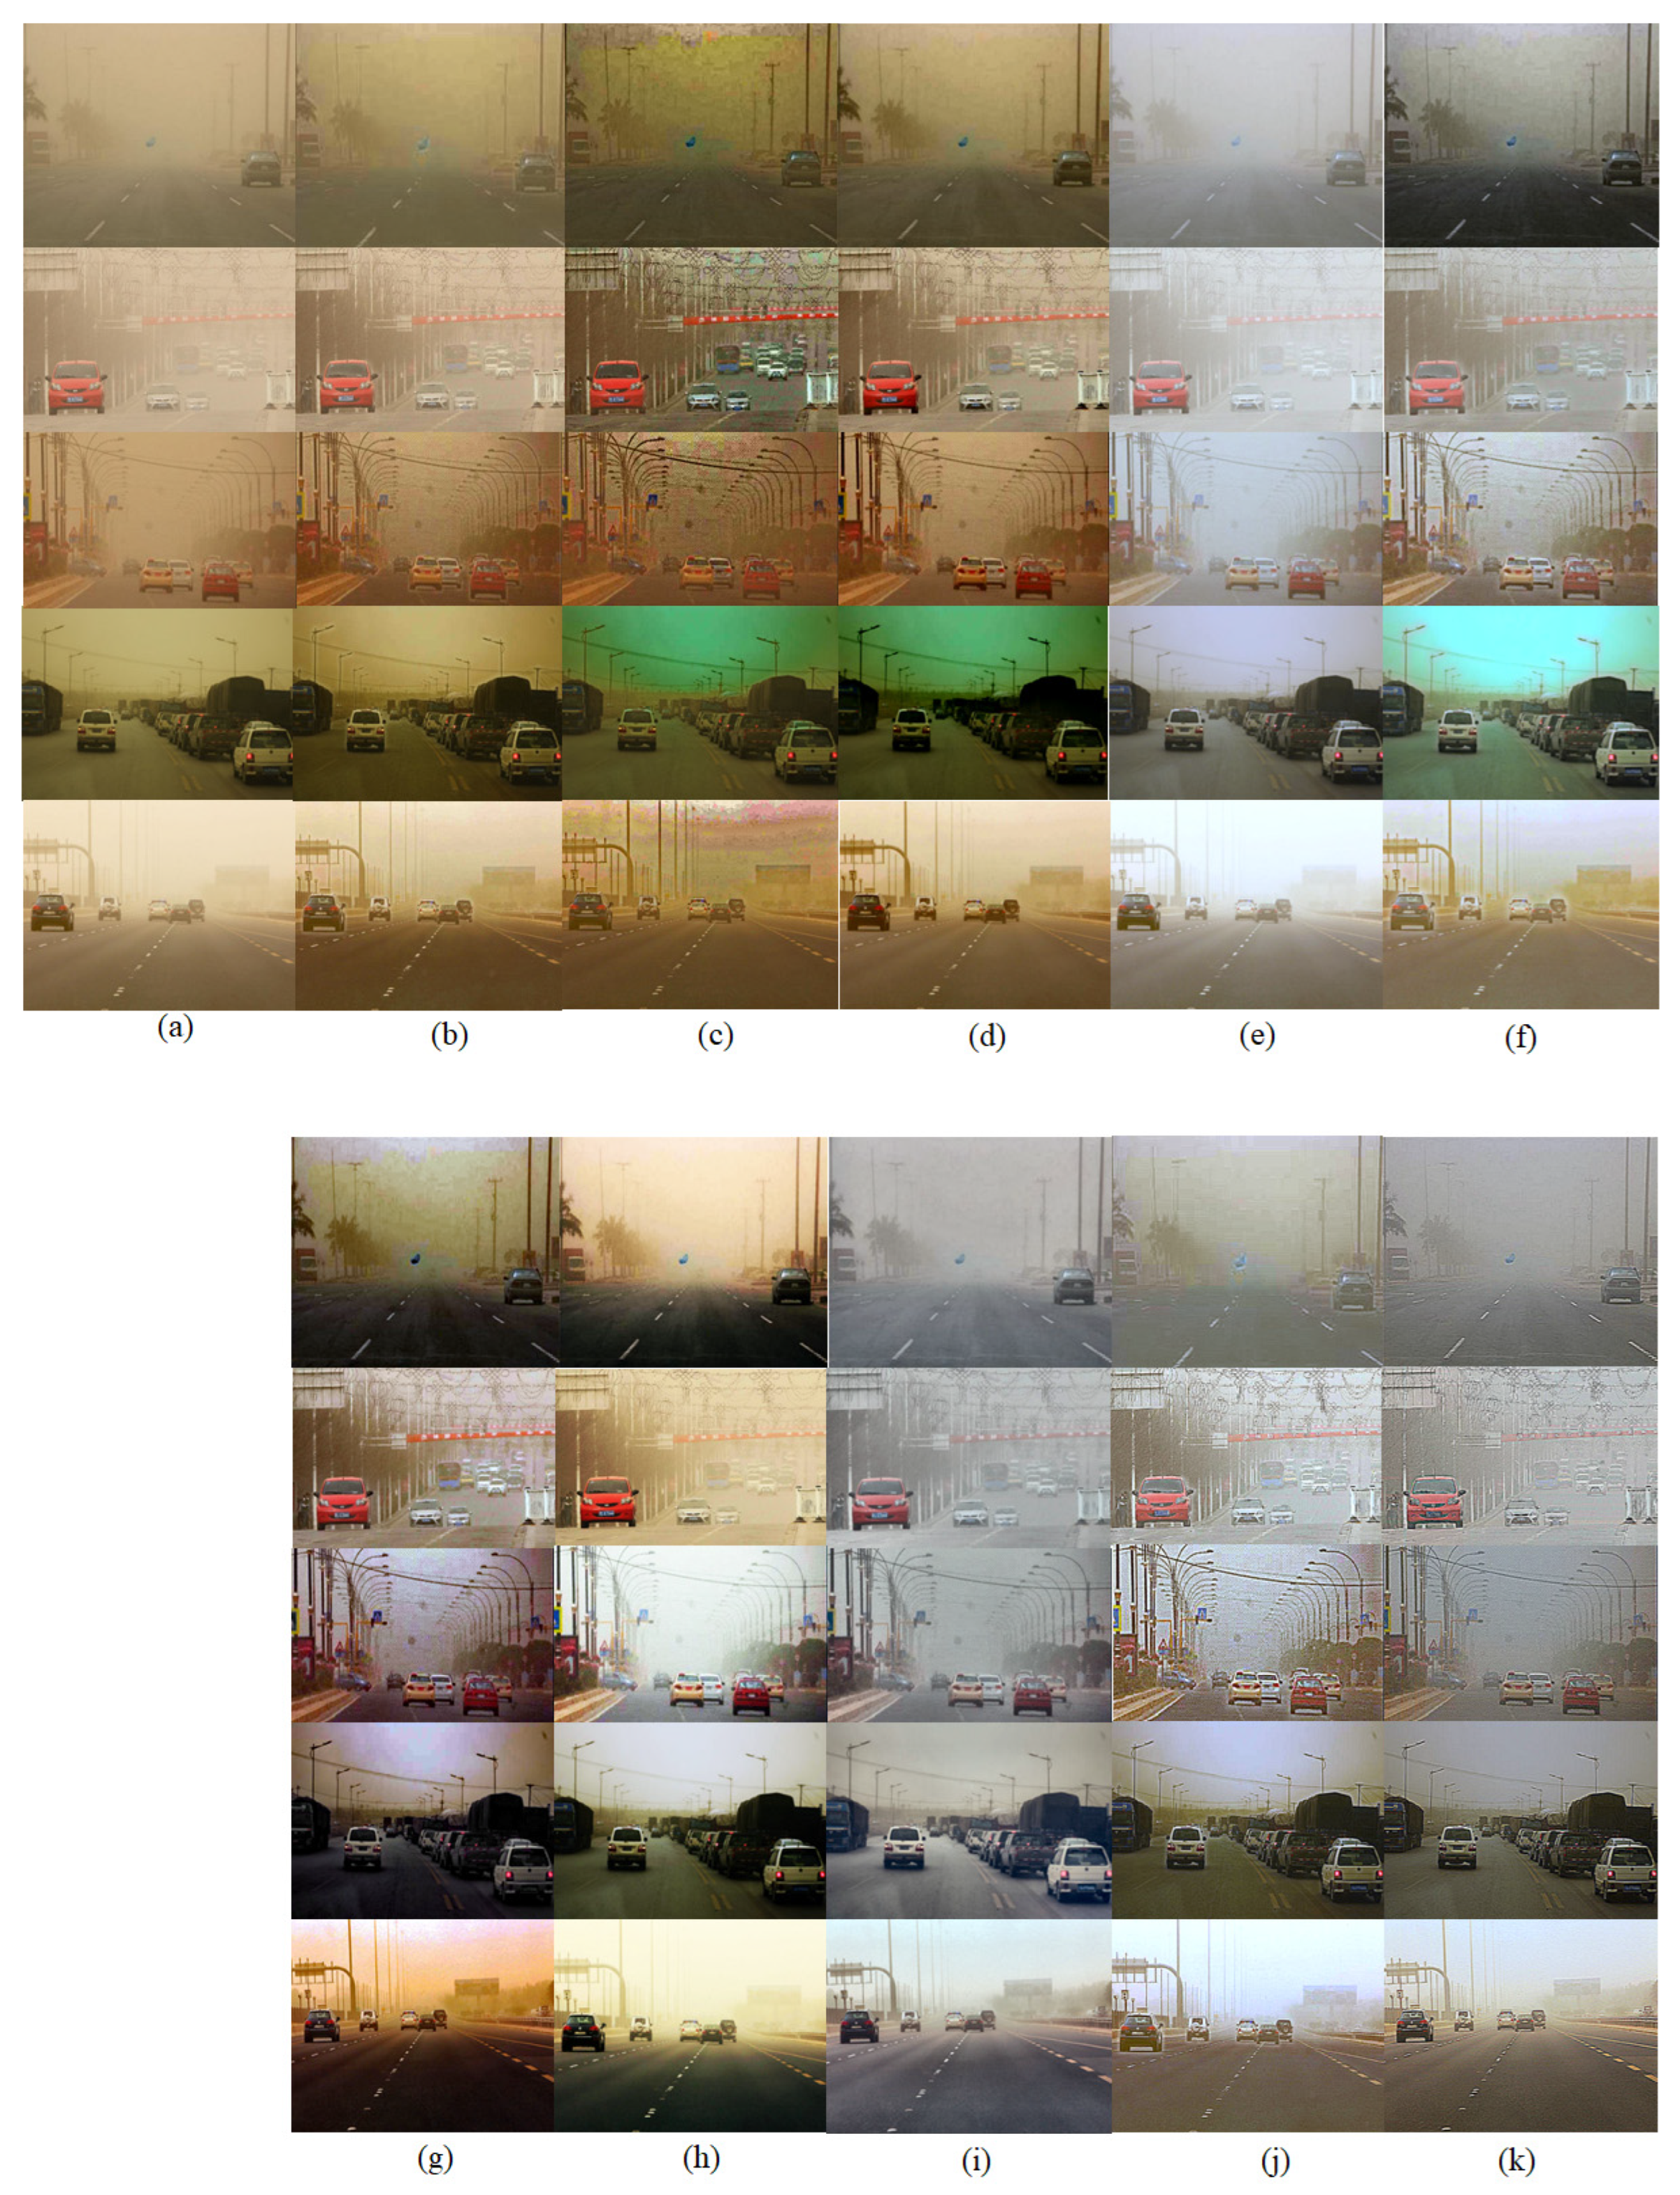
Figure 10 and Figure 11 show the lightly degraded sandstorm images and greatly distorted sandstorm images, as well as the improved images produced using the proposed method and state-of-the-art methods. He et al.’s method [1] improves the lightly degraded sandstorm images; however, in the case of the greatly degraded sandstorm images, the enhanced images demonstrate a color shift and an artificial effect. The enhanced images produced using Meng et al.’s [11] method have an artificial effect as well as a color shift and a ringing effect. Ren et al.’s [17] method improves the sandstorm images in the case of light degradation. However, in most of the degraded sandstorm images, the enhanced images have a greenish color shift and an artificial effect. Gao et al.’s method [13] enhances both the lightly and greatly degraded sandstorm images. Shi et al.’s [12] method enhances the sandstorm images; however, the enhanced images have a color shift and an artificial region due to the dehazing procedure as well as the transmission map. Al Ameen’s [9] method enhances the sandstorm images in case of lightly degraded sandstorm images. However, in the case of greatly degraded sandstorm images, the enhanced images have a color shift because this method uses a constant value to correct the color, and this causes the new color-distorted region. The enhanced images produced using Dhara et al.’s method [15] have an artificial color in some images owing to this method not sufficiently reflecting sandstorm images’ features. The enhanced images produced by Lee’s method [16] have a bright area in some cases due to the red channel being abundant and that of the eigenvalue also being more abundant than others. The enhanced images produced using Shi et al.’s method [10] have a bluish color in some images due to the mean shift of color components. Meanwhile, the enhanced images produced using the proposed method have no color shift or artificial regions.
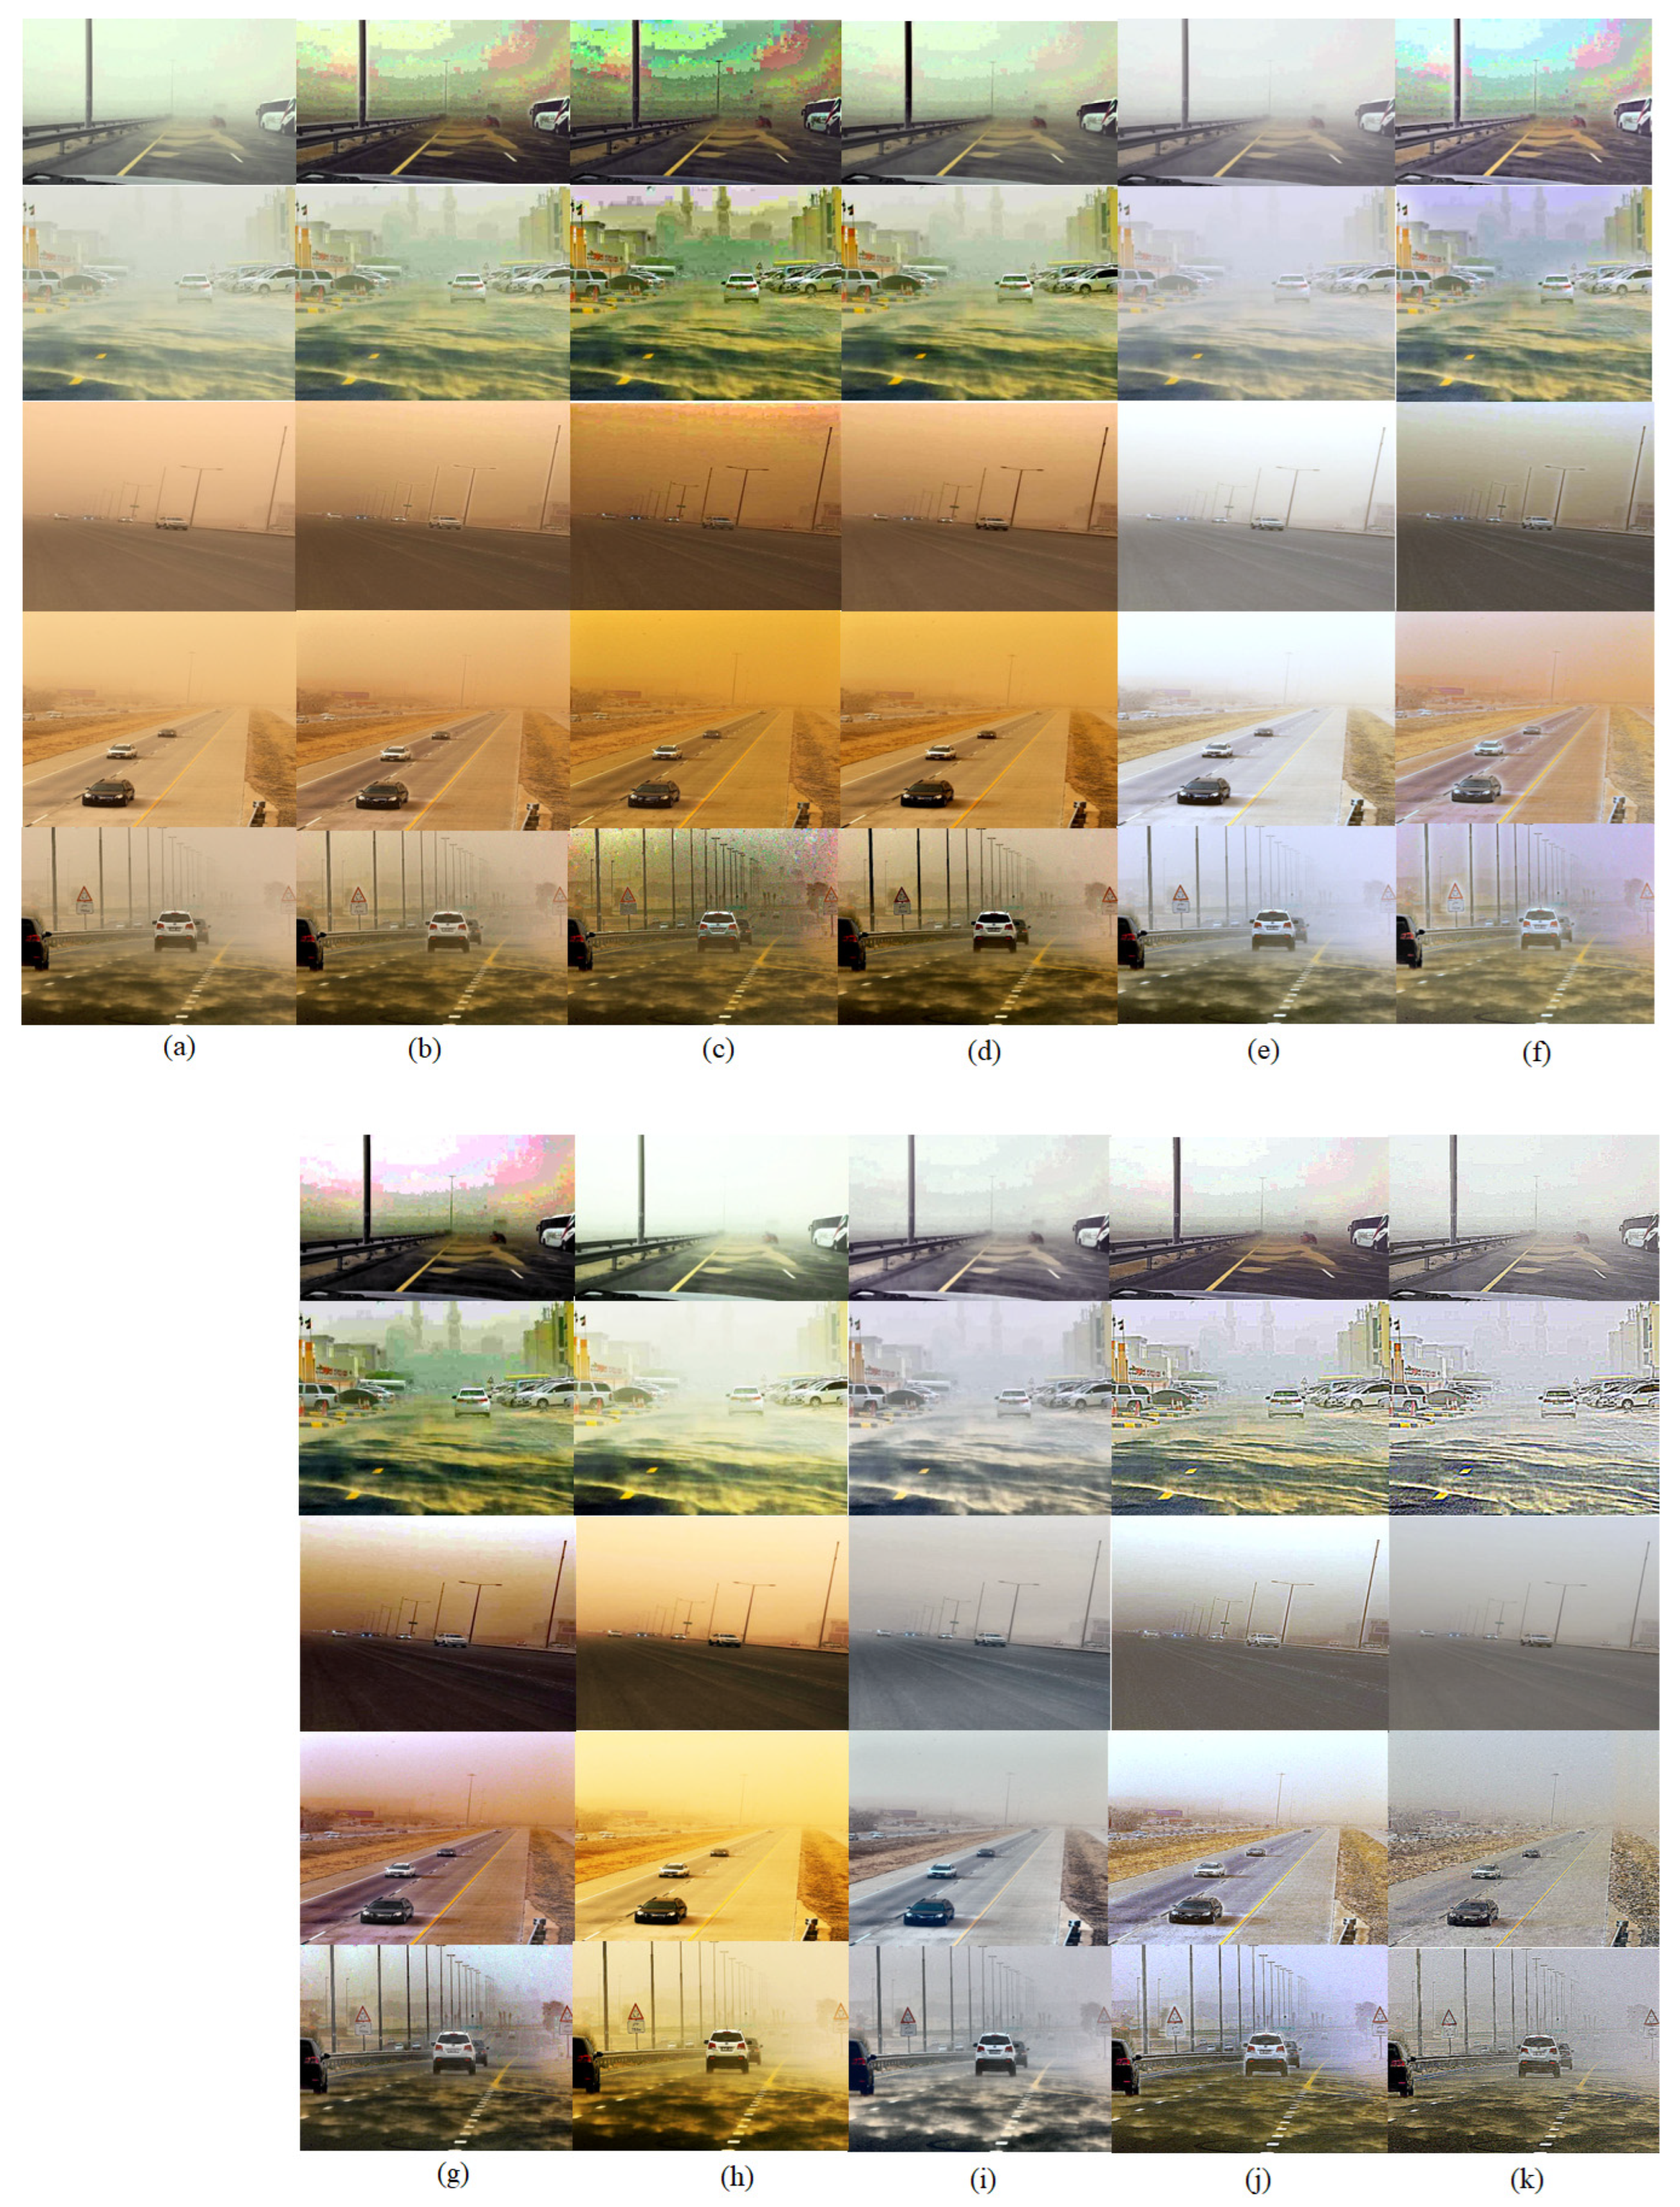
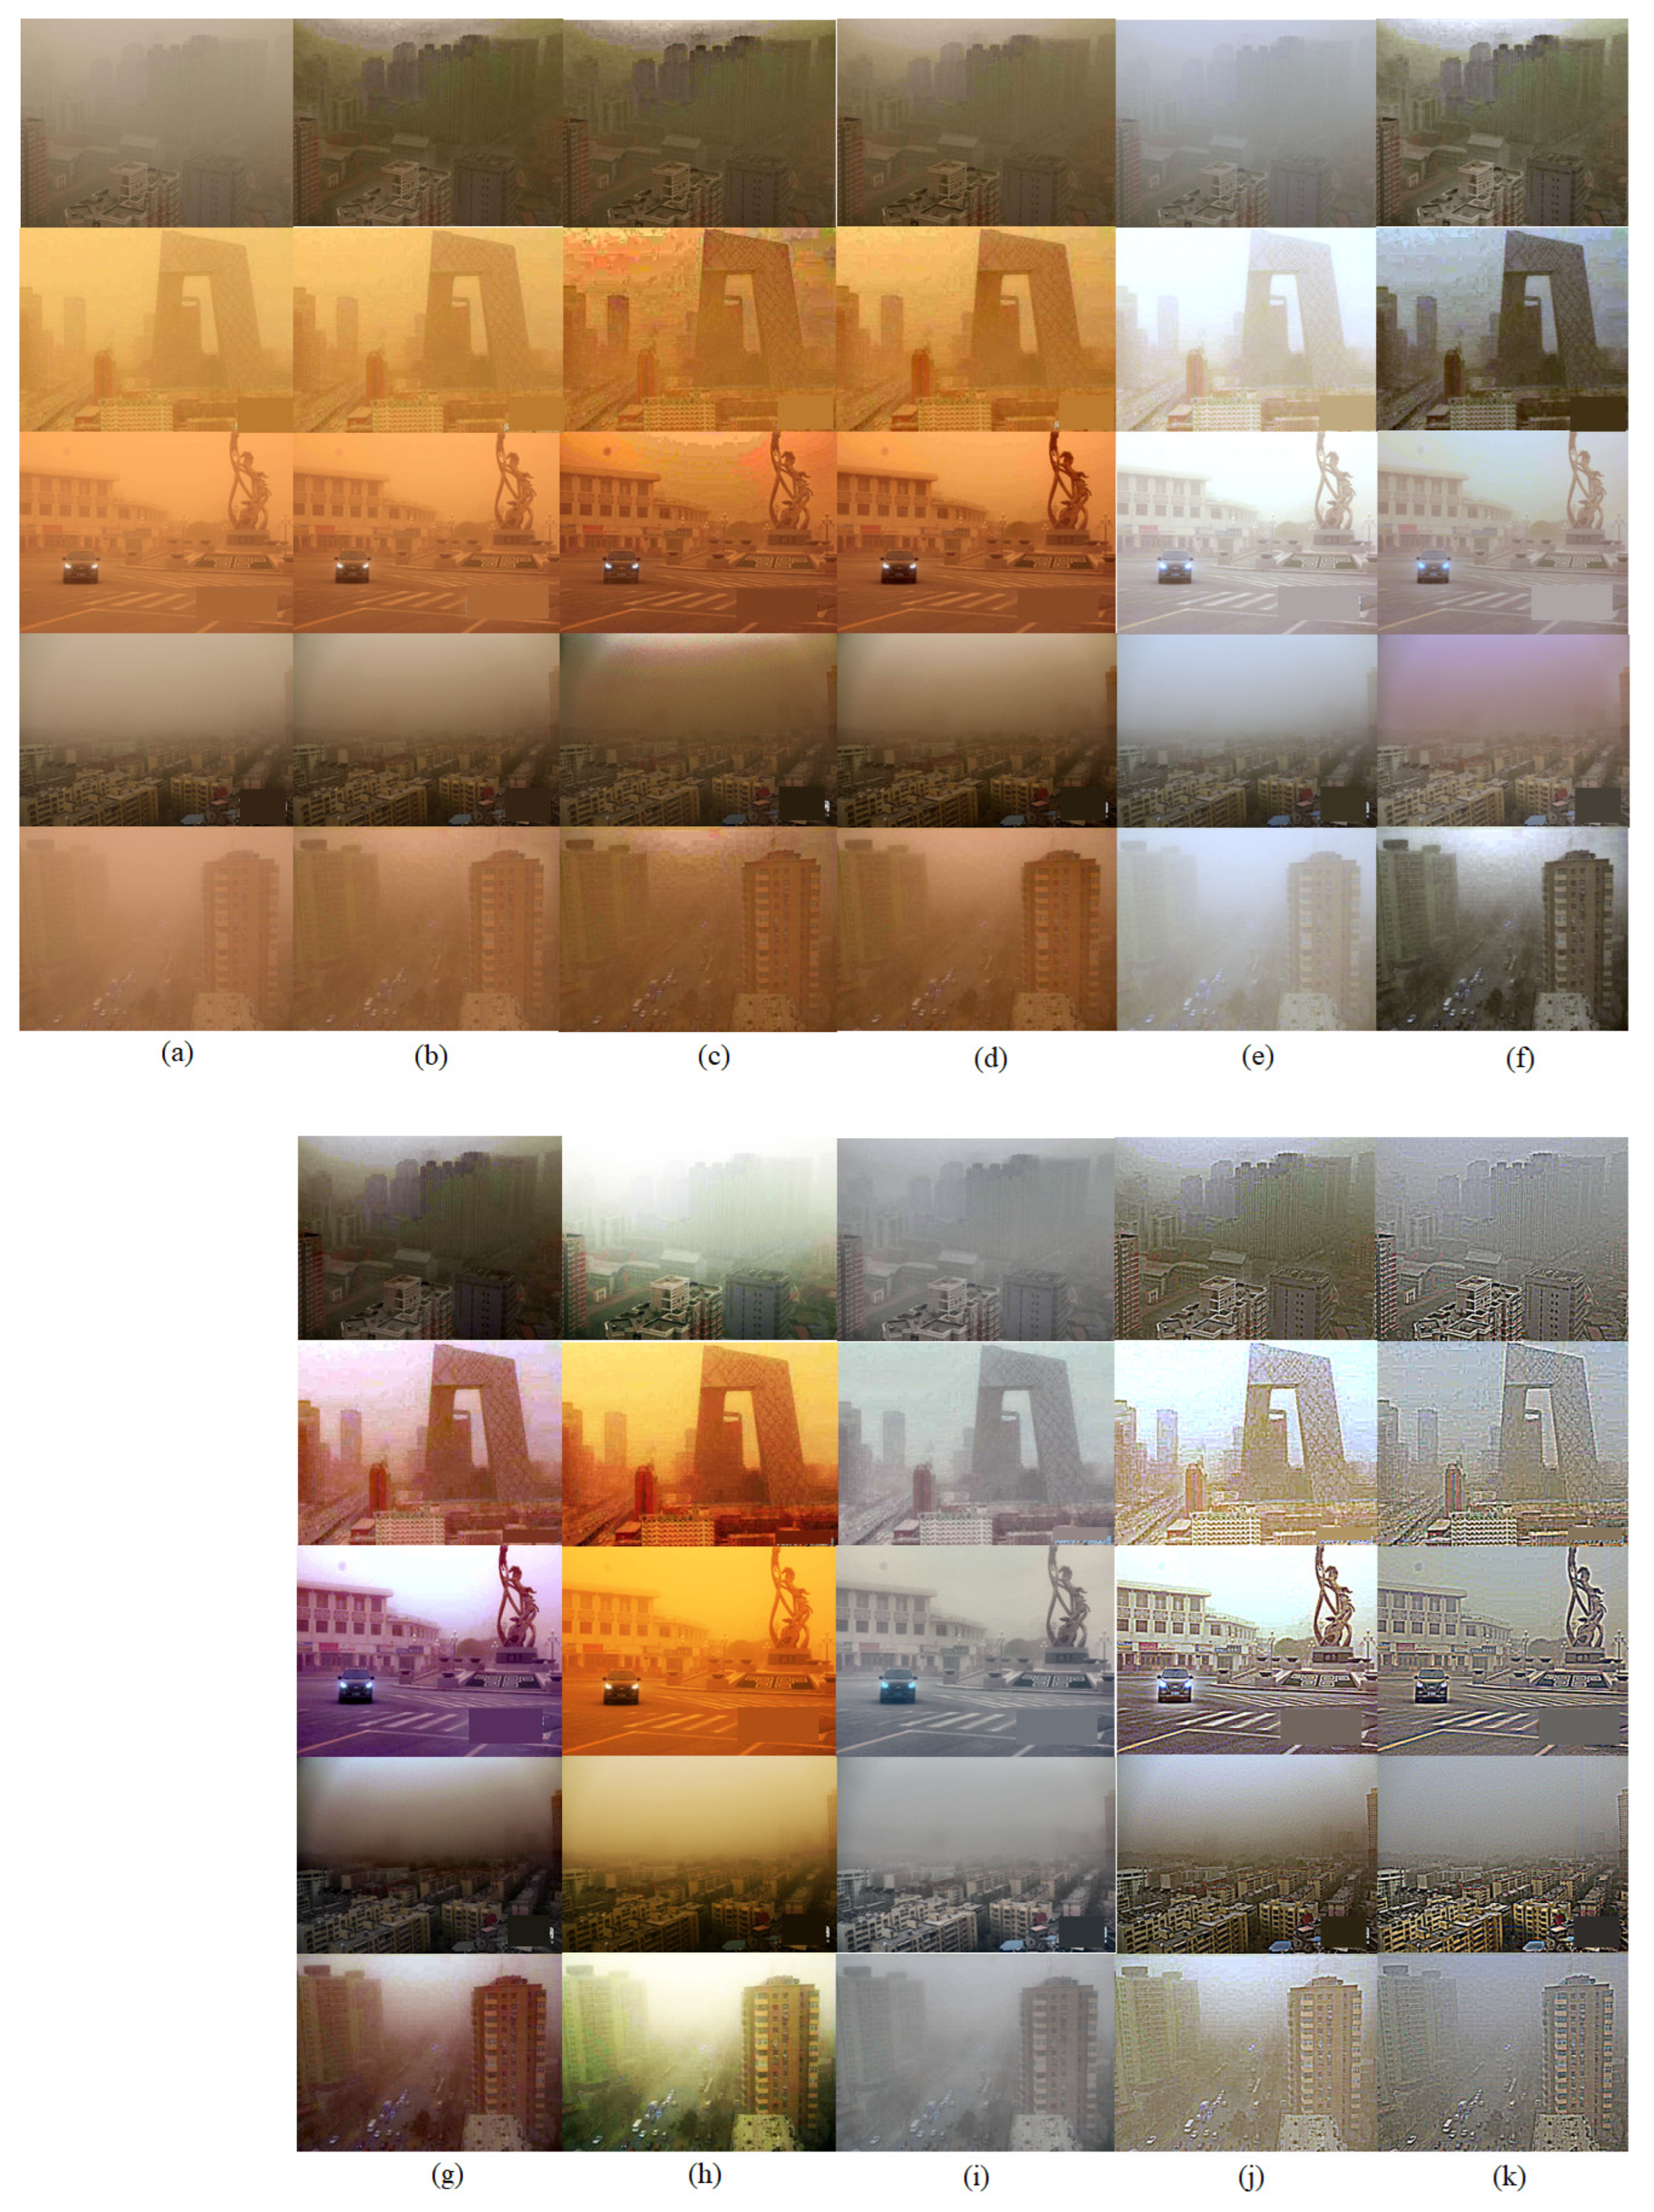
Figure 12 and Figure 13 show the degraded sandstorm images and enhanced images produced using the proposed method and state-of-the-art methods. The enhanced images produced using the He et al. [1] method have a color shift and ringing effect, and the degraded color is still present because this method has no color balancing procedure. Meng et al.’s [11] method enhances sandstorm images in the case of lightly degraded sandstorm images. In the case of greatly distorted sandstorm images, the enhanced images produced using Meng et al.’s [11] method have an artificial color shift and a ringing effect because this method lacks a color correction procedure. The enhanced images produced using Ren et al.’s [17] method have a color shift and an artificial ringing effect, and color degradation occurs still because this method has no color balancing procedure. The Gao et al. [13] method enhances sandstorm images naturally without a color shift. However, the enhanced images display bright regions. The Shi et al. [12] method enhances the distorted sandstorm images. However, the ringing effect and distorted areas occur due to the dehazing procedure as well as the transmission map. The Al Ameen [9] method enhances sandstorm images in case of lightly degraded sandstorm images, because this method has no image-adaptive color correction procedure and uses a constant value to correct the image’s color. The Shi et al. method [10] improves sandstorm images naturally; however, in some images, a blueish artificial color is present. Lee’s method [16] enhances the degraded sandstorm images naturally; however, a bright region is present and it looks unnatural. Dhara et al.’s method [15] enhances the sandstorm images; however, degraded color is present in some images due to this method not being able to reflect the sandstorm images’ features.
As shown in Figure 8, Figure 9, Figure 10, Figure 11, Figure 12 and Figure 13, to enhance the degraded sandstorm images naturally, the image adaptive color correction procedure and the dehazing procedure are needed. The proposed method enhances the degraded sandstorm images naturally in both lightly degraded sandstorm images and greatly degraded sandstorm images without any color shift or artificial regions. Therefore, the improved performance of the proposed method in the sandstorm image enhancement field is superior compared to that of state-of-the-art methods subjectively.

3.3. Objective Comparison

The enhanced sandstorm images are compared in Figure 5, Figure 6, Figure 7, Figure 8, Figure 9, Figure 10, Figure 11, Figure 12 and Figure 13. As shown in Figure 5, Figure 6, Figure 7, Figure 8, Figure 9, Figure 10, Figure 11, Figure 12 and Figure 13, the proposed method has good subjective performance in the sandstorm image enhancement field. This section presents the objective comparison of the enhanced images produced using the proposed method and state-of-the-art methods. To assess the performance, this paper use three metrics, namely UIQM [27], NIQE [28], and FADE [29]. The UIQM [27] measure is used in the enhanced underwater image assessment area. Sandstorm and underwater images have similar features, such as color distortion. Underwater images have a blueish or greenish color distortion due to light attenuation. Additionally, sandstorm images have reddish or yellowish color degradation owing to color channel attenuation because of light being scattered by sand particles. Because underwater images have similar features to sandstorm images, for this reason, this paper assessed the enhanced sandstorm images using the UIQM measure [27]. The UIQM [27] measure indicates the image’s sharpness, contrast, and colorfulness. If the score is high, then the enhanced image has high quality. The NIQE [28] measure indicates how natural an image is using the image’s statistical features such as the Gaussian total variation. If the enhanced image has good quality, then the NIQE [28] has a low score. The FADE [29] score reflects how hazy the enhanced image is. If the score is lower, then the enhanced image is less hazy, and vice versa.
Table 1, Table 2 and Table 3 show the NIQE [28] scores for Figure 8 and Figure 9. Table 1 shows the NIQE [28] scores for Figure 8 and Figure 9. He et al.’s [1] method has a lower NIQE score than Gao et al.’s [13] method, although the enhanced images produced, using He et al.’s [1] method, have a color shift and ringing effect; however, the enhanced images are less hazy than those produced using Gao et al.’s method [13], and therefore, the NIQE score of He et al.’s [1] method is less than that of Gao et al.’s method [13]. Gao et al.’s method [13] has a higher NIQE score than that of Al Ameen’s [9] method. Although the enhanced images produced using Gao et al.’s [13] method have no color shift, they are hazier than those produced using Al Ameen’s method [9]. Therefore, the NIQE score of Gao et al.’s [13] method is higher than that of Al Ameen’s method [9]. Meng et al.’s method [11] has a lower NIQE score than that of Shi et al.’s method [10], as although the enhanced images produced using Meng et al.’s [11] method have a distorted color, they are less hazy than those produced using Shi et al.’s method [12]. Shi et al.’s [12] method has a higher NIQE score than that of Ren et al.’s method [17], although the enhanced images produced using Ren et al.’s method [17] have a color shift. Lee’s method [16] has a lower NIQE score than that of Shi et al.’s [10] method, although the enhanced images produced using the Lee method [16] have a bright region, because the enhanced images have no artificial color cast. Dhara et al.’s method [15] has a lower NIQE score than that of Gao et al.’s [13] method because the enhanced images produced using Dhara et al.’s method [15] are less hazy than those produced using Gao et al.’s [13] method. Shi et al.’s [10] method has a higher NIQE score than that of Meng et al.’s [11] method, although the enhanced images produced using Shi et al.’s method [10] have less color cast than those produced using Meng et al.’s [11] method, because the improved images produced using Meng et al.’s [11] method are less hazy than those produced using Shi et al.’s [10] method. Meanwhile, the enhanced images produced using the proposed method have a lower NIQE score than those produced using the existing methods because the enhanced images produced by the proposed method have no color shift or ringing effect.
Table 2 shows the NIQE [28] scores for Figure 10 and Figure 11. He et al.’s method [1] has a lower NIQE score than that of the Gao et al. [13] method. Although the enhanced images produced using the He et al. [1] method have a color shift and ringing effect, because they are less hazy than those produced using Gao et al.’s [13] method, the NIQE score is lower than that of Gao et al.’s method [13]. Gao et al.’s [13] method has a higher NIQE score than that of Al Ameen’s method, although the enhanced images produced using Al Ameen’s method [9] have a color shift. Because the enhanced images produced by Al Ameen’s method [9] are less hazy than those produced using Gao et al.’s method [13], this is reflected in the NIQE score. The enhanced images produced using Meng et al.’s [11] method have a lower NIQE score than those produced using Shi et al.’s method [12]. Although the enhanced images using Meng et al.’s method [11] have a color shift, because the enhanced images produced using Meng et al.’s [11] method are less hazy than those produced using Shi et al.’s method [12], the NIQE score is lower than that of Shi et al.’s method [12]. The Shi et al. method [12] has a lower NIQE score than that of Ren et al.’s [17] method in some image. The enhanced images produced using Ren et al.’s [17] method have a lower NIQE score than those produced using Gao et al.’s method [13] in some image, although the enhanced images produced using the Ren et al. method [17] have a color shift, because the enhanced images are less hazy, and so the NIQE score is less than that of Gao et al.’s method [13] in some image. Lee’s [16] method has a lower NIQE score than that of Gao et al.’s [13] method because the enhanced images produced using Lee’s method [16] are less hazy than those produced using Gao et al.’s method [13]. Shi et al.’s [10] method has a higher NIQE score than that of Meng et al.’s method [11] in some image, although the enhanced images produced using Shi et al.’s [10] method have a less artificial color cast than those produced using Meng et al.’s method [11], because the enhanced images are hazier than those produced using Meng et al.’s method [11]. Meanwhile, the enhanced images produced using the proposed method have a lower NIQE score than those produced using other methods, because the enhanced images produced using the proposed method have no color shift and ringing effect.
Table 3 shows the NIQE scores for Figure 12 and Figure 13. He et al.’s method [1] has a lower NIQE score than that of the Gao et al. method [13] because the enhanced images produced, using He et al.’s method [1], are less hazy than those produced using the Gao et al. method [13]. The Al Ameen method [9] has a higher NIQE score than that of the Meng et al. [11] method in some image, although the enhanced images produced using the Meng et al. method [11] have a color shift. The Meng et al. method [11] has a lower NIQE score than that of the Shi et al. [12] method in some image, although the enhanced images using the Meng et al. [11] method have a color shift, because the enhanced images produced using the Meng et al. [11] method are less hazy than those produced using the Shi et al. method [12]. The enhanced images produced using the Ren et al. method [17] have a lower NIQE score than those produced using the Gao et al. method [13] because the enhanced images produced using the Gao et al. method [13] are hazier than those produced using the Ren et al. method [17]. Lee’s method [16] has a lower NIQE score than that of the Shi et al. method [10]. Shi et al.’s method [10] has a lower NIQE score than that of the Gao et al. method [13] because the enhanced images produced using the Shi et al. method [10] are less hazy than those produced using the Gao et al. [13] method. Dhara et al.’s method [15] has a lower NIQE score than that of the Al Ameen method [9] because the enhanced images produced using Dhara et al.’s [15] method have less color casting than those produced using the Al Ameen method [9]. Meanwhile, the enhanced images produced using the proposed method have a lower NIQE score than those of other methods because the enhanced images produced by the proposed method have no color shift and ringing effect.
As shown in Table 1, Table 2 and Table 3, to enhance sandstorm images naturally, image color balancing and hazy components are considered.
Table 4 shows the average NIQE [28] scores for Figure 8, Figure 9, Figure 10, Figure 11, Figure 12 and Figure 13 and the DAWN dataset [25] and WEAPD [26]. As shown in Table 4, although the existing dehazing methods cause a color shift, because the enhanced images are less hazy than those produced using the sandstorm image enhancement methods, these methods have a lower NIQE score than those of the existing sandstorm image enhancement methods.
Table 5, Table 6 and Table 7 show the UIQM [27] scores for Figure 8, Figure 9, Figure 10, Figure 11, Figure 12 and Figure 13. If the image is enhanced well, the UIQM score is high.
Table 5 shows the UIQM scores for Figure 8 and Figure 9. He et al.’s method [1] has a higher UIQM score than that of Gao et al.’s [13] method, although the enhanced images produced using He et al.’s method [1] have a color shift, because the enhanced images are less hazy than those produced using the Gao et al. method [13]. The enhanced images produced using the Al Ameen method [9] have a higher UIQM score than those produced using the Gao et al. method [13], as although the enhanced images produced using the Al Ameen method [9] have color distortion, the hazy effect in the enhanced images is less pronounced than that seen in those produced using the Gao et al. method [13]. Meng et al.’s method [11] has a higher UIQM score than that of the Al Ameen method [9] in some image, as although the enhanced images have a color shift, the hazy effect is less pronounced than that seen in those produced using the Al Ameen method [9]. Shi et al.’s method [12] has a lower UIQM score than that of Ren et al.’s method [17] in some image, although the enhanced images produced using Ren et al.’s method [17] have a color shift, because the hazy effect is less pronounced than that seen in those produced using Shi et al.’s method [12]. Lee’s method [16] has a higher UIQM score than that of Gao et al.’s [13] method because the enhanced images produced using Lee’s method [16] are less hazy than those produced using Gao et al.’s [13] method. Shi et al.’s method [10] has a lower UIQM score than that of Ren et al.’s [17] method in some image, although the enhanced images using Ren et al.’s method [17] have an artificial color because the hazy effect is less pronounced than that seen in those produced using Shi et al.’s method [10]. Dhara et al.’s method [15] has a higher UIQM score than that of Meng et al.’s [11] method because Dhara et al.’s method [15] produces enhanced images with a less pronounced color cast than those produced using Meng et al.’s method [11]. Meanwhile, the enhanced images produced using the proposed method have a higher UIQM score than those produced using the other methods because the enhanced images produced by the proposed method have no color shift or ringing effect.
Table 6 shows the UIQM scores [27] for Figure 10 and Figure 11. He et al.’s [1] method has a higher UIQM score than that of Geo et al.’s method [13], although the enhanced images produced, using He et al.’s [1] method, have color distortion because the hazy effect is less produced than that seen in those produced using Gao et al.’s method [13]. Al Ameen’s method [9] has a higher UIQM score than that of Meng et al.’s method [11] in some image because the UIQM score reflects the image’s colorfulness, contrast, and sharpness. Meng et al.’s method [11] has a lower UIQM score than that of Al Ameen’s method [9] in some image because the enhanced images produced using Meng et al.’s method [11] have a color shift. Shi et al.’s method [12] has a higher UIQM score than that of Meng et al.’s method [11] in some image because the enhanced images using Shi et al.’s method [12] have less color shift than those produced using Meng et al.’s method [11]. Ren et al.’s method [17] has a lower UIQM score than that of Shi et al.’s method [12] in some image because the UIQM score reflects the image’s colorfulness, and the enhanced images produced using Ren et al.’s [17] method demonstrate a color shift. Lee’s method [16] has a higher UIQM score than that of Dhara et al.’s [15] method because the enhanced images produced using Lee’s method [16] have less color cast. The Dhara et al. method [15] has a higher UIQM score than that of Meng et al.’s [11] method because the enhanced images produced using Dhara et al.’s method [15] have less color cast. Shi et al.’s method [10] has a higher UIQM score than that of Gao et al.’s [13] method because the enhanced images using Shi et al.’s method [10] are less hazy than those produced using Gao et al.’s method [13]. Meanwhile, the enhanced images produced by the proposed method have a higher UIQM score than those produced using other methods because the enhanced images produced using the proposed method have no color distortion or ringing effect.
Table 7 shows the UIQM [27] scores for Figure 12 and Figure 13. He et al.’s [1] method has a higher UIQM score than that of Gao et al.’s method [13] because the hazy effect in the enhanced images by He et al. method [1] is less pronounced than that seen in those produced using the Gao et al. method [13]. Al Ameen’s method [9] has a higher UIQM score than that of the He et al. [1] and Gao et al. [13] methods. Although the enhanced images produced using the Al Ameen method [9] have color distortion, the hazy effect is less pronounced than that seen in the enhanced images produced using the Gao et al. method [13], and the color distortion is less than that seen in those produced using the He et al. method [1]. Meng et al.’s method [11] has a higher UIQM score than that of the Gao et al. method [13], although the enhanced images produced using Meng et al.’s method [11] have color degradation, because the enhanced images are less hazy than those produced using the Gao et al. method [13]. The enhanced images produced using Shi et al.’s method [12] have a higher UIQM score than those produced using Meng et al.’s method [11] in some image because the enhanced images produced by means of the Shi et al. method [12] have less color shift than those produced using the Meng et al. method [11]. The enhanced images produced by means of the Ren et al. method [17] have a higher UIQM score than those produced using the Gao et al. method [13], although the enhanced images produced using the Ren et al. method [17] have color distortion, because the enhanced images are less hazy than those produced using the Gao et al. method [13]. Lee’s method [16] has a higher UIQM score than that of the Gao et al. method [13] because the enhanced images produced using Lee’s method [16] are less hazy. Shi et al.’s method [10] has a lower UIQM score than that of Meng et al.’s method [11], although the enhanced images produced using Shi et al.’s method [10] have less color cast than those produced using the Meng et al. method [11], because they are hazier. Dhara et al.’s method [15] has a higher UIQM score than that of Meng et al.’s method [11] because the enhanced images using Dhara et al.’s [15] method have less color cast. Meanwhile, the enhanced images provided by the proposed method have a higher UIQM score than that of the other methods because the enhanced images produced using the proposed method have no color shift or ringing effect, and the enhanced images seem natural.
As shown in Table 5, Table 6 and Table 7, to enhance a sandstorm image naturally, the image’s colorfulness should be considered.
Table 8 shows the average UIQM scores [27] for Figure 8, Figure 9, Figure 10, Figure 11, Figure 12 and Figure 13, the DAWN dataset [25], and WEAPD [26]. The enhanced images using the Gao et al. method [13] have a lower UIQM score than that of the dehazing methods, although the enhanced images have no color distortion. Meanwhile, the proposed method has a higher UIQM score than that of the other methods because the enhanced images produced using the proposed method have no color distortion or ringing effect.
As shown in Table 8, to enhance a degraded sandstorm image naturally, the image’s colorfulness, sharpness, and contrast should be considered.
Table 9 shows the FADE [29] score for Figure 8 and Figure 9. He et al.’s method has a higher FADE score than that of Meng et al.’s method [11] because the Meng et al. method [11] has a more suitable refined transmission map. Meng et al.’s method [11] has a lower FADE score among the existing dehazing methods because this method has a refined transmission map. Ren et al.’s method [17] has a higher FADE score than that of Meng et al.’s method [11] because the enhanced images are hazier. Gao et al.’s method [13] has a higher FADE score than that of other methods because the enhanced images are too hazy. Shi et al.’s method [12] has a lower FADE score than that of Gao et al.’s method [13] because the enhanced images are less hazy. Lee et al.’s method [16] has a lower FADE score than that of Shi et al.’s method [12] because the enhanced images are less hazy. Dhara et al.’s method [15] has a lower FADE score than that of Gao et al.’s method [13] because the enhanced images produced using the Gao et al. method [13] are hazier. Shi et al.’s method [10] has a higher FADE score than that of Shi et al.’s method [12] because the enhanced images are hazier. Al Ameen’s method [9] has a lower FADE score than that of Gao et al.’s method [13], although the enhanced images have a color cast, because the hazy effect is less pronounced than that seen in those produced using the Gao et al. method [13]. Meanwhile, the proposed method has a lower FADE score than that of the other methods because the enhanced images produced using the proposed method have no color cast and the enhanced images are less hazy.
Table 10 shows the FADE [29] scores for Figure 10 and Figure 11. He et al. [1] has a lower FADE score than that of Gao et al.’s method [13], although the enhanced images produced using the He et al. method [1] have a color cast, because the enhanced images produced using the He et al. method [1] are less hazy than those produced using the Gao et al. method [13]. Meng et al.’s method [11] has a lower FADE score than that of the He et al. method [1] because the enhanced images are less hazy. Ren et al.’s method [17] has a lower FADE score than that of the Gao et al. method [13], although the enhanced images produced using the Ren et al. method [17] have a color cast, because the hazy effect is less pronounced. Gao et al.’s method [13] has a high FADE score, although the enhanced images have no color cast, because the hazy effect is more pronounced. Lee’s method [16] has a lower FADE score than that of the Gao et al. method [13] because the enhanced images are less hazy. Shi et al.’s [12] method has a lower FADE score than that of the Gao et al. method [13] because the enhanced images are less hazy. Shi et al.’s method [10] has a higher FADE score than that of the other dehazing methods, although the enhanced images have no color cast, because the enhanced images are hazier. Dhara et al.’s method [15] has a higher FADE score than that of Meng et al.’s method [11] because the enhanced images are hazier. However, the enhanced images using the proposed method have a lower FADE score than that of the other methods because the enhanced images produced using the proposed method have no color cast and are less hazy.
Table 11 shows the FADE [29] scores for Figure 12 and Figure 13. He et al.’s method [1] has a higher FADE score than that of Meng et al.’s method [11] because the Meng et al. method [11] has a refined transmission map and it provides a less hazy image. Meng et al.’s method [11] has a lower FADE score than that of the Ren et al. method [17] because the enhanced images using Meng et al.’s method [11] are less hazy. Ren et al.’s method [17] has a lower FADE score than that of He et al.’s method [1] because the enhanced images are less hazy. Gao et al.’s method [13] has a higher FADE score than that of the other methods, although the enhanced images have no color cast because the enhanced images have a hazy effect. Al Ameen’s method [9] has a lower FADE score than that of Gao et al.’s method [13], although the enhanced images have a color cast, because the hazy effect is less pronounced. Lee’s method [16] has a lower FADE score than that of the Gao et al. method [13] because the enhanced images are less hazy. Shi et al.’s method [12] has a higher FADE score than that of Al Ameen’s method [9], although the enhanced images have no color cast, because the hazy effect is more pronounced. Shi et al.’s method [10] has a higher FADE score than that of Meng et al.’s method [11], although the enhanced images have no color cast, because the hazy effect is more pronounced. Dhara et al.’s method [15] has a lower FADE score than that of Gao et al.’s method [13], although the enhanced images have a color cast, because the enhanced images are less hazy. Meanwhile, the enhanced images produced using the proposed method have a lower FADE score than that of the other methods because the enhanced images produced using the proposed method have no color cast and are less hazy.
Table 12 shows the average FADE [29] score for Figure 8, Figure 9, Figure 10, Figure 11, Figure 12 and Figure 13, the DAWN dataset [25], and WEAPD [26]. The existing dehazing methods have lower FADE scores than those of the sandstorm image enhancement methods, although the enhanced images have a color cast. Meanwhile, the enhanced images produced using the proposed method have a lower FADE score than that of other methods because the enhanced images have no color cast and are less hazy.
As shown in Figure 8, Figure 9, Figure 10, Figure 11, Figure 12 and Figure 13 and Table 1, Table 2, Table 3, Table 4, Table 5, Table 6, Table 7, Table 8, Table 9, Table 10, Table 11 and Table 12, the performance of the proposed method in the sandstorm image enhancement field is superior compared to that of other existing methods.
The experimental setup consisted of an Intel® Core™ i7-8700 CPU @ 3.20GHz, 32 GB RAM, GeForce GTX 1650 4 GB GPU.

4. Conclusions

Color-degraded sandstorm images caused by the scattering of light by sand particles are compensated using the proposed method utilizing the recombined singular value based on rank. Additionally, the corrected image seems hazy. Therefore, to enhance the compensated image, this paper apply the dehazing procedure. Because the existing dehazing methods have artificial effects such as the ringing effect, this paper uses the guided image filter with the singular value ratio between the input and balanced images. The enhanced images using the proposed method have no color shift or ringing effect. The contribution of this paper to the sandstorm image enhancement field is that this paper enhances the degraded color channel using the image’s unique features such as the singular value, and in this way, the enhanced images can be used adaptively in various fields of degraded image enhancement, not only of sandstorm images but also any distorted image. Moreover, a strong point of this paper is that it can be applied to extensive image enhancement areas. However, its weak point is that in cases of densely dusty images, the dehazing effect is limited. To enhance sandstorm images more naturally and adaptively, future research should perform the estimation of the image adaptive dehazing procedure with transmission maps. Because the existing transmission map struggles to reflect the image’s features, such as bright regions and distance, the key point of future research is estimating the image adaptive transmission map, which includes distinguishing dark and bright regions in addition to distance to enhance the image naturally. Moreover, the image adaptive color balancing procedure could be performed to enhance color-degraded images with a reddish, yellowish, or bluish color cast and make these images seem natural.

Funding

This research received no external funding.

Conflicts of Interest

The author declares no conflict of interest.

References

  1. He, K.; Sun, J.; Tang, X. Single image haze removal using dark channel prior. IEEE Trans. Pattern Anal. Mach. Intell. 2010, 33, 2341–2353. [Google Scholar] [PubMed]
  2. Fattal, R. Single image dehazing. ACM Trans. Graph. (TOG) 2008, 27, 1–9. [Google Scholar] [CrossRef]
  3. Narasimhan, S.G.; Nayar, S.K. Chromatic framework for vision in bad weather. In Proceedings of the IEEE Con-ference on Computer Vision and Pattern Recognition. CVPR 2000 (Cat. No. PR00662), Hilton Head, SC, USA, 15 June 2000; Volume 1. [Google Scholar]
  4. Narasimhan, S.G.; Nayar, S.K. Vision and the atmosphere. Int. J. Comput. Vis. 2002, 48, 233–254. [Google Scholar] [CrossRef]
  5. Tan, R.T. Visibility in bad weather from a single image. In Proceedings of the 2008 IEEE Conference on Computer Vision and Pattern Recognition, Anchorage, AK, USA, 23–28 June 2008; IEEE, 2008. [Google Scholar]
  6. Cheng, Y.; Jia, Z.; Lai, H.; Yang, J.; Kasabov, N.K. A Fast Sand-Dust Image Enhancement Algorithm by Blue Channel Compensation and Guided Image Filtering. IEEE Access 2020, 8, 196690–196699. [Google Scholar] [CrossRef]
  7. Huo, J.-Y.; Chang, Y.-L.; Wang, J.; Wei, X.-X. Robust Automatic White Balance Algorithm using Gray Color Points in Images. IEEE Trans. Consum. Electron. 2006, 52, 541–546. [Google Scholar] [CrossRef]
  8. He, K.; Sun, J.; Tang, X. Guided image filtering. IEEE Trans. Pattern Anal. Mach. Intell. 2012, 35, 1397–1409. [Google Scholar] [CrossRef]
  9. Al-Ameen, Z. Visibility enhancement for images captured in dusty weather via tuned trithreshold fuzzy intensifica-tion operators. Int. J. Intell. Syst. Appl. 2016, 8, 10. [Google Scholar]
  10. Shi, Z.; Feng, Y.; Zhao, M.; Zhang, E.; He, L. Normalised gamma transformation-based contrast-limited adaptive histogram equalisation with colour correction for sand–dust image enhancement. IET Image Process. 2020, 14, 747–756. [Google Scholar] [CrossRef]
  11. Meng, G.; Wang, Y.; Duan, J.; Xiang, S.; Pan, C. Efficient Image Dehazing with Boundary Constraint and Contextual Regularization. In Proceedings of the IEEE International Conference on Computer Vision, Sydney, Australia, 1–8 December 2013. [Google Scholar] [CrossRef]
  12. Shi, Z.; Feng, Y.; Zhao, M.; Zhang, E.; He, L. Let You See in Sand Dust Weather: A Method Based on Halo-Reduced Dark Channel Prior Dehazing for Sand-Dust Image Enhancement. IEEE Access 2019, 7, 116722–116733. [Google Scholar] [CrossRef]
  13. Gao, G.; Lai, H.; Jia, Z.; Liu, Y.Q.; Wang, Y. Sand-Dust Image Restoration Based on Reversing the Blue Channel Prior. IEEE Photonics J. 2020, 12, 1–16. [Google Scholar] [CrossRef]
  14. Naseeba, T.; Binu, H. KP Visibility Restoration of Single Hazy Images Captured in Real-World Weather Conditions. Int. Res. J. Eng. Technol. 2016, 3, 135–139. [Google Scholar]
  15. Dhara, S.K.; Roy, M.; Sen, D.; Biswas, P.K. Color Cast Dependent Image Dehazing via Adaptive Airlight Refinement and Non-Linear Color Balancing. IEEE Trans. Circuits Syst. Video Technol. 2020, 31, 2076–2081. [Google Scholar] [CrossRef]
  16. Lee, H.S. Efficient Sandstorm Image Enhancement Using the Normalized Eigenvalue and Adaptive Dark Channel Prior. Technologies 2021, 9, 101. [Google Scholar] [CrossRef]
  17. Ren, W.; Liu, S.; Zhang, H.; Pan, J.; Cao, X.; Yang, M.-H. Single Image Dehazing via Multi-scale Convolutional Neural Networks. In Proceedings of the European Conference on Computer Vision, Amsterdam, The Netherlands, 11–14 October 2016; Springer: Cham, Switzerland, 2016; pp. 154–169. [Google Scholar]
  18. Wang, A.; Wang, W.; Liu, J.; Gu, N. AIPNet: Image-to-Image Single Image Dehazing With Atmospheric Illumination Prior. IEEE Trans. Image Process. 2018, 28, 381–393. [Google Scholar] [CrossRef] [PubMed]
  19. Zhu, Q.; Mai, J.; Shao, L. A Fast Single Image Haze Removal Algorithm Using Color Attenuation Prior. IEEE Trans. Image Process. 2015, 24, 3522–3533. [Google Scholar] [CrossRef] [PubMed] [Green Version]
  20. Zhang, J.; Tao, D. FAMED-Net: A Fast and Accurate Multi-Scale End-to-End Dehazing Network. IEEE Trans. Image Process. 2019, 29, 72–84. [Google Scholar] [CrossRef] [PubMed] [Green Version]
  21. Tripathi, P.; Garg, R.D. Comparative analysis of singular value decomposition and eigen value decompo-sition based principal component analysis for earth and lunar hyperspectral image. In Proceedings of the 2021 11th Workshop on Hyperspectral Imaging and Signal Processing: Evolution in Remote Sensing (WHISPERS), Amsterdam, The Netherlands, 24–26 March 2021; IEEE, 2021. [Google Scholar]
  22. Li, P.; Wang, H.; Li, X.; Zhang, C. An image denoising algorithm based on adaptive clustering and singular value decomposition. IET Image Process. 2021, 15, 598–614. [Google Scholar] [CrossRef]
  23. Goldstein, E.B. Sensation and Perception; Walsworth Publishing Company: Marceline, MO, USA, 1980. [Google Scholar]
  24. Preetham, A.J.; Shirley, P.; Smits, B. A practical analytic model for daylight. In Proceedings of the 26th Annual Conference on Computer Graphics and Interactive Techniques, Los Angeles, CA, USA, 8–13 August 1999. [Google Scholar]
  25. Kenk, M.A.; Hassaballah, M. DAWN: Vehicle detection in adverse weather nature dataset. arXiv 2020, arXiv:2008.05402. [Google Scholar]
  26. Xiao, H.; Zhang, F.; Shen, Z.; Wu, K.; Zhang, J. Classification of Weather Phenomenon from Images by Using Deep Convolutional Neural Network. Earth Space Sci. 2021, 8, e2020EA001604. [Google Scholar] [CrossRef]
  27. Panetta, K.; Gao, C.; Agaian, S. Human-Visual-System-Inspired Underwater Image Quality Measures. IEEE J. Ocean. Eng. 2015, 41, 541–551. [Google Scholar] [CrossRef]
  28. Mittal, A.; Soundararajan, R.; Bovik, A.C. Making a “completely blind” image quality analyzer. IEEE Signal Processing Lett. 2012, 20, 209–212. [Google Scholar] [CrossRef]
  29. Choi, L.K.; You, J.; Bovik, A.C. Referenceless Prediction of Perceptual Fog Density and Perceptual Image Defogging. IEEE Trans. Image Process. 2015, 24, 3888–3901. [Google Scholar] [CrossRef] [PubMed]
Figure 1. The distribution of the singular value on each color channel of a color distortion image and dusty image (the tables below the image show the singular value of each color channel, and MSV is the maximum singular value): (a) dusty input image and each color channel; (b) color-distorted image and each color channel.
Symmetry 14 01501 g001
Figure 2. The diagram of the proposed method.
Symmetry 14 01501 g002
Figure 3. The distribution of singular value each color channel of input images and enhanced images by the proposed method (the tables below the image show the singular value of each color channel and MSV is the maximum singular value): (a,c) input images and each color channel; (b,d) enhanced images and each color channel.
Symmetry 14 01501 g003
Figure 4. Comparison between the enhanced images produced using the DCP method [1] and the proposed method: (a) input images; (b) color-balanced images; (c) enhanced images produced using the DCP method [1]; (d) enhanced images produced using the proposed method.
Symmetry 14 01501 g004
Figure 5. The comparison of color correction using existing methods and the proposed method using the DAWN dataset [25]: (a) input; (b) Shi et al. [10]; (c) Shi et al. [12]; (d) Al Ameen [9]; (e) Lee [16]; (f) Proposed method.
Symmetry 14 01501 g005
Figure 6. The comparison of color correction using existing methods and the proposed method using the DAWN dataset [25], and WEAPD [26]: (a) input; (b) Shi et al. [10]; (c) Shi et al. [12]; (d) Al Ameen [9]; (e) Lee [16]; (f) Proposed method.
Symmetry 14 01501 g006
Figure 7. The comparison of color correction using existing methods and the proposed method using WEAPD [26]: (a) input; (b) Shi et al. [10]; (c) Shi et al. [12]; (d) Al Ameen [9]; (e) Lee [16]; (f) Proposed method.
Symmetry 14 01501 g007
Figure 8. Comparison of enhanced images produced using existing methods and the proposed method using the DAWN dataset [25]: (a) input; (b) He et al. [1]; (c) Meng et al. [11]; (d) Ren et al. [17]; (e) Gao et al. [13]; (f) Shi et al. [12]; (g) Dhara et al. [15]; (h) Al Ameen [9]; (i) Shi et al. [10]; (j) Lee [16]; (k) Proposed method.
Symmetry 14 01501 g008
Figure 9. The comparison of enhanced images using existing methods and the proposed method using the DAWN dataset [25]: (a) input; (b) He et al. [1]; (c) Meng et al. [11]; (d) Ren et al. [17]; (e) Gao et al. [13]; (f) Shi et al. [12]; (g) Dhara et al. [15]; (h) Al Ameen [9]; (i) Shi et al. [10]; (j) Lee [16]; (k) Proposed method.
Symmetry 14 01501 g009
Figure 10. The comparison of enhanced images using existing methods and the proposed method using the DAWN dataset [25]: (a) input; (b) He et al. [1]; (c) Meng et al. [11]; (d) Ren et al. [17]; (e) Gao et al. [13]; (f) Shi et al. [12]; (g) Dhara et al. [15]; (h) Al Ameen [9]; (i) Shi et al. [10]; (j) Lee [16]; (k) Proposed method.
Symmetry 14 01501 g010
Figure 11. The comparison of enhanced images using existing methods and the proposed method using WEAPD [26]: (a) input; (b) He et al. [1]; (c) Meng et al. [11]; (d) Ren et al. [17]; (e) Gao et al. [13]; (f) Shi et al. [12]; (g) Dhara et al. [15]; (h) Al Ameen [9]; (i) Shi et al. [10]; (j) Lee [16]; (k) Proposed method.
Symmetry 14 01501 g011
Figure 12. The comparison of enhanced images using existing methods and the proposed method using WEAPD [26]: (a) input; (b) He et al. [1]; (c) Meng et al. [11]; (d) Ren et al. [17]; (e) Gao et al. [13]; (f) Shi et al. [12]; (g) Dhara et al. [15]; (h) Al Ameen [9]; (i) Shi et al. [10]; (j) Lee [16]; (k) Proposed method.
Symmetry 14 01501 g012
Figure 13. The comparison of color correction using existing methods and the proposed method using WEAPD [26]: (a) input; (b) He et al. [1]; (c) Meng et al. [11]; (d) Ren et al. [17]; (e) Gao et al. [13]; (f) Shi et al. [12]; (g) Dhara et al. [15]; (h) Al Ameen [9]; (i) Shi et al. [10]; (j) Lee [16]; (k) Proposed method.
Symmetry 14 01501 g013
Table 1. The comparison of NIQE scores [28] for Figure 8 and Figure 9 (a lower score represents better enhancement).
[1][9][11][17][13][15][12][10][16]Proposed Method
19.76819.78919.69419.79819.88419.78819.66819.86319.53219.370
20.27120.16316.76619.47020.65819.29320.34319.37715.06413.787
18.59518.19316.99218.07418.95417.77218.16318.22016.21616.222
19.80019.88419.84919.94819.87119.74719.53919.56818.42516.931
20.30220.30820.22920.36420.45320.22320.26820.24218.33316.987
19.77819.75119.45119.79919.87119.61019.69919.78019.49719.339
20.59620.15020.51620.58720.59420.25120.45720.34820.37520.343
20.04320.07319.85320.15120.47619.94920.26320.17118.11916.591
19.79719.60718.72919.70119.70019.42419.65219.65317.31317.080
19.62419.41019.72319.86519.82519.55019.67419.54217.26016.001
AVG19.85719.73319.18019.77620.02919.56119.77319.67618.01317.265
Table 2. The comparison of NIQE scores [28] for Figure 10 and Figure 11 (a lower score represents better enhancement).
[1][9][11][17][13][15][12][10][16]Proposed Method
20.96021.58220.78721.48821.78621.15721.12921.36519.21817.678
21.70321.53220.75521.36122.34320.83421.48521.19816.79715.275
19.84819.91219.90919.86219.84819.74219.76819.83319.20918.501
19.02718.81118.97619.03818.99418.67519.21918.44815.54815.184
18.96919.08416.38018.80819.16518.09118.99418.60215.19514.932
20.30220.89320.98120.61721.40320.34319.81221.58018.85219.316
21.70521.00322.04721.69021.43320.92021.65121.41418.12817.838
22.25022.29022.04121.39821.14020.39521.80121.56815.85416.064
21.48420.98421.50621.21821.16721.06521.52521.61120.85821.001
20.11319.62420.77719.98820.20919.66119.64920.09918.60917.822
AVG20.63620.57220.41620.54720.74920.08820.50320.57217.82717.361
Table 3. The comparison of NIQE scores [28] for Figure 12 and Figure 13 (a lower score represents better enhancement).
[1][9][11][17][13][15][12][10][16]Proposed Method
19.65219.24519.45819.50819.61219.19119.38119.52518.54018.611
20.39320.09820.71220.44320.42720.37620.30720.27719.79619.487
22.43521.98122.64022.39122.43821.70321.18221.31817.56715.464
22.48321.27424.69721.60521.41821.04421.00821.08817.43216.564
20.26320.84820.24320.18520.42320.00620.17720.48118.72818.308
22.04421.74320.56720.87222.61419.08920.90621.39016.55316.324
19.66819.70618.67719.45719.71019.12719.65019.50016.08016.156
22.45021.37922.89922.89223.05722.36522.44122.52521.75521.450
22.19822.79920.54821.41822.79120.60021.87621.42714.91915.078
22.11421.89821.20521.48122.50720.98121.42922.77918.39116.662
AVG21.37021.09721.16521.02521.50020.44820.83621.03117.97617.410
Table 4. The comparison of average NIQE scores [28] for Figure 8, Figure 9, Figure 10, Figure 11, Figure 12 and Figure 13, the DAWN dataset [25], and WEAPD [26] (a lower score represents better enhancement).
[1][9][11][17][13][15][12][10][16]Proposed Method
AVG(30)20.62120.46720.25420.44920.75920.03220.37120.42617.93917.346
AVG(323)19.83319.80319.69819.89219.93119.58319.71419.63317.97117.047
AVG(692)21.06221.32220.99821.19821.29020.89920.95720.64718.68417.922
Table 5. The comparison of UIQM scores [27] for Figure 8 and Figure 9 (a higher score represents better enhancement).
[1][9][11][17][13][15][12][10][16]Proposed Method
0.3660.7980.5270.5180.3260.8160.6600.4280.7520.865
1.0371.1761.7861.3580.8801.4241.0311.1491.7281.798
1.2011.3131.4781.3370.9611.4941.2931.2331.6251.664
0.8431.0090.8231.0580.7271.1960.8330.8381.3981.499
0.6960.9190.7670.6960.5551.0050.6680.7371.4151.554
0.4290.8450.7210.5690.3510.8870.6230.4800.9261.119
0.3580.7980.5420.4820.3280.9610.6330.4620.7370.967
0.8670.6610.8700.7320.5611.1160.7920.7611.4341.509
0.5730.5820.9080.7790.6031.0470.7020.7851.4831.578
0.8260.8000.7950.7490.6350.9720.8150.8641.3941.349
AVG0.7200.8900.9220.8280.5931.0920.8050.7741.2891.390
Table 6. The comparison of UIQM scores [27] for Figure 10 and Figure 11 (a higher score represents better enhancement).
[1][9][11][17][13][15][12][10][16]Proposed Method
0.8530.7450.8780.7350.5651.0630.8180.7651.3571.438
0.9801.0201.3501.2220.7561.3331.0191.0451.5981.660
0.4810.7120.5980.5560.4031.0080.5860.5321.0561.141
0.9190.9290.9820.9770.8481.2490.8961.0651.7641.942
1.3391.3701.6281.6771.2021.6451.2431.4091.8631.689
0.9841.1381.0320.8850.6401.2931.1950.9001.6832.021
0.6521.0690.9160.8180.6941.1211.1640.8541.3801.565
0.8871.1551.0981.1590.9211.3990.8761.0471.6871.809
1.0811.2811.2311.1870.9711.5190.9961.1772.1642.258
0.6211.1430.8060.7450.5581.1891.1980.7361.4281.651
AVG0.8801.0561.0520.9960.7561.2820.9990.9531.5601.717
Table 7. The comparison of UIQM scores [27] for Figure 12 and Figure 13 (a higher score represents better enhancement).
[1][9][11][17][13][15][12][10][16]Proposed Method
0.3250.8490.8120.6290.4531.0370.9060.5201.4011.406
0.5170.9960.4350.8050.6661.1770.7960.5691.5271.909
1.2651.2631.1551.1090.9451.4431.1941.1781.7631.766
1.2581.2211.2601.1180.9591.4761.1031.2051.8751.898
0.9000.6610.8600.6960.5700.9320.7710.7141.2351.399
0.9321.1511.0681.2580.9811.4250.9711.1431.6961.846
0.9641.0691.3171.2100.9191.5041.0141.1891.8272.005
0.3200.8820.8670.5900.3150.8500.6350.4480.8281.063
1.0581.1321.2761.1881.0061.4321.0071.2011.9071.977
1.0181.3611.1441.1970.9831.3530.9311.1361.6651.773
AVG0.8561.0591.0190.9800.7801.2630.9330.9301.5721.704
Table 8. The comparison of UIQM scores [27] for Figure 8, Figure 9, Figure 10, Figure 11, Figure 12 and Figure 13, the DAWN dataset [25], and WEAPD [26] (a higher score represents better enhancement).
[1][9][11][17][13][15][12][10][16]Proposed Method
AVG(30)0.8181.0020.9980.9350.7091.2120.9120.8861.4871.604
AVG(323)0.7800.9380.9280.8400.6711.1840.8700.8161.4261.581
AVG(692)1.1181.2711.2221.2070.9951.4051.0741.1661.8271.929
Table 9. The comparison of FADE scores [29] for Figure 8 and Figure 9 (a lower score represents better enhancement).
[1][9][11][17][13][15][12][10][16]Proposed Method
2.1222.7801.2151.8248.6821.7313.4666.7682.4831.961
0.9680.9070.3700.7492.1530.7191.3051.3360.3620.298
0.4120.8460.2940.3741.3840.4690.6840.8310.2070.159
0.8271.5720.8970.7432.7400.9141.6102.0920.6430.452
1.2272.2770.7471.4194.2791.1341.8373.5760.9830.699
1.5752.5300.8791.4867.2861.4792.8415.1701.3801.104
1.8781.2861.0021.4376.9191.7323.3135.7372.1501.494
1.4523.1460.9051.9376.2701.6502.8844.5701.9611.051
0.7070.6290.4640.5612.7010.8311.2692.5000.4720.362
0.6452.2310.6660.9363.6120.9251.4672.3121.1890.847
AVG1.1811.8200.7441.1474.6031.1582.0683.4891.1830.843
Table 10. The comparison of FADE scores [29] for Figure 10 and Figure 11 (a lower score represents better enhancement).
[1][9][11][17][13][15][12][10][16]Proposed Method
1.7124.6841.0562.9795.8891.3331.9223.6241.1030.969
1.2151.4750.4650.9442.6570.7141.1491.7510.4980.424
1.6951.7211.1011.6198.1981.6823.7485.9212.0891.469
0.8760.9970.6180.7093.1400.9971.3712.1820.5510.359
0.4420.4790.2680.3470.9250.4110.7460.7420.1940.174
0.6261.9610.6140.9153.6540.7090.7452.0020.3420.316
0.7690.5840.4200.5943.2560.8510.8442.2400.6870.356
0.6210.4900.3970.5012.4890.7481.8571.3790.4080.236
0.6820.5390.4450.5541.6020.4341.2881.0530.2150.192
0.7491.0230.5440.6663.9260.7160.8112.7150.5470.399
AVG0.9391.3950.5930.9833.5740.8601.4482.3610.6630.489
Table 11. The comparison of FADE scores [29] for Figure 12 and Figure 13 (a lower score represents better enhancement).
[1][9][11][17][13][15][12][10][16]Proposed Method
0.9270.5080.5110.6414.8621.2491.8024.7340.6910.645
0.9891.4550.8880.8874.5832.7123.4855.5470.8470.745
0.4000.9420.4770.5881.6070.5340.7271.0650.1900.169
0.4470.9900.4270.6401.6670.5200.9831.0710.1810.199
0.6984.7440.5761.4835.7431.1241.6253.7391.2520.663
0.6630.4920.3880.4801.9330.8081.3231.2730.2990.218
0.5060.4660.3130.4052.2400.5411.0461.2160.3210.224
2.2681.1340.9021.7108.7521.3953.7186.0461.9601.145
0.5340.4370.3220.4311.6580.5510.9860.9130.2050.189
0.6480.4940.4780.5171.5810.4881.1781.0380.2220.160
AVG0.8081.1660.5280.7783.4630.9921.6872.6640.6170.436
Table 12. The comparison of average FADE scores [29] for Figure 8, Figure 9, Figure 10, Figure 11, Figure 12 and Figure 13, the DAWN dataset [25], and WEAPD [26] (a lower score represents better enhancement).
[1][9][11][17][13][15][12][10][16]Proposed Method
AVG(30)0.9761.4610.6220.9693.8801.0031.7342.8380.8210.589
AVG(323)1.3681.6750.7981.3483.6480.9131.6842.8810.7940.596
AVG(692)0.6700.9890.5310.7041.9830.6651.0851.4820.3830.294
Publisher’s Note: MDPI stays neutral with regard to jurisdictional claims in published maps and institutional affiliations.

