Article

Experimental Study on Dynamic Performance of Tubular Flange Grid-Type Dam under Impact Load

1
Shock and Vibration of Engineering Materials and Structures Key Laboratory of Sichuan Province, Southwest University of Science and Technology, Mianyang 621010, China
2
Western Center of Disaster Mitigation in Civil Engineering of Ministry of Education, School of Civil Engineering, Lanzhou University of Technology, Lanzhou 730050, China
*
Author to whom correspondence should be addressed.
Symmetry 2022, 14(7), 1486; https://doi.org/10.3390/sym14071486
Submission received: 11 April 2022 / Revised: 14 June 2022 / Accepted: 30 June 2022 / Published: 20 July 2022
(This article belongs to the Special Issue Symmetry in Applied Mechanics Analysis on Smart Optical Fiber Sensors)

Abstract

:
As one of the most dangerous geological hazards in the world, debris flows can destroy trees and structures, break electrical, water, and gas lines, and disrupt bridges and roadways in a short period of time, threatening life and property. In particular, fast-moving large boulders carried by debris-induced destructive impact loading can strike objects without warning. To resist impact loading caused by rocks in debris, this paper proposed an innovative grid-type debris dam (or Sabo dam) design composed of symmetrical cross-sections of steel tubular flange beams and columns. This paper studied the dynamic performance of the tubular flange columns under impact loading by conducting lab tests and numerical simulations. Moreover, the dynamic response of the grid-type debris dam was simulated under various loading conditions. Comparing three different types of columns with similar configurations under the same loading condition, the tubular flange column proposed in this research exhibits better performance in overall strain, displacement, acceleration, and bending conditions. Furthermore, the results also prove that the proposed structure has excellent interoperability and energy absorption capabilities. When increasing the testing impact load, the failure modes of the dam change from dent at the impact point to local buckling and total failure of the structure, which indicates that the structure has superior performance under impact loading.

1. Introduction

Debris flow is one of the most severe geological hazards in the world, causing a large number of casualties and a large amount of property loss. For decades, several researchers have conducted theoretical analyses and implemented applications, including investigations into the causes and distribution regularities of debris flows, risk assessment [1,2], biological control, and engineering treatment [3]. Roberta et al. [4] evaluated the conditions triggering debris flow in mountain basins. The relationship between the mechanism of debris flow and geomorphic conditions is summarized. Moreover, an analysis was carried out involving the hydrologic method and slope stability. Zhou et al. [5] studied the viscous or collision state of debris flow-through experiments. Furthermore, a large number of field investigations into debris flow sites have also been carried out by researchers internationally. The sediment-deposition process in debris flow and the failure mode of the natural-dam body have been studied, and the maximum impact pressure of debris flow has been measured based on field tests [6,7]. Parameshwari et al. explored the trajectory characteristics of debris flow under simulated conditions. The failure response of the structure under an actual impact state was obtained through experiments [8].
In order to prevent disasters such as landslides or debris flow, many retaining dams, or debris dams, have been proposed, designed, and constructed. The retaining systems include gravitational retaining dams, grid dams, and flexible cable network systems [9]. The main body of the retaining structure could consist of a single dam or a group of dams. Some scholars have studied the mechanical characteristics, development prospects, damage types, and response modes of debris-flow-retaining dams [10,11,12]. Xu et al. simulated and analyzed a diversion dam based on actual topography. The failure modes of the dam were discussed under different interception types. The study shows that diversion dams had better performance in resistance and control [13]. Wang and Ran et al. proposed a series of concrete-filled steel tube (CFST) grid-dam structures [14,15,16,17], which showed high impact resistance under debris flows and landslides. In addition, several studies on the impact resistance of CFST components have been conducted by multiple researchers [15,16,17]. The commonly used grid-type debris dam (Sabo dam) adopts a reinforced concrete structure (Figure 1), which is damaged relatively easily when struck by large boulders [18,19,20,21,22].
To resist impact loading caused by rocks in debris, this paper proposed an innovative grid-type debris dam (or Sabo dam) design composed of symmetrical cross-sections of steel tubular flange beams and columns. The proposed design adopts concrete-filled steel tubular flange columns with special-shaped cross-sections, which improve the impact resistance of the grid dam [23,24,25]. Moreover, the dynamic performance of the tubular flange columns under impact loading was analyzed by conducting lab tests and numerical simulations. A case study using the grid-type composite debris dam was designed and constructed in Sanyanyu Cave in Gansu, China (Figure 2). The corresponding dynamic performance of the concrete-filled tubular flange column under impact load was analyzed by testing and numerical simulation. The results showed this type of dam performs well in resisting debris flows.

2. The Experiment Study of Tubular Flange Composite Column

To test and simulate the impact resistance of the proposed structure, three types of full-scale concrete-filled steel tubular flange composite columns were designed and constructed. Meanwhile, finite element models of the composite column were also built for simulation and verification purposes, respectively.

2.1. Specimen Design

The concrete-filled steel tubular flange composite columns are mainly composed of three parts, namely the front flange, the web, and the rear flange. The front and rear flanges are both concrete-filled steel tubular sections and connected with a steel web. Three types of composite members were designed in the test, namely tubular flange column and special-shaped tube flange columns I and II. The cross-sections of test columns are shown in Figure 3.
The height of these three composite columns is 1500 mm. The front and rear flanges of the tubular flange column (Figure 3a) are rectangular-shaped concrete-filled steel tube columns, while the front flanges (impact surfaces) of the special-shaped columns I and II are curved concrete-filled steel tube sections, and the rear flanges are rectangular columns with a steel tube thickness of 3 mm. The webs of the tubular flange column are composed of steel plates with a thickness of 8 mm. The webs of the special-shaped column I are composed of five steel plates with a size of 80 × 8 × 120 mm. The webs of the special-shaped column II are composed of five parallel steel plate with a distance of 50 mm and a thickness of 5 mm. The steel of the specimens uses Q235B ( F y = 235   Mpa ) [26] and the type of concrete material is C30 ( F c u = 30   Mpa ; for details, see [27]).

2.2. Test Equipment

The experiments were conducted on the impact test platform, which comprises three parts: supporting frame, steel platform, and impact tank. The total height of the test frame was 5.8 m. The angle of the oblique impact was about 45°. The dimension of the upper platform was approximately 3 m × 3.3 m. In addition, a built-in track was setup in order to control the direction of the impact. The length of the track was about 5.7 m. A schematic diagram of the impact platform is shown in Figure 4a. To simulate the impact loading in the test, Q235B solid steel balls (Figure 4b) with different dimensions and weights were selected. The steel balls had four configurations of 100 mm, 150 mm, 200 mm, and 300 mm with corresponding masses 4.1 kg, 13.9 kg, 32.9 kg, and 111.3 kg, respectively. The experiments were conducted in the Institute of Western Civil Engineering Disaster Prevention and Reduction Research Center.
Before the impact test starts, the track was adjusted to the position of the designed hitting point. The steel ball wasset at the top of the track and released at astate of zero initial velocity (free rolling). After the impact occurred, the energy of the steel ball dissipated. Thus, a complete impact test process wasestablished.
The monitoring instruments used in the impact tests werestrain gauges, displacement sensors, accelerometers, the acquisition system, etc. The model of the strain gauge wasBX120-3AA. The displacement sensors used models CLMD1 and CLMD2, with measurement ranges of 750 mm and 1000 mm, respectively. The accuracy of these sensors was ±0.005% of the total range. The accelerometers used IEPE piezoelectric, with sensitivities of 1.165 mV/g, 1.01 mV/g, and 0.9975 mV/g. The measurement range was ±5 × 10⁴ m/s2 with afrequency of 0.7 Hz–10 kHz. The dynamic signal acquisition module DH5922 system wasselected for the data acquisition of test measuring points (Figure 4c). Three acquisition instruments wereconnected in series, and each acquisition instrument wasequipped with eight acquisition channels.

2.3. Measuring Point Layout and Loading Conditions

The layouts of measuring points for testing specimens during the experiments are shown in Figure 5. These measuring points were selected and arranged for each specimen. Figure 5a–c, d–f, and g–i represent the layout of measuring points of the tubular flange column and the special-shaped columns I and II, respectively. Twelve strain gages (Y1–Y12), three displacement sensors (W1–W3), and three acceleration sensors (J1–J3) were used in each test.
Considering the complexity of the dynamic response for those columns under impact loading, 27 impact-loading conditions were designed for these three types of columns and are listed in Table 1.
For example, in Table 1, G-1-1 represents the loading conditions of the concrete-filled steel tubular flange column. The diameter of the testing steel ball is 100 mm, and the impact height is 450 mm.X-1-1 represents the loading condition of concrete-filled steel tubular column I with the testing steel ball of 100 mm diameter and impact at 450 mm. K-1-1 represents the loading conditions of concrete-filled steel tubular column II when the testing ball diameter is 100 mm, and the impact height is 450 mm. In this table, D represents the diameter of the steel ball, M represents the mass of the steel ball, and H represents the height of the impact position point. In addition, the actual impact velocity of the ball along the track just before the impact was expected to be less than the theoretically calculated velocity due to frictions between balls and track. Therefore, the EG-003 radar velocimeter was installed near the impact point to record the velocity before the impact occurs accurately, and was used in the finite element numerical simulation to facilitate accurate comparison.

3. Dynamic Response Analysis of Tubular Flange Cylindrical Grid Dam

Finite Element Modal

The designed impact process is a typical dynamic problem. ANSYS/LS-DYNA, a commercial finite-element software program, is used for numerical simulations to study the dynamic response of the proposed steel tubular flange column. The configurations of the specimen and loading conditions were kept consistent with the experiments during the simulation. During modeling, element Solid164 was used for all the composite columns and impact objects (steel balls). The HJC model was selected for the constitutive relation of concrete. In the process of impact, the deformation of steel balls was not considered. Thus, the Rigid Material model was selected for the steel ball. The *MAT Plastic Kinematic MODEL was selected as the steel constitutive model. The main advantage of this constitutive model is that it can be used to analyze the instantaneous failure characteristics of the steel tube during the impact process at any time and shows the influence of its strain effect. The general calculation of the yield stress is shown in Equation (1).
σ y = 1 + ε ˙ C 1 P σ 0 + β E P ε P e f f
where ε ˙ is the strain rate; C and P are the strain rate parameters; in this case, C = 40 , P = 5; σ 0 is the initial yield stress; β is the hardening coefficient, β = 0.2 ; E P is the plastic hardening modulus, E P = E t a n E / E E t a n , where E is the elastic modulus, E t a n is the tangential hardening modulus; ε P e f f is the effective plastic strain, ε P e f f = 0.2 .
During the finite element analysis, the automatic contact type was selected for the impact between the ball and the composite column. The slip between the steel tube and the concrete was not considered. The bonding between the steel and concrete in the composite column was considered. All types of concrete-filled tubular flange steel columns were equivalent to cantilever beams, fixed in all degrees of freedom at the bottom. Moreover, fixed constraints were adopted in all three directions (XYZ) at the bottom of the steel tubes. UZ was released to the concrete at the bottom of the column member, which is more in line with the dam column’s actual situation. The grid division of steel and concrete components was in the form of a sweep with a size of 10 mm. The impact steel ball was mapped with a grid size of 20 mm. The grid schematic maps of these three column models are shown in Figure 6.

4. Test Results and Comparison

4.1. Failure Mode of Impact Area

Comparisons between the experimental and the simulation results of these columns under impact are shown in Figure 7. The failure modes of the members at the impact point are similar to each other. The results show that the damage increases as the diameter of the steel ball increases. The cylinder component only has slight damage and deformation at the impact point (Figure 7a), and the effective plastic strain of the cylinder component is 0.04013. Slight sag appears at the impact point (Figure 7b).The effective plastic strain of the component reaches 0.1319.When the diameter of the steel ball increases to 300 mm, the mass of the impact object is 111.3 kg, and the impact energy is significant. Thus, extensive damage occurs at the impact point (Figure 7c). The effective plastic strain of the component finally reaches 0.1837. In addition, the observation shows that the impact point of these three tests is roughly similar to the results of the numerical simulation.
The comparison between the overall bending deformation of the column and the simulation results is shown in Figure 8. All columns suffered severe bending deformation under the action of multiple impact loads. The web buckled successively after impact. Among them, the bending deformation of column I is the largest. Then follows column II. The buckling deformation of the webs of these three columns shows the same trends as the bending deformation. The bending deformation measured from the test specimens is consistent with the results of the numerical simulation.

4.2. Dynamic Strain Analysis and Comparison

The peak strain of the three specimens is summarized in Table 2. The impact energy of the 100 mm steel ball is small and the strain response is not obvious, the data are not involved. The comparisons between the numerical simulation and testing data at the critical measurement points on the specimens are shown in Figure 9.
Combining the data in the table and comparison figure, we can see: for the strain measured from these three specimens (such as Y1–Y4), the closer to the fixed end at the bottom, the greater the peak strain measured; namely, the Y1 peak strain is the largest among these four points. This rule does not include the impact point. Moreover, the closer to the impact point, the greater the peak strain measured (except for the fixed end at the bottom). The main reason for this is in the process of impact, the impact point occurs first. At the same time, the impact produces considerable stress and plastic strain, which are mainly concentrated in or near the point of impact. Then, the stress wave around the impact point spreads. The energy of the stress wave decreases as it diverges. Under the same loading conditions, the largest peak strain in the flange and web are from special-shaped column I, then special-shaped columns II; the tubular flange column has the smallest peak value. In contrast, the largest peak strain of the rear bottom edge is from the tubular flange column.
In addition, the value of the peak strain from the testing specimens is directly influenced by the diameter of the steel balls (i.e., the impact load). By comparing the experimental values of these three types of composite column with the numerical simulation results, it can be seen that the variation is consistent. The numerical values have a high degree of coincidence, the errors are all less than 13%, and the maximum error is only 12.92%, which proves that the numerical simulation results have high credibility.

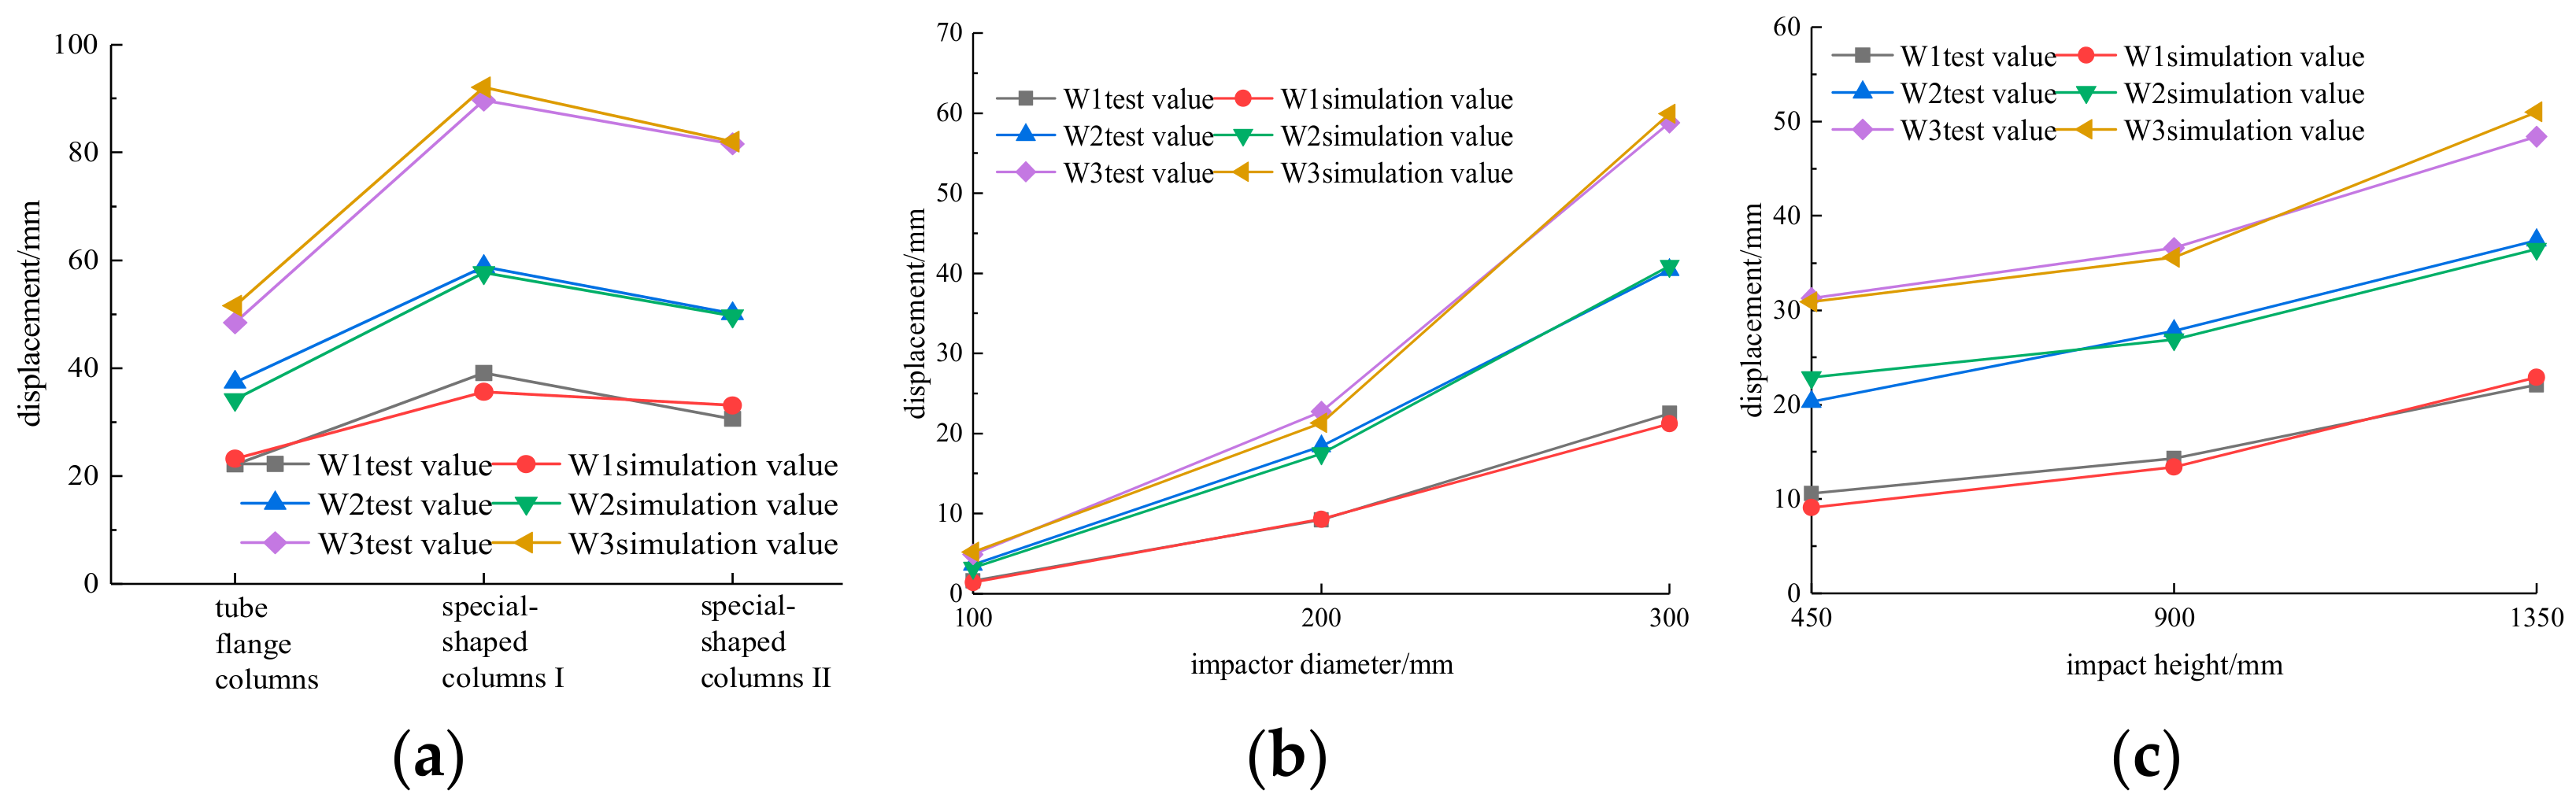
4.3. Dynamic Displacement Analysis and Comparison

The test results of the peak displacements of the three types of tubular flange column specimens are shown in Table 3, Table 4 and Table 5. The experimental data are compared with the numerical simulation results (Figure 10). From both the tables and figures, W3 peak displacement is the largest among the three displacement measuring points, while W1 peak displacement is the smallest. This displacement change is expected by the prediction of cantilever member stress distribution. In addition, under the same loading conditions, the peak displacement of the special-shaped column I measuring point is the largest, followed by the special-shaped column II. The peak displacement of the tubular flange column is the smallest.
Moreover, the results show that the value of peak displacement is influenced by the magnitude and height of the impact load. The experimental data are in good agreement with the results of numerical simulation. The error is less than 14%. This further proves the reliability of numerical simulation.

4.4. Acceleration Analysis and Comparison

The peak accelerations of the three types of columns in the test are shown in Table 6, Table 7 and Table 8. The test data are compared with numerical simulation results (shown in Figure 11). Combined with the testing and monitoring data, the peak value of the measuring point J3 is the largest among the three acceleration measuring points. The minimum peak value of the measuring point is J1. In addition, under the same loading conditions, the peak acceleration of the special-shaped column I is the largest, followed by the special-shaped column II and the tubular flange column. The peak acceleration of the three columns is directly influenced by the configuration of the testing ball and the impact point.
The analysis shows that the increase in the diameter (mass) of the ball will inevitably lead to an increase in the initial kinetic energy, which increases the oscillation frequency of the column member. The results show that the errors are within 12% between the experimental and simulated values. It has been proven that the numerical simulation is reliable.

5. Dynamic Response Analysis of Tubular Flange Cylindrical Grid Dam

5.1. Basic Parameters of the Structure

In the process of dam design optimization, two basic requirements should be satisfied: (a) the flexural bearing capacity after optimization should not be reduced; (b) the material and total cost after optimization should not be increased, namely:
M u 2 > M u 1 ;   P 2 < P 1
where M u 1 represents the bearing capacity of the No.8 reinforced-concrete grid dam, M u 2 represents the bearing capacity of the tubular-flange-column grid dam; P 1 represents the total material cost of the reinforced-concrete grid dam, and P 2 represents the total cost of the tubular-flange-column grid dam.
The arrangement of the composite grid-type debris dam system is shown in Figure 2. Tubular flange columns in the longitudinal direction are arranged in two rows. The total height of the dam body is 12 m. The tubular flange column section forms are selected from both types I and II. The length of the tubular flange column of type I is 3 m, the front flange section form is an arc, the section length and width are 1.2 m × 1.2 m, and the thickness is 0.03 m. The rear flange is a rectangular-shaped tube with a cross-section of 1.2 m × 0.6 m and 0.03 m thickness. The length of the type II tubular flange column is 2.4 mand the section size of the web is the same as that of type I. The steel tube thickness of the tubular flange column is 18 mm. The front tube flange column is connected with the steel beam. The distance between the front tube flange column and the steel beam in the back row is 2.025 m. The section form is rectangular with a length of 3 m, thickness is 0.05 m, and a height is 0.8 m. The front flange of the rear tube flange column is placed between the rear flange of the front tube flange column, thereby forming a whole and ensuring the cooperative working performance of the dam structure.

5.2. Loading Conditions

Large-size boulders were selected as impact objects to simulate debris flow. The density of blocks in debris flow is generally 2500 kg⋅m−3, the elastic modulus is 5.0 × 10⁷ MPa, and Poisson’s ratio is 0.28. Q235B-type steel was selected in the dam, while the concrete used C30. Regarding Table 9, the simulated loading conditions in the GZ elements represent the columns of the dam, and GL refers to the beams of the dam. The diameter D of the impactor (boulder) is taken as 1 m, 2 m, and 3 m, respectively. The velocity of boulders before impact is 10 m/s, and impact heights were chosen as 5 m, 7.8 m, and 11.6 m according to the dam structure.

5.3. Simulation Analysis Results

5.3.1. Destruction Mode

The failure mode of the tubular flange column grid dam is shown in Figure 12. The column slightly deforms after the 1 m diameter boulders impact the structure (D = 1 m). Furthermore, the beam undergoes a slight bending deformation. When the diameter of the impact block increases to 2 m, the web appears to have slight bending deformation. When the column has been impacted and obvious collision deformation at the impact point occurs, while the beam is impacted, the member at the impact position shows obvious bending.
When the diameter of the impact block is further increased to 3 m, the web at the impact point completely buckles, and the tubular flange column is bent and the plastic deformed. At the same time, the beam connected at both ends of the tubular flange column also shows large bending deformation. As the diameter of boulders increased to 5 m with a speed of 20 m/s, the front of the system was under bending conditions; the impact location was fully bending, and the front beams were partially under large deformation. The front and rear flanges, as well as the web of the column, squeezed together, and the deformation of rear beams also appeared more apparent. The dam is evaluated as a structural failure.
To sum up, with the increase in impact load, the failure mode of the tubular-flange-column grid dam can be divided into four stages:(a) slight damage and deformation at the impact point of the dam body; (b) local deformation of members; (c) complete buckling of column web and bending failure of beam members; (d) structural failure of the dam body.

5.3.2. Impact Force Analysis

The comparison of peak impact force of the dam is shown in Figure 13.
The contact time between the boulders and the column is relatively short compared with the beam under the same loading conditions. Moreover, under the same impact loading case, the peak impact force of the column is much higher than that of the beam. The main reasons are as follows: the stiffness of the middle column is much greater than that of the beams, and the inertial force generated by the former is greater than that of the latter under the same impact load. Therefore, the reaction force obtained by the impacted column is larger, resulting in a more significant peak impact force.
In addition, the time used for the first peak impact force increases with the increase in the diameter of the impact block. The peak impact force of the structure decreases with the increase in the impact height. However, the force increases with the increase in the size of boulders. This is because the impact height increases and the binding force of the impact point decreases, while the diameter of the impact object increases and the impact energy increases.

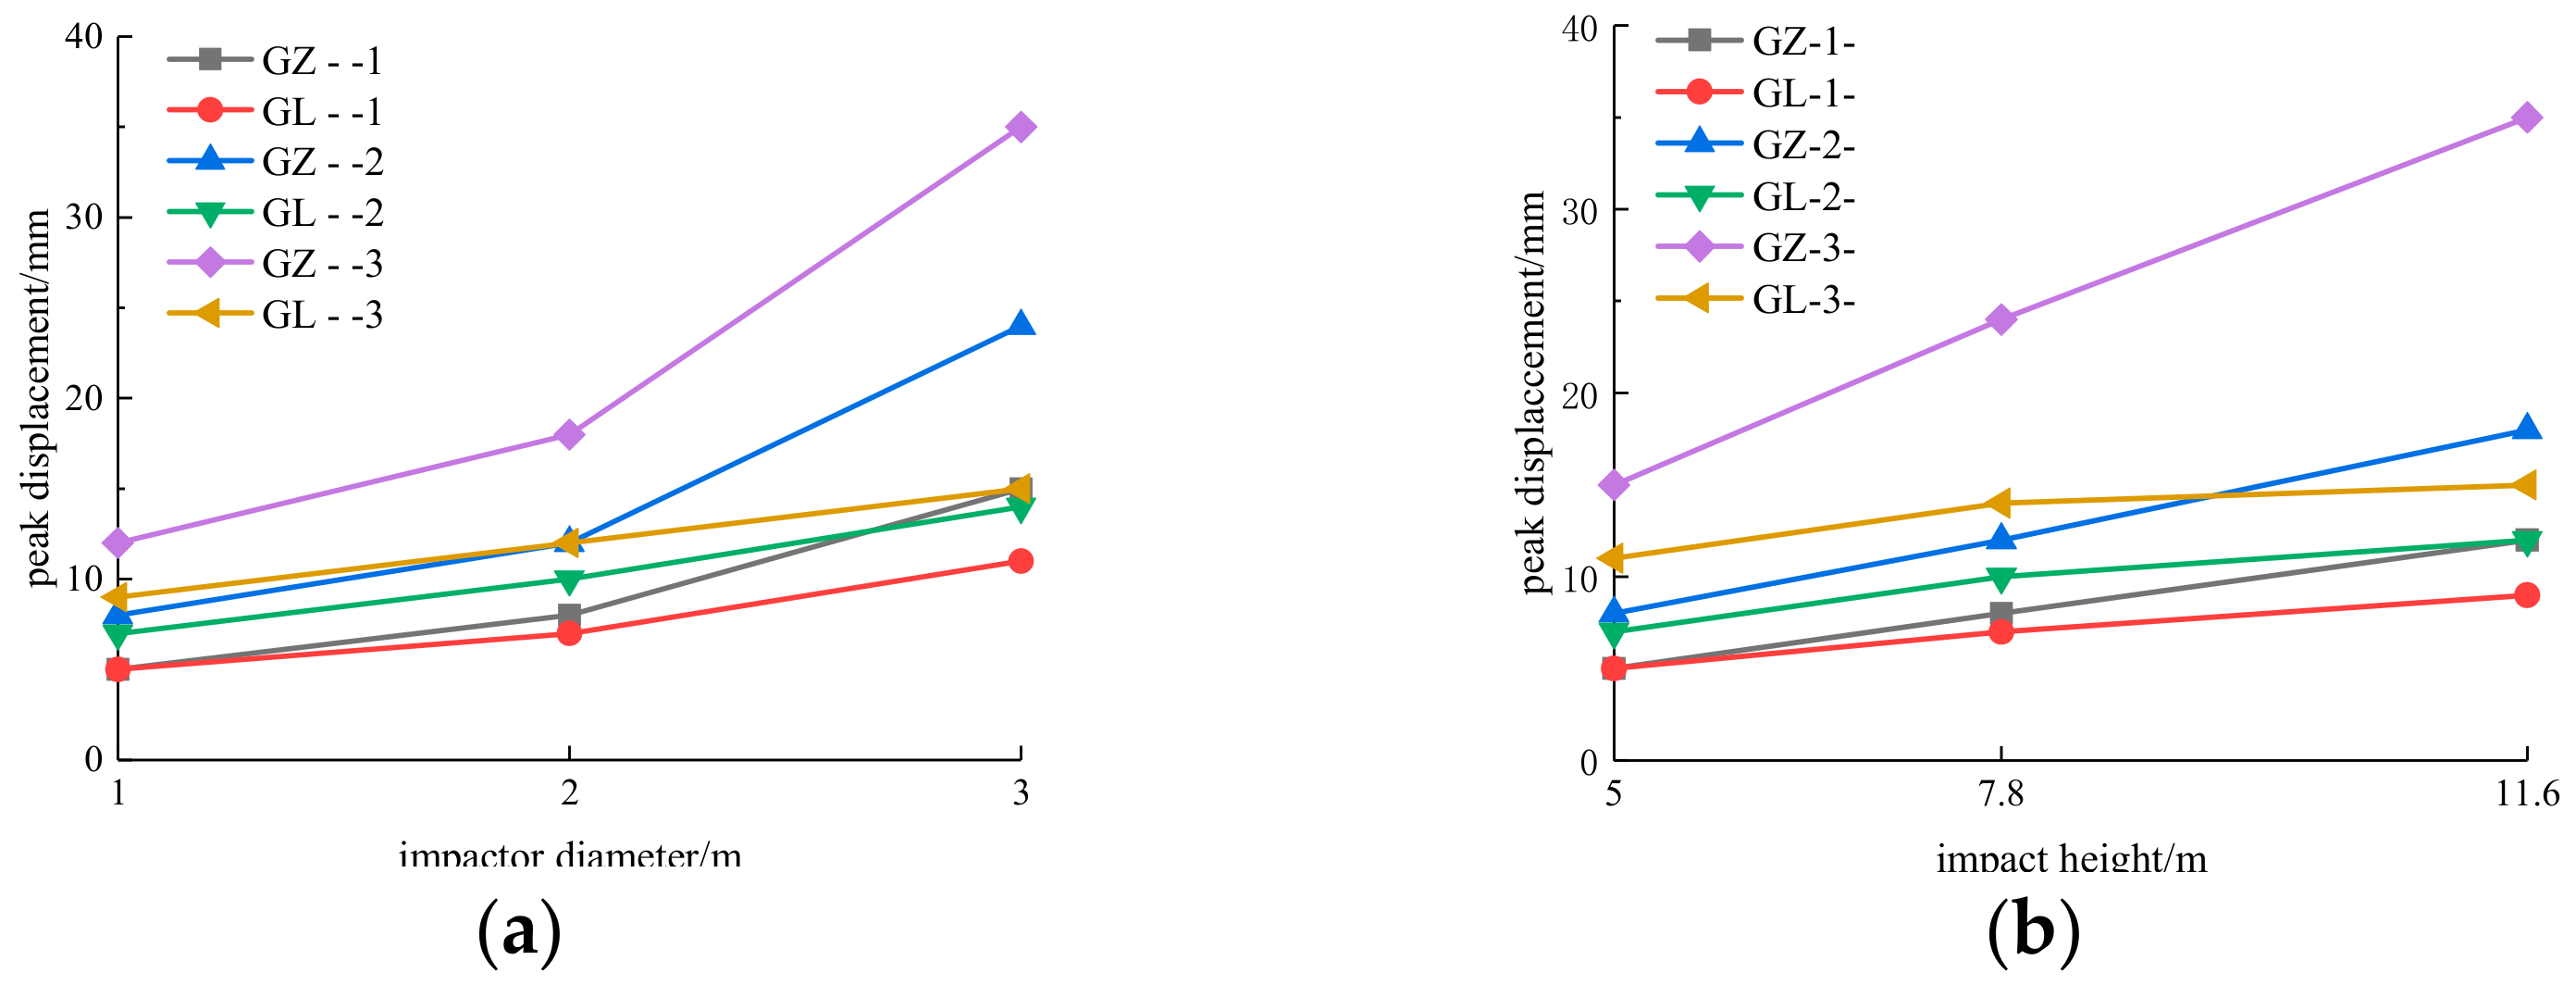
5.3.3. Displacement Analysis

The peak displacement of the proposed grid-type dam is shown in Figure 14. Combined with the figures, under the same impact-loading conditions, the peak displacement of the structure is significantly larger when the column is impacted than when the beam is impacted. In addition, the peak displacement of the structure increases with the increase in the impact height and the diameter of the impact block, regardless of the impact on the column or the beam. The amplitude of peak displacement with the increase in the diameter of the impact block is greater than that with the increase in the impact height; that is, the impact factor of the diameter of the impact block on the displacement of the dam structure is greater than the impact height.

5.3.4. Energy Analysis

The internal energy time-history curve and the peak energy comparison of the tubular flange column grid dam under impact load are shown in Figure 15. It can be seen from the figure that the internal energy of either column member or beam member decreases with the increase in the impact height and increases with the increase in the diameter of the impact material. In addition, the time required to reach the peak of the energy in the system when a column is impacted is far less than when the beam is impacted. Under the same impact loading, in the case of the column being impacted, the internal energy absorbed by the system is less than that when the beam is impacted. That is, the conversion rate of the internal energy is smaller when the column is impacted. The main reasons are as follows: when the beam is impacted, the deformation is more significant than when the column is impacted. Moreover, the stiffness of the beam is much lower than that of the column. The deformation of the beam members is mainly due to more impact energy being absorbed in the impact process, which leads to a higher internal energy conversion rate of the dam structure. Through the analysis of the simulation data, the internal energy conversion rate of the dam under all working conditions is above 59.5%. In comparison, the internal energy conversion rate of the beam reaches a highest value of 85.7%. However, the final energy absorption by the beam mainly comes from its considerable deformation. Therefore, in the actual projects, attention should be paid to the stress and deformation of beam members in the dam body, and timely improvement and repair should be carried out after a disaster.

6. Conclusions

In this paper, a structure of a concrete-filled tubular flange column grid-type debris dam (Sabo dams) with symmetrical cross-sections was proposed based on the reinforced-concrete dam at Sanyanyu Cave in Gansu Province. The dynamic performance of this new type of tubular flange column under impact loading was analyzed by lab tests and numerical simulations. The dynamic response of the tubular-flange-column grid dam under various impact conditions was analyzed using finite element simulation. The analysis and experiment results show that the grid dam with tubular flange columns has strong anti-impact performance. The following conclusions were drawn:
  • Under the same impact loading, the bending deformation of these composite columns is as follows: special-shaped tube flange column I > special-shaped tube flange column II > tubular flange column. However, the local damage at the fixed end on the rear flange of columns is: tubular flange column > special-shaped tube flange column II > special-shaped tube flange column I.
  • Under the same impact loading, the special-shaped column I has the minimum impact deformation, the maximum displacement, and the minimum final residual internal energy. The tubular flange column has the maximum impact deformation, minimum displacement, and maximum final residual internal energy.
  • The failure mode of the tubular-flange-column grid dam under various impact loadings can be divided into four stages: (1) slight damage at the impact point of the dam; (2) local deformation of members; (3) complete buckling of column web; (4) structural failure.
  • The column in the composite grid-type dam produced far less deformation than the beam after the same magnitude of impact loading. Therefore, the slenderness of the beam is critical in the design and needs to be strengthened when using certain types of dam systems. Generally speaking, the displacement of the structure is greater than the beam.
  • Local damage usually occurs when the composite grid-type dam has been struck under the impact loading. However, the structure could remain in the working condition in general. The results indicate that the tubular flange column grid-type dam has strong impact resistance as a preferred candidate for the debris dams.

Author Contributions

Conceptualization, analysis, resources, data curation, draft manuscript preparation: X.-L.W.; investigation, supervision and review: Y.Y., S.-L.W. and Z.-J.F.; testing, analysis and editing; investigation and review, Y.-P.C. All authors have read and agreed to the published version of the manuscript.

Funding

This research was funded by Shock and Vibration of Engineering Materials and Structures Key Laboratory of Sichuan Province (18kfgk08) and National Natural Science Foundation of China (51778273).

Institutional Review Board Statement

Not applicable.

Informed Consent Statement

Not applicable.

Data Availability Statement

The data supporting the results reported in the paper can be accessed from the corresponding authors.

Conflicts of Interest

The authors declare no conflict of interest.

References

  1. Ning, N.; Ma, J.Z.; Zhang, P.; Qi, S.; Tian, L.M. Debris flow hazard assessment based on GIS and information method in the Bailong River Basin in southern Gansu. Resour. Sci. 2013, 35, 892–899. (In Chinese) [Google Scholar]
  2. Chen, H.X.; Zhang, S.; Peng, M.; Zhang, L.M. A physically-based multi-hazard risk assessment platform for regional rainfall-induced slope failures and debris flows. Eng. Geol. 2016, 203, 15–29. [Google Scholar] [CrossRef]
  3. Zhong, D.L.; Xie, H. Debris Flow Disasters and Prevention Technology; Sichuan Science and Technology Press: Chengdu, China, 2014. (In Chinese) [Google Scholar]
  4. Roberta, P.; Vincenzo, D.A.; Marcel, H. Debris flow triggering characterization through a comparative analysis among different mountain catchments. Catena 2020, 186, 104348. [Google Scholar]
  5. Zhou, G.G.D.; Li, S.; Song, D.; Choi, C.E.; Chen, X. Depositional mechanisms and morphology of debris flow: Physical modelling. Landslides 2019, 16, 315–332. [Google Scholar] [CrossRef]
  6. Bugnion, L.; McArdell, B.W.; Bartelt, P.; Wendeler, C. Measurements of hillslope debris flow impact pressure on obstacles. Landslides 2012, 9, 179–187. [Google Scholar] [CrossRef] [Green Version]
  7. Takahashi, T. Proceedings and Monographs in Engineering, Water and Earth Sciences: Balkema. In Debris Flow: Mechanics, Prediction and Countermeasures; Taylor & Francis: Oxfordshire, UK, 2007. [Google Scholar]
  8. Parameshwari, K.; Jeevan, K.; Jan-Thomas, F.; Martin, M.; Man, T.B.; Pudasaini, S.P. Interaction of two-phase debris flow with obstacles. Eng. Geol. 2018, 242, 197–217. [Google Scholar]
  9. Kang, Z.C.; Li, Z.F.; Ma, A.N.; Tian, L.J. Research on Debris Flow in China; Science Press: Beijing, China, 2004. [Google Scholar]
  10. Chen, H.Y.; Liu, J.F.; Zhao, W.Y.; Tang, J.B. Research status and prospects of impervious debris flow sand-retaining dams. J. Disaster Prev. Mitig. Eng. 2016, 36, 323–330. (In Chinese) [Google Scholar]
  11. Wang, X.L.; Ran, Y.H.; Li, J.J. Impact resistance analysis of a new type of debris flow barrier dam with continuous anti-collision piers. J. Disaster Prev. Mitig. Eng. 2017, 37, 474–480. (In Chinese) [Google Scholar]
  12. Zhan, M. Experimental study on the effect of steel grid dam intercepting debris flow. Appl. Technol. Soil Water Conserv. 2007, 4, 23–24. (In Chinese) [Google Scholar]
  13. Xu, F.F.; Han, Y.M. Numerical analysis of the effect of road crossing debris flow blocking diversion dam in landslide area. Traffic Eng. Technol. Natl. Def. 2018, 16, 31–33. (In Chinese) [Google Scholar]
  14. Wang, X.L.; Zhou, L. Dynamic response analysis of CFRP strengthened debris flow flexible cable net system. J. Lanzhou Univ. Technol. 2021, 47, 136–143. [Google Scholar]
  15. Ran, Y.H.; Wang, X.L.; Zhou, K. Impact resistance test and parameter analysis of concrete-filled steel tube grating dam. J. Harbin Inst. Technol. 2018, 50, 45–52. (In Chinese) [Google Scholar] [CrossRef]
  16. Li, J.J.; Wang, X.L.; Zhu, Y.P.; Luo, W.G. Experimental study on dynamic performance of debris flow dam with brace under impact loads. J. Shock. Vib. 2015, 34, 79–86. [Google Scholar]
  17. Ren, G.L.; Wang, X.L.; Ran, Y.H.; Feng, Z.J.; Chen, R.R. Numerical simulation and experimental study on the impact resistance of a new cable net and steel tube structure. Journal of Lanzhou University. Nat. Sci. 2020, 6, 846–852. [Google Scholar]
  18. Qu, H.Y.; Li, G.Q.; Sun, J.Y.; Chen, S.W. Numerical simulation analysis of concrete-filled circular steel tube members under lateral impact. J. Build. Sci. Eng. 2020, 27, 89–95. (In Chinese) [Google Scholar]
  19. Qu, H.Y.; Li, G.Q.; Sun, J.Y.; Chen, S.W. Simplified analysis model of concrete-filled steel tube members under lateral impact. J. Tongji Univ. 2011, 39, 35–41. (In Chinese) [Google Scholar]
  20. Zhang, Q.; Jiang, Q.; Lu, X.Z. Comparison of impact resistance of concrete-filled steel tube structures with different cross-sections. Eng. Mech. 2013, 30, 89–93. (In Chinese) [Google Scholar]
  21. Canelli, L.; Ferrero, A.M.; Migliazza, M.; Segalini, A. Debris flow risk mitigation by the means of rigid and flexible barriers–experimental tests and impact analysis. Nat. Hazards Earth Syst. Sci. 2012, 12, 1693–1699. [Google Scholar] [CrossRef] [Green Version]
  22. Johnson, P.A.; McCuen, R.H. Slit Dam Design for Debris Flow Mitigation. J. Hydraul. Eng. 1989, 115, 1293–1296. [Google Scholar] [CrossRef]
  23. Wang, H.-P.; Chen, H.; Chen, C.; Zhang, H.-Y.; Jiang, H.; Song, T.; Feng, S.-Y. The Structural Performance of CFRP Composite Plates Assembled with Fiber Bragg Grating Sensors. Symmetry 2021, 13, 1631. [Google Scholar] [CrossRef]
  24. Wang, H.-P.; Feng, S.-Y.; Gong, X.-S.; Guo, Y.-X.; Xiang, P.; Fang, Y.; Li, Q.-M. Dynamic Performance Detection of CFRP Composite Pipes based on Quasi-Distributed Optical Fiber Sensing Techniques. Front. Mater. 2021, 8, 285. [Google Scholar] [CrossRef]
  25. Wang, H.-P.; Song, T.; Yan, J.-W.; Xiang, P.; Feng, S.-Y.; Hui, D. Improved Analytical Method for Interfacial-Slip Control Design of Steel–Concrete Composite Structures. Symmetry 2021, 13, 1225. [Google Scholar] [CrossRef]
  26. GB/T 700; Carbon Structural Steels. China Architecture & Building Press: Beijing, China, 2006. (In Chinese)
  27. GB/T 50081; Standard for Test Methods of Concrete Physical and Mechanical Properties. China Architecture & Building Press: Beijing, China, 2019. (In Chinese)
Figure 1. Typical Reinforced-Concrete Grid-type Debris Dam.
Symmetry 14 01486 g001
Figure 2. Design of the Grid-type Dam. (a) Front view; (b) Vertical view.
Symmetry 14 01486 g002
Figure 3. The section of column member (mm). (a) Tubular flange column; (b) Special-shaped tube flange column I; (c) Special-shaped tube flange column II.
Symmetry 14 01486 g003
Figure 4. Schematic diagram of impact equipment. (a) Impact test platform; (b) Steel balls; (c) Signal acquisition instrument.
Symmetry 14 01486 g004
Figure 5. Layout of test points for three types of column members. (a) H = 450 mm; (b) H = 900 mm (c) H = 1350 mm; (d) H = 450 mm; (e) H = 900 mm; (f) H = 1350 mm; (g) H = 450 mm; (h) H = 900 mm; (i) H = 1350 mm.
Symmetry 14 01486 g005aSymmetry 14 01486 g005b
Figure 6. Schematic diagram of column grid division. (a) tubular flange column; (b) special-shaped tube flange column I; (c) special-shaped tube flange column II.
Symmetry 14 01486 g006
Figure 7. Comparison of test results and numerical simulation under impact load. (a) Impact result of D = 100 mm; (b) Impact result of D = 200 mm; (c) Impact result of D = 300 mm.
Symmetry 14 01486 g007
Figure 8. Overall bending deformation of columns. (a) tubular flange column; (b) special-shaped tube flange column I; (c) special-shaped tube flange column II.
Symmetry 14 01486 g008
Figure 9. Peak strain comparison chart. (a) D = 200 mm, H = 450 mm; (b) D = 200 mm, H = 450 mm; (c) H = 900 mm, special-shaped column I; (d) D = 300 mm, special-shaped column II.
Symmetry 14 01486 g009aSymmetry 14 01486 g009b
Figure 10. Comparison of peak displacement. (a) t = 3 mm, D = 300 mm, H = 1350 mm; (b) special-shaped column I; (c) special-shaped column II.
Symmetry 14 01486 g010
Figure 11. Comparison of peak acceleration. (a) different types of column; (b) different steel ball; (c) different impact height.
Symmetry 14 01486 g011
Figure 12. Failure mode diagram of grid dam with tube flange. (a) Front view of GZ-3-3 working condition; (b) Top view of GL-3-3 working condition; (c) D = 5 m, V = 20 m/s, H = 7.8 m (front view); (d) D = 5 m, V = 20 m/s, H = 7.8 m (top view).
Symmetry 14 01486 g012
Figure 13. Impact time history curve. (a) Different impact heights; (b) Different impact boulder diameters.
Symmetry 14 01486 g013
Figure 14. Comparison of peak displacements of dams. (a) Different impact steel ball diameters; (b) Different impact heights.
Symmetry 14 01486 g014
Figure 15. Internal energy time-history curve and peak comparison. (a) Internal energy time history of the dam; (b) Peak internal energy comparison.
Symmetry 14 01486 g015
Table 1. Loading conditions of impact test.
Code of Lading Condition D
/mm
M
/kg
H
/mm
Tubular Flange ColumnSpecial-Shaped Column ISpecial-Shaped
Column II
G-1-1X-1-1K-1-11004.1450
G-1-2X-1-2K-1-2900
G-1-3X-1-3K-1-31350
G-2-1X-2-1K-2-120032.9450
G-2-2X-2-2K-2-2900
G-2-3X-2-3K-2-31350
G-3-1X-3-1K-3-1300111.3450
G-3-2X-3-2K-3-2900
G-3-3X-3-3K-3-31350
Table 2. Peak strain of measuring point on the specimens.
Test PointY1Y2Y3Y4Y5Y6Y7Y8Y9Y10Y11Y12
Conditions
G-2-1583553292163105963683521661528876
X-2-179871740325924201121032021939894
K-2-170165431819338311261111951909582
G-2-28942948613012141875014833913549684
X-2-2114031911012894236129115801624328249
K-2-210233179802745645133124764568314227
G-2-3971246347964302247763547532483146102
X-2-315195018721489534213113112201088577470
K-2-31399389631131271591541481046980548410
G-3-11578146358923648932012311119928794282239
X-3-120391907642488887924622817101629833708
K-3-1191818326054321029828927116111420743617
G-3-217366691654531574501147312991129994325301
X-3-22489112221771073968629529120491883982822
K-3-2217976420497961258433832118201647794716
G-3-3---430136420417016301814---1360---398373
X-3-332219341238229312799332308---------966
K-3-33030------2112161109---3352003---------
Note: Y1 to Y12 are the number of strain measuring points.
Table 3. Peak displacement in tubular flange column test (mm).
Test PointG-1-1G-1-2G-1-3G-2-1G-2-2G-2-3G-3-1G-3-2G-3-3
W10.31.31.66.16.78.610.614.322.1
W21.03.14.613.115.018.220.327.837.4
W31.74.67.116.619.826.131.336.648.4
Note: W1–W3 in the table is the displacement measurement points.
Table 4. Peak displacement in the special-shaped column I test (mm).
Test PointX-1-1X-1-2X-1-3X-2-1X-2-2X-2-3X-3-1X-3-2X-3-3
W10.61.62.69.710.212.814.522.539.1
W21.93.67.617.118.423.926.940.458.8
W32.34.911.820.822.728.341.658.889.7
Table 5. Peak displacement in the special-shaped column II test (mm).
Test PointK-1-1K-1-2K-1-3K-2-1K-2-2K-2-3K-3-1K-3-2K-3-3
W10.51.52.28.69.110.613.815.230.6
W21.43.46.616.117.021.224.936.750.1
W32.04.89.919.921.127.235.445.681.6
Table 6. Peak acceleration in tubular flange column test (m·s−2).
Test PointG-1-1G-1-2G-1-3G-2-1G-2-2G-2-3G-3-1G-3-2G-3-3
J1223024492799308135614267570564807531
J2253127413240361743215036621770168388
J3326034874021475953286379698978409940
Note: J1–J3 in the table is the acceleration measuring point.
Table 7. Peak acceleration in the special-shaped column I test (m·s−2).
Test PointX-1-1X-1-2X-1-3X-2-1X-2-2X-2-3X-3-1X-3-2X-3-3
J1300234914183452451496058732181289773
J23564377044364900573769667815900111,082
J3432146985526587267448036879010,18813,018
Table 8. Peak acceleration in the special-shaped column II test (m·s−2).
Test PointK-1-1K-1-2K-1-3K-2-1K-2-2K-2-3K-3-1K-3-2K-3-3
J1274230033289347140015431610269898934
J23064342136713903459859496719729310,347
J33907423749365031598371247923884611,830
Table 9. Loading condition of grid-type dam.
Code of MembersD/mV0/m·s−1H/m
ColumnsBeams
GZ-1-1GL-1-11105
GZ-1-2GL-1-27.8
GZ-1-3GL-1-311.6
GZ-2-1GL-2-12105
GZ-2-2GL-2-27.8
GZ-2-3GL-2-311.6
GZ-3-1GL-3-13105
GZ-3-2GL-3-27.8
GZ-3-3GL-3-311.6
Note: D represents the diameter of the impact stone; V0 represents the speed of the block stone; H represents the height of the impact point.
Publisher’s Note: MDPI stays neutral with regard to jurisdictional claims in published maps and institutional affiliations.

