Article

MCD and Induced CD of a Tetraphenoxyperylene-Based Dye in Chiral Solvents: An Experimental and Computational Study

1
Dipartimento di Medicina Molecolare e Traslazionale, Università di Brescia, Viale Europa 11, 25123 Brescia, Italy
2
Istituto Nazionale di Ottica (INO), CNR, Research Unit of Brescia, c/o CSMT, VIA Branze 45, 25123 Brescia, Italy
*
Author to whom correspondence should be addressed.
Symmetry 2022, 14(6), 1108; https://doi.org/10.3390/sym14061108
Submission received: 30 April 2022 / Revised: 23 May 2022 / Accepted: 24 May 2022 / Published: 28 May 2022
(This article belongs to the Special Issue Asymmetric Molecules and Chirality Recognition)

Abstract

:
The magnetic circular dichroism (MCD) spectrum of N,N′-bis(2,6-diisopropylphenyl)-1,6,7,12-tetraphenoxyperylene-3,4:9,10-tetracarboxydiimide, also known as Lumogen Red 300 or ROT-300, has been recorded both in achiral and chiral solvents. The induced CD spectra in chiral solvents have, similarly, been recorded. A discussion of the spectroscopic response, both in CD and in MCD experiments, is presented in this paper. Both types of spectra have been predicted most satisfactorily by DFT calculations; the CD spectra were obtained by assuming the prevalence of one “enantiomeric” conformer and the same set of conformers could also be used for MCD, since “enantiomeric” structures present identically in MCD spectra.

1. Introduction

The properties of extended and eventually distorted aromatic systems, representing nanographene models, are quite interesting for optical and optoelectronic applications, and a number of recent studies have been presented in the literature [1,2,3,4]. In that respect, circular dichroism (CD) spectroscopy, aimed at characterizing chiral distortion, and magnetic circular dichroism (MCD), being quite sensitive to electronic level properties, are both useful techniques. Considering the latter spectroscopy, experimental and theoretical studies of extended aromatics are not so common [5,6]. For all these reasons, we have found that N,N′-bis(2,6-diisopropylphenyl)-1,6,7,12-tetraphenoxyperylene-3,4:9,10-tetracarboxydiimide is an interesting example, presenting both induced CD and MCD. This compound is a common dye with a tetraphenoxy-perylene central core, employed, for example, in lasers [7,8,9]. The chemical formula, presented in Scheme 1 together with the atom numbering and which we will call ROT-300 for brevity, shows six peripheral phenyl substituted moieties: four O-phenyl groups and the two meta-isopropyl-phenyl groups, with the latter oriented perpendicular to the perylene plane. The central perylene moiety is distorted by the steric hindrance of O-phenyl substituents. In a previous publication [10], it was demonstrated using preliminary DFT calculations that two conformational enantiomers of equal energy and thus with equal population exist, with the two minima being related to two enantiomeric distortions of the perylene core. The presence of four pendant groups, however, gives in principle a variety of conformers. Depending on the pendant groups’ spatial orientation, these conformers are asymmetric and not simply dissymmetric; however, we may group all conformers into two classes based on the two possible core distortions. When the solvent is achiral, the two enantiomeric conformer groups are “silent” from the chiroptical point of view, since they are in equal amount. However, when the solvent is either chiral or sufficiently enantio-enriched, a little unbalance occurs, namely, one conformer becomes more populated, depending on the solvent absolute configuration, than the other conformer, and indeed experimentally, one obtains an induced circular dichroism (CD) spectrum, which inverts its sign when working with the enantiomeric solvent. The phenomenon of deracemization, due to solvents or other causes in molecules containing enantiomeric conformers, has been studied for a long time [11,12,13,14,15,16]. More specifically, the presence of equivalent double minima is a common motif in the presence of conformational axial chirality [17] and is particularly interesting for aromatic compounds such as helicenes [18,19,20] or chiral peropyrene molecules [3], where it is interesting to consider the enantiomeric unbalance introduced simply by the solvent.
In this work, we plan to provide a better description of ROT-300 by considering the most populated conformers after extended conformational search and, most importantly, by taking advantage of further spectroscopic data, namely, magnetic circular dichroism (MCD) spectra [21,22,23,24]. We will compare experimental data in chiral and achiral solvents with DFT calculations of the B terms and of rotational strengths (vide infra) performed for the relevant conformers; in this way, we expect to provide a better characterization of the dye ROT-300 than has been carried out previously [10]. Indeed, it is expected that the two enantiomeric families of conformers (which can be tested using solvents of opposite chirality) exhibit opposite CD and equal MCD, while obviously, on the other hand, each one of these two conformers shows opposite MCD upon reversal of the magnetic field and, of course, equal CD.

2. Materials and Methods

2.1. Experiments

ROT-300 was purchased from Kremer Pigmente, GmbH & Co., KG-Aichstetten, Germany; (−)-diethyl d-tartrate and (+)-diethyl l-tartrate were purchased from Sigma Aldrich and employed without further purification.
UV-Vis absorption, and CD and MCD spectra were recorded using a J-815SE spectrometer, equipped with a home-built cell holder hosting neodymium-based magnets, which produced a 1 T magnetic field in a 0.2 cm pathlength quartz cell, as previously presented [25]. Measurements were performed on ca. 10−5 M solutions at room temperature. Twenty scans were taken for each orientation of the magnetic field. Solvent MCD and CD spectra were measured in the same conditions and subtracted from the corresponding MCD and CD spectra.

2.2. Calculations

A conformational search was carried out using the CREST protocol, based on the semiempirical extended Tight-Binding approach GFN2-xTB [26]. Conformers found within the energy window of 0–6 kcal/mol were optimized using the Gaussian16 package [27] at the B3LYP/TZVP level of theory.
UV, CD and MCD spectra were calculated using Dalton2016 software [28,29] at a B3LYP/6-311g(d,p) level of theory. The calculated spectra were then generated by assigning a Gaussian-shaped band (bandwidth 800 cm−1) to each transition, centered at the calculated wavelength with either oscillator strength, or rotational strength or B term areas, according to the considered spectra. In order to reduce the computational cost, for Dalton calculations, a truncated model of Scheme 1 was considered with R = CH3.
Vibronic calculations were performed, employing the sum-over-states (or time-independent, TI) approach as implemented in Gaussian16 [27]. The vertical gradient (VG) model and Franck–Condon approximation (FC) were employed (VG|FC) [30,31].

3. Results and Discussion

MCD is a technique which, after the seminal works of Stephens [23,24] and the parallel papers by Moscowitz and Djerassi [21,22], has been found quite useful in better defining the electronic states [32]. In addition, MCPL (magnetic circularly polarized luminescence) has been measured and studied recently [33,34].
In Figure 1, we present the induced CD (in l- and d-diethyltartrate solutions) and MCD spectra of ROT-300, aimed at proving the dependence of the recorded signal on the applied magnetic field. Figure 1a shows the MCD spectra of ROT-300 in l-diethyltartrate for magnetic field B, parallel and antiparallel to the direction of the incident light beam, superimposed onto the plain CD spectra, namely, for the B = 0 magnetic field. Figure 1c shows the corresponding UV-vis absorption spectrum. In Figure 1b, we superimposed the MCD spectra of ROT-300 for the parallel magnetic field taken in l-diethyltartrate and in d-diethyltartrate, obtained by subtracting, from the B-parallel MCD spectrum in Figure 1a, the plain CD spectrum (l-diethyltartrate solvent) reported in this same Figure 1a and carrying out the analogous operation for the d-diethyltartrate solvent. Finally, in Figure 1d, we present the plain CD spectra (magnetic field B = 0) of ROT-300 taken in l-diethyltartrate and in d-diethyltartrate. The last results are quite similar, apart from noise, to those obtained earlier [10]. We noticed that the observed MCD features at 300 nm and at ca. 550 nm are at the same wavelength as the CD features, even though not exactly with the same shape and same intensity ratio; on the other hand, the band observed at ca. 450 nm is typical of MCD.
The MCD spectra thus obtained may be compared with the MCD spectra of ROT-300 in an achiral solvent, acetonitrile, reported in Figure 2, which allowed us to slightly extend the spectral range to a lower wavelength. One may notice that, for the same range, the MCD spectra in chiral and achiral solvents are, to a large extent, superimposable and are different for just the shape of the band at 550 nm and for the intensity ratio of the 300 and 450 nm bands; in particular, the band at 300 nm is identical in wavelength and intensity. These data gave us confidence that the MCD spectra could be reproduced by ab initio calculations, despite the fact that we do not treat the two solvents explicitly.
Indeed, the DFT calculations, carried out after a conformational search with CREST protocol allowed us to check that there are three mostly populated sets of conformers (see Table 1): the first set has just one member, A, which possesses D2 symmetry and presents a distortion in the central perylene moiety of ca. 30°, with the equivalent orientation of the pendant groups; the second set contains four equivalent conformers B1, B2, B3 and B4, corresponding to different conformations for each one of the four O-phenyl groups, plus approximately the same distortion in the perylene moiety; and the third set C contains the two O-phenyl groups on one side equally distorted, thus making two equivalent conformers C1 and C2 possible. In Table 1, just one conformer is presented for each family and the degeneracies of conformers B and C have been taken into account to correct the Boltzmann factors and thus to contribute to the population factors provided in the same table. The values of the dihedral angles reported in Table 1, which are similar to the values previously found in Ref. [10], help one to understand the conformational properties of ROT-300. In particular, one may understand from these positive values for the dihedral angles of the central perylene unit (ca. 30°) that in the calculations, we considered an overall P configuration. Based on the above derived population factors and with the values of calculated wavelengths, oscillator strengths, rotational strengths and B terms for the electronic transitions, as described in the methods section, we arrived at the calculated spectra in Figure 3 of these P-type conformers. Considering the enantiomeric excess evaluated in Ref. [4], we rescaled the presented calculated CD spectrum. We report in Figure S1 the CD and MCD spectra of the three most populated conformer sets.
The correspondence with experimental spectra is remarkable for the UV-vis absorption spectra and, more importantly, for the MCD and induced CD spectra. Obviously, identical MCD spectrum is associated with both the P-type and M-type conformers, which are equally present in an achiral solvent, such that their MCD spectra summed up to the same magnetic field orientation (while summing the CD spectra, they cancelled each other out).
The first electronic transition was calculated to have a positive rotational strength and a positive B term, as observed, whereas the second transition brought negative contribution for both CD and MCD. The third transition had again a negative B term, whereas it had a positive rotational strength. This resulted in a well-defined negative MCD band at 440 nm and more blurred negative-positive features for CD. At lower wavelengths (300–290 nm), an overall positive feature was calculated, with many variable contributions, both for MCD and CD. More precisely, in the case of the dominant conformer, a (+,−) doublet was calculated for MCD, with the high energy negative component being observed in the case of acetonitrile solution in Figure 2, while it was not accessible in Figure 1 due to solvent absorption.
Considering in detail the wavelengths and spectroscopic responses of the principal electronic transitions for the main representatives of the three conformer sets A, B and C reported in Table S1 and the three calculated CD and MCD spectra plotted in Figure S1, we noticed that in all three cases, the first transition exhibited a similar MCD and CD response for all P-type conformers (however showing blue shift and intensity increase for cases B and C). As an indication of the chiral distortion of the aromatic core, we may consider the dissymmetry ratio g of the first transition, which was isolated from the others and was calculated within the interval 0.73–1.2 × 10⁻³ for the three conformers. The region 500–350 nm presented noteworthy variability; in CD, many features with alternating sign were present and tended to cancel each other, while MCD gave overall negative features, red shifted in case B and quite extended in case C. In addition, the band at 300 nm was quite dependent on sign and intensity from conformation.
These results may find an explanation in the analysis of the principal transitions. We considered the most important conformer, which is populated at 90% and possesses D2 symmetry, with the three C2 axes being such that the x-axis passes through atoms N-4 and N-11, the y-axis bisects bonds C-7a—C-7b and C-14b—C-14a and the z-axis is perpendicular to the first two, that is, perpendicular to the average perylene plane. We examined in Figure 4 the plot of the energy levels and the representation of the molecular orbitals most involved in the principal electronic transitions, demonstrating the most important CD and MCD activity. Furthermore, in Table 2, the electric and magnetic dipole transition moments and the principal orbitals involved in the most intense transitions are reported with the detail of the corresponding symmetry. Considering rotational strengths, symmetry is important and helpful; the electric and magnetic dipole transition moments are either parallel or antiparallel and directed along the symmetry axes. Symmetry also selected the dipole transition moment contributions entering the expression for the B term [23,35,36]; however, too many terms needed to be evaluated in order to obtain reliable results [35]. Herein, the B term was de facto calculated by the single residue of the quadratic response function corresponding to the electric dipole operator and to the angular momentum operator [37] through the Dalton package [28,29].
Examining the molecular orbitals (MOs) involved in the main electronic transitions in order of increasing energy, as represented in Figure 4, one observes that for the first transition, which is a pure HOMO to LUMO transition, the two MOs present electronic density localized on the perylene core, with no involvement of the O-phenyl groups. Furthermore, the two dipole transition moments μ and m are directed along the x long axis of the perylene moiety. The second transition involves HOMO−1 to LUMO, and the two dipole transition moments are transverse with respect to perylene; the initial state presents some delocalization on the O-phenyl groups. The third transition is from HOMO−2 to LUMO, again with some delocalization on substituents; the transition moment direction is perpendicular to the average plane of perylene.
The higher energy features show iCD and MCD activity, which are largely dependent on conformational mobility; in the case of the relevant conformer A, the most intense bands at 295 nm can be assigned to two transitions, from HOMO to LUMO + 4 and from HOMO to LUMO + 3, the arrival states presenting some involvement of O-phenyl groups.
For the sake of comparison, we also optimized a symmetric meso structure, which, in any case, presented too high an energy to be spectroscopically of interest; in this case, the symmetry was C2h, with the C2 axis (indicated in Scheme 1 as y axis) transverse to the main perylene longitudinal axis (indicated as x axis) and the phenoxy group, oriented in p conformation on one side and in M conformation on the other side. The perylene moiety was not completely flat (the two central dihedral angles 7-7a-7b-8; 1-14b-14a-14 are + and −27°).
The change in symmetry generated some mixing of the components of the transition moments along the two axes (herein x and z), both directed perpendicular to the symmetry axis; despite this fact, the resulting features were again quite few and the spectra (absorption and MCD) were very simple and similar to the one calculated for conformer A. We may say that the differences observed for conformers B and C are related to the lack of symmetry, while the shape was recovered when considering the meso form or considering a model molecule with just the distorted perylene core of conformer A, with no pendant apart from OH groups (see Figure S3). In this last case, as reported in Table S2, one may notice a change in the band relative intensities. Nonetheless, the simulated transitions at lower energy matched well with those of the full systems, as expected by their localization on the perylene-3,4:9,10-tetracarboxydiimide core. Therefore, we employed this smaller system as a model to investigate the vibronic contributions to the spectra.
In Figure 5, the purely electronic spectra and hybrid spectra, in which the first transition was modeled with the vibronic VG|FC model (Vertical-Gradient, Frank–Condon) [25,26], are reported. Since we operated within the FC approximation (the transition dipole moments were considered to be constant with respect to the normal coordinates and therefore acted as a scaling factor) and since the first electronic transition was well separated from the others, only the UV-Vis spectra are reported in the main text. Interested readers are directed to Supplementary Materials for the equivalent CD result (Figure S5). Though the most intense contribution arose from the 0-0 transition, non-negligible contributions arising from other vibronic transitions were also present in the spectra (see Table S3 for a list of the most relevant transitions). It was observed that a group of low energetic vibrations accounted for the asymmetric band shape of the most prominent peak, whereas a second set of vibronic transitions explained the shoulder at 550 nm. These last normal modes, of which the ν107 is the most intense, can be recognized as the G (at about 1600 cm−1) and D (around 1350 cm−1) modes (see Figure S4 for a representation of the displacement vectors), which are expected to play crucial roles in the vibronic progression in polyaromatic systems [3]. Indeed, the inclusion of vibronic transitions in the simulation confirmed the vibronic nature, due to the simple Frank–Condon effect of the shoulder, which was observed at about 535 nm in all the experimental spectra.
As a final consideration, it is worthwhile to recall the fundamental aspect that justifies why MCD is identical for opposite enantiomers. Indeed, one may look at the formula for term B [37] for the transition from the ground state |a⟩ to the excited state |j⟩:
B ( a j ) = { k a k | m | a ω k · a | μ | j × j | μ | k + k j j | m | k ω k ω j · a | μ | j × k | μ | a }
where |k⟩ is the generic excited state, mixed in through perturbation by the magnetic field; ωk is its frequency (ωj being the frequency of state |j⟩, in which we are interested); and μ and m are the electric and magnetic dipole moment operators, respectively. The latter are a polar and axial vector, respectively [38,39], namely vector types that either change or do not change under inversion operation or through reflection symmetry operation. Since, in Equation (1), the cross product of the two terms containing the electric dipole moment operator is also an axial vector [38], this means that the B ( a j ) term is a pure scalar term, being the dot product of two axial vectors; namely, it is invariant under reflection or inversion. The reflection and inversion symmetry operation are exactly the operations relating two enantiomers; thus, MCD is expected to be invariant in going from one enantiomer to the other. On the other hand, CD is related to the rotational strength [40]:
R ( a j ) = Im { a | μ | j j | m | a }
The latter quantity is a pseudo-scalar [38] and changes signs under inversion and reflection, which are the two symmetry operations relating enantiomers.

4. Conclusions

In this work, we have reported the measured MCD spectra for ROT-300 in the range 600–200 nm, recorded both in chiral and achiral solvents: the molecule presented two sets of enantiomeric conformers that were equally balanced in achiral solvents, thus giving only an MCD optical response; on the contrary, they were slightly unbalanced in chiral solvents and thus, in this case, they presented iCD spectra together with MCD spectra. It is interesting to notice that some relevant MCD features were also observed in a region where CD is quite weak. It is well known that the origins of MCD and CD bands are quite different [21,22,23,24] and, thus, the two types of spectroscopic response may not resemble each other; a similar situation has been recently observed in other chiral systems [36].
The DFT calculations were of great help in the spectral analysis; in particular, herein, an evaluation of B term and rotational strengths gave an excellent comparison of calculated and experimental spectra. The interest of this example is that on one side, the chirality was just an induced chirality and, on the other hand, the major conformer was highly symmetric, permitting a clear classification of the transition moments involved and thus greatly simplifying the interpretation.
The comparison calculations-experiments were excellent, even if not perfect, and this calls for further improving the computational approach, with methods that have not been employed here, for example, accounting for vibronic features [41], which do not behave the same way in achiral and chiral solvents (see Figure 1 and Figure 2).
Furthermore, studies of this type may be of interest in the framework of searching for hints of magneto-chiroptical effects [42].

Supplementary Materials

The following supporting information can be downloaded at www.mdpi.com/article/10.3390/sym14061108/s1. Figure S1: Calculated MCD and CD spectra of ROT-300 conformers A, B and C and the meso form. Figure S2: Comparison of calculated and experimental MCD and UV spectra of ROT-300 in acetonitrile. Figure S3: Model ROT-300 molecule for vibronic calculations compared to full ROT-300. Figure S4: Representation of the most relevant normal modes related to the vibronic contributions. Figure S5: Computed CD spectra of the model molecule. Table S1: Simulated transitions of ROT-300 for the main conformers: energy, D, R and B terms. Table S2: Comparison of Model ROT-300 calculations to full ROT-300 calculations. Table S3: Calculated vibronic features for Model ROT-300.

Author Contributions

S.A. and G.L.: conceptualization, writing, supervision. G.L.: calculations. S.G.: spectra recording. M.F.: calculations, writing. G.M.: investigation, writing. All authors have read and agreed to the published version of the manuscript.

Funding

Funding was provided by the Italian Ministry of Education, University and Research (MIUR) through the PRIN program (PRIN 2017, project “Physico-chemical Heuristic Approaches: Nanoscale Theory of Molecular Spectroscopy” (PHANTOMS), prot. 2017A4XRCA).

Data Availability Statement

The data presented in this study are available in the article or supplementary materials.

Acknowledgments

This research was carried out with the support of Big&Open Data Innovation Laboratory (BODaI-Lab), University of Brescia, granted by Fondazione Cariplo and Regione Lombardia and of the Computing Center CINECA (Bologna), Italy. We wish to thank Lorenzo Paoloni, who carried out the preliminary investigations on this subject.

Conflicts of Interest

The authors declare no conflict of interest.

References

  1. Dresselhaus, M.S.; Jorio, A.; Hofmann, M.; Dresselhaus, G.; Saito, R. Perspectives on Carbon Nanotubes and Graphene Raman Spectroscopy. Nano Lett. 2010, 10, 751–758. [Google Scholar] [CrossRef]
  2. Mori, T. Chiroptical Properties of Symmetric Double, Triple, and Multiple Helicenes. Chem. Rev. 2021, 121, 2373–2412. [Google Scholar] [CrossRef] [PubMed]
  3. Yang, W.; Longhi, G.; Abbate, S.; Lucotti, A.; Tommasini, M.; Villani, C.; Catalano, V.J.; Lykhin, A.O.; Varganov, S.A.; Chalifoux, W.A. Chiral Peropyrene: Synthesis, Structure, and Properties. J. Am. Chem. Soc. 2017, 139, 13102–13109. [Google Scholar] [CrossRef]
  4. Medel, M.A.; Tapia, R.; Blanco, V.; Miguel, D.; Morcillo, S.P.; Campaña, A.G. Octagon-Embedded Carbohelicene as a Chiral Motif for Circularly Polarized Luminescence Emission of Saddle-Helix Nanographenes. Angew. Chem. 2021, 133, 6159–6165. [Google Scholar] [CrossRef]
  5. Stephens, P.J.; Schatz, P.N.; Ritchie, A.B.; McCaffery, A.J. Magnetic Circular Dichroism of Benzene, Triphenylene, and Coronene. J. Chem. Phys. 1968, 48, 132–138. [Google Scholar] [CrossRef]
  6. Michl, J. Magnetic Circular Dichroism of Aromatic Molecules. Tetrahedron 1984, 40, 3845–3934. [Google Scholar] [CrossRef]
  7. Stagira, S.; Nisoli, M.; Cerullo, G.; Zavelani–Rossi, M.; De Silvestri, S.; Lanzani, G.; Graupner, W.; Leising, G. The Role of Amplified Spontaneous Emission in the Ultrafast Relaxation Dynamics of Polymer Films. Chem. Phys. Lett. 1998, 289, 205–210. [Google Scholar] [CrossRef]
  8. Gvishi, R.; Reisfeld, R.; Burshtein, Z. Spectroscopy and Laser Action of the “Red Perylimide Dye” in Various Solvents. Chem. Phys. Lett. 1993, 213, 338–344. [Google Scholar] [CrossRef]
  9. Castiglione, F.; Lanzani, G.; Mele, A.; Monguzzi, A.; Passarello, M.; Ruggirello, A.; Scotognella, F.; Liveri, V.T. Spectroscopic Characterization of Red Perylimide/Surfactant Nanocomposites. J. Mater. Sci. 2011, 46, 6402–6407. [Google Scholar] [CrossRef]
  10. Abbate, S.; Lebon, F.; Longhi, G.; Passarello, M.; Liveri, V.T. Triggering Dissymmetry in Achiral Dye Molecules by Chiral Solvents: Circular Dichroism Experiments and DFT Calculations. Chirality 2011, 23, 910–915. [Google Scholar] [CrossRef] [Green Version]
  11. Person, R.V.; Peterson, B.R.; Lightner, D.A. Bilirubin Conformational Analysis and Circular Dichroism. J. Am. Chem. Soc. 1994, 116, 42–59. [Google Scholar] [CrossRef]
  12. Ghidinelli, S.; Abbate, S.; Mazzeo, G.; Boiadjiev, S.E.; Lightner, D.A.; Longhi, G. Biliverdin Chiral Derivatives as Chiroptical Switches for PH and Metal Cation Sensing. Phys. Chem. Chem. Phys. 2021, 23, 20138–20151. [Google Scholar] [CrossRef] [PubMed]
  13. Novotná, P.; Králík, F.; Urbanová, M. Chiral Recognition of Bilirubin and Biliverdin in Liposomes and Micelles. Biophys. Chem. 2015, 205, 41–50. [Google Scholar] [CrossRef]
  14. Lightner, D.A.; Gawronski, J.K.; Gawronska, K. Conformational Enantiomerism in Bilirubin. Selection by Cyclodextrins. J. Am. Chem. Soc. 1985, 107, 2456–2461. [Google Scholar] [CrossRef]
  15. Rybicka, A.; Longhi, G.; Castiglioni, E.; Abbate, S.; Dzwolak, W.; Babenko, V.; Pecul, M. Thioflavin T: Electronic Circular Dichroism and Circularly Polarized Luminescence Induced by Amyloid Fibrils. Chem. Phys. Chem. 2016, 17, 2931–2937. [Google Scholar] [CrossRef]
  16. Brittain, H.G.; Richardson, F.S. Solvent Induced Circularly Polarized Emission from Fluorescein. J. Phys. Chem. 1976, 80, 2590–2592. [Google Scholar] [CrossRef]
  17. Cahn, R.S.; Ingold, C.; Prelog, V. Specification of Molecular Chirality. Angew. Chem. Int. Ed. Engl. 1966, 5, 385–415. [Google Scholar] [CrossRef]
  18. Lebon, F.; Longhi, G.; Gangemi, F.; Abbate, S.; Priess, J.; Juza, M.; Bazzini, C.; Caronna, T.; Mele, A. Chiroptical Properties of Some Monoazapentahelicenes. J. Phys. Chem. 2004, 108, 11752–11761. [Google Scholar] [CrossRef]
  19. Bam, R.; Yang, W.; Longhi, G.; Abbate, S.; Lucotti, A.; Tommasini, M.; Franzini, R.; Villani, C.; Catalano, V.J.; Olmstead, M.M.; et al. Four-Fold Alkyne Benzannulation: Synthesis, Properties, and Structure of Pyreno[a]Pyrene-Based Helicene Hybrids. Org. Lett. 2019, 21, 8652–8656. [Google Scholar] [CrossRef]
  20. Arnaboldi, S.; Cauteruccio, S.; Grecchi, S.; Benincori, T.; Marcaccio, M.; Biroli, A.O.; Longhi, G.; Licandro, E.; Mussini, P.R. Thiahelicene-Based Inherently Chiral Films for Enantioselective Electroanalysis. Chem. Sci. 2019, 10, 1539–1548. [Google Scholar] [CrossRef] [Green Version]
  21. Schooley, D.A.; Bunnenberg, E.; Djerassi, C. Magnetic Circular Dichroism Studies: A Preliminary Report *. Proc. Natl. Acad. Sci. USA 1965, 53, 579–586. [Google Scholar] [CrossRef] [PubMed] [Green Version]
  22. Seamans, L.; Moscowitz, A.; Barth, G.; Bunnenberg, E.; Djerassi, C. Magnetic Circular Dichroism Studies. XVIII. Structure and the Magnetic Circular Dichroism of Saturated Ketones. J. Am. Chem. Soc. 1972, 94, 6464–6475. [Google Scholar] [CrossRef]
  23. Stephens, P.J. Theory of Magnetic Circular Dichroism. J. Chem. Phys. 1970, 52, 3489–3516. [Google Scholar] [CrossRef]
  24. Stephens, P.J. Magnetic Circular Dichroism. Adv. Chem. Phys. 1976, 35, 197–264. [Google Scholar]
  25. Ghidinelli, S.; Abbate, S.; Mazzeo, G.; Paoloni, L.; Viola, E.; Ercolani, C.; Donzello, M.P.; Longhi, G. Characterization of Tetrakis(Thiadiazole)Porphyrazine Metal Complexes by Magnetic Circular Dichroism and Magnetic Circularly Polarized Luminescence. Chirality 2020, 32, 808–816. [Google Scholar] [CrossRef]
  26. Grimme, S. Exploration of Chemical Compound, Conformer, and Reaction Space with Meta-Dynamics Simulations Based on Tight-Binding Quantum Chemical Calculations. J. Chem. Theory Comput. 2019, 15, 2847–2862. [Google Scholar] [CrossRef]
  27. Frisch, M.J.; Trucks, G.W.; Schlegel, H.B.; Scuseria, G.E.; Robb, M.A.; Cheeseman, J.R.; Scalmani, G.; Barone, V.; Petersson, G.A.; Nakatsuji, H.; et al. Gaussian 16 Rev. C.01; Gaussian Inc.: Wallingford, CT, USA, 2016. [Google Scholar]
  28. Aidas, K.; Angeli, C.; Bak, K.L.; Bakken, V.; Bast, R.; Boman, L.; Christiansen, O.; Cimiraglia, R.; Coriani, S.; Dahle, P.; et al. The Dalton Quantum Chemistry Program System. WIREs Comput. Mol. Sci. 2014, 4, 269–284. [Google Scholar] [CrossRef]
  29. Dalton, a Molecular Electronic Structure Program. Release V2020.1. 2022. Available online: http://daltonprogram.org (accessed on 1 May 2022).
  30. Ferrer, F.J.A.; Santoro, F. Comparison of Vertical and Adiabatic Harmonic Approaches for the Calculation of the Vibrational Structure of Electronic Spectra. Phys. Chem. Chem. Phys. 2012, 14, 13549–13563. [Google Scholar] [CrossRef]
  31. Bloino, J.; Baiardi, A.; Biczysko, M. Aiming at an Accurate Prediction of Vibrational and Electronic Spectra for Medium-to-Large Molecules: An Overview. Int. J. Quantum Chem. 2016, 116, 1543–1574. [Google Scholar] [CrossRef] [Green Version]
  32. Michl, J. Electronic Structure of Aromatic π-Electron Systems as Reflected in their MCD Spectra. Pure & Appl. Chem. 1980, 52, 1549–1563. [Google Scholar] [CrossRef] [Green Version]
  33. Imai, Y. Circularly Polarized Luminescence (CPL) Induced by an External Magnetic Field: Magnetic CPL (MCPL). Chem. PhotoChem. 2021, 5, 969–973. [Google Scholar] [CrossRef]
  34. Ghidinelli, S.; Abbate, S.; Mazzeo, G.; Paolesse, R.; Pomarico, G.; Longhi, G. MCD and MCPL Characterization of Luminescent Si(IV) and P(V) Tritolylcorroles: The Role of Coordination Number. ACS Omega 2021, 6, 26659–26671. [Google Scholar] [CrossRef] [PubMed]
  35. Štěpánek, P.; Bouř, P. Computation of Magnetic Circular Dichroism by Sum-over-States Summations. J. Comput. Chem. 2013, 34, 1531–1539. [Google Scholar] [CrossRef]
  36. Kaminský, J.; Andrushchenko, V.; Bouř, P. Natural and Magnetic Circular Dichroism Spectra of Nucleosides: Effect of the Dynamics and Environment. RSC Adv. 2021, 11, 8411–8419. [Google Scholar] [CrossRef] [PubMed]
  37. Coriani, S.; Jørgensen, P.; Rizzo, A.; Ruud, K.; Olsen, J. Ab Initio Determinations of Magnetic Circular Dichroism. Chem. Phys. Lett. 1999, 300, 61–68. [Google Scholar] [CrossRef]
  38. Landau, L.D.; Lifshitz, E.M. The Classical Theory of Fields, 3rd ed.; Pergamon: Oxford, UK, 1971; pp. 6–18. [Google Scholar]
  39. Piepho, S.B.; Schatz, P.N. Group Theory in Spectroscopy: With Applications to Magnetic Circular Dichroism; Jon Wiley & Sons: New York, NY, USA, 1983; Volume 1. [Google Scholar]
  40. Rosenfeld, L. Quantenmechanische Theorie der natürlichen optischen Aktivität von Flüssigkeiten und Gasen. Z. Physik 1929, 52, 161–174. [Google Scholar] [CrossRef]
  41. Khani, S.K.; Faber, R.; Santoro, F.; Hättig, C.; Coriani, S. UV Absorption and Magnetic Circular Dichroism Spectra of Purine, Adenine, and Guanine: A Coupled Cluster Study in Vacuo and in Aqueous Solution. J. Chem. Theory Comput. 2019, 15, 1242–1254. [Google Scholar] [CrossRef] [PubMed]
  42. Atzori, M.; Train, C.; Hillard, E.A.; Avarvari, N.; Rikken, G.L.J.A. Magneto-Chiral Anisotropy: From Fundamentals to Perspectives. Chirality 2021, 33, 844–857. [Google Scholar] [CrossRef] [PubMed]
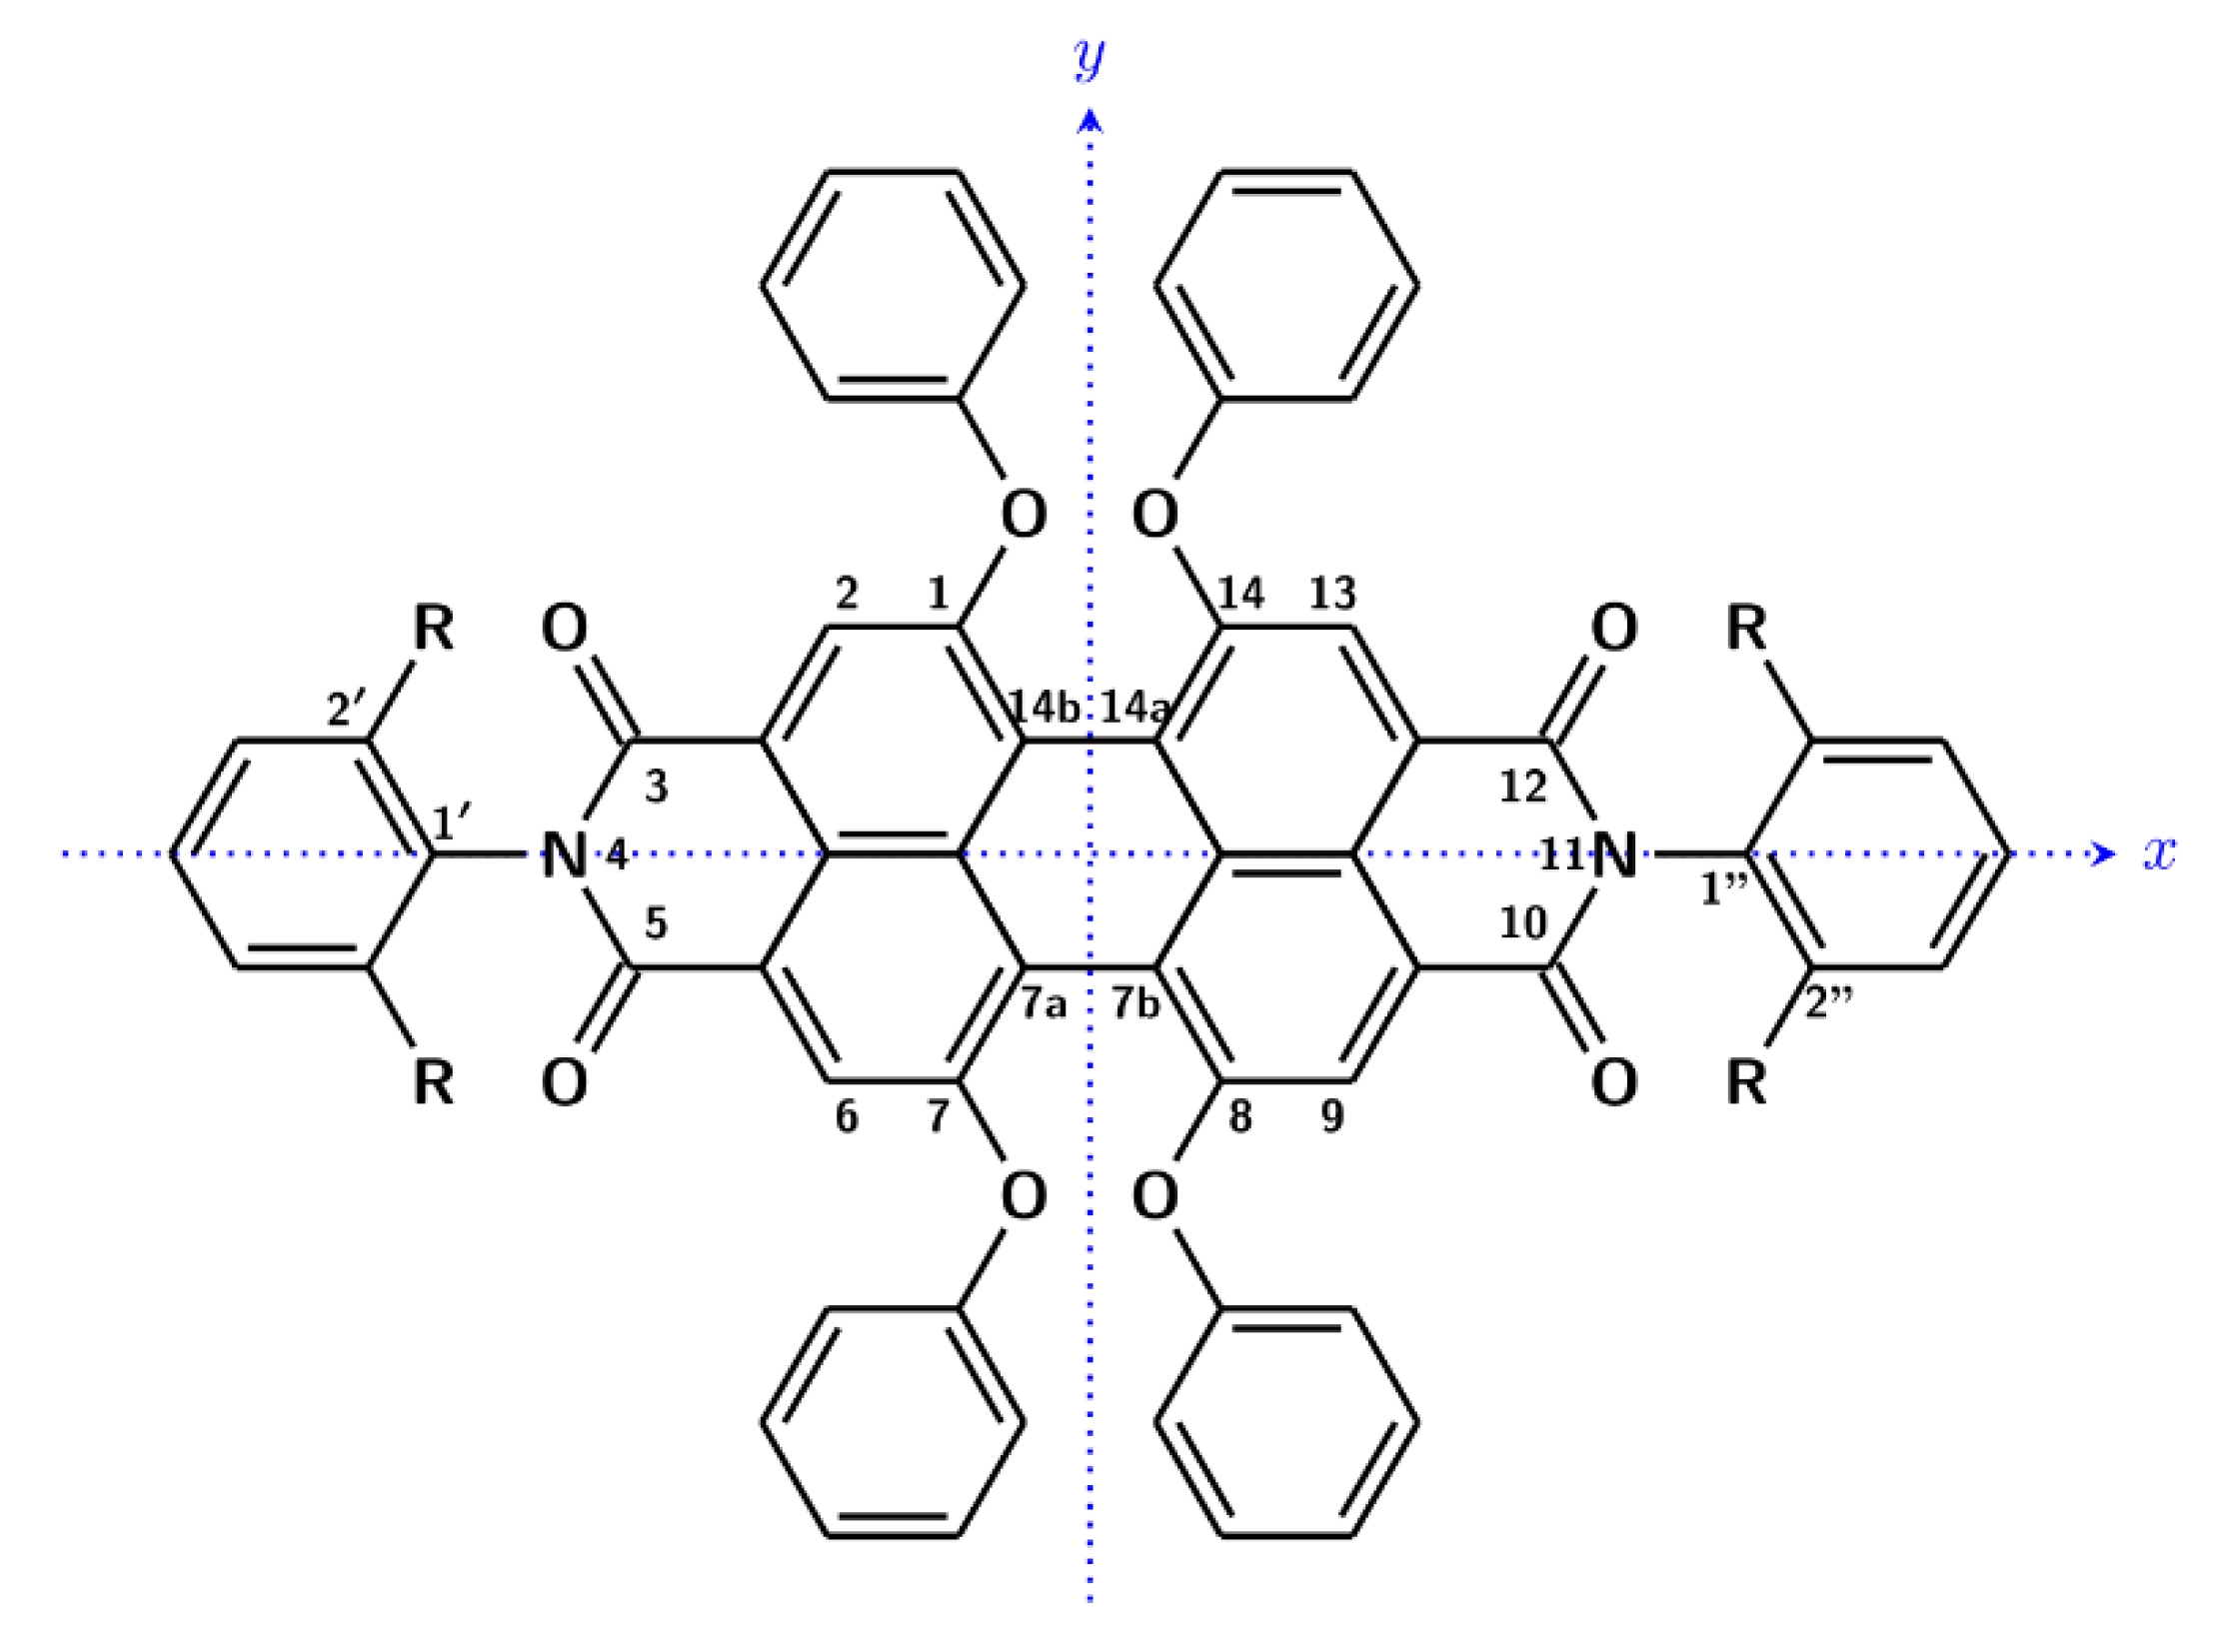
Scheme 1. Molecular structure of ROT-300 (R = iPr) with atom numbering. The z axis is defined as to form a right handed (x,y,z) system.
Symmetry 14 01108 sch001
Figure 1. Induced circular dichroism (iCD) and MCD response of ROT-300, as measured in diethyl d-tartrate and diethyl l-tartrate (see text). (a) Recorded spectra for ROT-300 in diethyl l-tartrate with magnetic field B parallel or antiparallel to the light beam direction and with no magnetic field; (b) MCD spectra in diethyl d-tartrate and diethyl l-tartrate, with B parallel to light beam direction, obtained by subtracting the CD spectrum for B = 0 field; (c) absorption spectrum; (d) iCD spectra in diethyl d-tartrate and diethyl l-tartrate (B = 0).
Symmetry 14 01108 g001
Figure 2. Experimental UV (a) and MCD (b) spectra of ROT-300 in acetonitrile. External magnetic field was placed parallel (blue line curve) and antiparallel (red curve) with respect to the light beam.
Symmetry 14 01108 g002
Figure 3. Calculated average MCD (top), CD (middle) and UV-vis (bottom) spectra of the three main conformers A, B and C for ROT-300. Sticks refer to the most populated conformer A. The CD spectrum has been scaled considering the enantiomeric excess evaluated in Ref. [10] for diethyl tartrate solution.
Symmetry 14 01108 g003
Figure 4. Molecular orbitals (MOs) involved in the main electronic transitions with the symmetry group species (referring to the conformer A, having D2 symmetry). (H = HOMO, L = LUMO, etc.).
Symmetry 14 01108 g004
Figure 5. Computed UV-Vis spectra of the model molecule (see Figure S3). The purely electronic spectra (orange) and hybrid spectra, in which the first electronic transition was simulated employing the VG|FC vibronic model (blue), are reported. Purely electronic transitions (red vertical lines) were broadened by means of Gaussian distribution functions with HWHMs = 800 cm−1, while HWHMs of 500 cm−1 were used for the vibronic model (green vertical lines). The most relevant vibronic transitions are annotated.
Symmetry 14 01108 g005
Table 1. Boltzmann population factors and dihedral angle values (degree) of the main conformers of ROT-300. Atom numbering is reported in Scheme 1 (* 10-11-1″-2″ has the same values).
Perylene UnitN-Phenyl *O-Phenyl
Conf.Pop7-7a-7b-81-14b-14a-146-2-13-93-4-1’-2’7b-8-O-Ph7a-7-O-Ph14b-1-O-Ph14a-14-O-Ph
A90%31.531.533.390.1−164.4−164.4−164.4−164.4
B7%31.332.233.289.8−163.7−164.2−144.463.3
C3%31.830.432.989.9−164.7−167.763.163.1
Table 2. Characteristics of the electronic transitions corresponding to the principal observed band energy values, wavelength, principal orbital contributions and their symmetry, electric and magnetic dipole transition moments (μ and m, respectively), dipole strength D, rotational strengths R (10−40 esu2 cm2) and B (a.u.) terms. Symmetry species for μ and m is reported in parenthesis.
eVnm μ
10−18 esu×cm
m
10−21 esu×cm
DRB
12.13582H->La->b3μx (b3)−8.5671mx (b3)−1.4135742,36813542.7
22.79444H-1->Lb1->b3μy (b2)4.5427my (b2)−2.9289196,764−107−89.2
32.87433H-2->Lb2->b3μz (b1)1.2996mz (b1)5.308317,11196−21.3
304.21295H->L+4a->b2μy (b2)4.9283my (b2)−3.7374238,788−152.0316.4
314.22294H->L + 3 (H-2->L)a->b1μz (b1)1.6097mz (b1)13.488125,881196.9−18.0
Publisher’s Note: MDPI stays neutral with regard to jurisdictional claims in published maps and institutional affiliations.

