Abstract
Adaptive control of traffic engineering (TE) based on 5G network function virtualization (NFV) authorizes the efficient and dynamic network resource allocation, whose utilization is increasingly wide and will become more widespread. In this paper, we first devise an adaptive control scheme for data-driven traffic migration engineering (TME) on the 5G virtual network. The proposed TME technology focuses on a 5G enhancing mobile broadband (eMBB) network application scenario and takes the network operating expenditure (OPEX) as the main research target. Firstly, we predict the network traffic of the virtual network through the constructed traffic predicted mathematical model. Then, based on the triangle inequality violation (TIV) theorem, some local network traffic is adaptively migrated when the predicted link traffic exceeds the peak rate. Consequently, the migrations of logical links in the virtual network layer are completed. Finally, our experiments show that the proposed protocol can effectively improve the key performance indicators (KPIs) of the reconfigured network, such as throughput, delay and energy consumption. Furthermore, the Fridman and Holm statistical hypothesis tests are also used to analyze the simulation data, which proves that the proposed approximate TME algorithm has statistical significance.
1. Introduction
The 5G network is a symmetric cellular communication network, which is defined by the 3rd Generation Partnership Project (3GPP) [1]. The multiple-input multiple-output (MIMO) technology of the 5G network provides hardware and software support for the diverse supplies and demands in the development of modern society. The 5G intelligent network is a kind of radio access network (RAN), which has good performance in mass data transmission [2]. The management system of the 5G network can recognize different network interface information. Moreover, the constructed network can meet the demands of KPIs for diversified resource allocation technologies.
Due to the excellent performance of the 5G network, the applications of key technologies based on 5G network are more and more extensive, such as spatial information networking technology, smart city, internet of vehicles, Internet of Things (IoT), artificial intelligent (AI), soft computing, fog radio access network optimization, user plane functions in 5G networks, beyond wireless networks and the depth of open-source networks [3,4,5,6]. And these technologies can serve aerospace, navigation, transportation, navigation, positioning, emergency rescue, intelligent life and other aspects. Moreover, the technologies mentioned above have high requirements for the network of high-level dynamicity, low latency and reliable transmission and high-density device access.
Involved with standards, specifications, modes, tools and data sets, another key requirement for the 5G network is the rapid allocation of network resources in order to achieve optimal performance [7]. That is, the 5G network requires the optimal configuration and allocation of network resources such as communication, computing and storage [8].
This paper intends to virtualize a 5G network in consideration of eMBB network application scenarios, and then builds an adaptive TME system for reconfiguring the 5G virtual network. In order to meet the optimal network resource allocation and the adaptive control of network energy consumption at the same time, we provide a solution of 5G virtual network energy management to adaptively control the energy consumption. Firstly, we map the mobile communication software definition network (SDN) devices to open virtual switches (OVSs) and predict the link traffic on the virtual network at time t by using the Shannon’s second theorem, which related to previous time . Then, we modify the predicted traffic model by two steps. Finally, based on the TIV theorem [9], we perform traffic migration when the predicted traffic exceeds the peak rate in a virtual link. Through the above traffic prediction and migration engineering, it is expected to reduce traffic congestion and improve the efficiency of the network energy management, delay and throughput.
The main contributions of this paper are the following:
- (1)
- In this paper, the TE problem is considered as the principal aspect of resource allocation in the 5G virtual network. We simply establish the associated traffic topological model through comprehensive consideration of traffic prediction and migration to complete the optimization task of data transmission;
- (2)
- A simple and efficient TE technology is proposed for the network slicing. To improve the efficiency of data traffic migration, a modified adaptive traffic prediction model is used to predict the traffic in the virtual link of the network. Then, based on the triangle inequality violation theorem, some local network traffic is adaptively migrated when the predicted link traffic exceeds the peak rate. Finally, the migrations of logical links in the virtual network layer are completed;
- (3)
- To the best of our knowledge, this is an early effort in considering how to change the configuration of the virtual slices in a timely fashion, while including the TE, such as latency, throughput and resource allocation of the network.
The remainder of this paper is arranged as follows. In Section 2, we present the related work and the current state of the art for this paper. In Section 3, the network model and problem formulation are introduced, and then the proposed problem is modeled and solved mathematically. Section 4 is the simulation validation and the analysis of the results. Section 5 illustrates the statistical analysis of the proposed algorithm. Finally, Section 6 concludes the paper and provides a discussion on future work in the related research issues.
2. Related Work
The construction and reconfiguration technology of the 5G network slices based on TE can complete the allocation of virtual resources more effectively. Many research results [9,10,11,12,13,14,15] show that it has very good performance in establishing and solving the constructed mathematical programming model of resource allocation in a 5G network. Fossati et al. [11] propose an efficient multiresource allocation scheme based on virtual networks. The proposed scheme establishes a multiresource allocation mathematical model first, and then an average operator is weighted in order to optimize the framework of the model. Finally, by taking different resources into consideration comprehensively, the equitable allocation method is proposed to solve the problem of equitable sharing of multiple resources between slices, such as link bandwidth, spectrums and computing resource.
Chang et al. [12] propose a mathematical model of incentive allocation strategy for the mobile NFV network mapped from the physical layer. This model takes the associated service demands of users and the maximum revenue of NFV as the goals, and realizes the effective allocation of the network resources by constructing the optimal contract of the physical link. An optimization method of resource allocation is presented for a distributed 5G network in [10]. The established convex optimization model for resource allocation authorizes the efficient and dynamic management of the 5G network services. Addad et al. [13] build a slicing optimization mathematical model for cross-domain 5G networks. This model allows the mobile network operators to allocate the basic physical resources efficiently according to the user requirements. The heuristic greedy algorithm is used to optimize the slice deployment time and execution time with low End-to-End (E2E) latency and high link bandwidth, and it improves the efficiency of wireless communication base stations in the physical layer, which are mapped to the NFV layer. Chiha et al. [14] propose a mathematical model based on OPEX allocation of network slicing, which can be used to price different E2E services. By combining resource allocation algorithms and multidimensional 5G VNF, the authors in [14] also further propose a model to study the cost-saving strategy of NFV for the core network. On account of the servicing quality requirements such as energy and delay in cloud RAN, Borylo et al. [15] solve the problem of how to provide the optimal resource allocation schemes for network slices. The proposed scheme can meet the actual demands for E2E latency and energy awareness by employing the effective and configurable heuristic algorithm.
Simultaneously, the intelligence and security of the NFV network slicing are also the main KPIs to measure the 5G network. Based on the characteristics of big data, Chuah et al. [16] propose an intelligent RAN slicing broadband access architecture framework, which promotes cross-industry infrastructure cooperation. Shahriar et al. [17] execute the reliable segmentation on bandwidth compression and multichannel transmission in 5G network, which ensures not only the optimal allocation of bandwidth, computing and other resources, but also the safety performance of resource allocation. Carpio et al. [18] scale migrations and replications of VNF based on network TE. Based on the constructed traffic prediction model, they use a mixed-integer linear programming model, as well as a greedy algorithm, to solve the traffic optimization problem that considers both migrations and replications of VNFs.
On the other hand, due to the losses or changes in the service requirements of virtual links, the network slices need to be reconfigured dynamically after the constructed network slices run for a period of time. Pozza et al. [19] propose a re-configuration strategy for the 5G network slices, which takes the network latency and bandwidth allocation as constraints in its constructed traffic problem model, establishes a feasible and orderly configuration sequence from the original slicing, and then migrates virtual OVSs and links dynamically. For multiple distributed controllers, Zhong et al. [20] propose a prediction-based SDN load balancing dual-weight switch migration scheme. The scheme can quickly balance the load between controllers and reduce the number of switch migrations.
Qu et al. [6] propose a service-oriented TE scheme based on SDN-NFV integration for 5G network. In a data center (DC) virtual network, the classical A* Search algorithm [21] can resolve the problem of traffic link allocation efficiently. This algorithm is a heuristic algorithm that places all nodes in the Open set and Close set. The Open set stores the nodes that have been selected, and the Close set stores the nodes that have not been selected. Then, the authors explore the links from the source node to the destination node to obtain the optimal data traffic link according to the priority level of nodes. Latency is the main KPI in TE-based DC network, Han et al. [22] summarize the future DC networking from low latency to deterministic latency. This article focuses on effective latency reduction design, which mainly aims at reducing the queuing delay in switches.
Aiming at Egress Peer Engineering (EPE), Shaer et al. [23] allocate the network traffic with different destinations to the constructed internal autonomous routing system. This system considers the dynamic property and unpredictability of network traffic, and updates the traffic allocation to meet the minimum OPEX. In addition, the TE algorithm has great applications, such as smart city [24], intelligent community, Industrial Internet of Things (IIoT) [25,26,27,28,29], some vertical business services [30,31,32], and so on.
Bagaa et al. [33] introduce a Quality of Service (QoS)-aware network configuration and multipath forwarding method, and then propose a resource allocation technology, HPR, based on SDN. The HPR algorithm provides the efficient network configuration by exploiting the Dijkstra shortest-path algorithm. On the premise of the reasonable computing time, the HPR algorithm ensures the efficiency with lower OPEX. However, HPR algorithm does not consider the overall network traffic load balancing and resource utilization. To this end, it is necessary to further explore the optimization scheme for such problems.
The main purpose of a TE-based network is to achieve the mission objectives given by users and rapidly allocate the network resources through TE optimally. Most of the existing solutions have shortcomings in the aspects of feasibility and scalability, such as the joint optimization of TE, resources and KPIs. Especially in the traffic control phase, the network resources such as energy of nodes are greatly affected by traffic. Moreover, in the traffic control phase, load balancing is greatly affected by traffic, therefore, it is necessary to combine TE with resource allocation to obtain the optimal KPIs. In the actual NFV networks, prediction and migration should be harmonized. It would be more efficient in resource allocation of the 5G NFV networks if the traffic were predicted before being migrated. Based on the above observations, in this paper, we first adaptively predict the link traffic at time t, and then carry out the traffic migration based on the TIV theorem and traffic prediction at time . This is expected to improve the usage rate of network resources. The measurement accuracy of TME is improved by modifying the traffic prediction. The constructed systems will serve the intelligent transportation system based on TE technology.
3. SDN-Driven Traffic Migration Engineering (TME) Model
3.1. Network Model and Problem Formulation
In this paper, the issues considered in the elaboration of the network mainly include the following aspects: (1) An initial value of energy resources for each traffic control devices (i.e., OVSs), which needs to consume a certain amount of energy resources to monitor and forward data traffic; (2) Throughput of the network; (3) The average delay of the network, namely E2E latency; (4) The OPEX of the network, that is, the optimal number of the used OVSs within 1 km2 of the physical layer in order to achieve the best effects of (1)–(3) at the same time. That is to say, we achieve the optimal resource allocation under the optimal KPIs and the minimum OPEX in the eMBB application scenarios. The network model and problem formulation are described as follows.
In the actual physical layer network, the actual position of SDN devices with communication function is random and dynamic, and the mapping symmetric OVSs in corresponding virtual networks also have the characteristics of dynamism and randomness. In this paper, we set up a random virtual network for the study of our problem, and the topology of the virtual network is shown in Figure 1. The blue nodes in Figure 1 represent OVSs, and the central location (red ⋆) is the virtual macro base station (MBS) of the virtual network. Additionally, all OVSs in the network transmit the data traffic to the base station through multihop communications.
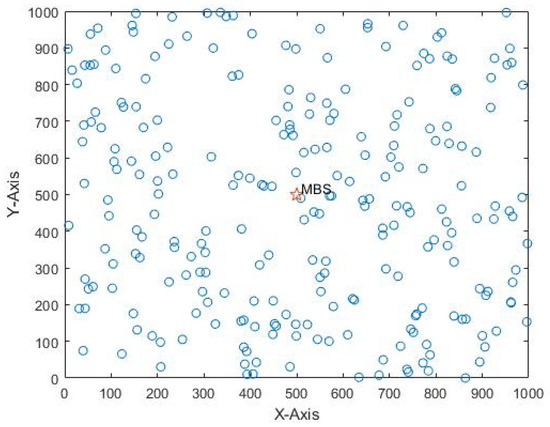
Figure 1.
The virtual slice network model.
Let denote a weighted virtual network protocol, where V represents the set of OVSs; E represents the set of links (edges) and each link is associated with weights B and R. Table 1 summarizes the notations used in this paper.

Table 1.
Notations.
3.2. The Description of TME
The optimization of network resource allocations based on TE is a complicated multi-objective, multiconstraint and non-convex optimization problem [15]. The prediction and migration processes are limited by the traffic controller and the constraints of different KPIs, such as peak rate and latency. In addition, a dynamic traffic prediction and migration framework is designed for network slices, which needs to be flexible enough and allows the network resource allocation among slices, customers, or services according to different purposes, or specific operational requirements in different application scenarios. As the 5G network services need to be improved in terms of time latency and node energy efficiency, one of the above optimization problems must be solved in order to supply resources to slices successfully [16]. In order to allocate the network resources through the joint optimization of resources and TE, we must complete the resource scheduling through the high-capacity network link interconnection by distributed computing. Finally, the resources are allocated optimally through the optimal configuration and the optimal migration of TE [21]. Based on the basic theory research of network [1,2,3,4,5,6,7,8,9,10,11,12,13,14,15,16,17,18,19,20,21,22,23,24,25,26,27,28,29,30,31,32,33], we aim to break through the bottleneck of network resource allocation technology. Therefore, we turn to developing a service protocol framework, which is conducive to the development of the above technologies and provides theoretical and technical reference for the development of the above technologies through the exploration of new methods and theories.
The general meaning of traffic migration in virtual network slice layers is shown in Figure 2.
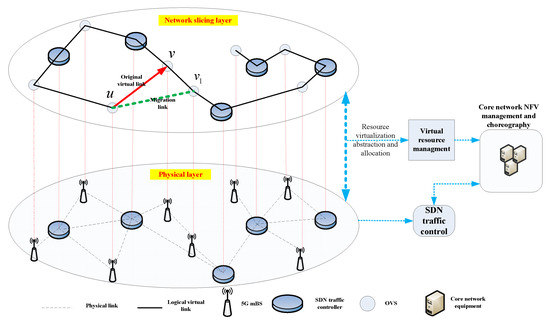
Figure 2.
Traffic migration in virtual network slice layer.
The detailed descriptions for traffic migration are as follows. When the traffic in logical link exceeds its peak rate, the virtual link will suffer from data congestion and lead to the increase of the data transmission latency and even the losses of data. Therefore, we need to migrate the traffic in virtual logical link . However, the migration is limited to the power of OVS and we can only find and establish a new data transmission link in the neighbor of OVS u. If we find an appropriate OVS in whose traffic does not exceed the peak rate of the newly built virtual link and this link also has a low time latency, then the traffic in will be migrated to the newly built link . Finally, we complete the traffic migration and delete the original link , and then use the newly built link for data traffic transmission.
3.3. Traffic Prediction Model
The network traffic prediction is very important for traffic migration. As the initial traffic monitoring value is very important for traffic prediction, each OVS has the responsibility for traffic monitoring in this paper. Assume the initial traffic monitoring value in link is , and the traffic in virtual link at time t is related to instants . Therefore, we construct the traffic prediction model in link at time t, which is shown below
where are the adaptive control coefficients of the network traffic, satisfying and . The values of can be achieved by actual simulated traffic. In this paper, we fix and provide a degradation traffic coefficient d such that , which is similar to the pheromone degradation mode in the ant colony algorithm.
For convenience, we introduce two vectors
and
Therefore, Equation (1) is rewritten as
The traffic prediction model (4) needs to be modified due to the signal noise. Here, we use a traffic modification coefficient to improve the traffic prediction model (4).
A two-step-modification traffic optimization model is elaborated on in this section. First, we modify the data traffic in link at time t, which is related to original predicted traffic and the maximum allowed traffic (peak rate) . Then, the accuracy of traffic prediction is improved based on the above-predicted traffic at instants t and . The specific two-step traffic modification model is described as below.
Step 1. Denote the first modified value of the predicted traffic in link as
According to Shannon’s second theorem, peak rate is related to bandwidth , signal transmitting power and channel noise power as follows
In real network traffic, we always use signal-to-noise ratio instead of . Therefore, Formula (6) can be transformed into
Step 2. Denote the second modified value of the predicted traffic as , which is updated by and in virtual link as follows
After the above two-step modifications, the network traffic can adaptively migrate the virtual link traffic that exceeds the peak rate. The specific migration rules are described in Section 3.4.
3.4. Adaptive Traffic Migration Control Model
Referring to Figure 2, the main principle of adaptive traffic migration control model is described below.
After the data traffic prediction, the traffic prediction value in link is obtained at time t. Next, we compare peak rate with in link . If the traffic in this link satisfies , we do not migrate the data traffic in link ; otherwise, the data traffic needs to be migrated. When predicted traffic in link exceeds peak rate , it is necessary to find a new link in (the neighbors of OVS u), which meets the requirements of traffic and low latency, for replacing to complete the traffic transmission work. In this paper, we use the TIV principle to complete the traffic migration work, which is shown in Figure 3.
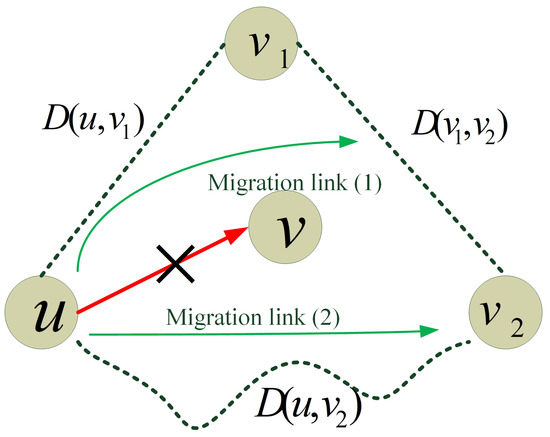
Figure 3.
Diagram of TIV migration Principle.
Assume there are two OVSs , satisfying . We use D to represent the data traffic transmission latency of the link. If , which does not violate the TIV principle, then we can migrate the traffic to link and delete link directly, which is shown as Migration link (2) in Figure 3. Otherwise, if , which violates the TIV principle, then the traffic cannot be migrated to the shortest link , and it is necessary to migrate the traffic in link to link , so as to complete the traffic migration locally.
Algorithm 1 gives the pseudocode of the proposed TME algorithm in this paper.
Here, we give the specific process description of Algorithm 1, which is shown as follows:
Step 1: In TME, we input the coordinates and simulation parameters of each OVS in the network and the network will output the simulation results, such as the lifetime, throughput and latency. Initialize the network, use the greedy scheme to construct the data transmission links with the shortest path and run the network one time (lines 1–2).
Step 2: For all OVSs, we predict traffic of link at time t (lines 3–13).
Step 3: After the two-step modification of the traffic prediction, we migrate some traffics if the predicted traffics exceed the peak rate, so as to complete the traffic migration in the congestion link to a nearby link. Then, we finish the link reconfiguration in virtual network slicing (lines 14–18).
| Algorithm 1 The TME algorithm. |
| Require: |
| The coordinates and simulation parameters of each OVS and MBS. |
| Ensure: |
| The lifetime, throughput of the network and the residual energy resources of each OVS. |
| 1: Initialization: Initialize the virtual network slicing. |
| 2: Virtual network topology construction: Use the greedy strategy to construct the virtual network link model with the shortest delay and run the network for the first time. |
| 3: for All OVSs do |
| 4: if There is an OVS damaged or no energy resource. then |
| 5: Terminate running the network and output data. |
| 6: else if Predict traffic of link at time t. then |
| 7: The original model of the first traffic prediction: |
| 8: |
| 9: Calculate the peak rate at time t: |
| 10: |
| 11: The second modification of the model: |
| 12: |
| 13: |
| 14: while do |
| 15: Use the TIV principle for traffic migration |
| 16: end while |
| 17: end if |
| 18: end for |
3.5. Complexity Analysis of the Algorithm
Theorem 1.
The complexity of the TME algorithm is , where denotes the number of links in the network.
Proof of Theorem 1.
Firstly, the algorithm traverses all OVSs once according to the minimum delay, and the complexity is . Then, we have a traffic prediction for all the virtual links and the process traverses all the links once and all OVSs twice. The complexity of this process is thus . Finally, in the process of traffic migration, all OVSs are traversed once and the complexity is . Therefore, the run-time complexity of the TME algorithm is totally. □
4. Validation and Result Analysis
In order to verify the effectiveness of the TME algorithm, we repeated the simulation experiment several times, and then it was compared with the original TE (TE without traffic prediction and migration) algorithm and the classical network TE algorithms: A* Search [21] and HPR [33]. This paper focuses on KPIs such as network throughput, run time and average delay of data traffic transmission. When the network runs one time, we count one round. The simulation environment was a Win7 64-bit system with CPU being Intel Core i5-7500 3.4 GHz, and memory being 4.00 GB. The simulation software used in this research were Visual C++ 6.5 and MATLAB 2017B. Table 2 shows the simulation parameters.
Table 2.
Simulation parameters.
4.1. The Peak Rates under Different SNRs
The peak rate of the logical link in the virtual network layer determines the traffic upper limit of the link. Figure 4 shows the peak rate under different SNRs. We can see from Figure 4 that the higher the SNRs are, the higher the traffic upper limit is allowed by the logical link.
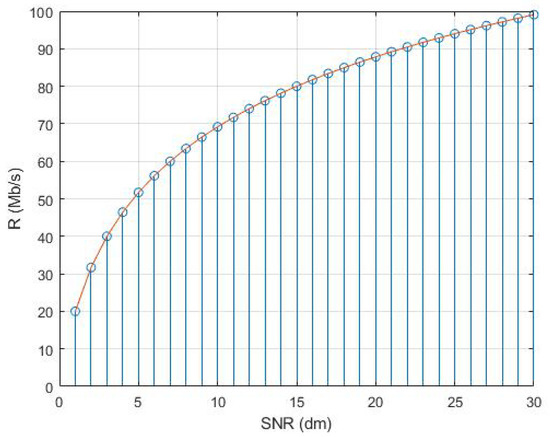
Figure 4.
The peak rates under different SNRs.
4.2. KPIs with Different Numbers of OVSs
Referring to the input data in Reference [33] in our experiments, we randomly input 50–400 OVSs in the virtual network slicing and output the network run time, throughput and average delays. The other simulation parameters are shown in Table 2. Figure 5 shows the comparison results of network run time under different numbers of OVSs in virtual network slicing. We can see from Figure 5 that the network runs for the longest time when there are 250 OVSs in the network. This is because when there are fewer OVSs and the transmission distance increases, OVSs will consume the energy resources very rapidly. Meanwhile, when there are more OVSs and the network generates more data, each link needs to bears more data traffic transmission tasks. Both of the above cases will lead to the excessive energy resource consumption of OVSs. From the point of view of OPEX, when there are 250 OVSs, the virtual network has the optimal performance.
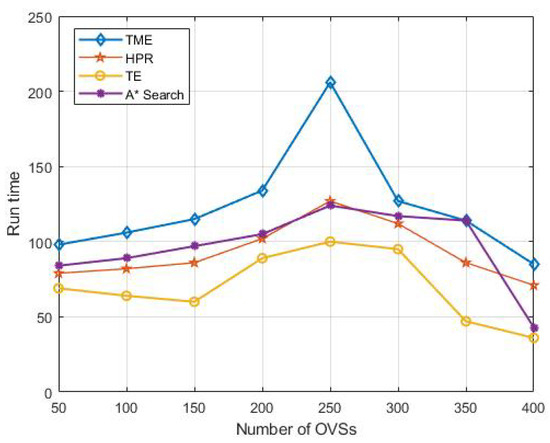
Figure 5.
Network run time under different numbers of OVSs.
Nonetheless, the proposed TME algorithm always has the longest network run time compared with the HPR, TE and A* Search algorithms. In addition, the maximum value of running time can be reached with 250 OVSs, and the network running time of the proposed TME algorithm can be up to 206 rounds, while of the HPR, TE and A* Search algorithms are 127, 100 and 124, respectively. Obviously, the performance of the proposed TME algorithm is almost improved double that of the other three algorithms. This is because the TME algorithm migrates the links if the predicted traffic exceeds the peak rates, and thus balances the local traffic load and reduces the consumption of energy resources, as well. It is an iterative process from local optimization to global optimization. This process effectively inhibits the excessive energy consumption of OVSs caused by traffic overload of local links and prolongs the service time of all OVSs in the whole virtual network at the same time.
Figure 6 shows the network throughput with different numbers of OVSs in the virtual network. We can see from Figure 6 that the network throughput increases gradually as the numbers of OVS increase. This is because each OVS is responsible for monitoring and transmitting the traffic data, and the traffic increases as the numbers of OVSs increase. Regardless, the network throughput of the proposed TME algorithm is always more than that of the HPR, TE and A* Search algorithms as the number of OVSs increases. The TME controls the loss of traffic and improves the throughput of the network effectively. From the point of view of the network local link, the overloads of data traffic for the HPR, TE and A* Search algorithms can lead to data losses, thus reducing the network throughput.
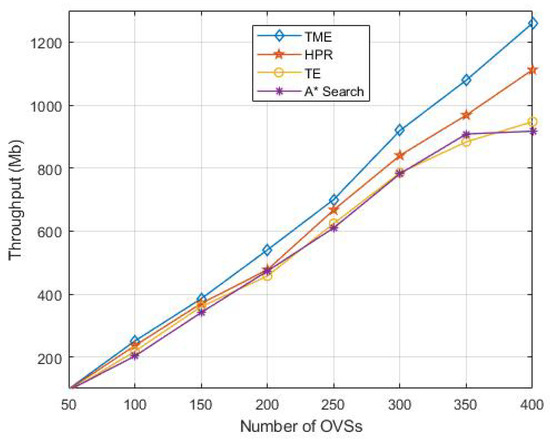
Figure 6.
Network throughput with different numbers of OVSs.
Figure 7 shows the network average delays with different numbers of OVSs in virtual network and the inconsistency of the average delays as the numbers of OVSs increase. We can see from Figure 7 that the minimum delays occur with 250 OVSs in the network for all algorithms, and the reasons are the same as the network run time. The traffic transmission distance will be longer if the number of OVSs is smaller, and the OVS needs much more time to transmit the traffic. The more OVSs there are, the more data traffic needs to be transmitted, which will lead to an increase of time delay. From the point of view of the delay of 5G network, the optimal number of equipment supported by one MBS within 1 km2 in the physical layer is 200–300 in our simulation environment. Regardless, the delay of the TME algorithm is always the lowest and the fluctuation of TME is small at the same time, which also benefits from the migration of local traffic. Migrating the traffic in congested links can significantly improve the quality of data transmission and reduce the delay of data transmission.
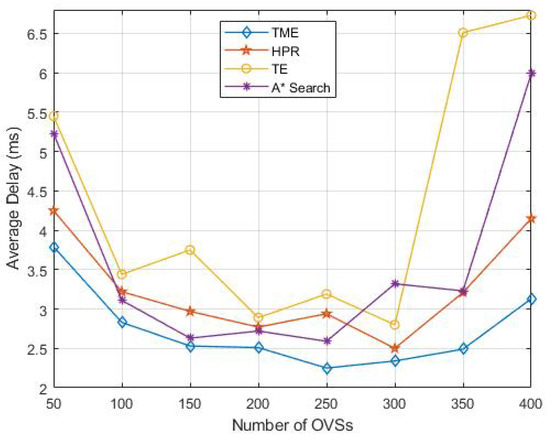
Figure 7.
Network average delays with different numbers of OVSs.
4.3. KPIs with 250 OVSs under Different SNRs
Figure 8a–c show the comparison results of KPIs with 250 OVSs in the virtual network layer under different SNRs. As the TE and A* Search algorithms do not perform traffic migration, the influence of SNRs on the channel is not considered in the simulation. It can be seen from Figure 8a–c that when the SNR is 10–15 dm, the TME and HPR algorithms reach the optimal performance of network run time, throughput and delay. Therefore, the TME algorithm reaches the optimal state when SNR is 10–15 dm and the number of OVSs is 250 with the set simulation parameter in this paper.
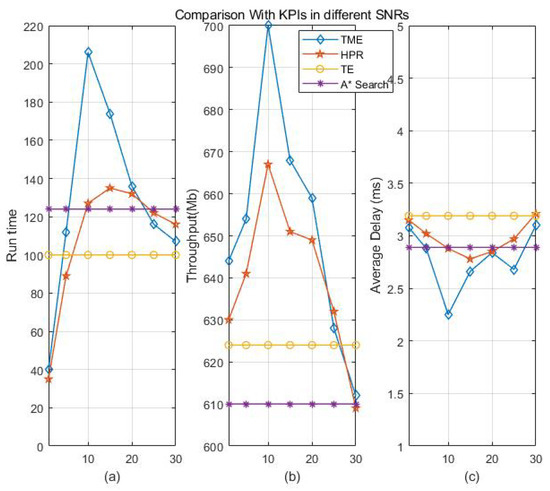
Figure 8.
KPIs with 250 OVSs under different SNRs. (a) KPI (Run time). (b) KPI (Throughput). (c) KPI (Average delay).
4.4. The Residual Energy Resources and Their Variance
The simulation results in the previous section show that the network performance is optimal when SNR is 10 dm and the number of OVSs in the network is 250. Then, the overall energy resource consumption of the virtual network is simulated under the optimal state.
Figure 9 shows the variation of the average residual energy resources of the network as the running time increases. The network will stop when the OVS is damaged or energy resources depletion occurs in the virtual layer. We can see from Figure 9 that the proposed TME algorithm has the most residual energy resources out of the HPR, TE and A* Search algorithms under the same run time. Figure 10 presents the variance of energy consumption as the run time increases. The TME algorithm has the smallest variance, which reflects the balance of energy resource consumption and indicates that the data traffic load of OVSs in the virtual network layer is relatively balanced. This result verifies the effectiveness of the TME algorithm in traffic prediction migration from the perspective of traffic balance, and the reasons are described in detail in Section 4.
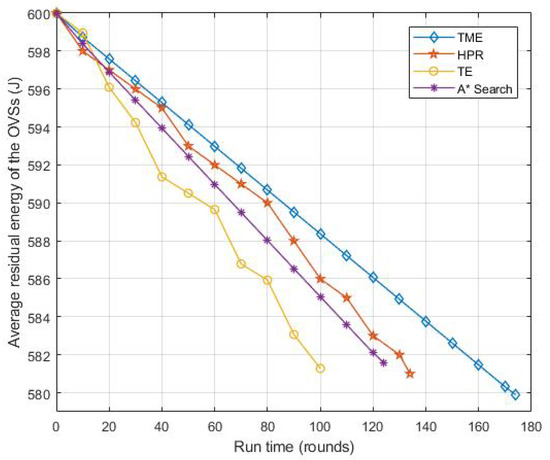
Figure 9.
The residual energy resources under 10 dm and 250 OVSs.
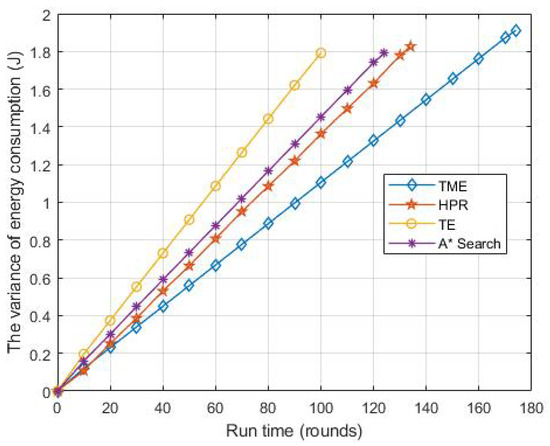
Figure 10.
The variance of residual energy resources with 10 dm SNR and 250 OVSs.
5. Statistical Analysis of Algorithm Performance
This paper presents a hypothesis test for the problem of network OPEX from a statistical analysis perspective. We used Friedman and Holm tests to verify the effectiveness of the proposed TME algorithm for the consumption of energy resources.
5.1. Friedman Test
The Friedman test was applied to obtain the mean ranks of A* Search, TE, HPR and TME algorithms in terms of average residual energy resources of the network. The results are shown in Table 3.
Table 3.
Friedman test.
The higher the average residual energy resources of the network is, the better the algorithm is. According to the results in Table 3, the TME algorithm is superior to the other three algorithms.
5.2. Holm Test
In order to further test whether the proposed TME algorithm is significantly better than the other three algorithms, the Holm test was used simultaneously in this study. We only considered the average residual energy resources when the network runs 100 rounds. We checked whether there is a significant difference between the TME algorithm and the other three algorithms with . The results are shown in Table 4.
Table 4.
Holm test.
The above results show that the TME algorithm proposed in this paper is statistically significant different from the other three algorithms, that is, the TME algorithm is significantly better than the other three algorithms.
6. Conclusions and Future Work
In this paper, we perform adaptive control of network traffic prediction and modification in the process of slice reconfiguring, and then use the TIV theorem to migrate the traffic if the link traffic exceeds the peak rate. The adaptive migration process completes the reconfiguration of the logical virtual link, and thus completes the reconfiguration of the virtual networks and the allocation of resources more efficiently. Aiming at the eMBB application scenario, the effectiveness of the proposed algorithm is verified from the perspectives of network OPEX and KPIs, such as network run time, delay and throughput. The performance of the configuration is measured and compared with the other two algorithms, and the effectiveness of the proposed TME approximate algorithm is analyzed from a statistical point of view.
There are many different domains where the advanced optimization algorithms (e.g., heuristics, metaheuristics, machine learning algorithm, deep convolutional neural network) have been applied as solution approaches, such as online learning, scheduling, multi-objective optimization, transportation, medicine, data classification, and others [34,35,36,37,38]. Inspired by these applications, we will try to use some advanced optimization algorithms to solve the TE-based optimization problems in our future research work. We will also construct the dynamic slicing migration strategy to meet the resource allocation requirements by using the advanced optimization algorithms.
Author Contributions
Conceptualization, Z.Z.; Investigation, Z.Z.; Methodology, X.M.; Supervision, Z.Z.; Validation, X.M.; Writing—original draft, Z.Z.; Writing—review & editing, X.M. and Y.C. All authors have read and agreed to the published version of the manuscript.
Funding
This work was supported in part by the Fundamental Research Funds for the Central Universities (No. JB210707) and the Open Research Project of the State Key Laboratory of Industrial Control Technology, Zhejiang University, China (No. ICT2022B39).
Institutional Review Board Statement
Not applicable.
Informed Consent Statement
Not applicable.
Data Availability Statement
The data (including the simulation parameters and simulation program) used to support the findings of this study are available from the corresponding author upon request.
Conflicts of Interest
The authors declare no conflict of interest.
References
- Huang, Y.; Xu, X.; Li, N.; Ding, H.; Tang, X. Prospect of 5G intelligent networks. IEEE Wirel. Commun. 2020, 27, 4–5. [Google Scholar] [CrossRef]
- Yaqoob, M.; Gemikonakli, O.; Ever, E. Modelling heterogeneous future wireless cellular networks: An analytical study for interaction of 5G femtocells and macro-cells. Future Gener. Comput. Syst. 2021, 114, 82–95. [Google Scholar] [CrossRef]
- Shahzadi, R.; Ali, M.; Khan, H.Z.; Naeem, M. UAV assisted 5G and beyond wireless networks: A survey. J. Netw. Comput. Appl. 2021, 189, 103114. [Google Scholar] [CrossRef]
- Chen, L.B.; Jiang, Z.H.; Yang, D.Q. Fog radio access network optimization for 5G leveraging user mobility and traffic data. J. Netw. Comput. Appl. 2021, 191, 103083. [Google Scholar] [CrossRef]
- Leyva, I.; Cervello, C. Efficient solutions to the placement and chaining problem of User Plane Functions in 5G networks. J. Netw. Comput. Appl. 2022, 197, 103269. [Google Scholar] [CrossRef]
- Qu, K.; Zhuang, W.; Ye, Q.; Shen, X.; Li, X.; Rao, J. Traffic engineering for service-oriented 5G networks with SDN-NFV integration. IEEE Netw. 2020, 34, 234–241. [Google Scholar] [CrossRef]
- Tipantuna, C.; Hesselbach, X. Adaptive energy management in 5G network slicing: Requirements, architecture, and strategies. Energies 2020, 13, 3984. [Google Scholar] [CrossRef]
- Lin, K.; Li, C.; Rodrigues, J.J.P.C.; Pace, P.; Fortino, G. Data-driven joint resource allocation in large-scale heterogeneous wireless networks. IEEE Netw. 2020, 34, 163–169. [Google Scholar] [CrossRef]
- Kawahara, R.; Lua, E.K.; Uchida, M.; Kamei, S.; Yoshino, H. On the quality of triangle inequality violation aware routing overlay architecture. In Proceedings of the IEEE INFOCOM 2009, Rio De Janeiro, Brazil, 19–25 April 2009. [Google Scholar]
- Chergui, H.; Verikoukis, C. Big data for 5G intelligent network slicing management. IEEE Netw. 2020, 34, 56–61. [Google Scholar] [CrossRef]
- Fossati, F.; Moretti, S.; Perny, P.; Secci, S. Multi-resource allocation for network slicing. IEEE/ACM Trans. Netw. 2020, 28, 1311–1324. [Google Scholar] [CrossRef]
- Chang, Z.; Zhang, D.; Hamalaine, T.; Han, Z.; Ristaniemi, T. Incentive mechanism for resource allocation in wireless virtualized networks with multiple infrastructure providers. IEEE Trans. Mob. Comput. 2020, 19, 103–115. [Google Scholar] [CrossRef] [Green Version]
- Addad, R.A.; Bagaa, M.; Taleb, T.; Dutra, D.L.C.; Flinck, H. Optimization model for cross-domain network slices in 5G networks. IEEE Trans. Mob. Comput. 2020, 19, 1156–1169. [Google Scholar] [CrossRef] [Green Version]
- Chiha, A.; Van der Wee, M.; Colle, D.; Verbrugge, S. Network slicing cost allocation model. J. Netw. Syst. Manag. 2020, 28, 627–659. [Google Scholar] [CrossRef]
- Borylo, P.; Tornatore, M.; Jaglarz, P.; Shahriar, N.; Chołda, P.; Boutaba, R. Latency and energy-aware provisioning of network slices in cloud networks. Comput. Commun. 2020, 157, 1–19. [Google Scholar] [CrossRef]
- Chuah, T.C.; Lee, Y.L. Intelligent RAN slicing for broadband access in the 5G and big data era. IEEE Commun. Mag. 2020, 58, 69–75. [Google Scholar] [CrossRef]
- Shahriar, N.; Taeb, S.; Chowdhury, S.R.; Zulfiqar, M.; Tornatore, M.; Boutaba, R.; Mitra, J.; Hemmati, M. Reliable slicing of 5G transport networks with bandwidth squeezing and multi-path provisioning. IEEE Trans. Netw. Service Manag. 2020, 17, 1418–1431. [Google Scholar] [CrossRef]
- Carpio, F.; Bziuk, W.; Jukan, A. Scaling migrations and replications of Virtual Network Functions based on network traffic. Compt. Netw. 2022, 203, 108582. [Google Scholar] [CrossRef]
- Pozza, M.; Nicholson, P.K.; Lugones, D.F.; Rao, A.; Flinck, H.; Tarkoma, S. On reconfiguring 5G network slices. IEEE J. Sel. Areas Commun. 2020, 38, 1542–1554. [Google Scholar] [CrossRef]
- Zhong, H.; Xu, J.; Cui, J.; Sun, X.; Gu, C.; Liu, L. Prediction-based dual-weight switch migration scheme for SDN load balancing. Compt. Netw. 2022, 205, 108749. [Google Scholar] [CrossRef]
- Dow, E.M.; Matthews, J.N. WAYFINDER: Parallel virtual machine reallocation through A* search. Memet. Comput. 2016, 8, 255–267. [Google Scholar] [CrossRef]
- Han, F.; Wang, M.; Cui, Y.; Li, Q.; Liang, R.; Liu, Y.; Jiang, Y. Future Data Center Networking: From Low Latency to Deterministic Latency. IEEE Netw. 2022, 36, 52–58. [Google Scholar] [CrossRef]
- Shaer, I.; Sidebottom, G.; Haque, A.; Shami, A. Efficient execution plan for egress traffic engineering. Comput. Netw. 2021, 190, 107938. [Google Scholar] [CrossRef]
- Wang, Z.; Hu, J.; Min, G.; Zhao, Z.; Wang, J. Data-augmentation-based cellular traffic prediction in edge-computing-enabled smart city. IEEE Trans. Industr. Inform. 2021, 17, 4179–4187. [Google Scholar] [CrossRef]
- Lin, K.; Xu, X.; Gao, H. TSCRNN: A novel classification scheme of encrypted traffic based on flow spatiotemporal features for efficient management of IIoT. Comput. Netw. 2021, 190, 107974. [Google Scholar] [CrossRef]
- Wang, H.; Wang, L.; Zhao, S.; Yue, X. Multi-dimensional prediction model for cell traffic in city scale. Intern. J. Pattern Recognit. Artif. Intell. 2021, 35, 2150010. [Google Scholar] [CrossRef]
- Liu, R.W.; Nie, J.; Garg, S.; Xiong, Z.; Zhang, Y.; Hossain, M.S. Data-driven trajectory quality improvement for promoting intelligent vessel traffic services in 6G-enabled maritime IoT systems. IEEE Internet Things J. 2021, 8, 5374–5385. [Google Scholar] [CrossRef]
- Lee, C. Self-detecting traffic interference control for multi-zone services under 5G-based cellular networks. Sensors 2021, 21, 2409. [Google Scholar] [CrossRef]
- Mesodiakaki, A.; Maniotis, P.; Gatzianas, M.; Vagionas, C.; Pleros, N.; Kalfas, G. A gated service MAC protocol for sub-ms latency 5G fiber-wireless mmwave C-RANs. IEEE Trans. Wirel. Commun. 2021, 20, 2502–2515. [Google Scholar] [CrossRef]
- Golkarifard, M.; Chiasserini, C.F.; Malandrino, F.; Movaghar, A. Dynamic VNF placement, resource allocation and traffic routing in 5G. Comput. Netw. 2021, 188, 107830. [Google Scholar] [CrossRef]
- Agarwal, S.; Malandrino, F.; Chiasserini, C.F.; De, S. VNF placement and resource allocation for the support of vertical services in 5G networks. IEEE/ACM Trans. Netw. 2019, 27, 433–446. [Google Scholar] [CrossRef] [Green Version]
- Naseer, S.; Ali, R.; Dominic, P.; Saleem, Y. Learning Representations of Network Traffic Using Deep Neural Networks for Network Anomaly Detection: A Perspective towards Oil and Gas IT Infrastructures. Symmetry 2020, 12, 1882. [Google Scholar] [CrossRef]
- Bagga, M.; Dutra, D.L.C.; Taleb, T.; Samdanis, K. On SDN-Driven Network Optimization and QoS Aware Routing Using Multiple Paths. IEEE/ACM Trans. Wirel. Commun. 2020, 19, 4700–4714. [Google Scholar] [CrossRef]
- Zhao, H.; Zhang, C. An online-learning-based evolutionary many-objective algorithm. Inform. Sci. 2020, 509, 1–21. [Google Scholar] [CrossRef]
- Pasha, J.; Dulebenets, M.; Fathollahi-Fard, A.M.; Tian, G.; Lau, Y.; Singh, P.; Liang, B. An integrated optimization method for tactical-level planning in liner shipping with heterogeneous ship fleet and environmental considerations. Ade. Eng. Inform. 2021, 48, 101299. [Google Scholar] [CrossRef]
- Dulebenets, M. An Adaptive Polyploid Memetic Algorithm for scheduling trucks at a cross-docking terminal. Inform. Sci. 2021, 565, 390–421. [Google Scholar] [CrossRef]
- Liu, Z.; Wang, Y.; Huang, P. A many-objective evolutionary algorithm with angle-based selection and shift-based density estimation. Inform. Sci. 2020, 509, 400–419. [Google Scholar] [CrossRef] [Green Version]
- Dulebenets, M.; Pasha, J.; Kavoosi, M.; Abioye, O.; Ozguven, E.; Moses, R.; Boot, W.; Sando, T. Multiobjective Optimization Model for Emergency Evacuation Planning in Geographical Locations with Vulnerable Population Groups. J. Manag. Eng. 2020, 509, 04019043. [Google Scholar] [CrossRef]
Publisher’s Note: MDPI stays neutral with regard to jurisdictional claims in published maps and institutional affiliations. |
© 2022 by the authors. Licensee MDPI, Basel, Switzerland. This article is an open access article distributed under the terms and conditions of the Creative Commons Attribution (CC BY) license (https://creativecommons.org/licenses/by/4.0/).