
New Optimized Deep Learning Application for COVID-19 Detection in Chest X-ray Images


 ,
, 
Abstract
:1. Introduction
2. Materials and Methods
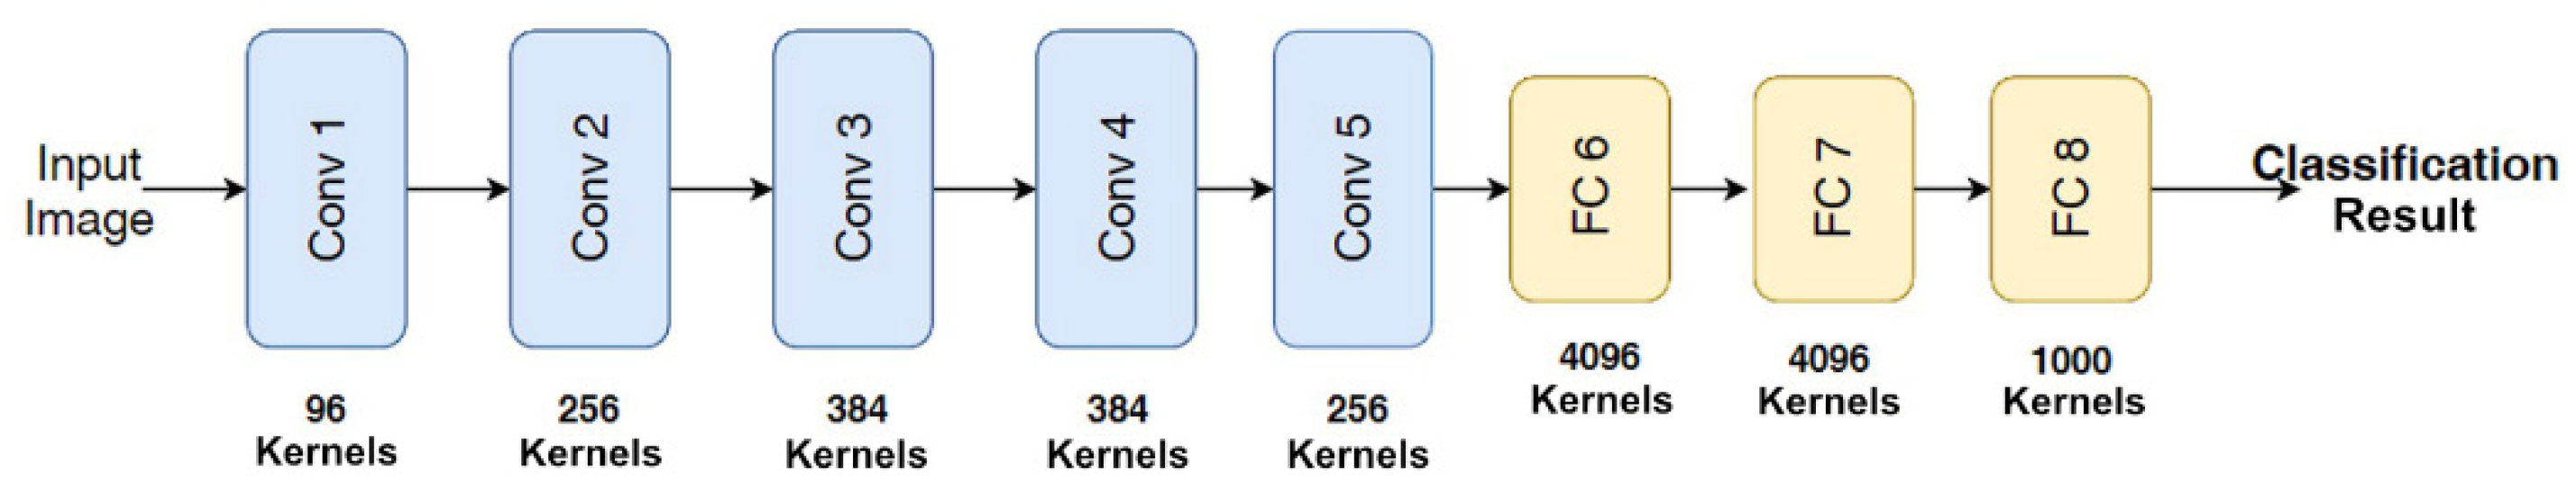
2.1. Convolutional Neural Network (CNN)
2.1.1. Convolutional Layers
2.1.2. Pooling Layer
2.1.3. Fully Connected (FC) Layer
2.2. Classifiers
2.2.1. Softmax Classifier
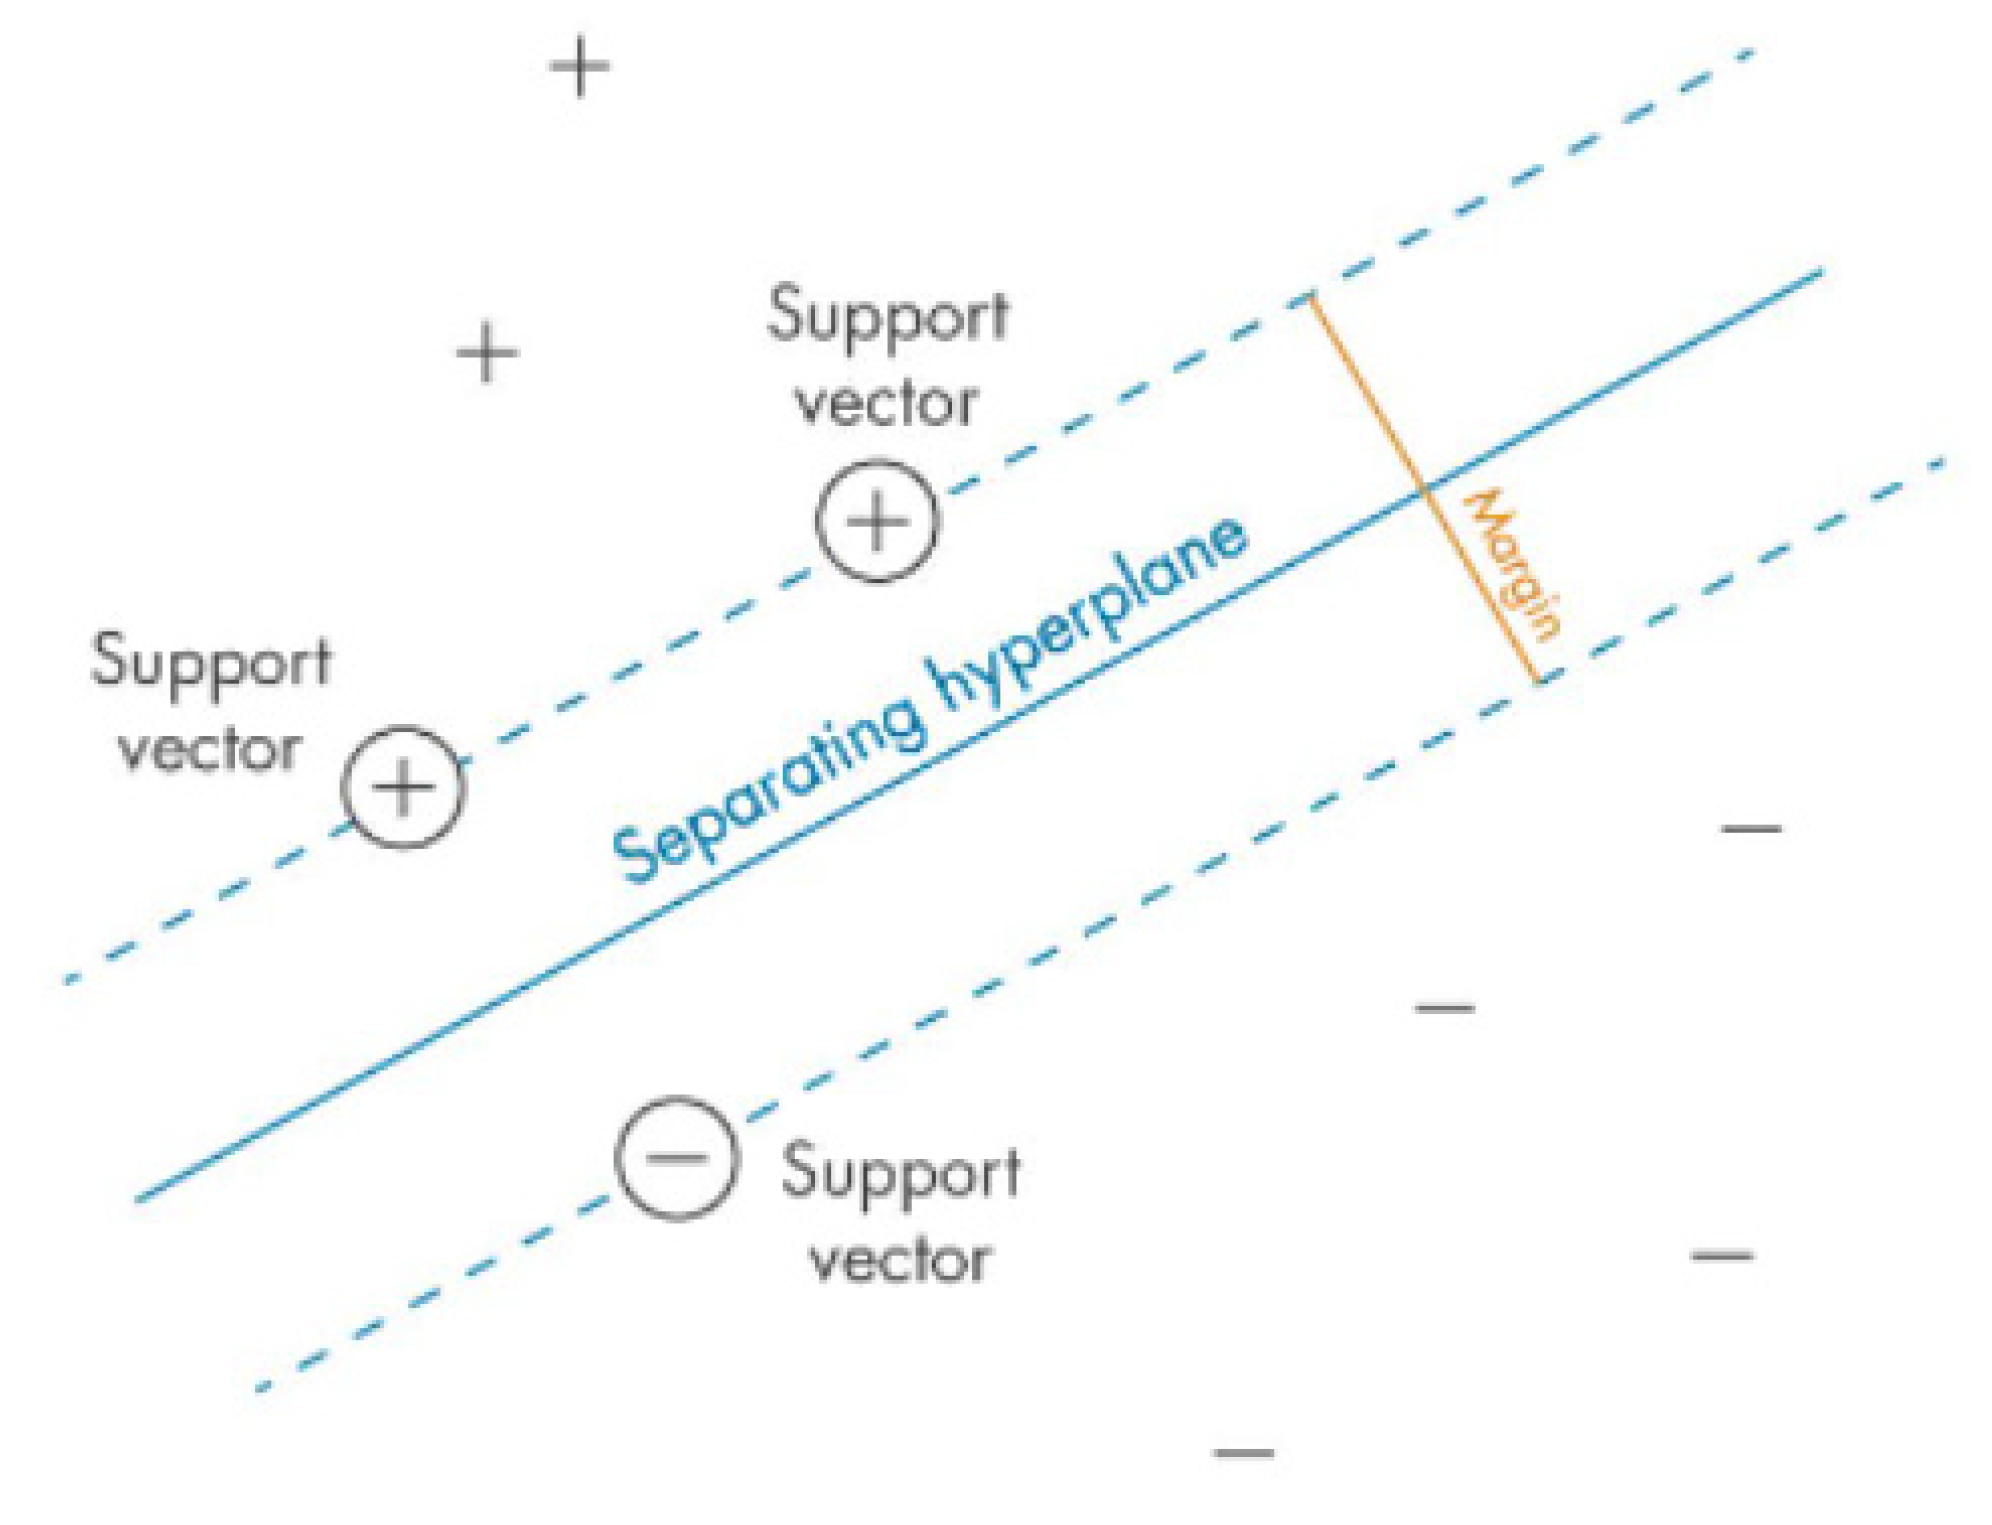
2.2.2. Support Vector Machines (SVM)
2.2.3. K-Nearest Neighbors (KNN)
2.2.4. Naïve Bayes (NB)
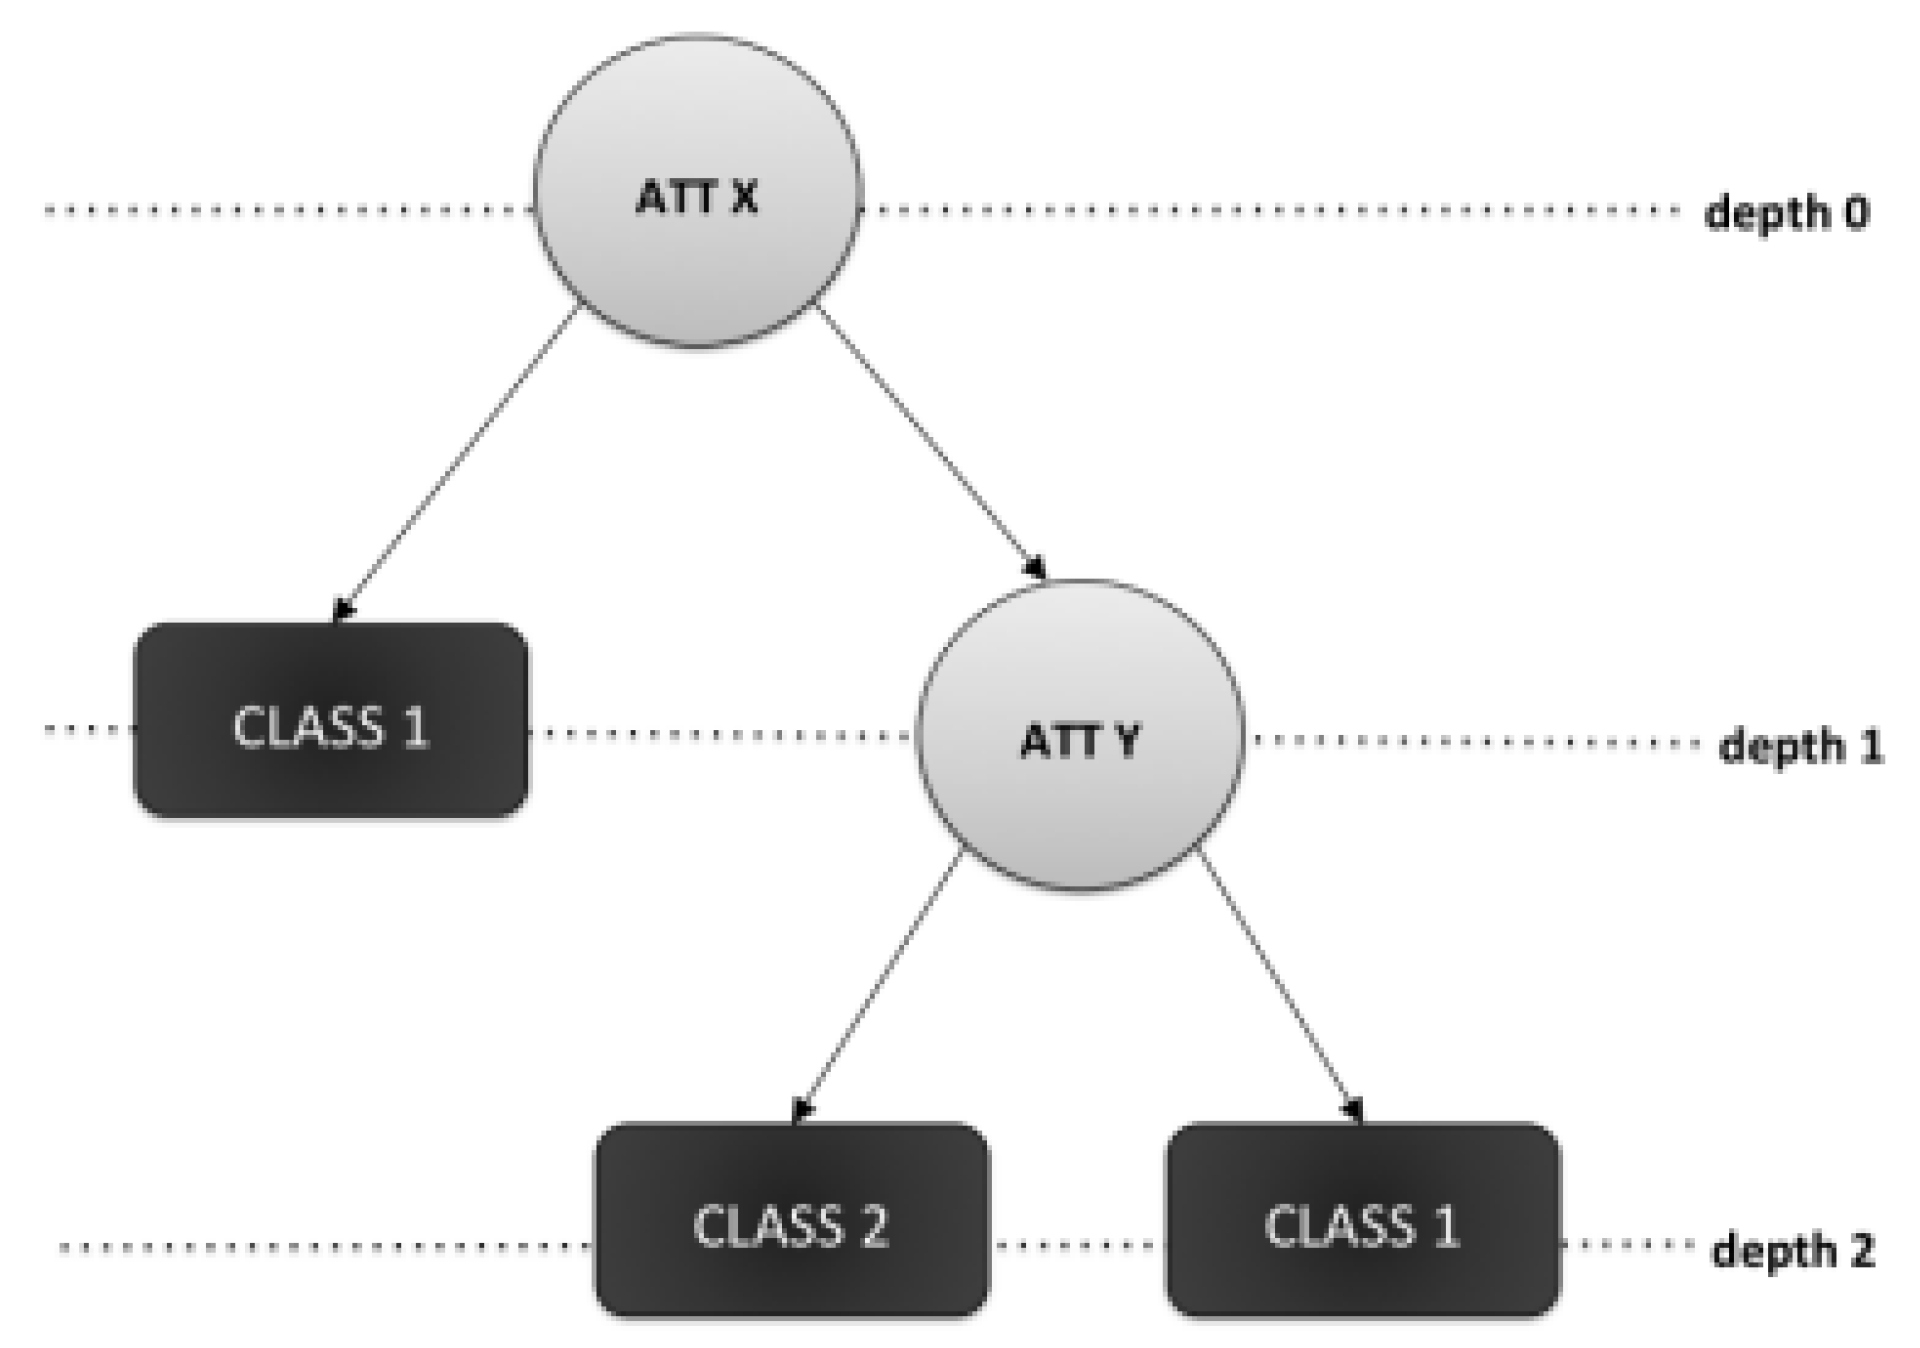
2.2.5. Decision Trees (DT)
2.3. Ant Lion Optimization (ALO) Algorithm
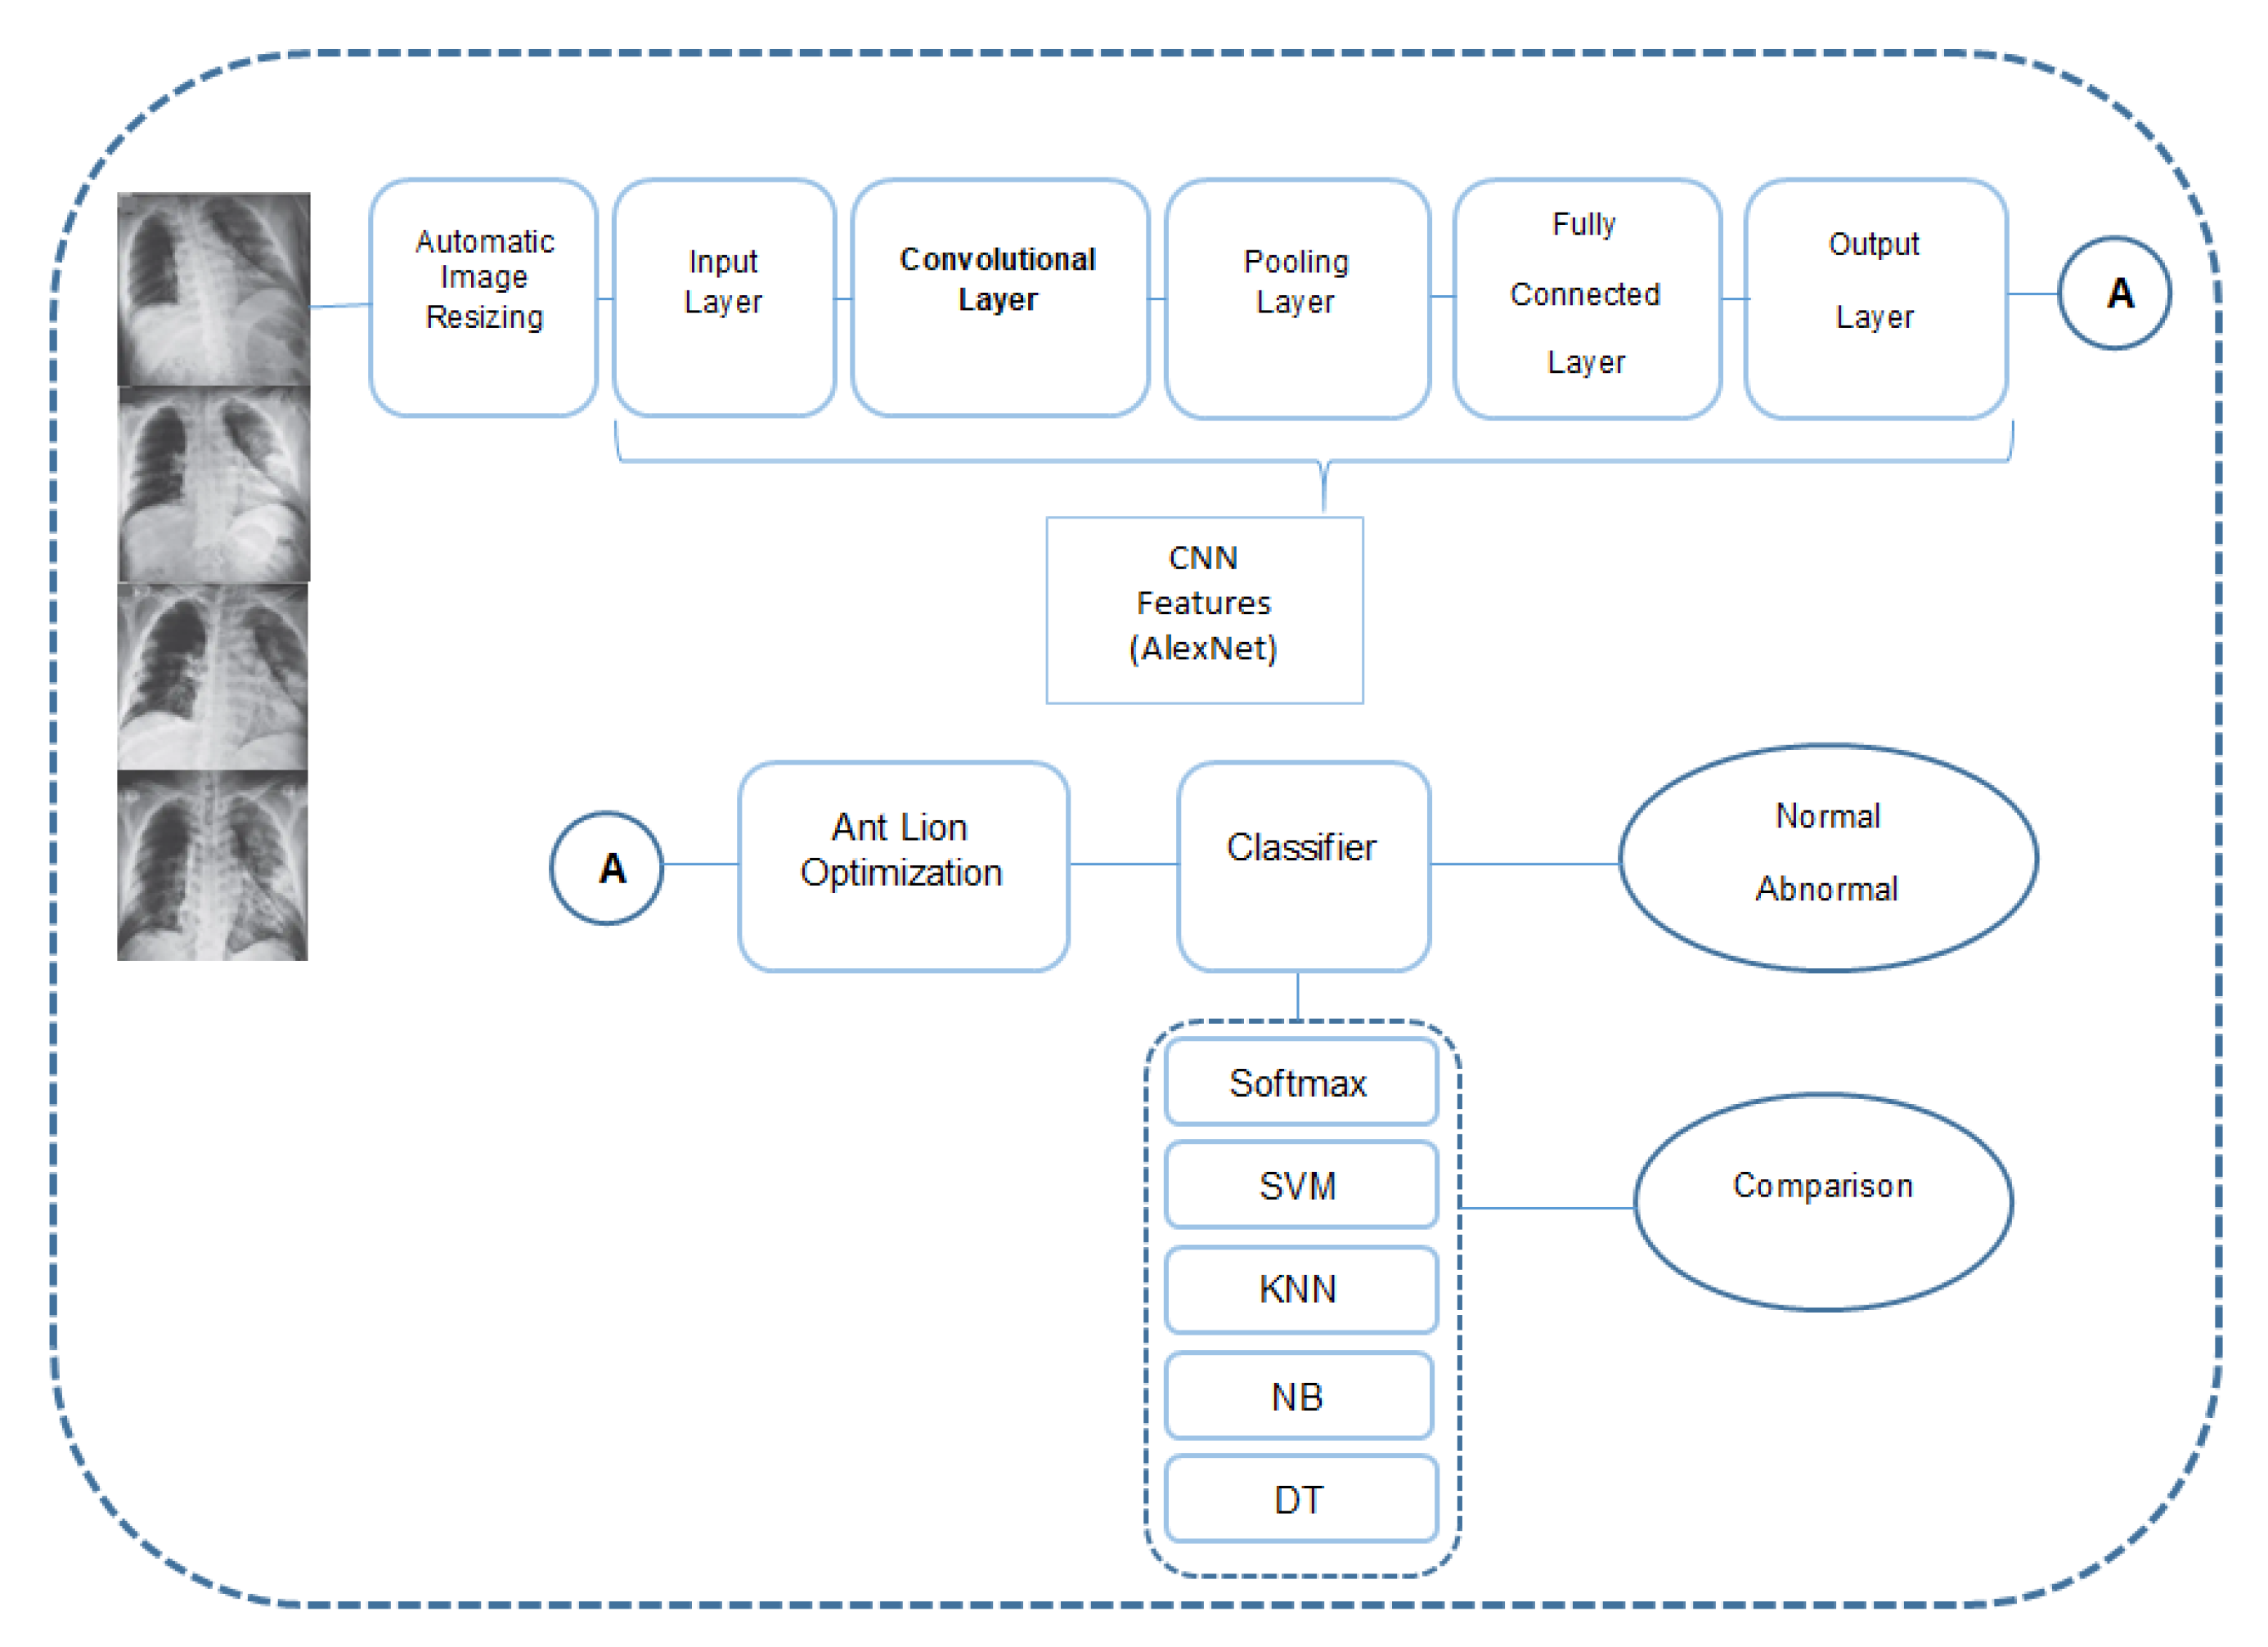
2.4. Proposed Method
2.4.1. Data Resizing and Feature Extraction
2.4.2. Feature Selection
- Decrease Overfitting: Less redundant features mean less chance to encounter decisions based on noise.
- Enhance Accuracy: Less misleading features mean an increase in model accuracy.
- Decrease Training Time: Less features means that the classifiers train faster.
2.4.3. Classifiers
3. Results
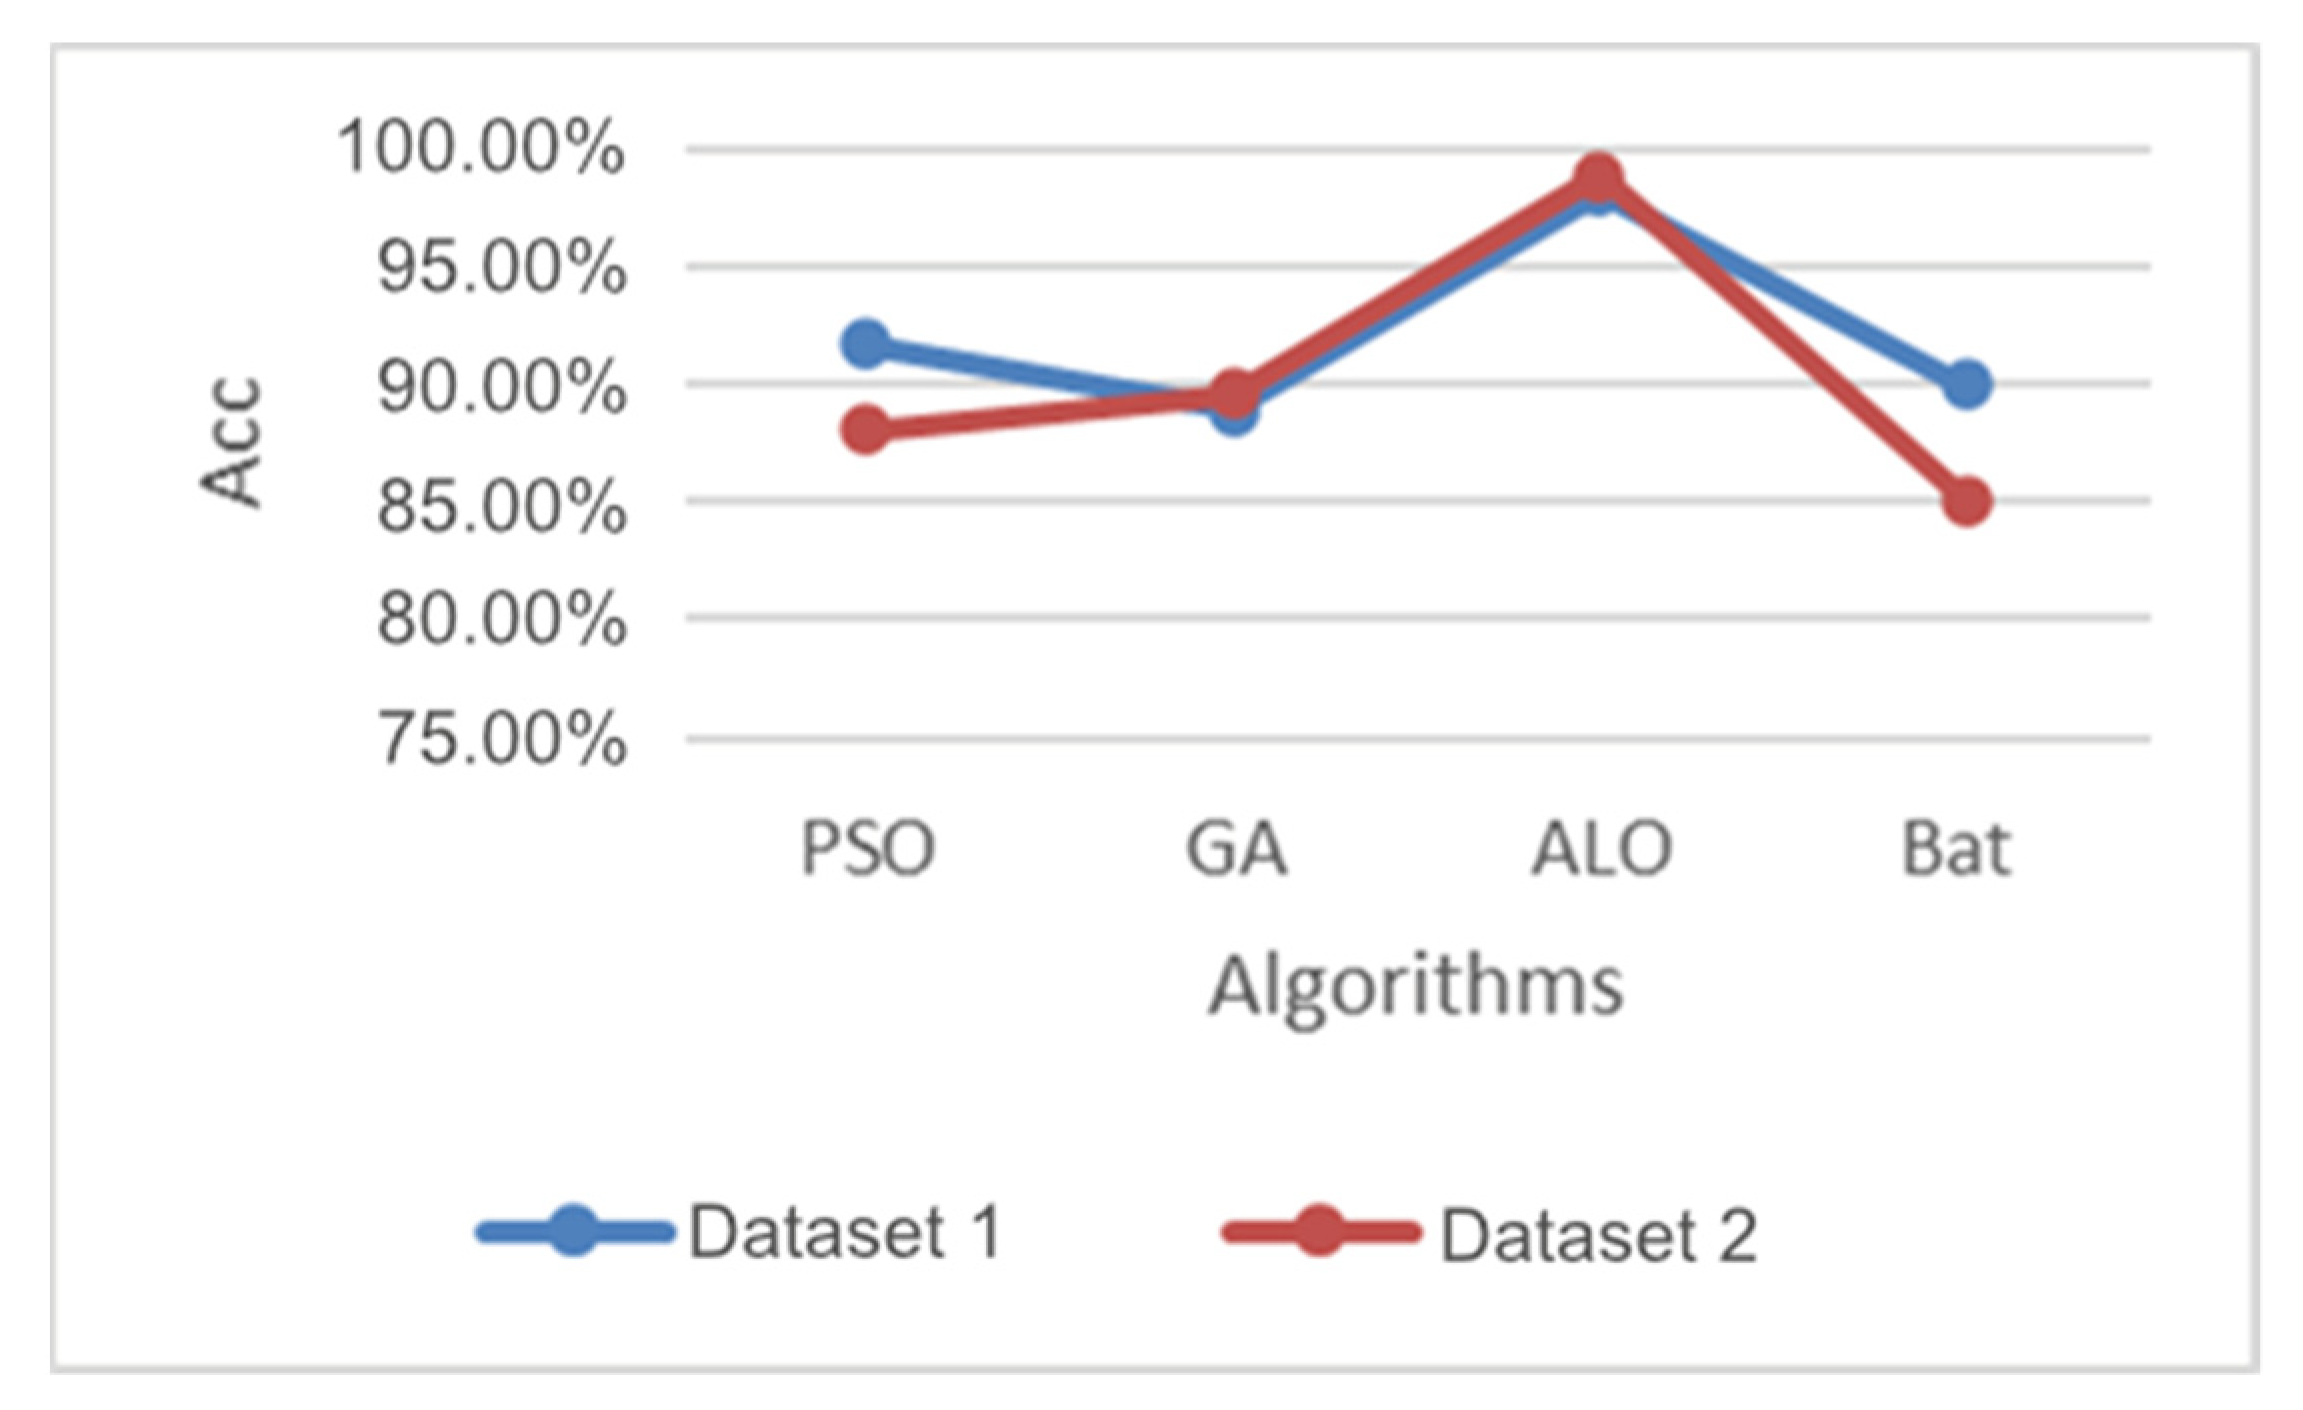
4. Discussion
- Random choice of antlions and the usage of a roulette wheel ensure exploration of the search space.
- Random walks of ants around the antlions additionally accentuate exploration of the search range around the antlions.
- The local optima are resolved by using roulette wheel support and random walk.
- ALO approximates the global optima by avoiding the local optima in the population of search agents.
- ALO algorithm is flexible and appropriate for solving various problems, as it has small number of adaptive parameters to fine-tune.
- PSO is easy to fall into local optimum in high-dimensional space and has a low convergence rate in the iterative process. This causes problems for feature selection, especially from complex data such as COVID-19 X-ray images.
- GA is computationally expensive. Consequently, GA implementation requires high amount of optimization. Moreover, designing an objective function and acquiring the representation and operators right can be difficult.
5. Conclusions
Author Contributions
Funding
Institutional Review Board Statement
Informed Consent Statement
Data Availability Statement
Conflicts of Interest
References
- World Health Organization (WHO). Available online: https://www.who.int/emergencies/diseases/novel-coronavirus-2019 (accessed on 24 February 2020).
- Chen, N.; Zhou, M.; Dong, X.; Qu, J.; Gong, F.; Han, Y.; Qiu, Y.; Wang, J.; Liu, Y.; Wei, Y.; et al. Epidemiological and Clinical Characteristics of 99 cases of 2019 Novel Coronavirus Pneumonia in Wuhan, China: A Descriptive Study. Lancet 2020, 395, 507–513. [Google Scholar] [CrossRef] [Green Version]
- Yin, Y.; Wunderink, R.G. MERS, SARS and Other Coronaviruses as Causes of Pneumonia. Respirology 2018, 23, 130–137. [Google Scholar] [CrossRef] [PubMed] [Green Version]
- Wang, D.; Hu, B.; Hu, C.; Zhu, F.; Liu, X.; Zhang, J.; Wang, B.; Xiang, H.; Cheng, Z.; Xiong, Y.; et al. Clinical Characteristics of 138 Hospitalized Patients with 2019 Novel Coronavirus-Infected Pneumonia in Wuhan, China. JAMA 2020, 323, 1061–1069. [Google Scholar] [CrossRef] [PubMed]
- Li, Q.; Guan, X.; Wu, P.; Wang, X.; Zhou, L.; Tong, Y.; Ren, R.; Leung, K.S.; Lau, E.H.; Wong, J.Y.; et al. Early Transmission Dynamics in Wuhan, China, of Novel Coronavirus-Infected Pneumonia. N. Engl. J. Med. 2020, 382, 1199–1207. [Google Scholar] [CrossRef] [PubMed]
- Huang, C.; Wang, Y.; Li, X.; Ren, L.; Zhao, J.; Hu, Y.; Zhang, L.; Fan, G.; Xu, J.; Gu, X.; et al. Clinical Features of Patients Infected with 2019 Novel Coronavirus in Wuhan, China. Lancet 2020, 395, 497–506. [Google Scholar] [CrossRef] [Green Version]
- General Office of National Health Committee. Notice on Printing and Distributing the Novel Coronavirus Pneumonia Diagnosis and Treatment Plan (Trial Version 6). 18 February 2020. Available online: http://www.nhc.gov.cn/yzygj/s7653p/202002/8334a8326dd94d329df351d7da8aefc2.shtml?from=timeline (accessed on 24 February 2020).
- Chung, M.; Bernheim, A.; Mei, X.; Zhang, N.; Huang, M.; Zeng, X.; Cui, J.; Xu, W.; Yang, Y.; Fayad, Z.A.; et al. CT Imaging Features of 2019 Novel Coronavirus (2019-nCoV). Radiology 2020, 295, 202–207. [Google Scholar] [CrossRef] [Green Version]
- Huang, P.; Liu, T.; Huang, L.; Liu, H.; Lei, M.; Xu, W.; Hu, X.; Chen, J.; Liu, B. Use of Chest CT in Combination with Negative RT-PCR Assay for the 2019 Novel Coronavirus but High Clinical Suspicion. Radiology 2020, 295, 22–23. [Google Scholar] [CrossRef]
- Li, D.; Wang, D.; Dong, J.; Wang, N.; Huang, H.; Xu, H.; Xia, C. False-Negative Results of Real-Time Reverse-Transcriptase Polymerase Chain Reaction for Severe Acute Respiratory Syndrome Coronavirus 2: Role of Deep-Learning-Based CT Diagnosis and Insights from Two Cases. Korean J. Radiol. 2020, 21, 505–508. [Google Scholar] [CrossRef]
- National Health Commission of the People’s Republic of China. Diagnosis and Treatment Protocols of Pneumonia Caused by a Novel Coronavirus (Trial Version 5); National Health Commission of the People’s Republic of China: Beijing, China, 2020.
- Koo, H.J.; Lim, S.; Choe, J.; Choi, S.H.; Sung, H.; Do, K.H. Radiographic and CT Features of Viral Pneumonia. Radiographics 2018, 38, 719–739. [Google Scholar] [CrossRef] [Green Version]
- Ucar, F.; Korkmaz, D. COVIDiagnosis-Net: Deep Bayes-SqueezeNet based Diagnosis of the Coronavirus Disease 2019 (COVID-19) from X-ray Images. Med. Hypotheses 2020, 140, 109761. [Google Scholar] [CrossRef]
- Li, L.; Qin, L.; Xu, Z.; Yin, Y.; Wang, X.; Kong, B.; Bai, J.; Lu, Y.; Fang, Z.; Song, Q.; et al. Using Artificial Intelligence to Detect COVID-19 and Community-acquired Pneumonia Based on Pulmonary CT: Evaluation of the Diagnostic Accuracy. Radiology 2020, 296, E65–E71. [Google Scholar] [CrossRef] [PubMed]
- Shin, H.C.; Roth, H.R.; Gao, M.; Lu, L.; Xu, Z.; Nogues, I.; Yao, J.; Mollura, D.; Summers, R.M. Deep Convolutional Neural Networks for Computer-Aided Detection: Cnn Architectures, Dataset Characteristics and Transfer Learning. IEEE Trans. Med. Imaging 2016, 35, 1285–1298. [Google Scholar] [CrossRef] [PubMed] [Green Version]
- Rajpurkar, P.; Irvin, J.; Ball, R.L.; Zhu, K.; Yang, B.; Mehta, H.; Duan, T.; Ding, D.; Bagul, A.; Langlotz, C.P.; et al. Deep Learning for Chest Radiograph Diagnosis: A Retrospective Comparison of the CheXNeXt Algorithm to Practicing Radiologists. PLoS Med. 2018, 15, e1002686. [Google Scholar] [CrossRef] [PubMed]
- Rawat, W.; Wang, Z. Deep Convolutional Neural Networks for Image Classification: A Comprehensive Review. Neural Comput. 2017, 29, 2352–2449. [Google Scholar] [CrossRef]
- Rajpurkar, P.; Irvin, J.; Zhu, K.; Yang, B.; Mehta, H.; Duan, T.; Ding, D.; Bagul, A.; Langlotz, C.; Shpanskaya, K.; et al. CheXNet: Radiologist-Level Pneumonia Detection on Chest X-Rays with Deep Learning. arXiv 2017, arXiv:1711.05225. [Google Scholar]
- Kermany, D.S.; Goldbaum, M.; Cai, W.; Valentim, C.C.; Liang, H.; Baxter, S.L.; McKeown, A.; Yang, G.; Wu, X.; Yan, F.; et al. Identifying Medical Diagnoses and Treatable Diseases by Image-Based Deep Learning. Cell 2018, 172, 1122–1131. [Google Scholar] [CrossRef]
- Rousan, L.A.; Elobeid, E.; Karrar, M.; Khader, Y. Chest X-ray findings and temporal lung changes in patients with COVID-19 pneumonia. BMC Pulm. Med. 2020, 20, 245. [Google Scholar] [CrossRef]
- Cozzi, D.; Albanesi, M.; Cavigli, E.; Moroni, C.; Bindi, A.; Luvarà, S.; Lucarini, S.; Busoni, S.; Mazzoni, L.N.; Miele, V. Chest X-ray in new Coronavirus Disease 2019 (COVID-19) infection: Findings and correlation with clinical outcome. Radiol. Med. 2020, 125, 730–737. [Google Scholar] [CrossRef]
- Chen, H.; Zheng, Y.; Park, J.H.; Heng, P.A.; Zhou, S.K. Medical Image Computing and Computer-Assisted Intervention; MICCAI: Athens, Greece, 2016; pp. 487–495. [Google Scholar]
- Makris, A.; Kontopoulos, I.; Tserpes, K. COVID-19 detection from chest X-Ray images using Deep Learning and Convolutional Neural Networks. medRxiv 2020. [Google Scholar] [CrossRef]
- Zebin, T.; Rezvy, S. COVID-19 detection and disease progression visualization: Deep learning on chest X-rays for classification and coarse localization. Appl. Intell. 2021, 51, 1010–1021. [Google Scholar] [CrossRef]
- Elaziz, M.A.; Hosny, K.M.; Salah, A.; Darwish, M.M.; Lu, S.; Sahlol, A.T. New machine learning method for image-based diagnosis of COVID-19. PLoS ONE 2020, 15, e0235187. [Google Scholar] [CrossRef] [PubMed]
- Azemin, M.Z.C.; Hassan, R.; Tamrin, M.I.M.; Ali, M.A.M. COVID-19 Deep Learning Prediction Model Using Publicly Available Radiologist-Adjudicated Chest X-Ray Images as Training Data: Preliminary Findings. Int. J. Biomed. Imaging 2020, 2020, 8828855. [Google Scholar] [CrossRef] [PubMed]
- Rajaraman, S.; Siegelman, J.; Alderson, P.O.; Folio, L.S.; Folio, L.R.; Antani, S.K. Iteratively Pruned Deep Learning Ensembles for COVID-19 Detection in Chest X-Rays. IEEE Access Pract. Innov. Open Solut. 2020, 8, 115041–115050. [Google Scholar] [CrossRef] [PubMed]
- Sahlol, A.T.; Yousri, D.; Ewees, A.A.; Al-Qaness, M.A.A.; Damasevicius, R.; Elaziz, M.A. COVID-19 image classification using deep features and fractional-order marine predators algorithm. Sci. Rep. 2020, 10, 15364. [Google Scholar] [CrossRef]
- Li, M.D.; Arun, N.T.; Gidwani, M.; Chang, K.; Deng, F.; Little, B.P.; Mendoza, D.P.; Lang, M.; Lee, S.I.; O’Shea, A.; et al. Automated Assessment and Tracking of COVID-19 Pulmonary Disease Severity on Chest Radiographs using Convolutional Siamese Neural Networks. Radiol. Artif. Intell. 2020, 2, e200079. [Google Scholar] [CrossRef]
- Sitaula, C.; Hossain, M.B. Attention-based VGG-16 model for COVID-19 chest X-ray image classification. Appl. Intell. 2021, 51, 2850–2863. [Google Scholar] [CrossRef]
- Sitaula, C.; Aryal, S. New bag of deep visual words based features to classify chest x-ray images for COVID-19 diagnosis. Health Inf. Sci. Syst. 2021, 9, 24. [Google Scholar] [CrossRef]
- Sitaula, C.; Shahi, T.B.; Aryal, S.; Marzbanrad, F. Fusion of multi-scale bag of deep visual words features of chest X-ray images to detect COVID-19 infection. Sci. Rep. 2021, 11, 23914. [Google Scholar] [CrossRef]
- Shorfuzzaman, M.; Masud, M.; Alhumyani, H.; Anand, D.; Singh, A. Artificial Neural Network-Based Deep Learning Model for COVID-19 Patient Detection Using X-Ray Chest Images. J. Healthc. Eng. 2021, 2021, 5513679. [Google Scholar] [CrossRef]
- Hasan, M.; Ahmed, S.; Abdullah, Z.; Monirujjaman Khan, M.; Anand, D.; Singh, A.; AlZain, M.; Masud, M. Deep Learning Approaches for Detecting Pneumonia in COVID-19 Patients by Analyzing Chest X-Ray Images. Math. Probl. Eng. 2021, 2021, 9929274. [Google Scholar] [CrossRef]
- Shorfuzzaman, M.; Hossain, M. MetaCOVID: A Siamese neural network framework with contrastive loss for n-shot diagnosis of COVID-19 patients. Pattern Recognit. 2021, 113, 107700. [Google Scholar] [CrossRef] [PubMed]
- Tahsin Meem, A.; Monirujjaman Khan, M.; Masud, M.; Aljahdali, S. Prediction of Covid-19 Based on Chest X-Ray Images Using Deep Learning with CNN. Comput. Syst. Sci. Eng. 2022, 41, 1223–1240. [Google Scholar] [CrossRef]
- Karim, A.M.; Mishra, A. Novel COVID-19 Recognition Framework Based on Conic Functions Classifier. In Healthcare Informatics for Fighting COVID-19 and Future Epidemics; Garg, L., Chakraborty, C., Mahmoudi, S., Sohmen, V.S., Eds.; EAI/Springer Innovations in Communication and Computing; Springer: Cham, Switzerland, 2022. [Google Scholar]
- Md Noor, S.S.; Ren, J.; Marshall, S.; Michael, K. Hyperspectral Image Enhancement and Mixture Deep Learning Classification of Corneal Epithelium Injuries. Sensors 2017, 17, 2644. [Google Scholar] [CrossRef] [PubMed] [Green Version]
- Mary, L.; Sreenath, N. Live Detection of Text in the Natural Environment Using Convolutional Neural Network. Future Gener. Comput. Syst. 2019, 98, 444–455. [Google Scholar] [CrossRef]
- Barros, R.; Basgalupp, M.; de Carvalho, A.; Freitas, A. Automatic Design of Decision-Tree Algorithms with Evolutionary Algorithms. Evol. Comput. 2013, 21, 659–684. [Google Scholar] [CrossRef] [Green Version]
- Mirjalili, S. The Ant Lion Optimizer. Adv. Eng. Softw. 2015, 83, 80–98. [Google Scholar] [CrossRef]
- Wang, M.; Wu, C.; Wang, L.; Xiang, D.; Huang, X. A Feature Selection Approach for Hyperspectral Image Based on Modified Ant Lion Optimizer. Knowl.-Based Syst. 2019, 168, 39–48. [Google Scholar] [CrossRef]
- Kumar, S.; Kumar, A. A brief review on antlion optimization algorithm. In Proceedings of the 2018 International Conference on Advances in Computing, Communication Control and Networking (ICACCCN), Greater Noida, India, 12–13 October 2018; pp. 236–240. [Google Scholar]
- Assiri, A.S.; Hussien, A.G.; Amin, M. Ant Lion Optimization: Variants, Hybrids, and Applications. IEEE Access 2020, 8, 77746–77764. [Google Scholar] [CrossRef]
- Krizhevsky, A.; Sutskever, I.; Hinton, G. ImageNet Classification with Deep Convolutional Neural Networks. Neural Inf. Processing Syst. 2012, 25, 84–90. [Google Scholar] [CrossRef]
- Zeiler, M.D.; Fergus, R. Visualizing and Understanding Convolutional Networks. In Computer Vision–ECCV 2014; Springer: Zurich, Switzerland; Cham, Switzerland, 2014; Volume 8689, pp. 818–833. [Google Scholar]
- Simonyan, K.; Zisserman, A. Very Deep Convolutional Networks for Large-Scale Image Recognition. arXiv 2014, arXiv:1409.1556. [Google Scholar]
- Szegedy, C.; Liu, W.; Jia, Y.; Sermanet, P.; Reed, S.; Anguelov, D.; Erhan, D.; Vanhoucke, V.; Rabinovich, A. Going Deeper with Convolutions. In Proceedings of the 2015 IEEE Conference on Computer Vision and Pattern Recognition (CVPR), Boston, MA, USA, 7–12 June 2015; pp. 1–9. [Google Scholar]
- He, K.; Zhang, X.; Ren, S.; Sun, J. Deep Residual Learning for Image Recognition. In Proceedings of the 2016 IEEE Conference on Computer Vision and Pattern Recognition (CVPR), Las Vegas, NV, USA, 27–30 June 2016; pp. 770–778. [Google Scholar]
- Russakovsky, O.; Deng, J.; Su, H.; Krause, J.; Satheesh, S.; Ma, S.; Huang, Z.; Karpathy, A.; Khosla, A.; Bernstein, M.; et al. ImageNet Large Scale Visual Recognition Challenge. Int. J. Comput. Vis. 2015, 115, 211–252. [Google Scholar] [CrossRef] [Green Version]
- Chen, J.; Wan, Z.; Zhang, J.; Li, W.; Chen, Y.; Li, Y.; Duan, Y. Medical image segmentation and reconstruction of prostate tumor based on 3D AlexNet. Comput. Methods Programs Biomed. 2021, 200, 105878. [Google Scholar] [CrossRef] [PubMed]
- Banga, A.; Bhatia, P.K. Optimized Component based Selection using LSTM Model by Integrating Hybrid MVO-PSO Soft Computing Technique. Adv. Sci. Technol. Eng. Syst. J. 2021, 6, 62–71. [Google Scholar] [CrossRef]
- Rahman, T.; Chowdhury, M.; Khandakar, A. COVID-19 Radiography Database. COVID-19 Chest X-ray Images and Lung Masks Database. 2022. Available online: https://www.kaggle.com/datasets/tawsifurrahman/covid19-radiography-database (accessed on 1 February 2022).
- Cohen, J.P.; Morrison, P.; Dao, L. COVID-19 Image Data Collection. arXiv 2020, arXiv:2003.11597. [Google Scholar]
- Li, Y.; Xia, L. Coronavirus Disease 2019 (COVID-19): Role of Chest CT in Diagnosis and Management. Am. J. Roentgenol. 2020, 214, 1280–1286. [Google Scholar] [CrossRef]
- Zhu, N.; Zhang, D.; Wang, W.; Li, X.; Yang, B.; Song, J.; Zhao, X.; Huang, B.; Shi, W.; Lu, R.; et al. A Novel Coronavirus from Patients with Pneumonia in China, 2019. N. Engl. Med. 2019, 382, 727–733. [Google Scholar] [CrossRef]
- McDonald, R.J.; Schwartz, K.M.; Eckel, L.J.; Diehn, F.E.; Hunt, C.H.; Bartholmai, B.J.; Erickson, B.J.; Kallmes, D.F. The Effects of Changes in Utilization and Technological Advancements of Cross-Sectional Imaging on Radiologist Workload. Acad. Radiol. 2015, 22, 1191–1198. [Google Scholar] [CrossRef]
- Fitzgerald, R. Error in Radiology. Clin. Radiol. 2001, 56, 938–946. [Google Scholar] [CrossRef]
- Paul, R.; Hawkins, S.H.; Balagurunathan, Y.; Schabath, M.B.; Gillies, R.J.; Hall, L.O.; Goldgof, D.B. Deep Feature Transfer Learning in Combination with Traditional Features Predicts Survival Among Patients with Lung Adenocarcinoma. Tomography 2016, 2, 388–395. [Google Scholar] [CrossRef]
- Cheng, J.-Z.; Ni, D.; Chou, Y.-H.; Qin, J.; Tiu, C.-M.; Chang, Y.-C.; Huang, C.-S.; Shen, D.; Chen, C.-M. Computer-Aided Diagnosis with Deep Learning Architecture: Applications to Breast Lesions in US Images and Pulmonary Nodules in CT Scans. Sci. Rep. 2016, 6, 24454. [Google Scholar] [CrossRef] [Green Version]
- Liang, B.; Zhai, Y.; Tong, C.; Zhao, J.; Li, J.; He, X.; Ma, Q. A Deep Automated Skeletal Bone Age Assessment Model via Region-Based Convolutional Neural Network. Future Gener. Comput. Syst. 2019, 98, 54–59. [Google Scholar] [CrossRef]
- Panwar, H.; Gupta, P.K.; Siddiqui, M.K.; Morales-Menendez, R.; Singh, V. Application of deep learning for fast detection of COVID-19 in X-Rays using nCOVnet. Chaos Solitons Fractals 2020, 138, 109944. [Google Scholar] [CrossRef] [PubMed]
- Wang, L.; Wong, A. COVID-Net: A Tailored Deep Convolutional Neural Network Design for Detection of COVID-19 Cases from Chest Radiography Images. arXiv 2020, arXiv:2200309871. [Google Scholar] [CrossRef] [PubMed]
- Li, X.; Zhu, D. COVID-Xpert: An AI Powered Population Screening of COVID-19 Cases Using Chest Radiography Images. arXiv 2020, arXiv:200403042. [Google Scholar]
- Afshar, P.; Heidarian, S.; Naderkhani, F.; Oikonomou, A.; Plataniotis, K.N.; Mohammadi, A. COVID-CAPS: A Capsule Network-based Framework for Identification of COVID-19 cases from X-ray Images. arXiv 2020, arXiv:200402696. [Google Scholar] [CrossRef]
- Farooq, M.; Hafeez, A. COVID-ResNet: A Deep Learning Framework for Screening of COVID19 from Radiographs. arXiv 2020, arXiv:200314395. [Google Scholar]
- Chowdhury, M.E.H.; Rahman, T.; Khandakar, A.; Mazhar, R.; Kadir, M.A.; Bin Mahbub, Z.; Islam, K.R.; Khan, M.S.; Iqbal, A.; Al Emadi, N.; et al. Can AI Help in Screening Viral and COVID-19 Pneumonia. IEEE Access 2020, 8, 132665–132676. [Google Scholar] [CrossRef]
- Ozturk, T.; Talo, M.; Yildirim, E.A.; Baloglu, U.B.; Yildirim, O.; Rajendra Acharya, U. Automated detection of COVID-19 cases using deep neural networks with X-ray images. Comput. Biol. Med. 2020, 121, 103792. [Google Scholar] [CrossRef]
- Khan, A.I.; Shah, J.L.; Bhat, M.M. Coronet: A deep neural network for detection and diagnosis of COVID-19 from chest x-ray images. Comput. Methods Programs Biomed 2020, 196, 105581. [Google Scholar] [CrossRef]
- Apostolopoulos, I.D.; Mpesiana, T.A. Covid-19: Automatic detection from X-ray images utilizing transfer learning with convolutional neural networks. Phys. Eng. Sci. Med. 2020, 43, 635–640. [Google Scholar] [CrossRef] [Green Version]
- Hussain, E.; Hasan, M.; Rahman, M.A.; Lee, I.; Tamanna, T.; Parvez, M.Z. Corodet: A deep learning based classification for covid-19 detection using chest x-ray images. Chaos Solitons Fractals 2021, 142, 110495. [Google Scholar] [CrossRef] [PubMed]
- Umer, M.; Ashraf, I.; Ullah, S.; Mehmood, A.; Choi, G.S. COVINet: A convolutional neural network approach for predicting COVID-19 from chest X-ray images. J. Ambient. Intell. Humaniz. Comput. 2022, 13, 535–547. [Google Scholar] [CrossRef] [PubMed]
- Mukherjee, H.; Ghosh, S.; Dhar, A.; Obaidullah, S.M.; Santosh, K.; Roy, K. Shallow convolutional neural network for covid-19 outbreak screening using chest X-rays. Cogn. Comput. 2021, 5, 1–14. [Google Scholar] [CrossRef] [PubMed]
- Mahmud, T.; Rahman, M.A.; Fattah, S.A. Covxnet: A multi-dilation convolutional neural network for automatic covid-19 and other pneumonia detection from chest x-ray images with transferable multi-receptive feature optimization. Comput. Biol. Med. 2020, 122, 103869. [Google Scholar] [CrossRef] [PubMed]


| Classes | Dataset from [53] | Dataset from [54] |
|---|---|---|
| COVID-19 | 3616 | 576 |
| Lung Opacity | 6012 | - |
| Normal | 10,200 | 1583 |
| Pneumonia | 1345 | 4273 |
| Classifiers | Accuracy | Precision | F1 Score | Sensitivity | Specificity |
|---|---|---|---|---|---|
| NB | 0.9636 | 0.9200 | 0.9583 | 0.9408 | 0.9310 |
| SVM | 0.9455 | 0.9200 | 0.9388 | 0.9377 | 0.9406 |
| Soft Max | 0.9091 | 0.9200 | 0.9020 | 0.9190 | 0.9019 |
| KNN | 0.8909 | 0.8800 | 0.8800 | 0.8703 | 0.8954 |
| DT | 0.8448 | 0.8148 | 0.8300 | 0.8033 | 0.8258 |
| Classifiers | Accuracy | Precision | F1 Score | Sensitivity | Specificity |
|---|---|---|---|---|---|
| NB | 0.9801 | 99.95 | 0.9804 | 0.9823 | 0.9856 |
| SVM | 0.9605 | 0.9550 | 0.9600 | 0.9605 | 0.9566 |
| Soft Max | 0.9173 | 0.9540 | 0.9231 | 0.9211 | 0.9412 |
| KNN | 0.9355 | 0.8700 | 0.9362 | 0.8907 | 0.9011 |
| DT | 0.8627 | 0.8600 | 0.8627 | 0.8720 | 0.8814 |
| Classifiers | Accuracy | Precision | F1 Score | Sensitivity | Specificity |
|---|---|---|---|---|---|
| NB | 0.9776 | 0.9467 | 0.9656 | 0.9576 | 0.9409 |
| SVM | 0.9609 | 0.9398 | 0.9456 | 0.9569 | 0.9534 |
| Soft Max | 0.9378 | 0.9200 | 0.9020 | 0.9190 | 0.9019 |
| KNN | 0.9065 | 0.8901 | 0.8709 | 0.8809 | 0.8954 |
| DT | 0.8542 | 0.8148 | 0.8300 | 0.8033 | 0.8258 |
| Classifiers | Accuracy | Precision | F1 Score | Sensitivity | Specificity |
|---|---|---|---|---|---|
| NB | 0.9801 | 0.9787 | 0.9745 | 0.9604 | 0.9594 |
| SVM | 0.9767 | 0.9567 | 0.9698 | 0.9677 | 0.9645 |
| Soft Max | 0.9498 | 0.9309 | 0.9295 | 0.9245 | 0.9324 |
| KNN | 0.9065 | 0.8993 | 0.8795 | 0.8886 | 0.8975 |
| DT | 0.8542 | 0.8175 | 0.8397 | 0.8095 | 0.8284 |
| Ref | Method | Accuracy (%) |
|---|---|---|
| [13] | Bayes-SqueezeNet | 98.83 |
| [63] | Tailored CNN | 92.30 |
| [64] | DenseNet | 88.90 |
| [65] | Capsule Networks | 95.70 |
| [66] | ResNet50 | 96.20 |
| [67] | Sgdm-SqueezeNet | 98.30 |
| [68] | DarkNet-19 based CNN | 87.02 |
| [69] | Transfer learning with Xception | 96.60 |
| [70] | Transfer learning with MobileNetV2 | 96.80 |
| [71] | CoroDet | 94.2 |
| [72] | COVINet | 97 |
| [73] | Shallow CNN | 95 |
| [74] | CovXNet | 97.6 |
| Proposed Method | CNN + ALO + NB | 99.63 |
Publisher’s Note: MDPI stays neutral with regard to jurisdictional claims in published maps and institutional affiliations. |
© 2022 by the authors. Licensee MDPI, Basel, Switzerland. This article is an open access article distributed under the terms and conditions of the Creative Commons Attribution (CC BY) license (https://creativecommons.org/licenses/by/4.0/).
Share and Cite
Karim, A.M.; Kaya, H.; Alcan, V.; Sen, B.; Hadimlioglu, I.A. New Optimized Deep Learning Application for COVID-19 Detection in Chest X-ray Images. Symmetry 2022, 14, 1003. https://doi.org/10.3390/sym14051003
Karim AM, Kaya H, Alcan V, Sen B, Hadimlioglu IA. New Optimized Deep Learning Application for COVID-19 Detection in Chest X-ray Images. Symmetry. 2022; 14(5):1003. https://doi.org/10.3390/sym14051003
Chicago/Turabian StyleKarim, Ahmad Mozaffer, Hilal Kaya, Veysel Alcan, Baha Sen, and Ismail Alihan Hadimlioglu. 2022. "New Optimized Deep Learning Application for COVID-19 Detection in Chest X-ray Images" Symmetry 14, no. 5: 1003. https://doi.org/10.3390/sym14051003
APA StyleKarim, A. M., Kaya, H., Alcan, V., Sen, B., & Hadimlioglu, I. A. (2022). New Optimized Deep Learning Application for COVID-19 Detection in Chest X-ray Images. Symmetry, 14(5), 1003. https://doi.org/10.3390/sym14051003