Article

Aerodynamic Effects Produced by a High-Speed Train Traveling through a Tunnel Considering Different Car Numbers

Key Laboratory of Urban Underground Engineering of Ministry of Education, Beijing Jiaotong University, Beijing 100044, China
*
Author to whom correspondence should be addressed.
Symmetry 2022, 14(3), 479; https://doi.org/10.3390/sym14030479
Submission received: 5 February 2022 / Revised: 19 February 2022 / Accepted: 23 February 2022 / Published: 26 February 2022
(This article belongs to the Section Computer)

Abstract

:
The geometrical configurations of high-speed trains and tunnels are symmetric. However, the aerodynamic pressure acting on tunnel walls induced by high-speed trains passing through is unsymmetric. The study of the aerodynamic effects produced by high-speed trains traveling through tunnels can be treated as the theoretical basis for safety evaluations of tunnel structures and operational trains. There is still no consensus regarding the use of three or four cars, as opposed to eight, in evaluations aerodynamic effects. To solve this problem, three-dimensional simulations were conducted to evaluate the effects of car number on the aerodynamic pressures of the tunnel lining and micropressure waves due to tunnel portals. The input parameters of our simulation were verified by comparing with field monitoring data obtained by other researchers. The results indicate that the root cause of the differences in the aerodynamic pressures of the tunnel lining and the micropressure waves of tunnel portals according to car number is that the wave diagrams of different car numbers inside tunnels present significant differences. The differences in the maximum positive and negative pressure peaks experienced by the tunnel lining between a three- and an eight-car model are 11.70% and 44.0%, respectively, while the differences in the same scenario are as high as 48.6% and 46.4% after train tail leaves the tunnel. When the car number increases from three to eight, the time to reach the maximum negative pressure peak of the micropressure wave is periodically delayed. The delay period can be defined as T = loc/v (loc: single train carriage length, v: train speed).

1. Introduction

When a railway train enters a tunnel portal at high speed, the air surrounding the train body is compressed due to the astrict of the tunnel wall. Additionally, pressure waves are generated and move along the tunnel at the speed of sound. When the pressure waves arrive at the tunnel portal, most of them are reflected into the tunnel and are partially transformed into micropressure waves. The aerodynamic pressures on the tunnel lining and the micropressure waves of the tunnel portals are generated and propagated when high-speed trains travel through a tunnel [1,2]. The adverse effects associated with these aerodynamic pressures become more detrimental with increasing intensity of the initial pressure wave [3,4]. As such, the tunnel lining can suffer damage after experiencing many cycles of aerodynamic pressure [5,6], as well as from factors such as noise and vibration, which result from micropressure waves [7,8]. Therefore, an increasing number of researchers are systematically studying aerodynamic pressure and micropressure waves using theoretical analyses [9,10,11], field measurement [12,13], moving model tests [14,15,16], and numerical simulations [17,18,19]. Deriving analytical solutions based on theoretical analyses is almost impossible due to the complex turbulence characteristics associated with train tunnels. It is also very challenging to obtain field measurements due to the unpredictable field environment and the difficulty of coordinating among the numerous management departments. The number of testing systems for large-scale moving models is limited due to the huge floor space and the high construction costs. Therefore, numerical simulations are the first choice for studying the aerodynamic effects of high-speed trains. However, numerical simulations also present many unresolved problems, such as the effects of turbulence models, the question of the number of cars, etc. The performance of different turbulence models to predict the slipstream around a high-speed train were analyzed [18]. The results obtained by the qualitative prediction of different turbulence models and wind-tunnel tests were consistent. However, the accuracy of quantitative predictions was closely related to the element number and the physical timestep. The effects of turbulence models, Reynolds number, and mesh number on the transient pressures experienced by tunnel linings and train body surfaces were systematically studied [20]. The effects of the turbulence model on the aerodynamic pressures were larger than those of element number. Subsequently, The effects of high-speed train length on aerodynamic pressure were explored [21]. The first pressure peak of the aerodynamic pressure on the tunnel lining was found to increase with an increasing number of cars. These studies mostly focused on the behavior of trains while inside the tunnel.
Recently, the effects of reducing the cross-section of the middle section of tunnels on the aerodynamic pressures produced by two trains intersecting in a high-speed railway tunnel using a three- and four-car setup were studied [19]; the total lengths of the trains were 79.8 m and 105.5 m, respectively, while the width and height of the middle car were 3.4 m and 4.0 m, respectively. The effects of crosswind on the aerodynamic performance of a high-speed train after traveling through a tunnel, bridge, and tunnel using a three-car model were investigated [22]. The total length of the train was 76.00 m, while the width and height of the middle car were 3.26 m and 3.89 m, respectively. The effects of reduced underbody clearance on aerodynamic effects using a three-car model were researched [23]. The total length of train 76.90 m, and the width and height of the middle car were 2.95 m and 3.89 m, respectively. Although many studies used have used three- or four-car models to evaluate the aerodynamic effects of trains, the effects of the number of cars on the simulation results have not been systematically studied.
To further evaluate the rationale of using a three- or four-car model instead of an eight-car model, a numerical simulation was carried out to evaluate the effects of car number on the aerodynamic pressures experienced by the tunnel lining and the micropressure waves which occur at the tunnel portals.

2. Numerical Simulation Method

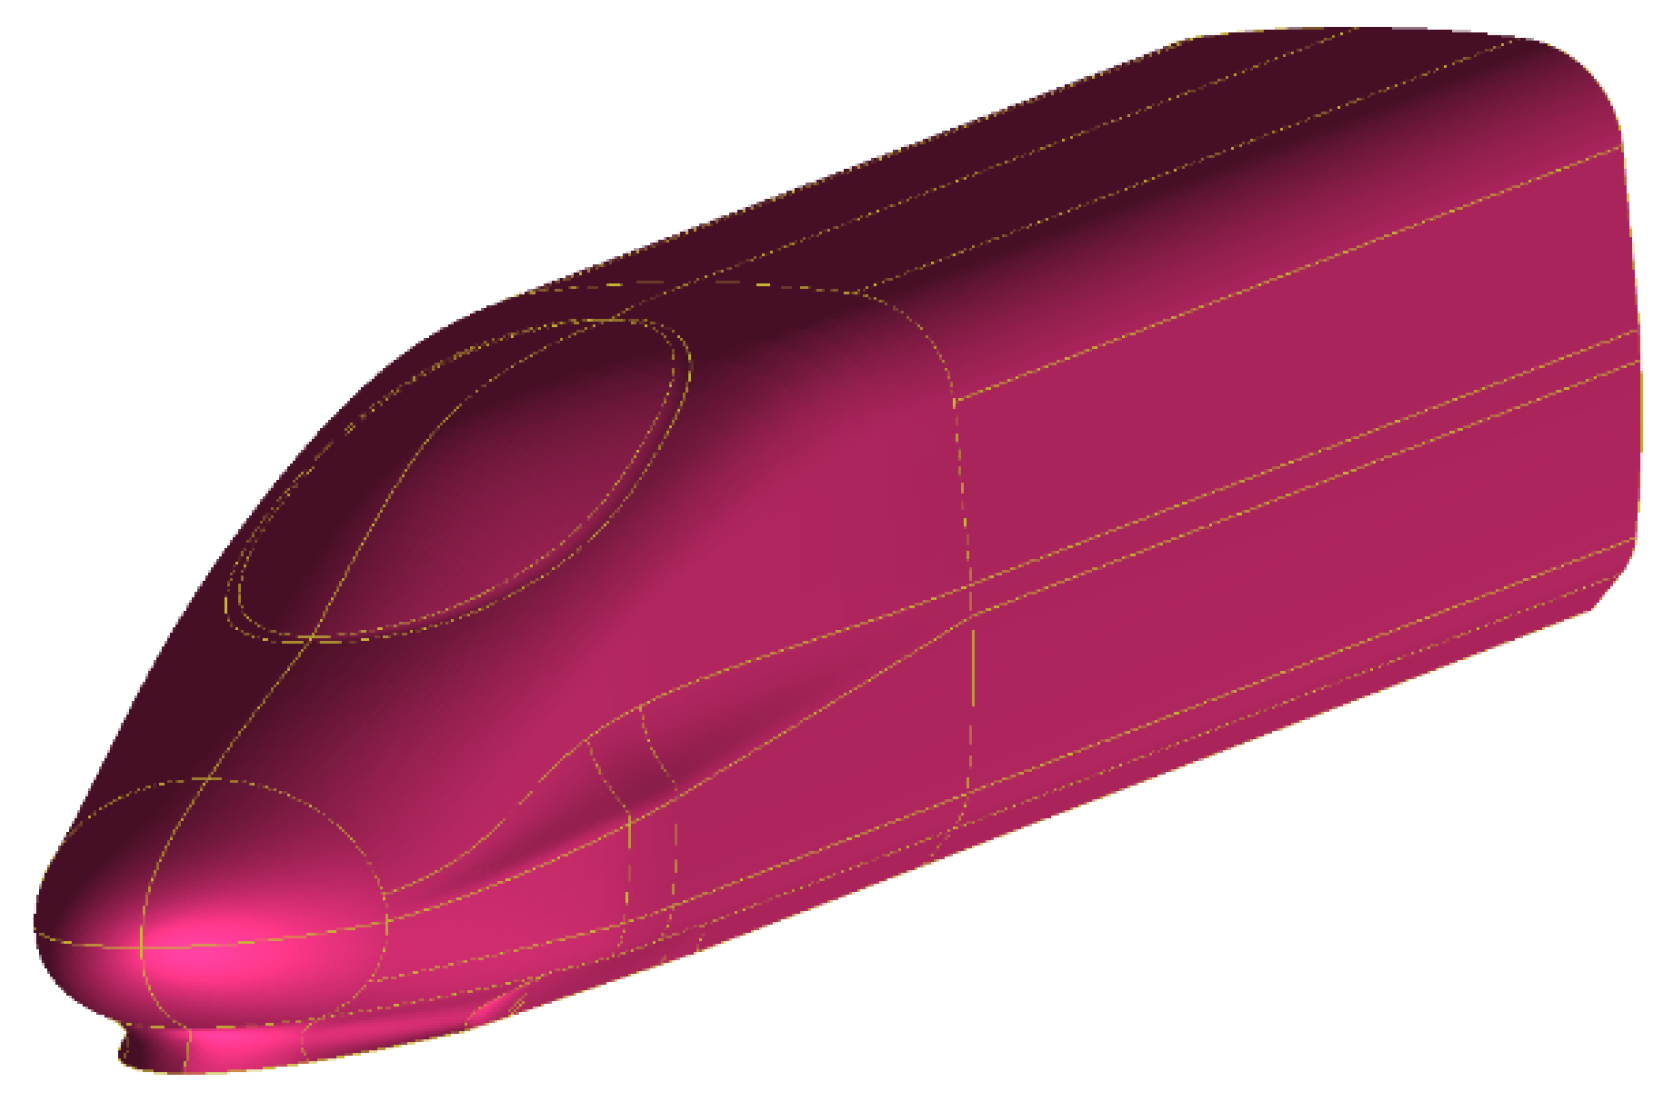
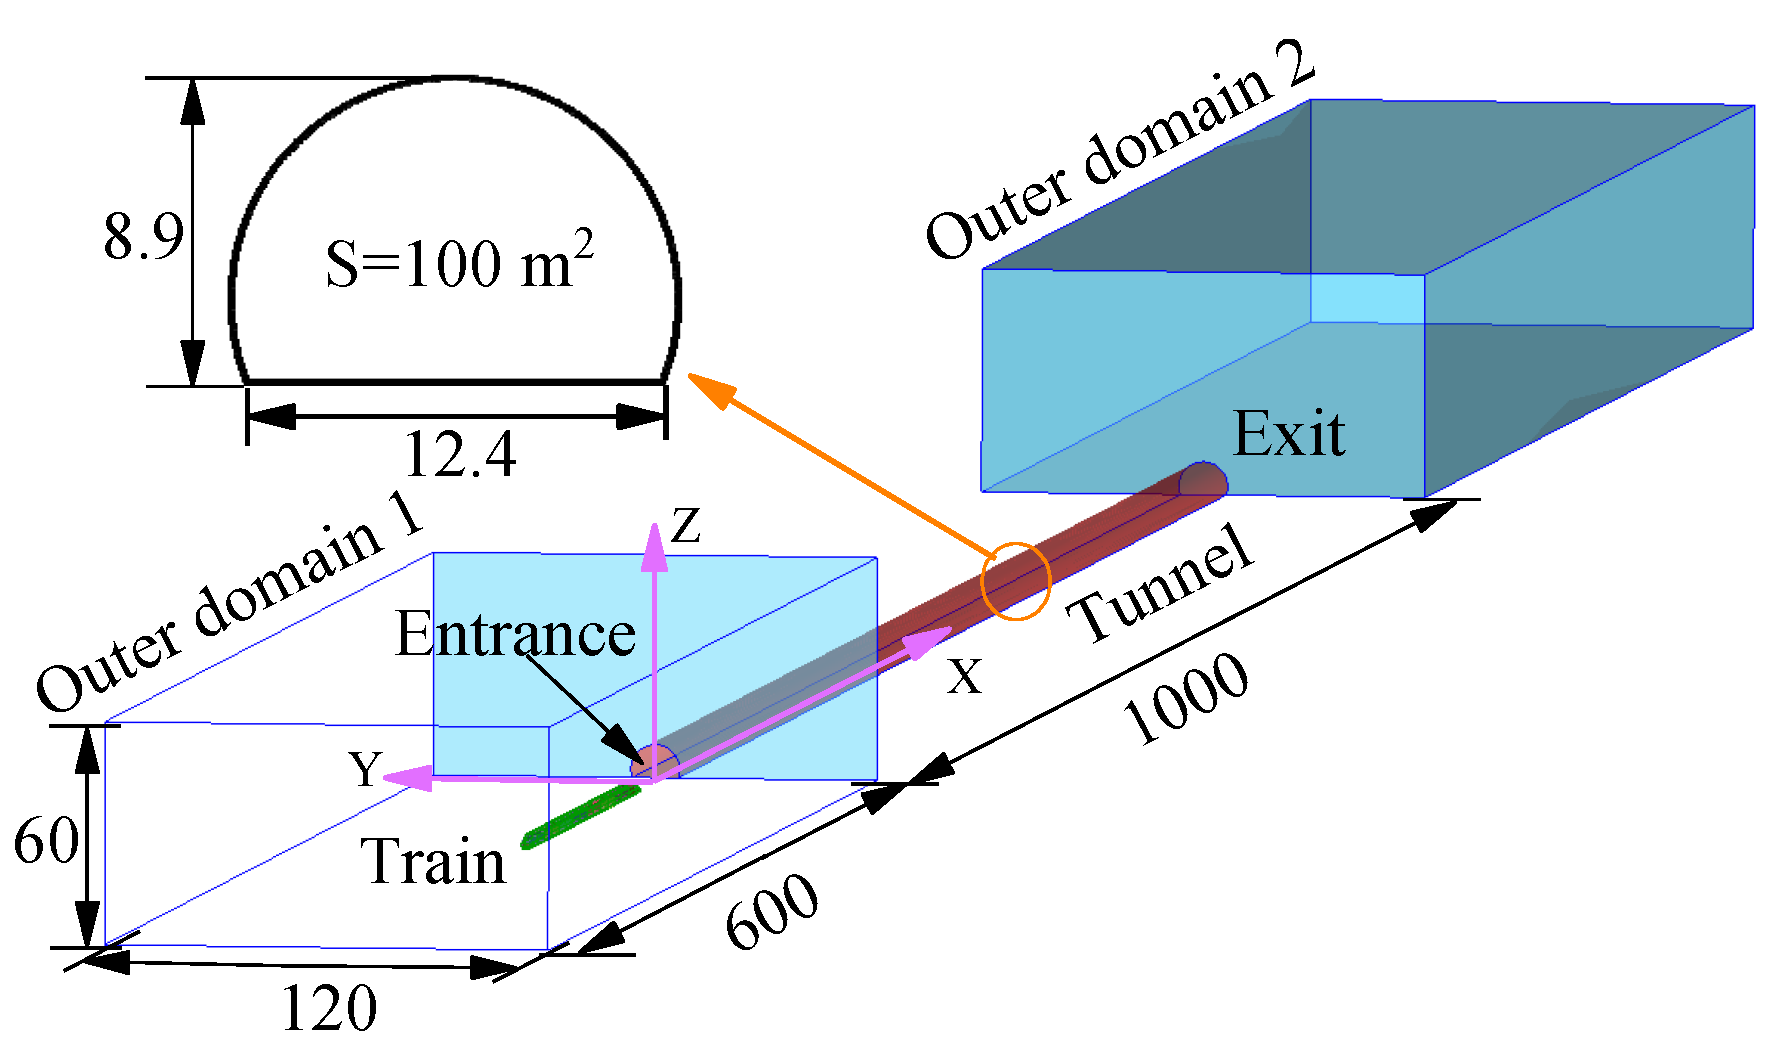
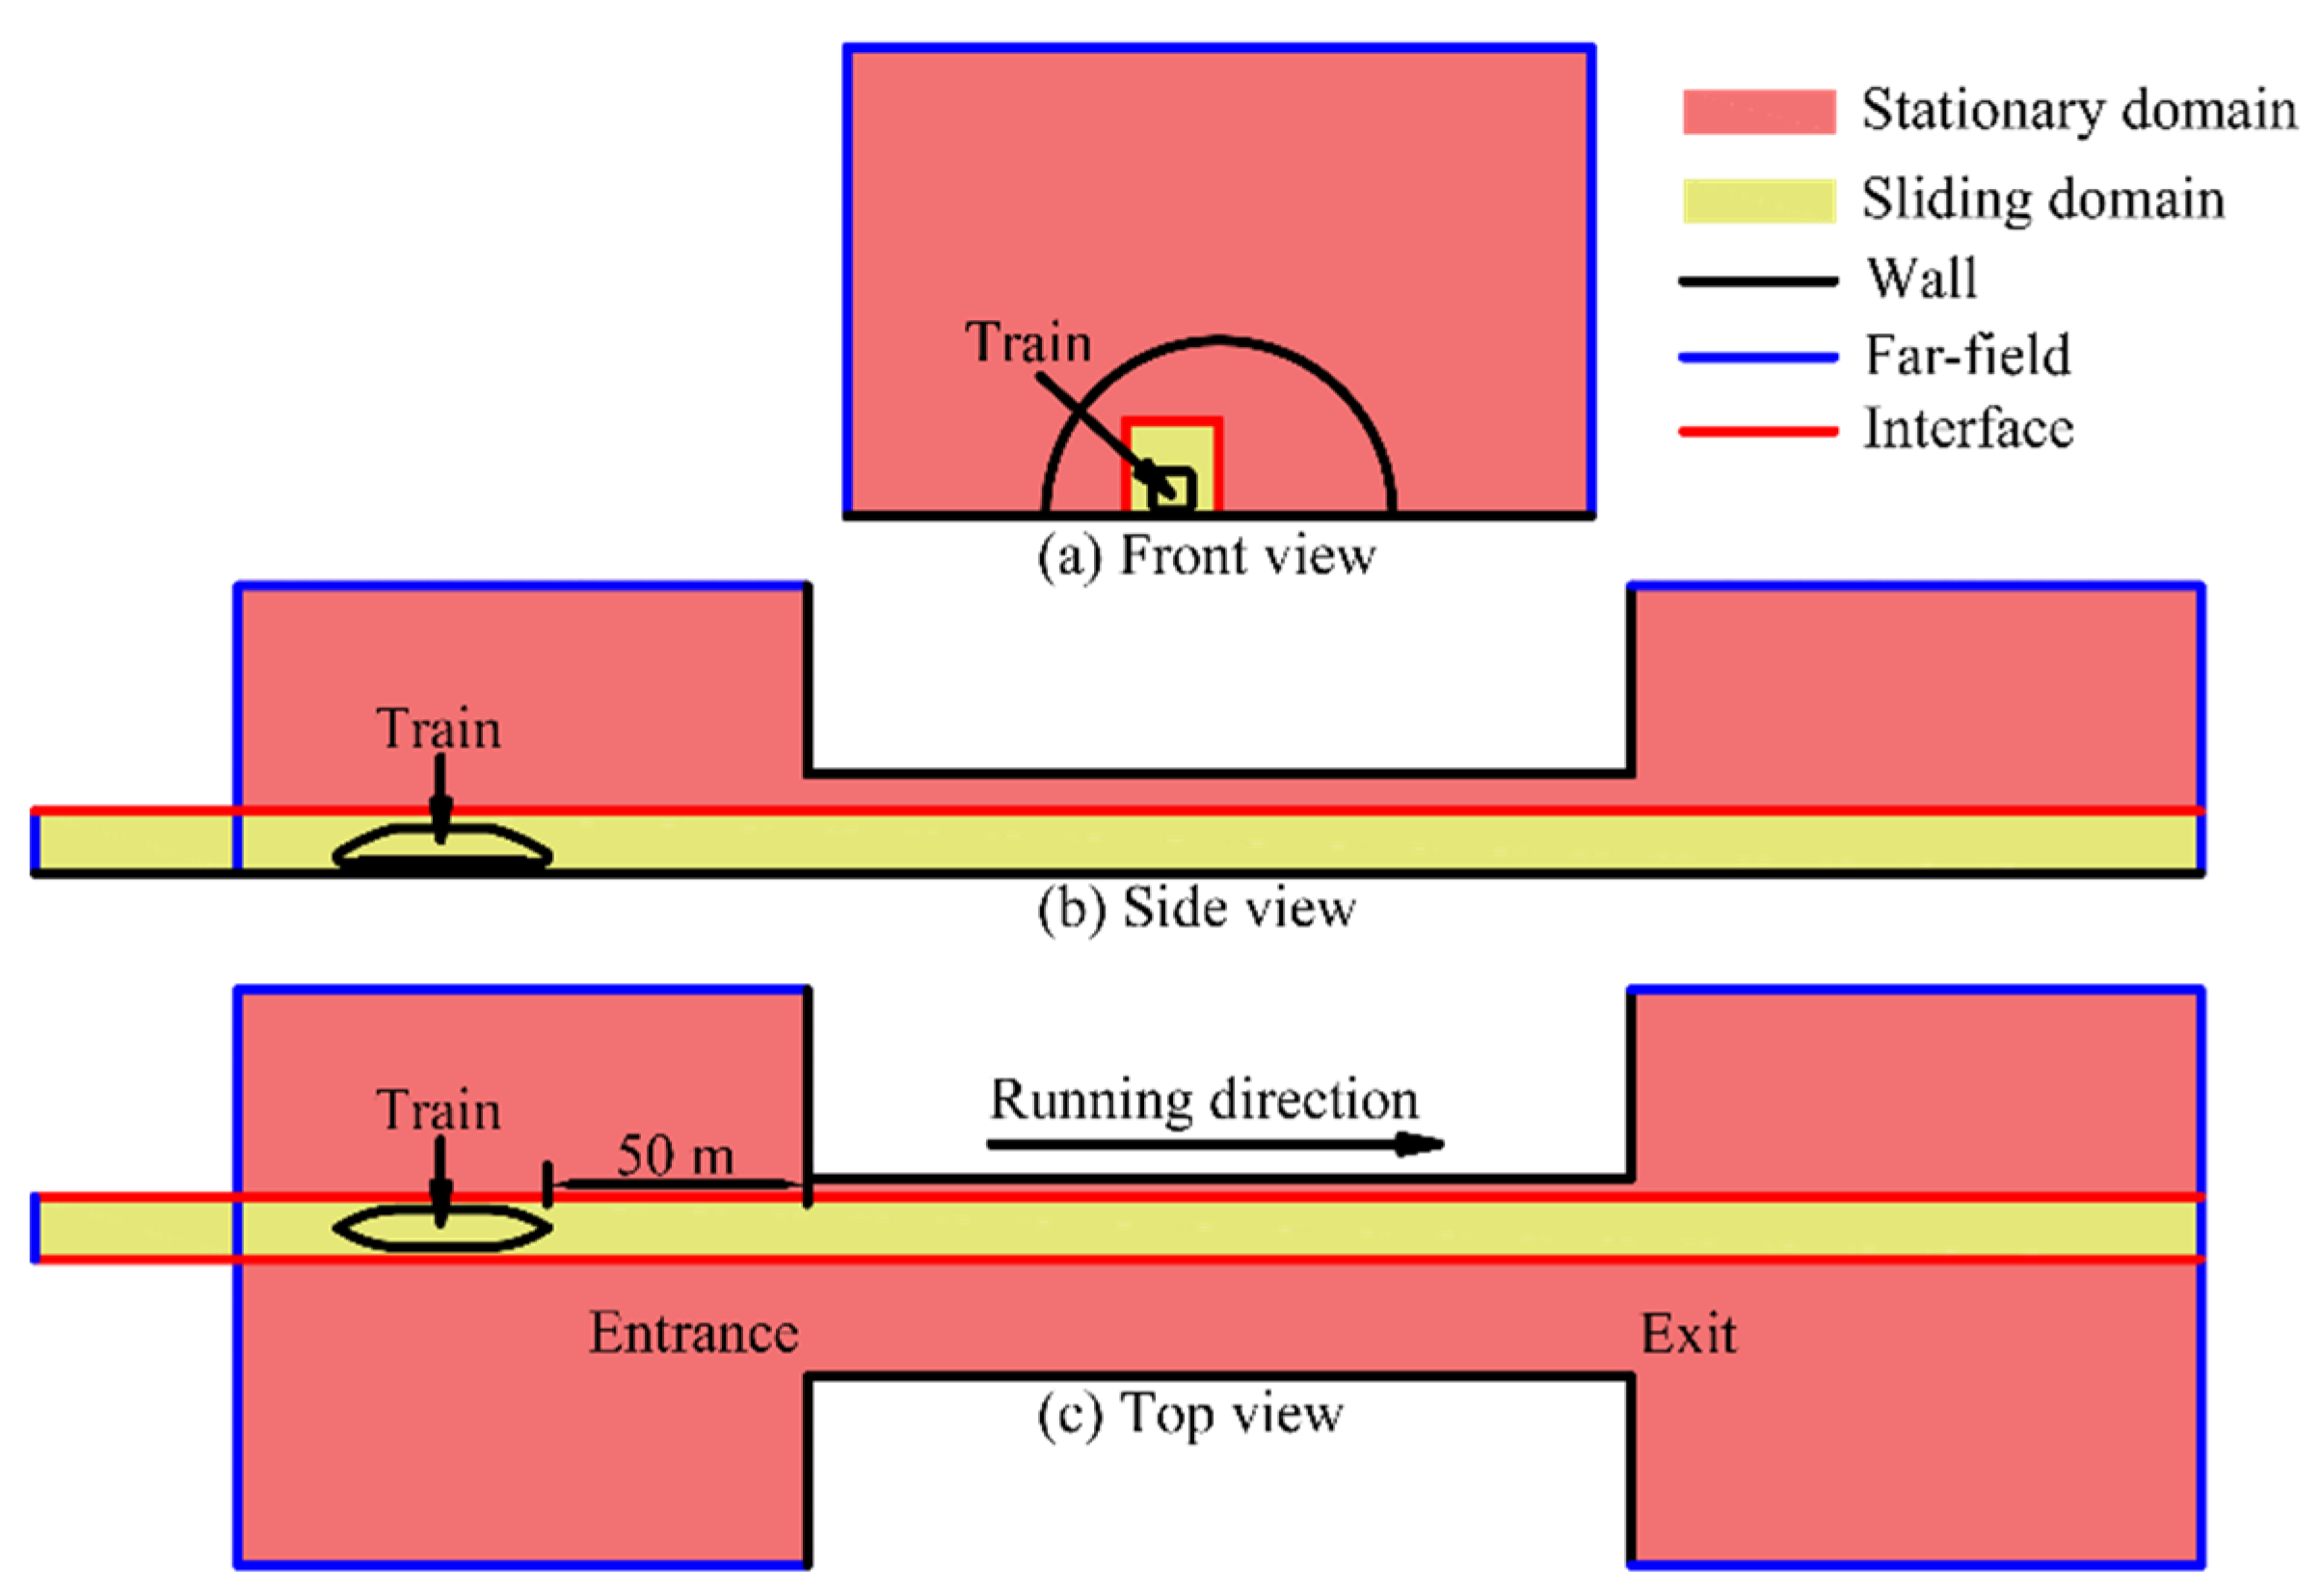
2.1. Numerical Models

The prototypes of train and tunnel models used in our simulation were the CRH380A high-speed train and a typical high-speed railway tunnel with double tracks. The small features of the train model (such as lights, handlebars, bogies, and roof pantographs) were omitted, because the effects of these features on the simulated results are negligible. The model configurations between the head and tail cars were identical, as shown in Figure 1. The car number in our simulation varied from three to eight. The specifications of the train and tunnel models are shown in Table 1. The blockage ratio was defined as the cross-sectional ratio of train-to-tunnel.
The computational domain is shown in Figure 2. The boundary conditions are shown in Figure 3. The computational domain includes stationary domain 1 and sliding domain 2. The stationary domain 1 can be divided into an outer and a tunnel domain. The length, width, and height of the outer domain were 600 m, 120 m, and 60 m [24], respectively. The dimensions of the outer domain of our simulation were greater than those used in other studies [5,17,19,25,26], which ensured that the flow field induced by a high-speed train passing through the tunnel was fully developed. Sliding domain 2 was simulated using a slender cuboid. The running of the train was realized by sliding domain 2. The information exchange between stationary domain 1 and sliding domain 2 was realized using an interface [27,28].
The entire computational domain was discretized using a hexahedral grid with the ANSYS ICEM software. The mesh scheme of train nose and tunnel portal is shown in Figure 4. To evaluate the effects of mesh density on the numerical results, a mesh independent study was performed by comparing the maximum peak-to-peak pressure values. Three different forms of mesh, i.e., fine (21107087), medium (15470780), and coarse (10258122), were selected. The evolution of aerodynamic pressure for different mesh densities are shown in Figure 5 for a single high-speed train traveling through a 1000-m-long tunnel at a speed of 350 km/h [25]. The monitoring section was located at the middle of the longitudinal direction of the tunnel. The height of the monitoring point above the ground was 3.0 m. The maximum peak-to-peak pressures of the fine, medium, and coarse meshes were 3.362 kPa, 3.361 kPa, and 3.368 kPa, respectively. Compared with the fine mesh, the difference in the medium mesh was smaller than that of the coarse mesh. Therefore, the size parameters of the medium mesh were used.

2.2. Calculated Parameters

The characteristics of flow field inside the tunnel resulting from the passage of a high-speed train are three-dimensional, compressible, viscous, and turbulent. The corresponding governing equations are continuity equations, momentum equations, and energy equations [29,30,31]. The commercial software ANSYS FLUENT was used to solve the governing equations. The input parameters of our simulation are shown in Table 2. All numerical calculations were performed at the High-performance Computing Center of Beijing Jiaotong University. Each numerical model was computed using 288 CPUs in parallel. When the total number of mesh was 21.0 million, the corresponding computation time was approximately 240 h.

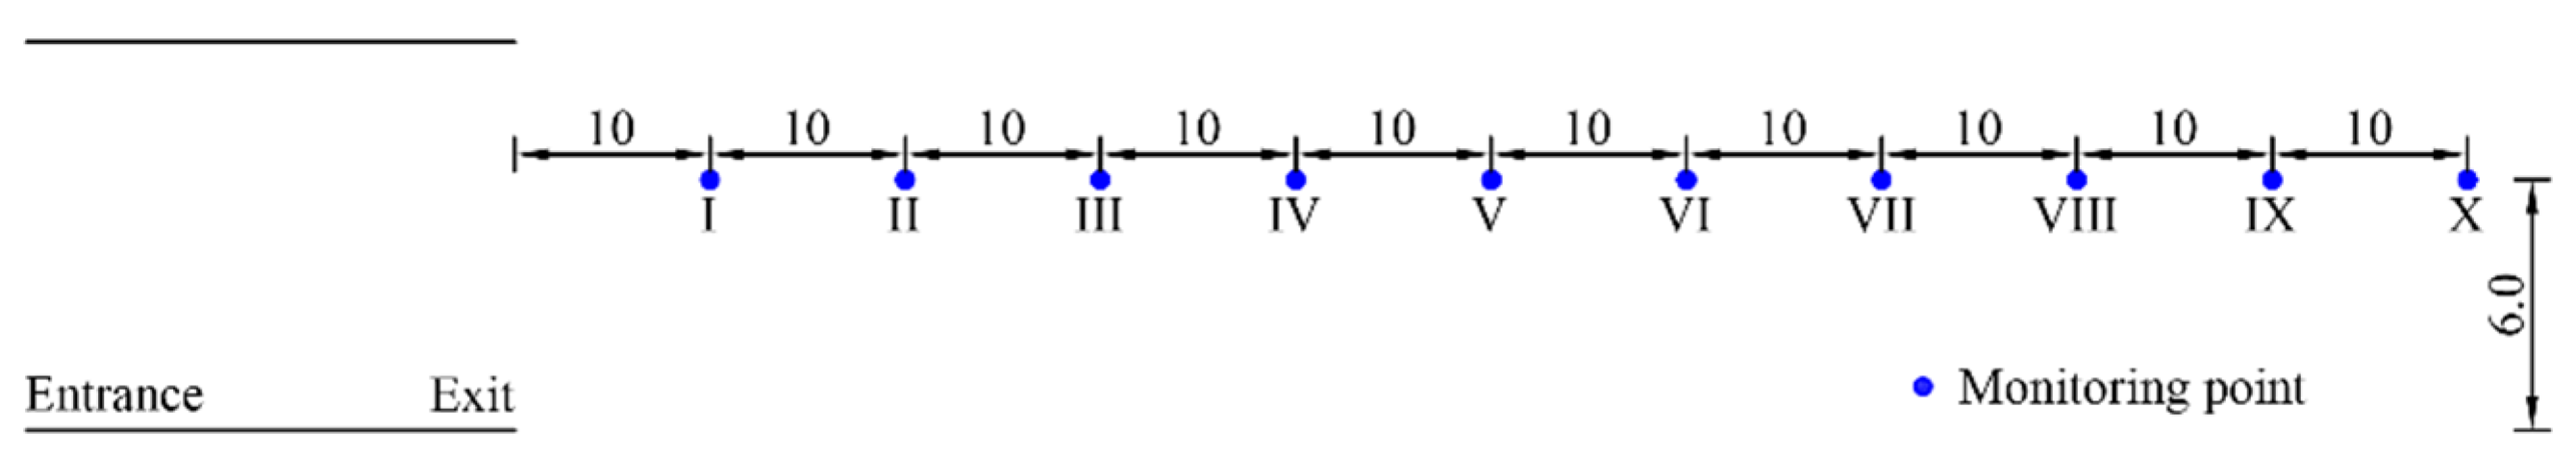
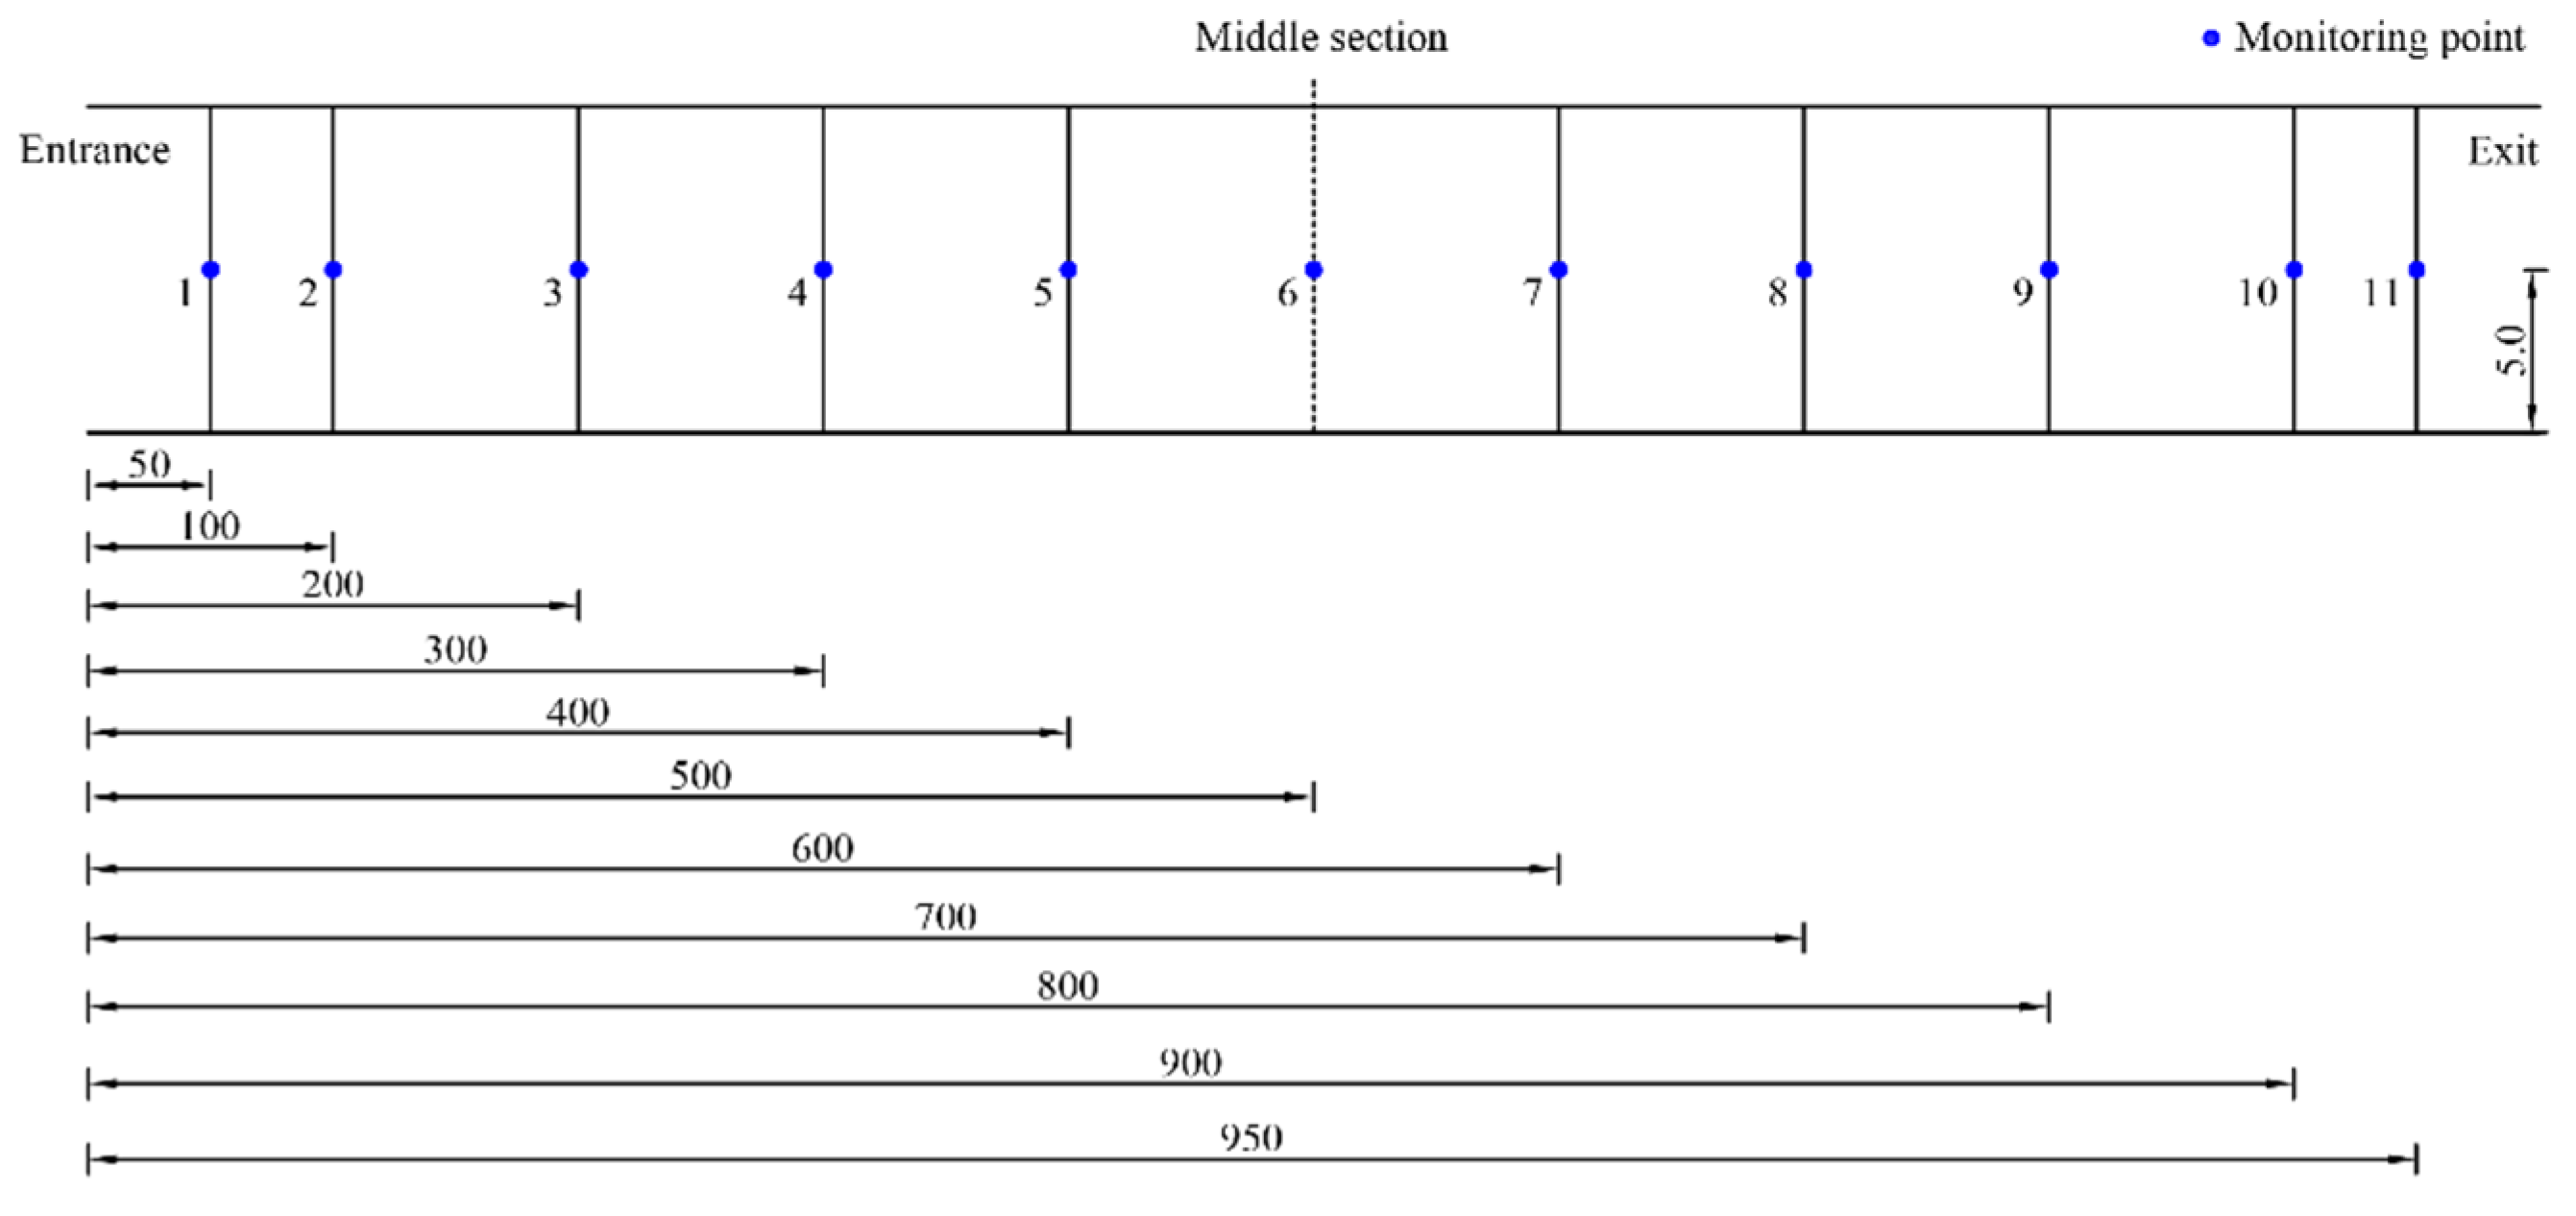
2.3. Layout of Monitoring Points
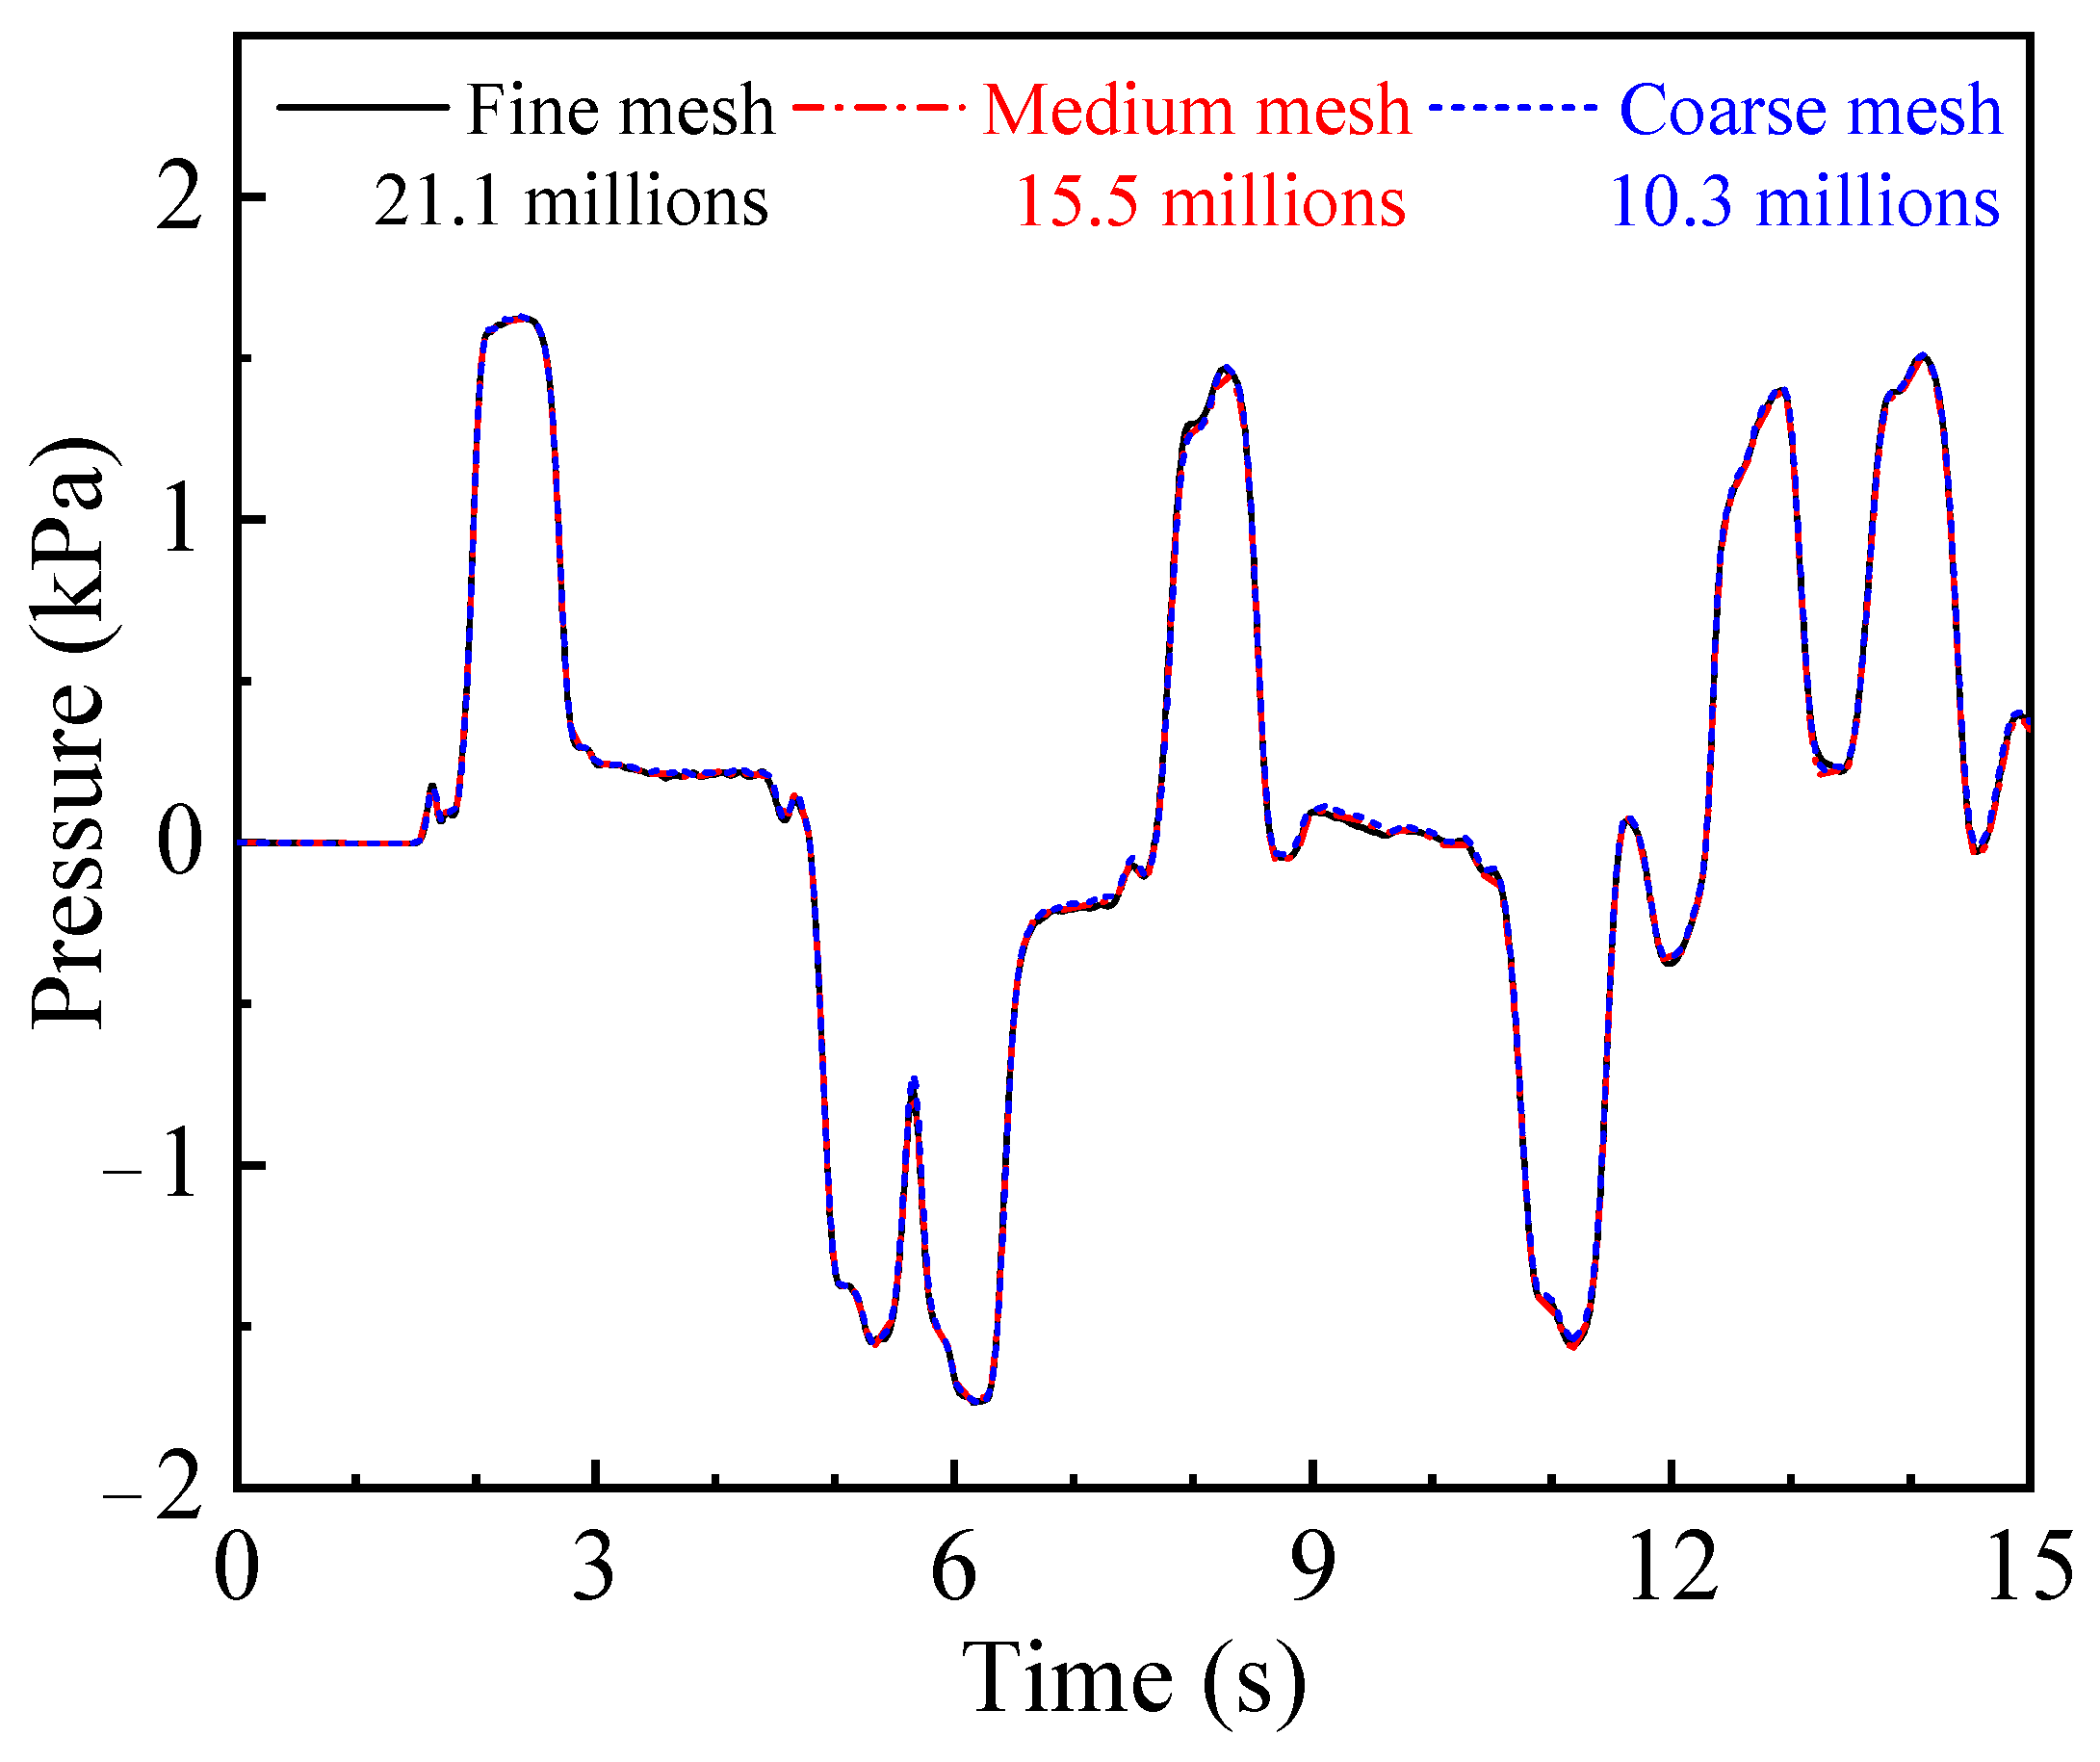
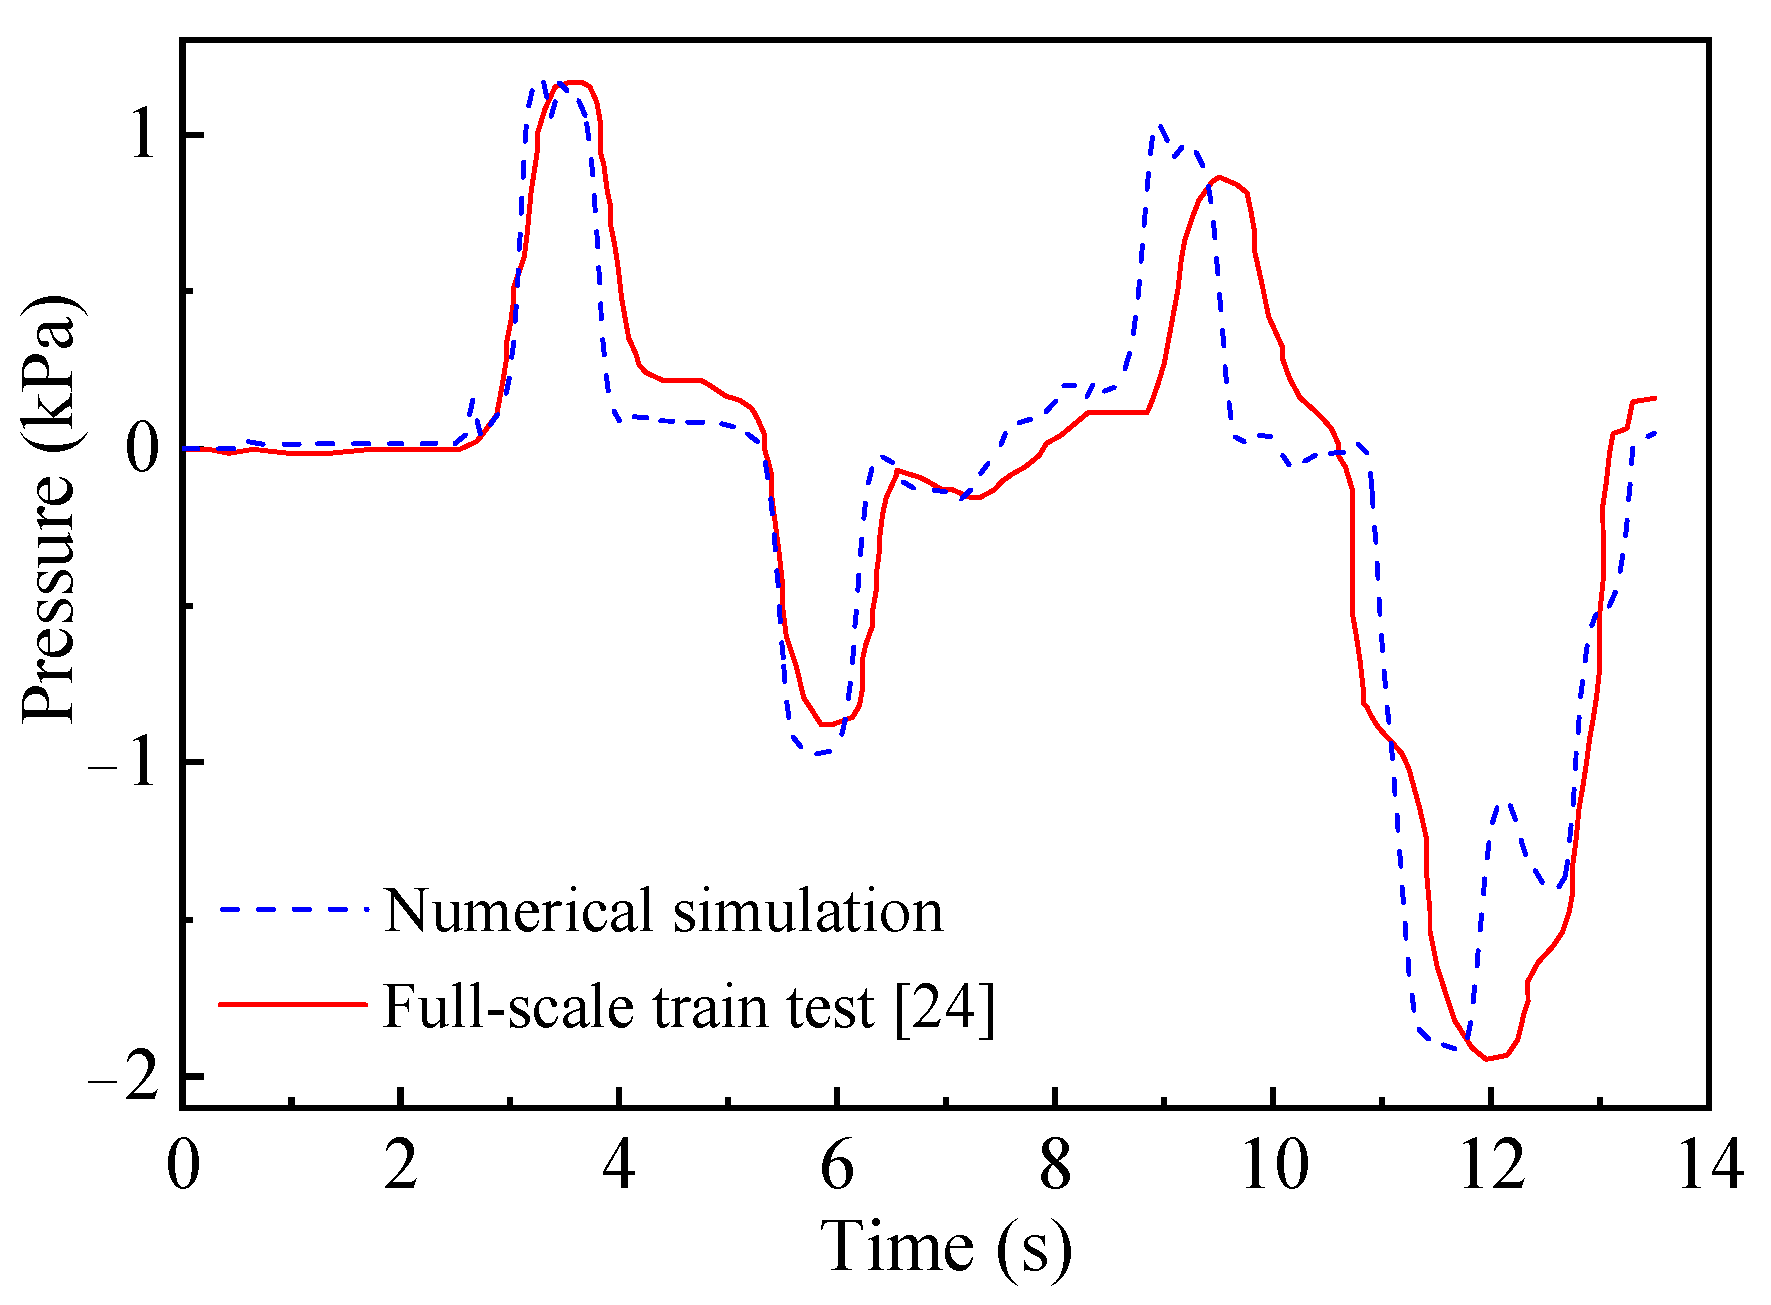
A total of 11 monitoring points were arranged at different locations on the tunnel walls, as shown in Figure 6. A total of 10 monitoring points were arranged at different locations outside the tunnel exit, as shown in Figure 7. The distance between the monitoring points outside the tunnel exit and the tunnel’s cross-sectional centerline was 2.5 m. Note that the monitoring points on the tunnel wall and outside the tunnel exit were located on the same side as the running train inside the tunnel.

3. Validation

To ensure the rationality of the input parameters used in our simulation, the computed results obtained by the numerical simulation were compared with field test results. A series of field tests on the Beijing-Shanghai high-speed railway line were carried out [24]. In the field test, the tunnel was a typical double-track tunnel with a total length of 978 m; the type of train was CRH380A with eight cars, and the train speed was 300 km/h (83.333 m/s). The numerical simulations were carried out under the same conditions.
A comparison of the evolution of aerodynamic pressure, as obtained by numerical simulation and field tests, is shown in Figure 8. The monitoring point was located 860 m far the tunnel entrance and 1.5 m above the ground. The evolution of the waveform of aerodynamic pressure obtained via numerical simulation was the same as that of the field test. The differences in the maximum positive peak, negative peak, and peak-to-peak pressures between the numerical simulation and field test were 1.57%, 1.43%, and 0.289%, respectively. A comparative analysis indicated that the input parameters of our simulation were reasonable, and thus, that they could be applied in subsequent study.

4. Results

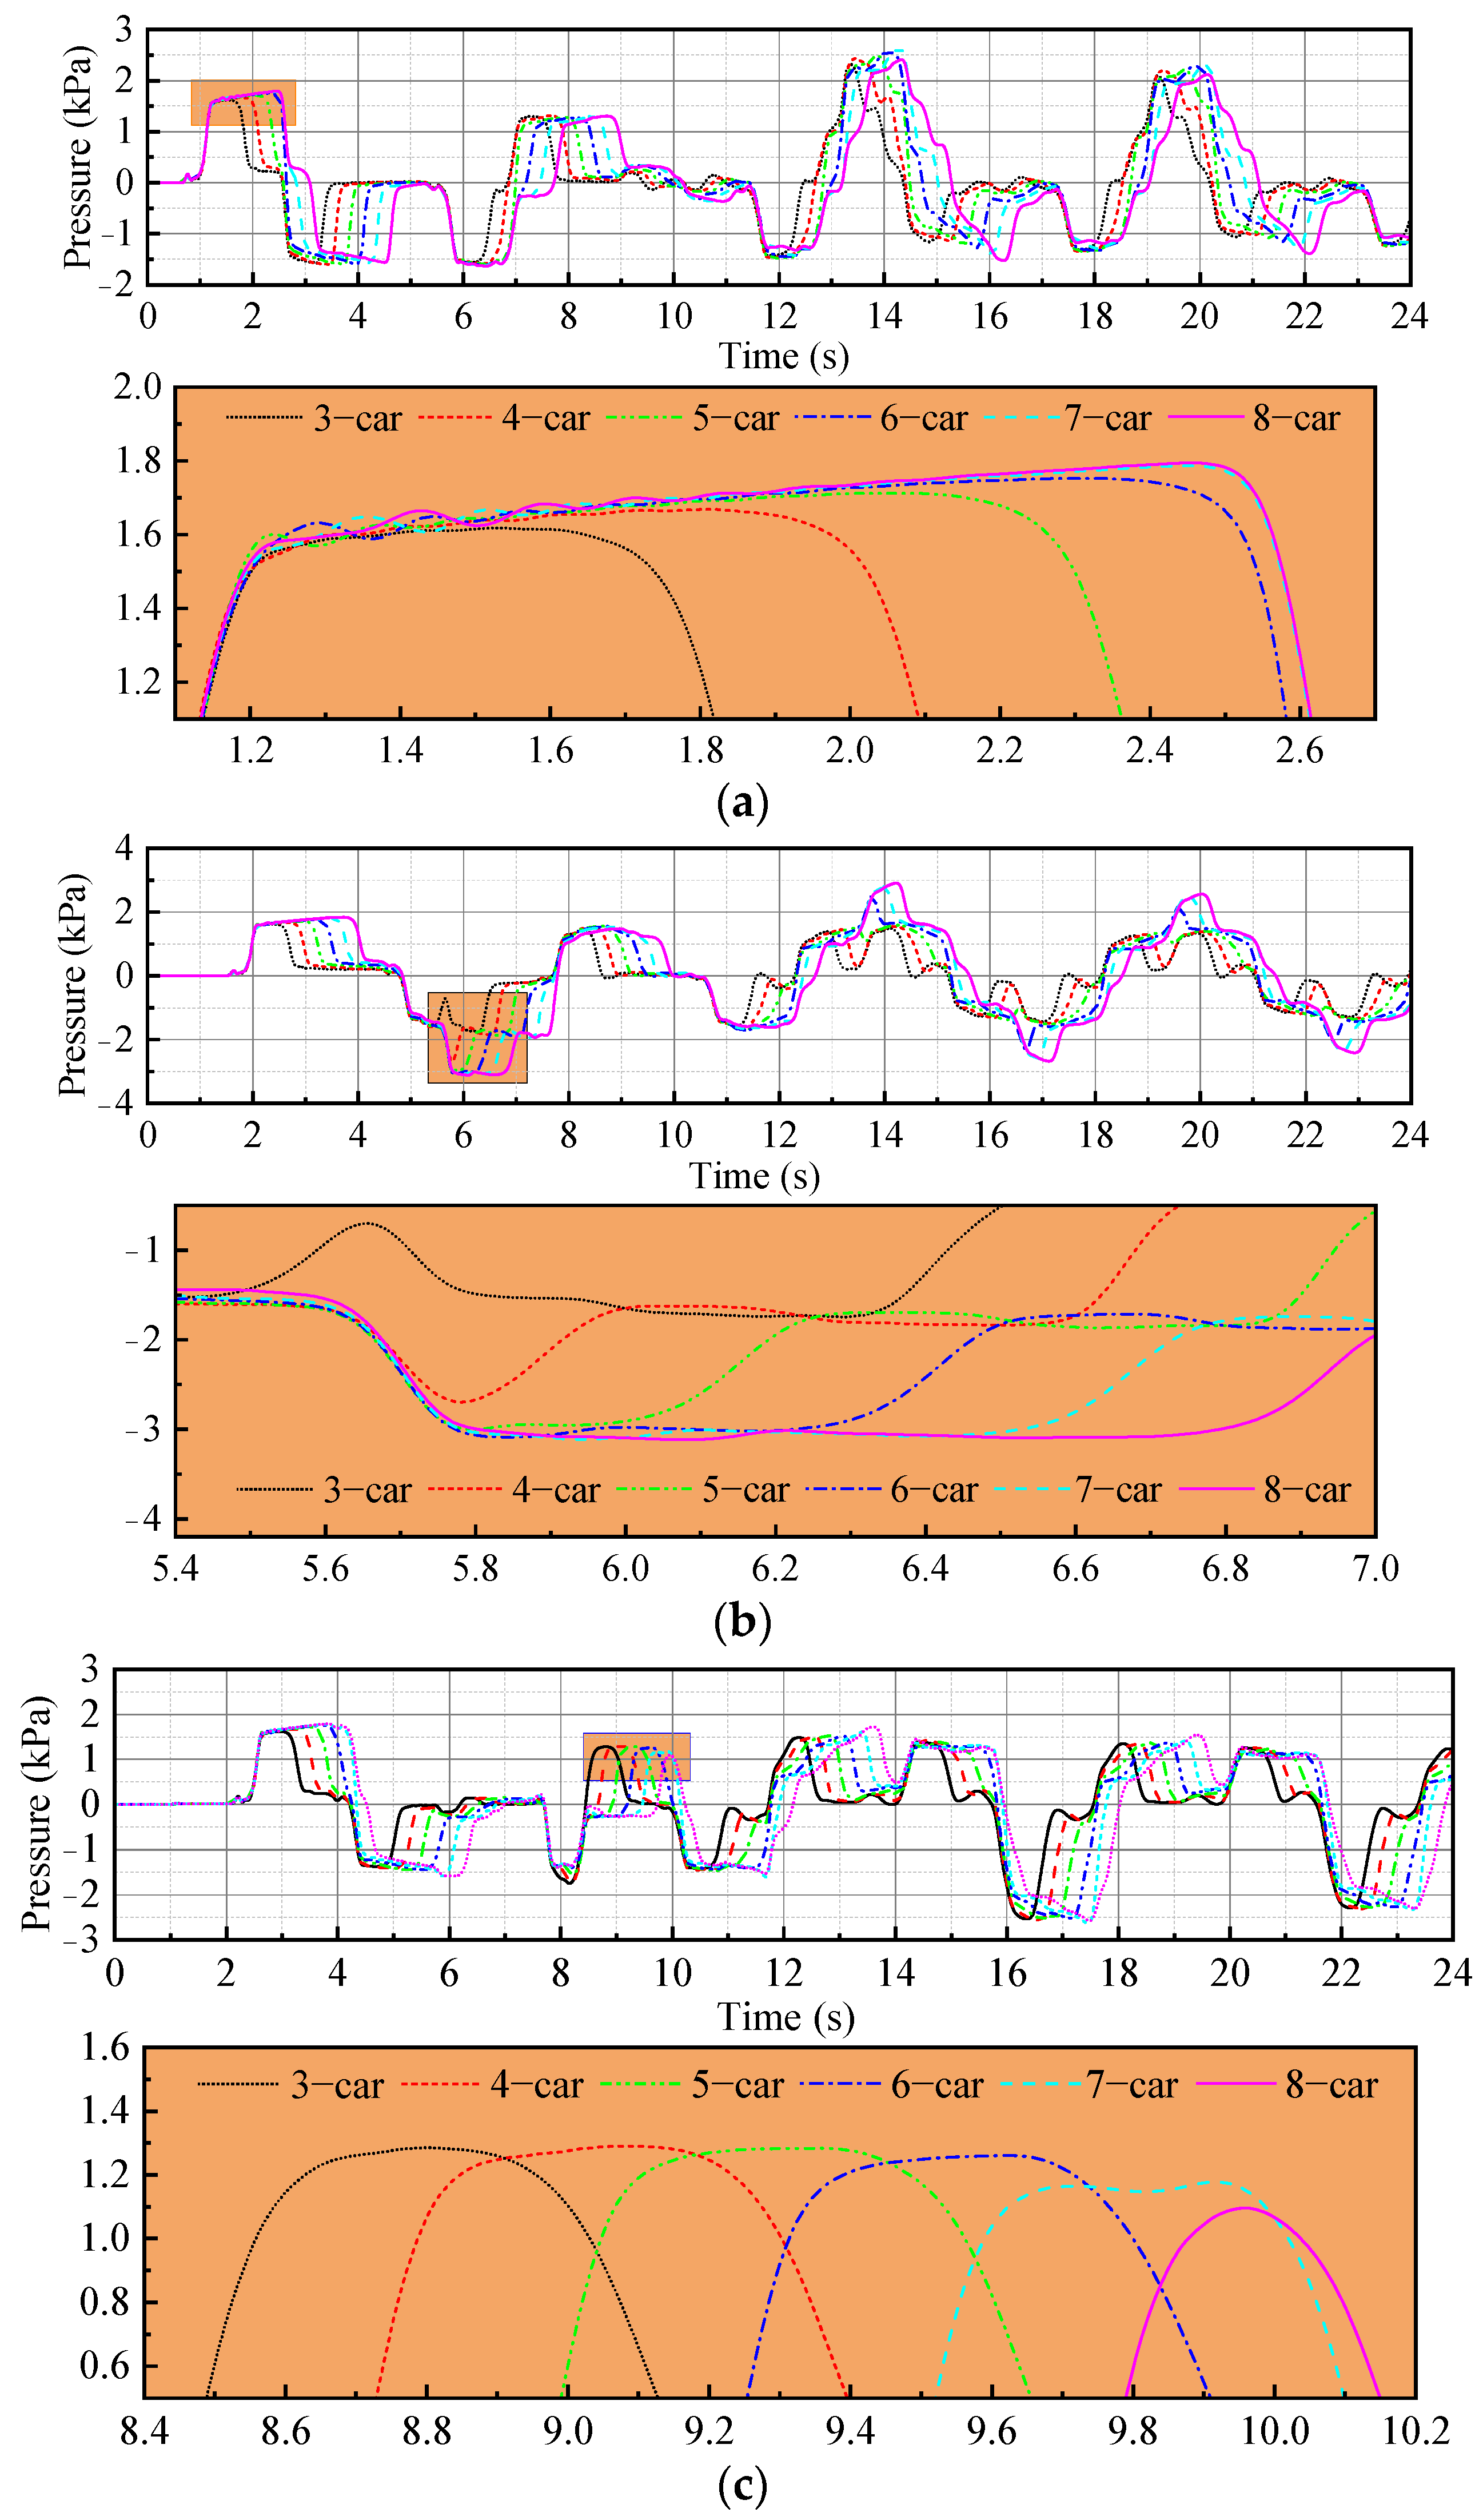
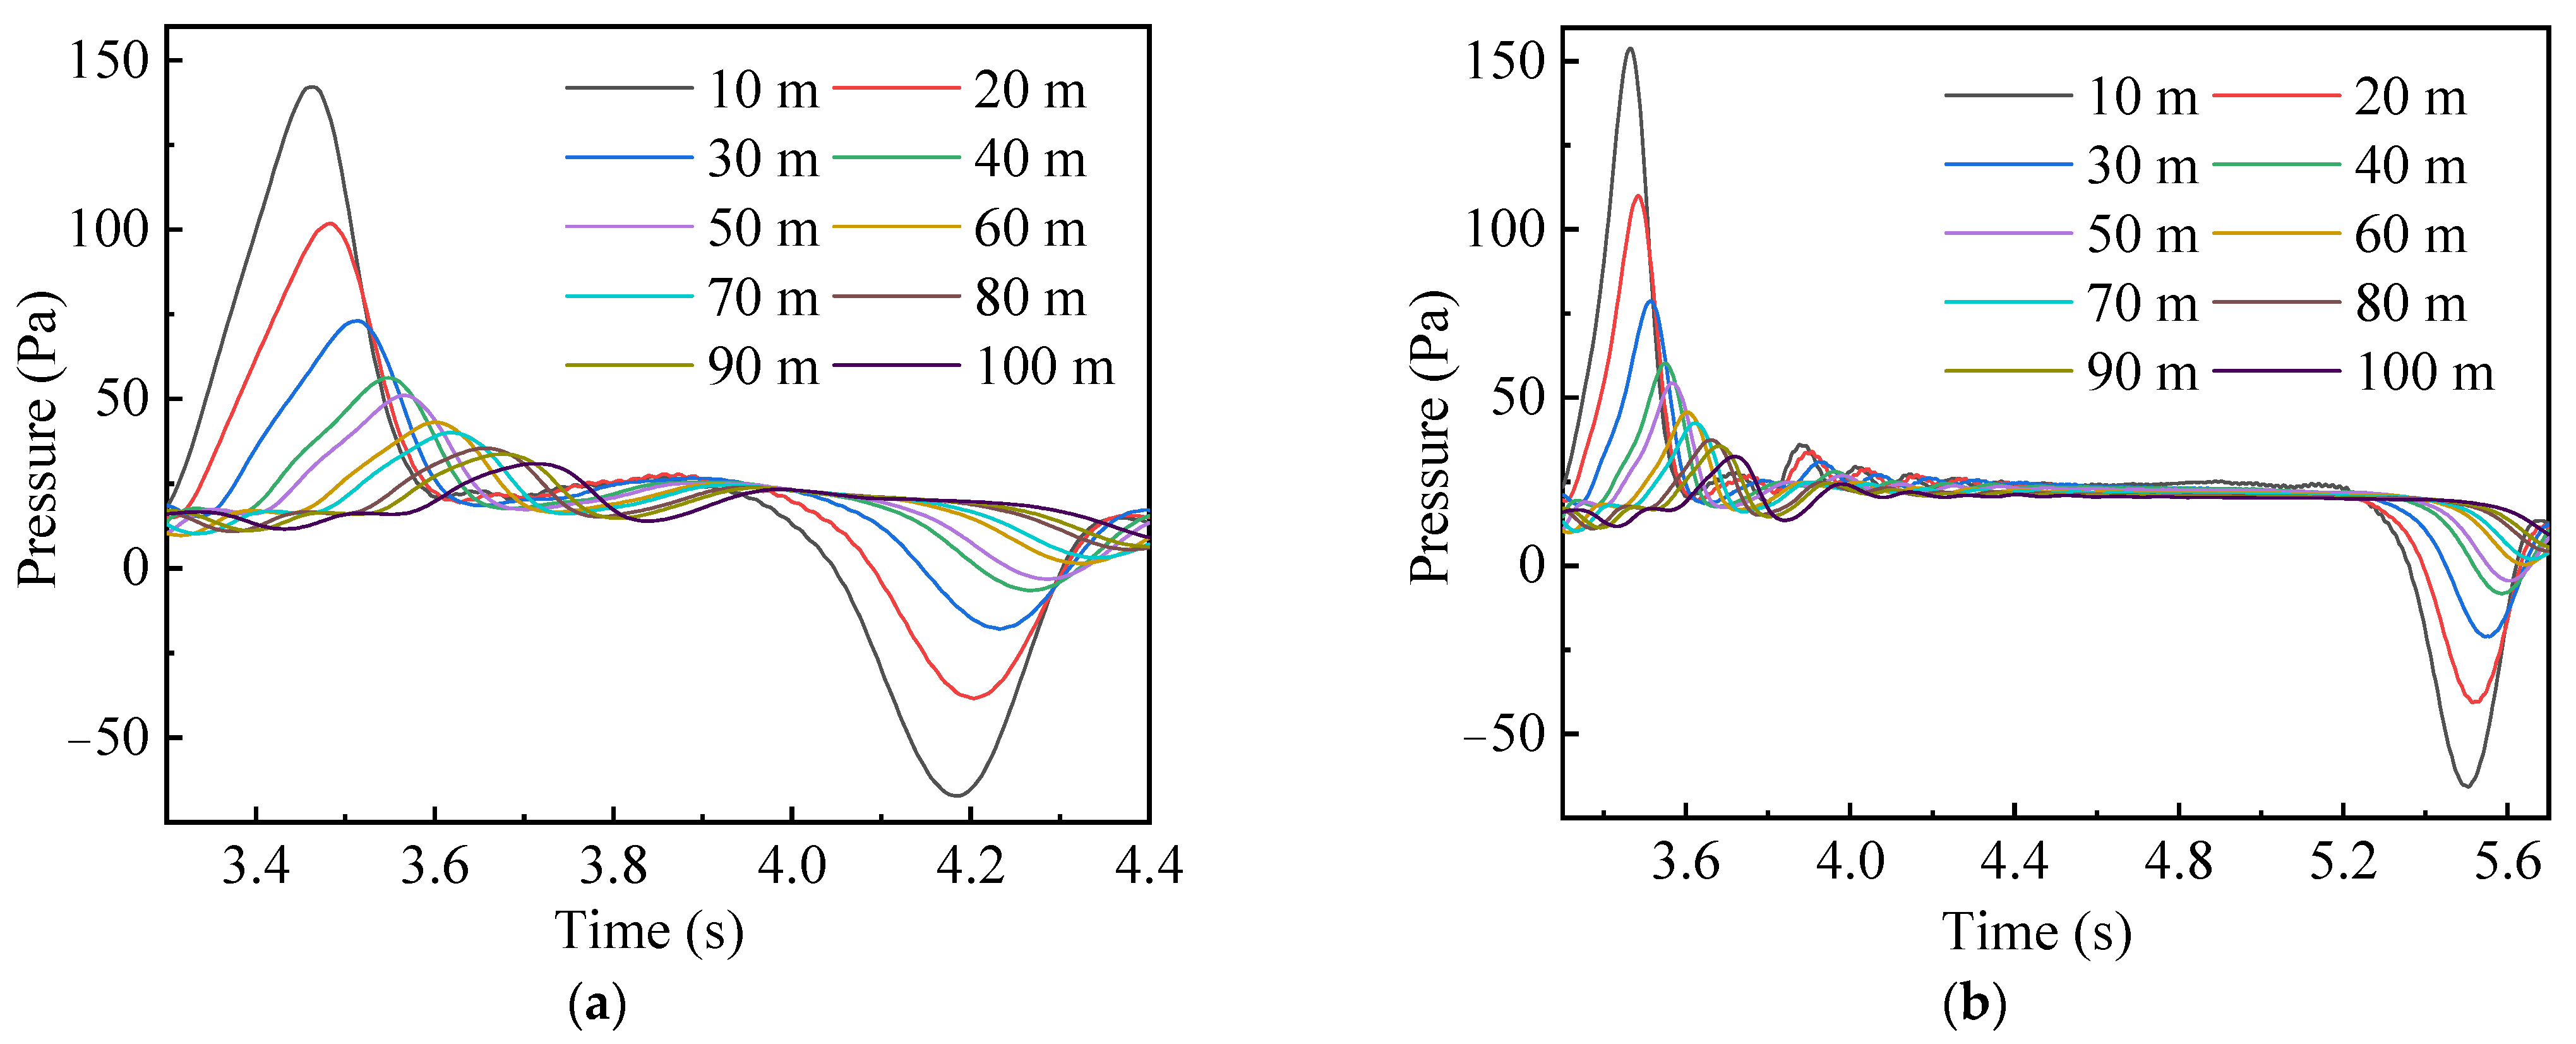
4.1. Time History of Aerodynamic Pressures

The evolution of aerodynamic pressure at three monitoring points with different car numbers is shown in Figure 9. The variation trends of aerodynamic pressure for different car numbers were consistent. However, the peak pressure and the time to reach each peak pressure were significantly different, especially the difference between the three- and eight-car trains.

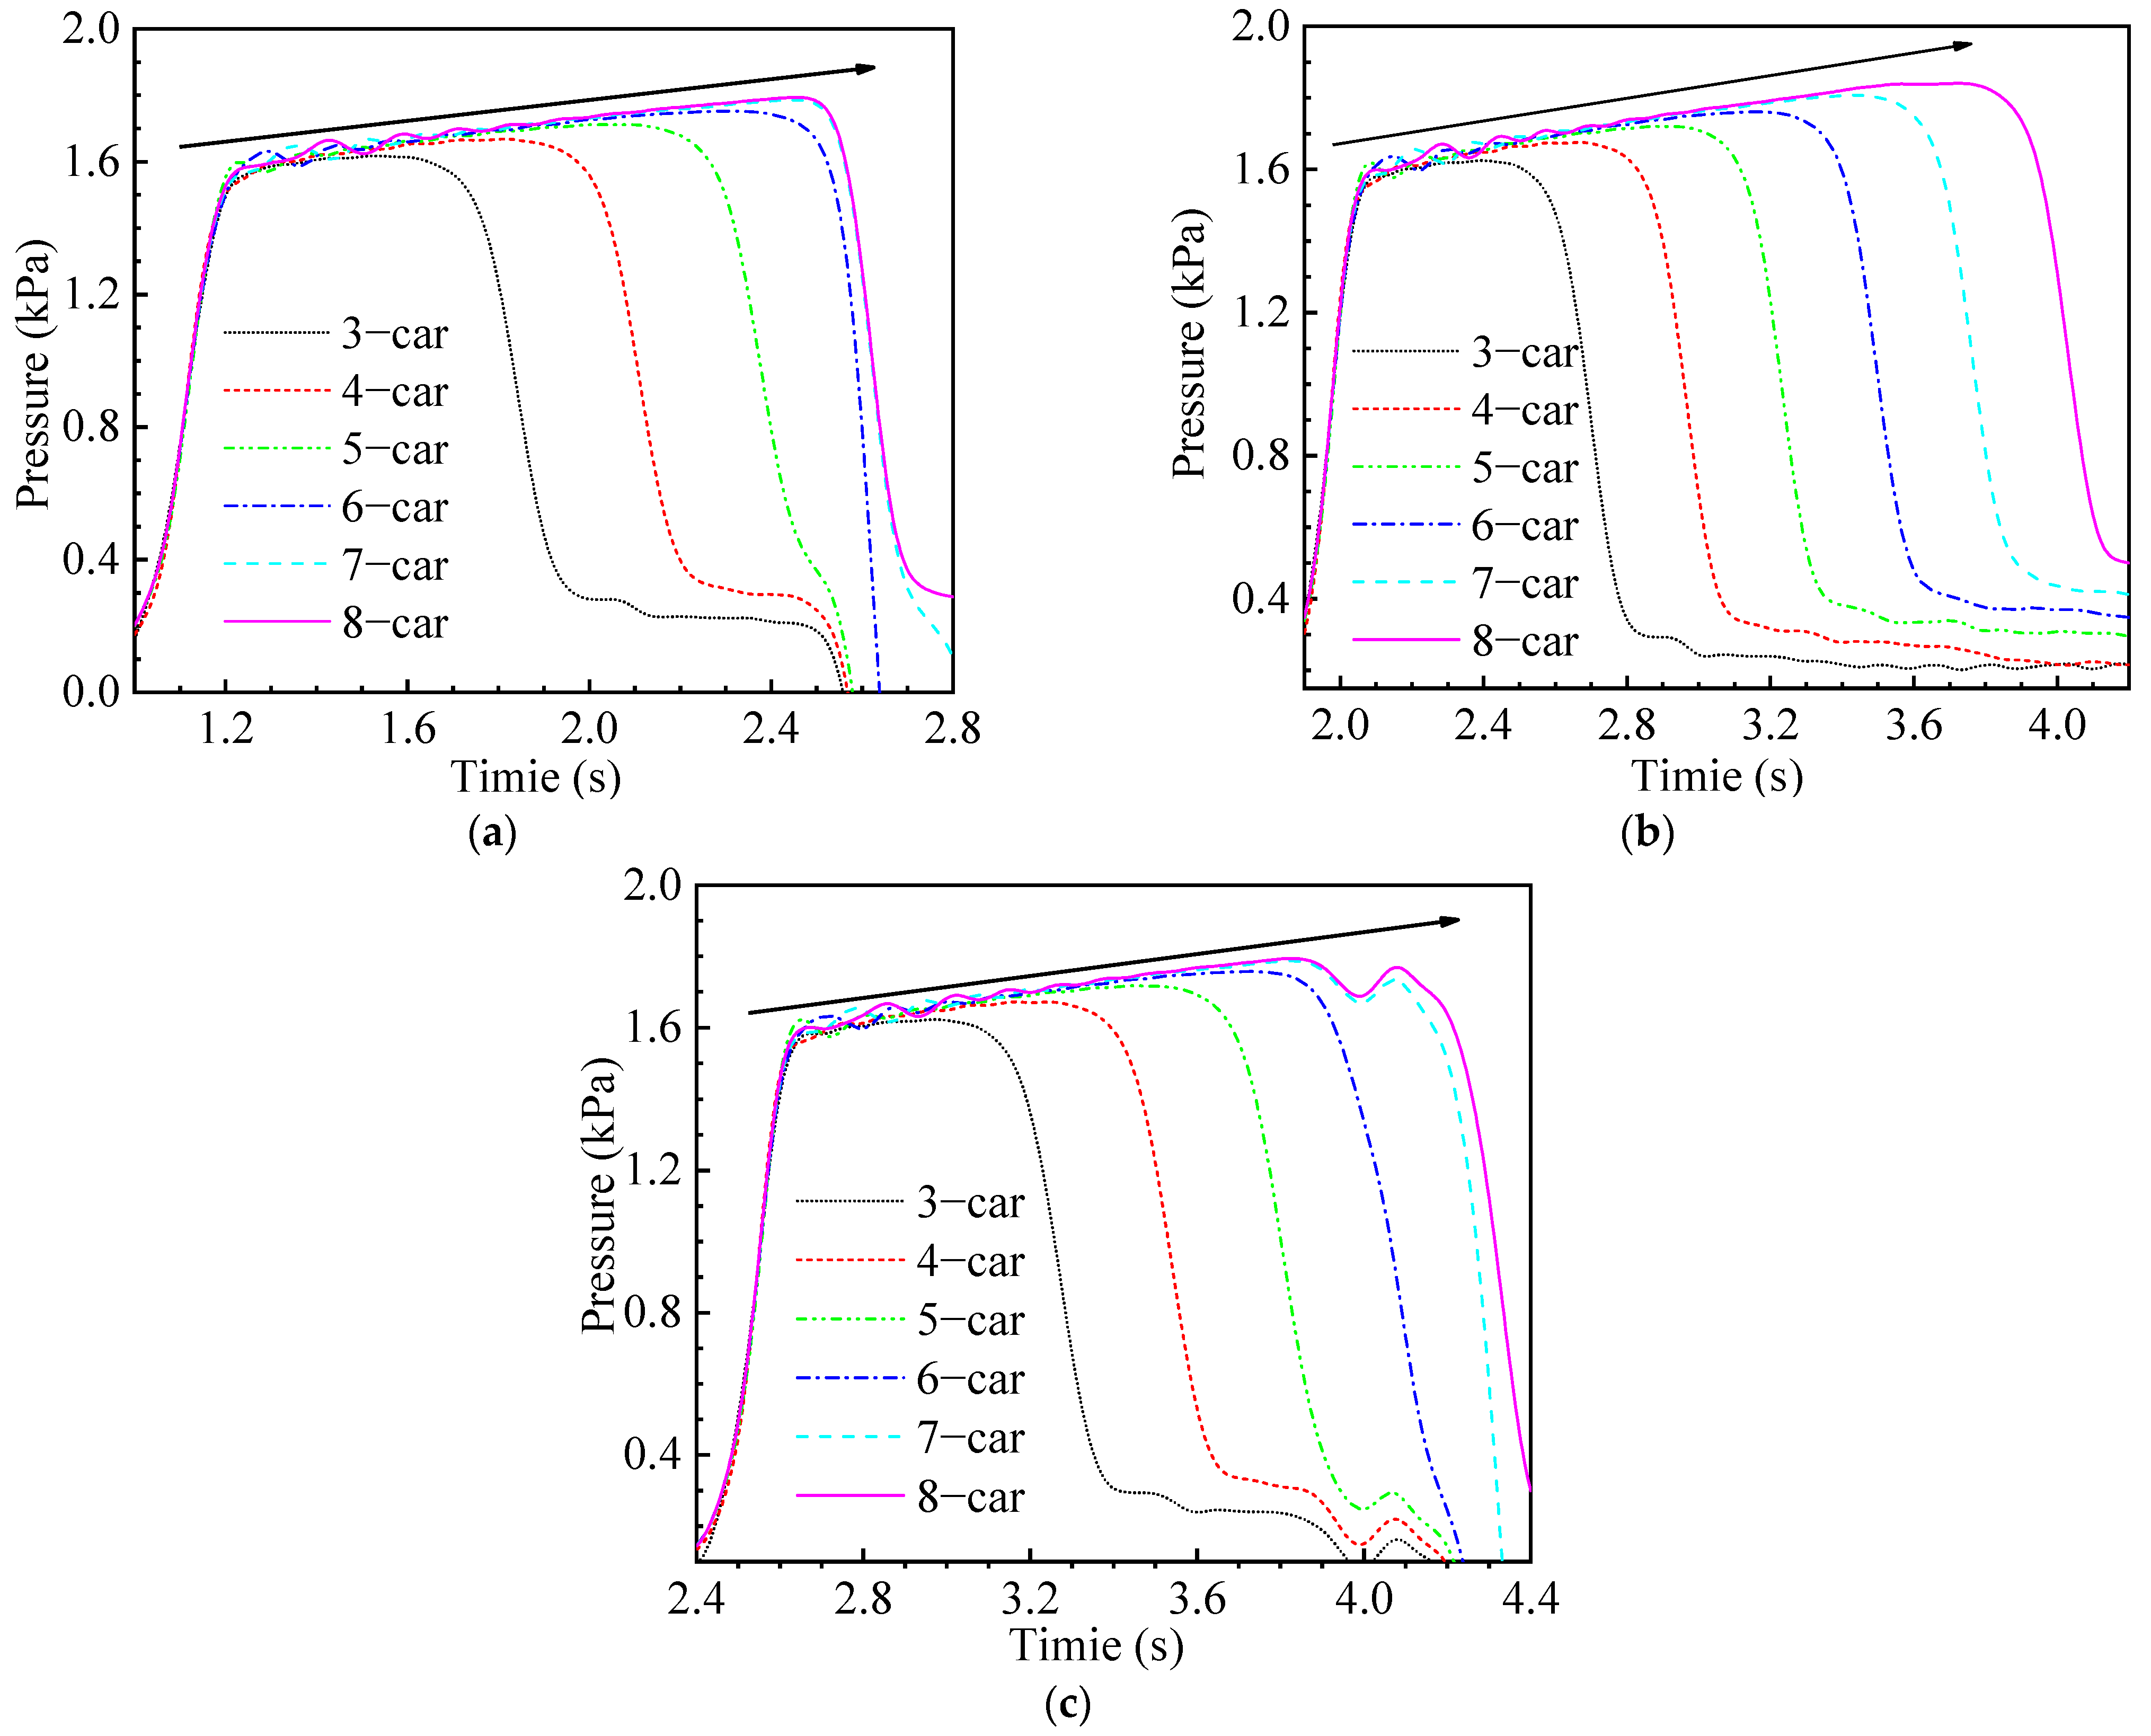
4.2. Initial Compression Wave
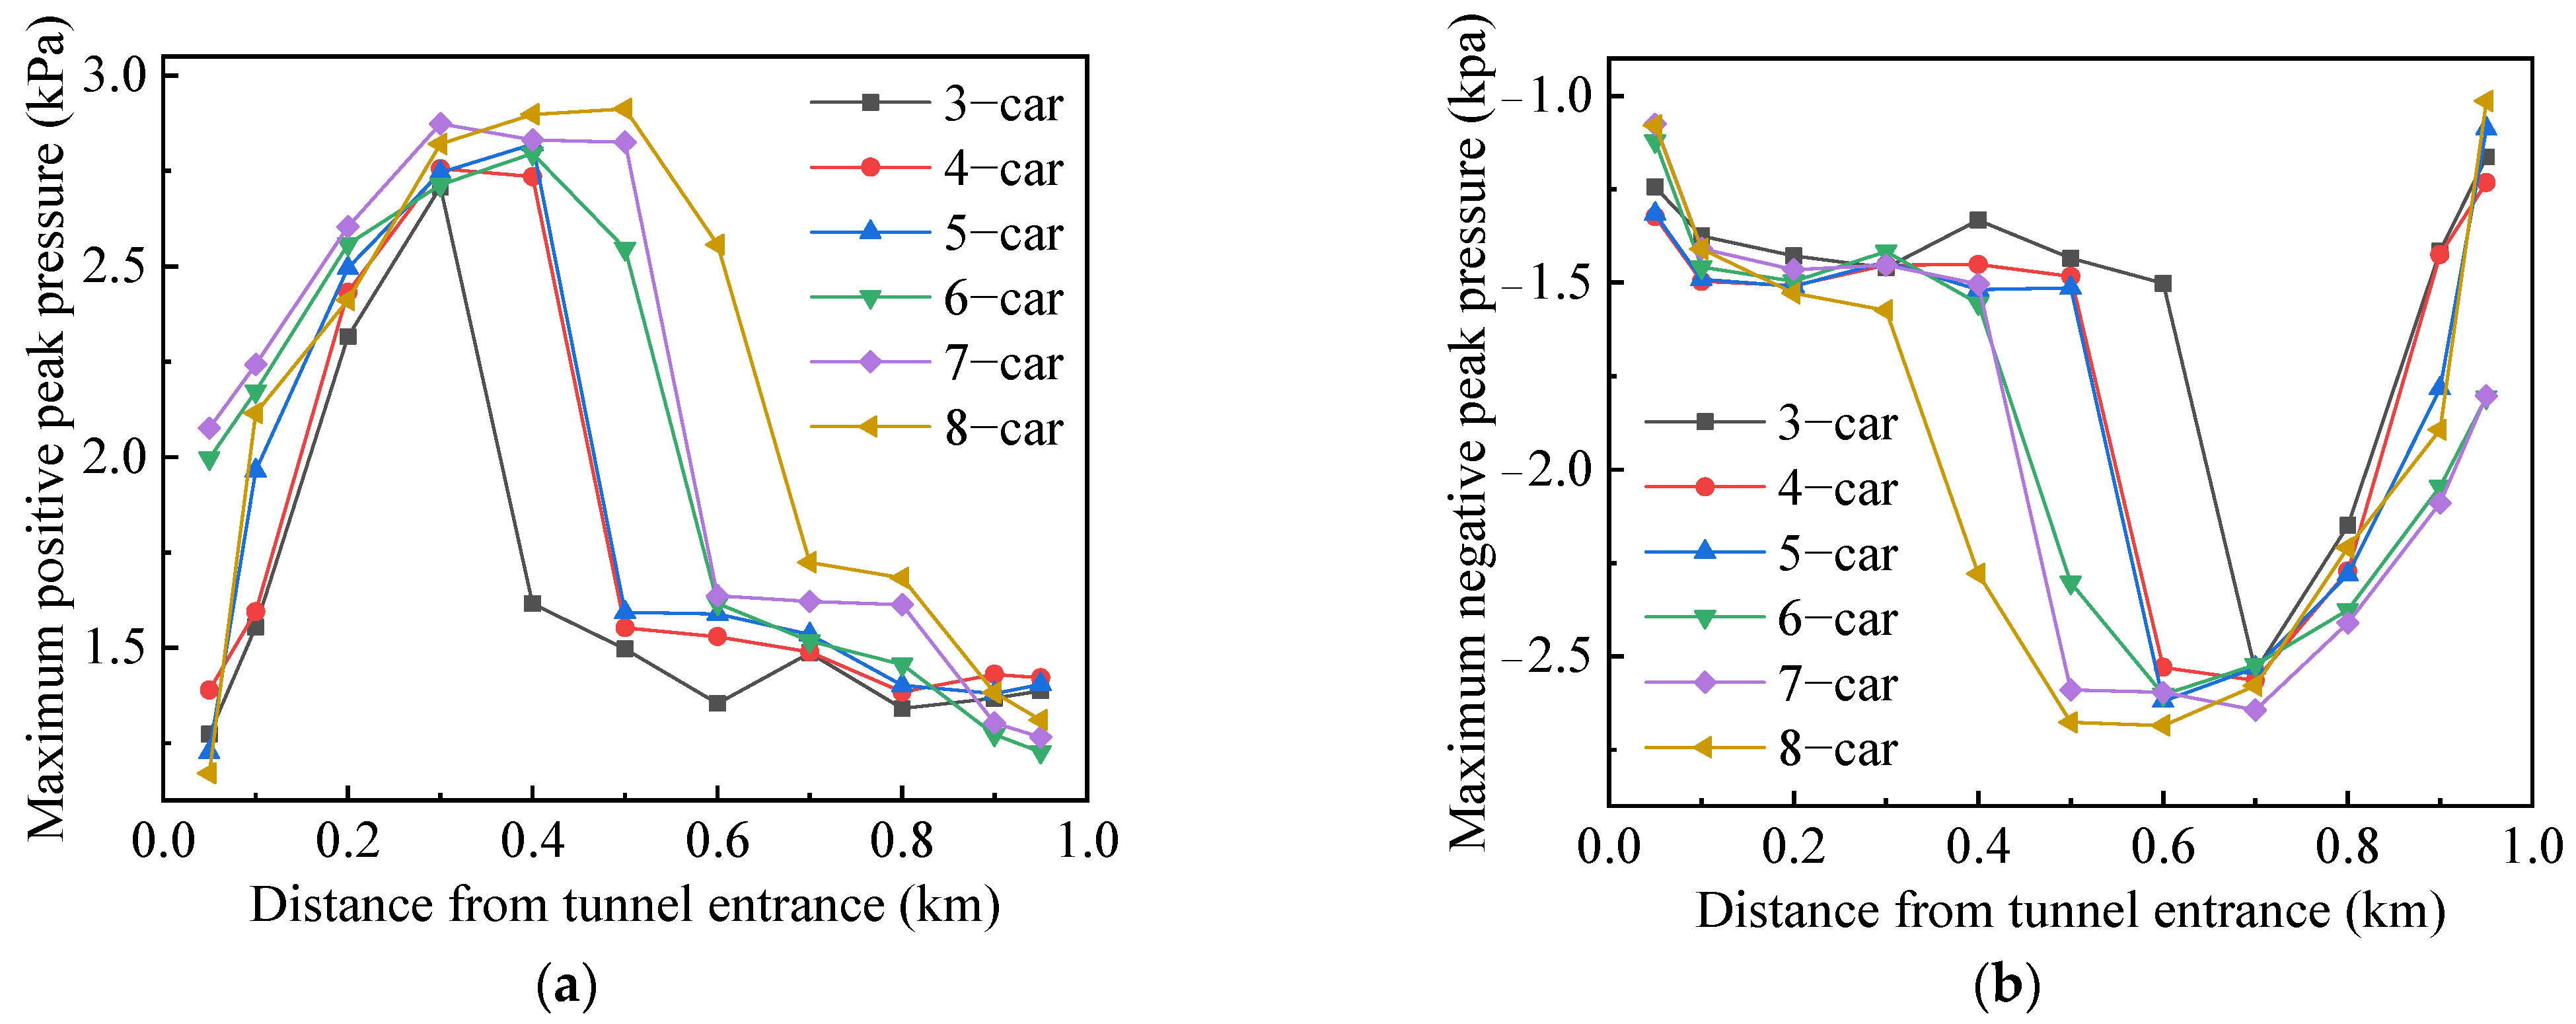
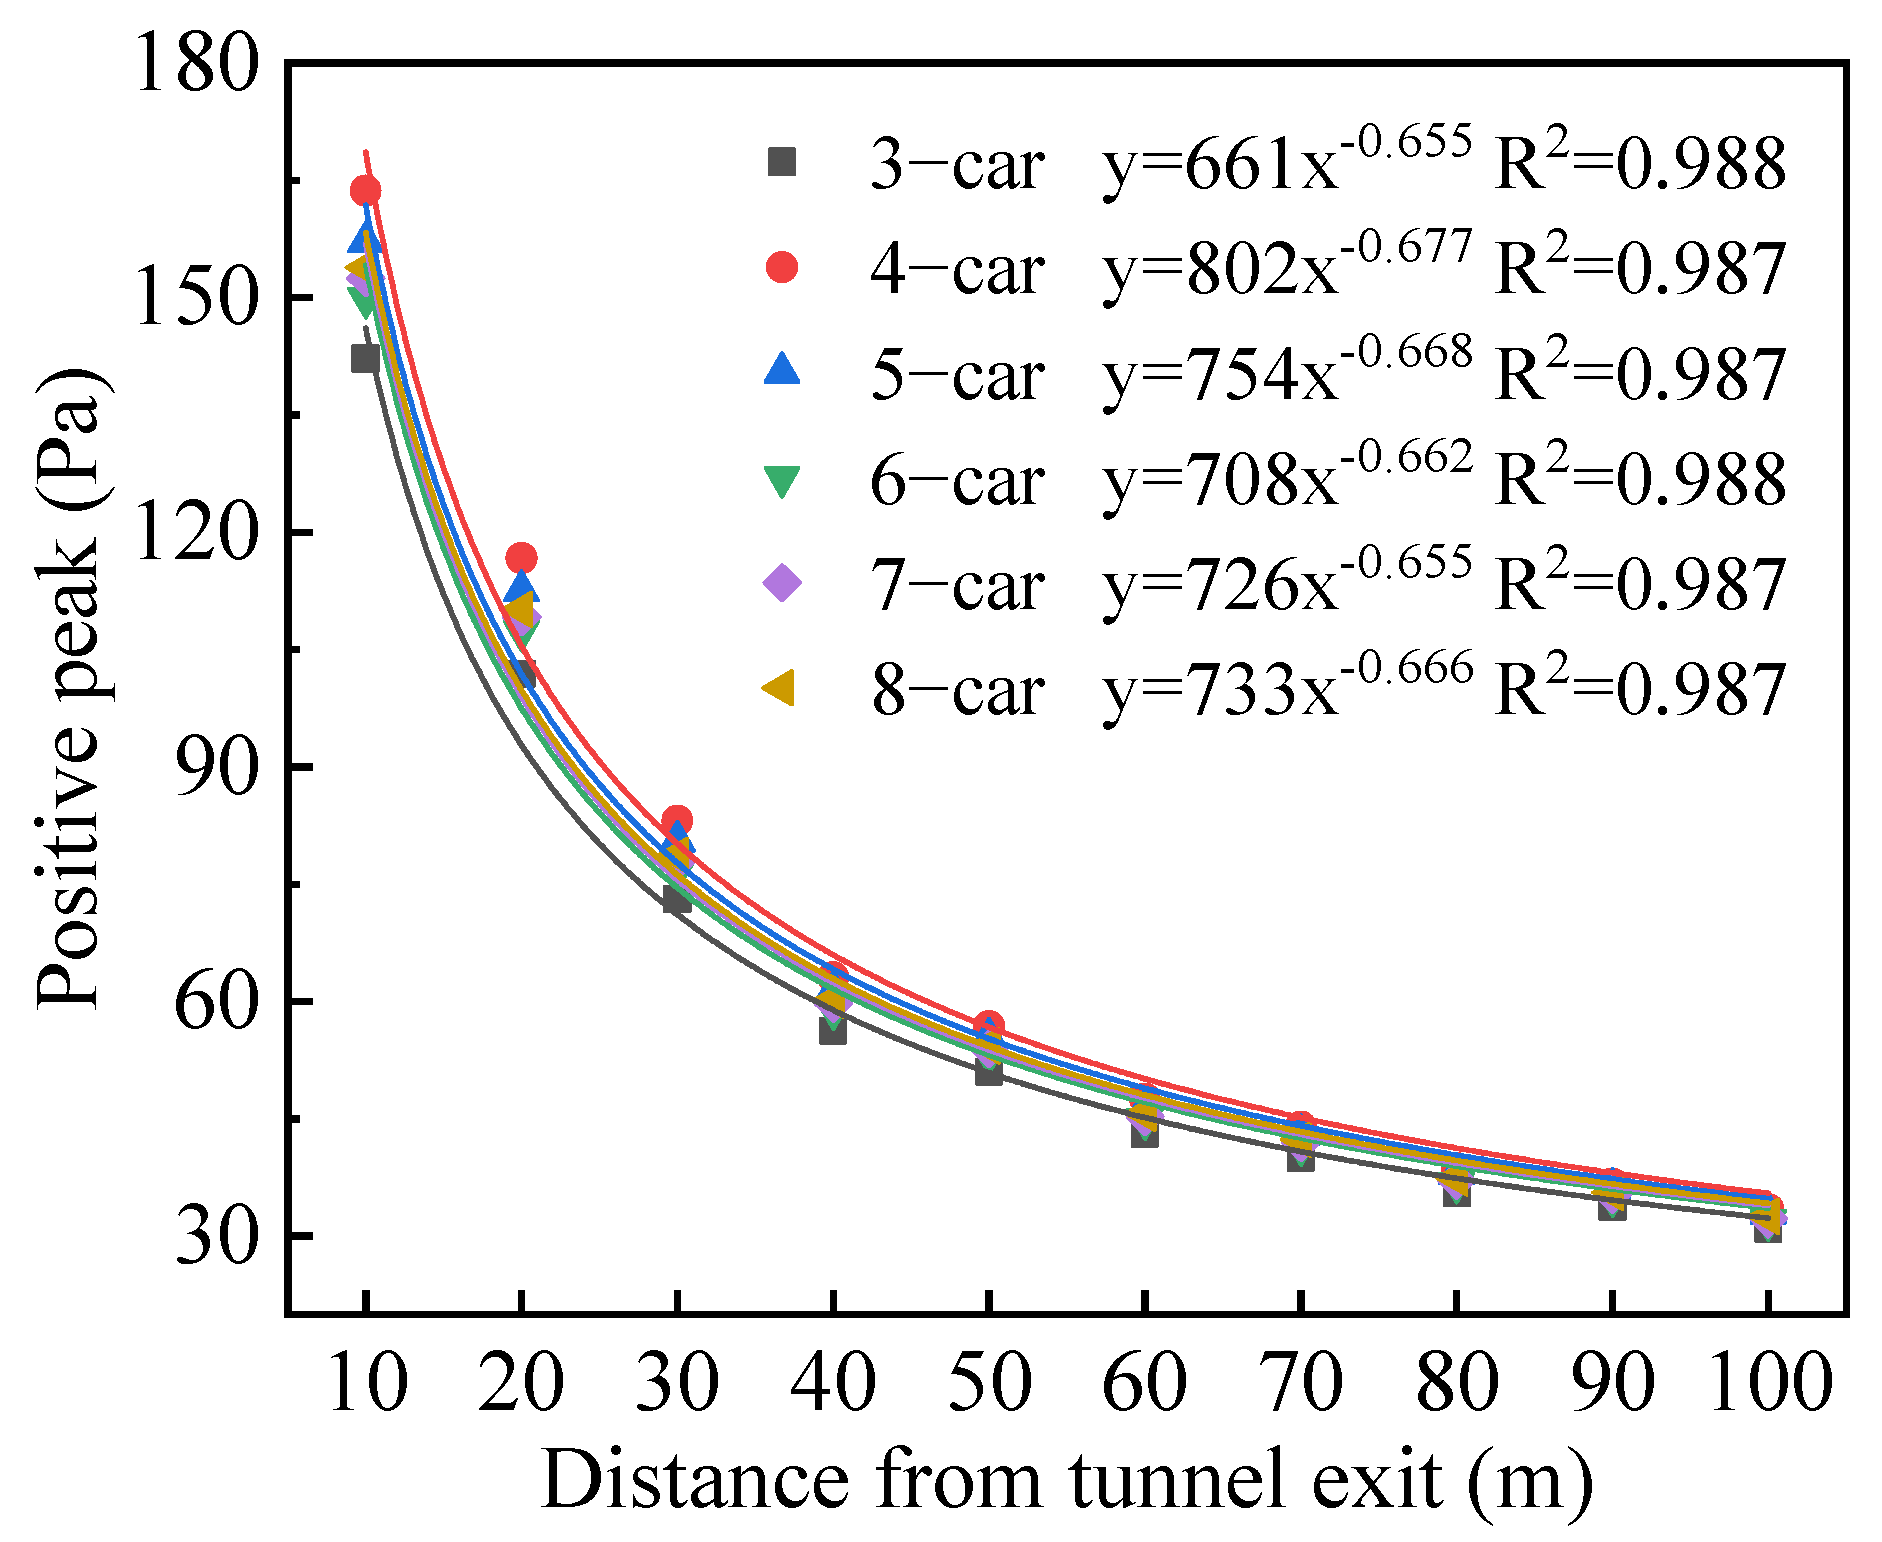
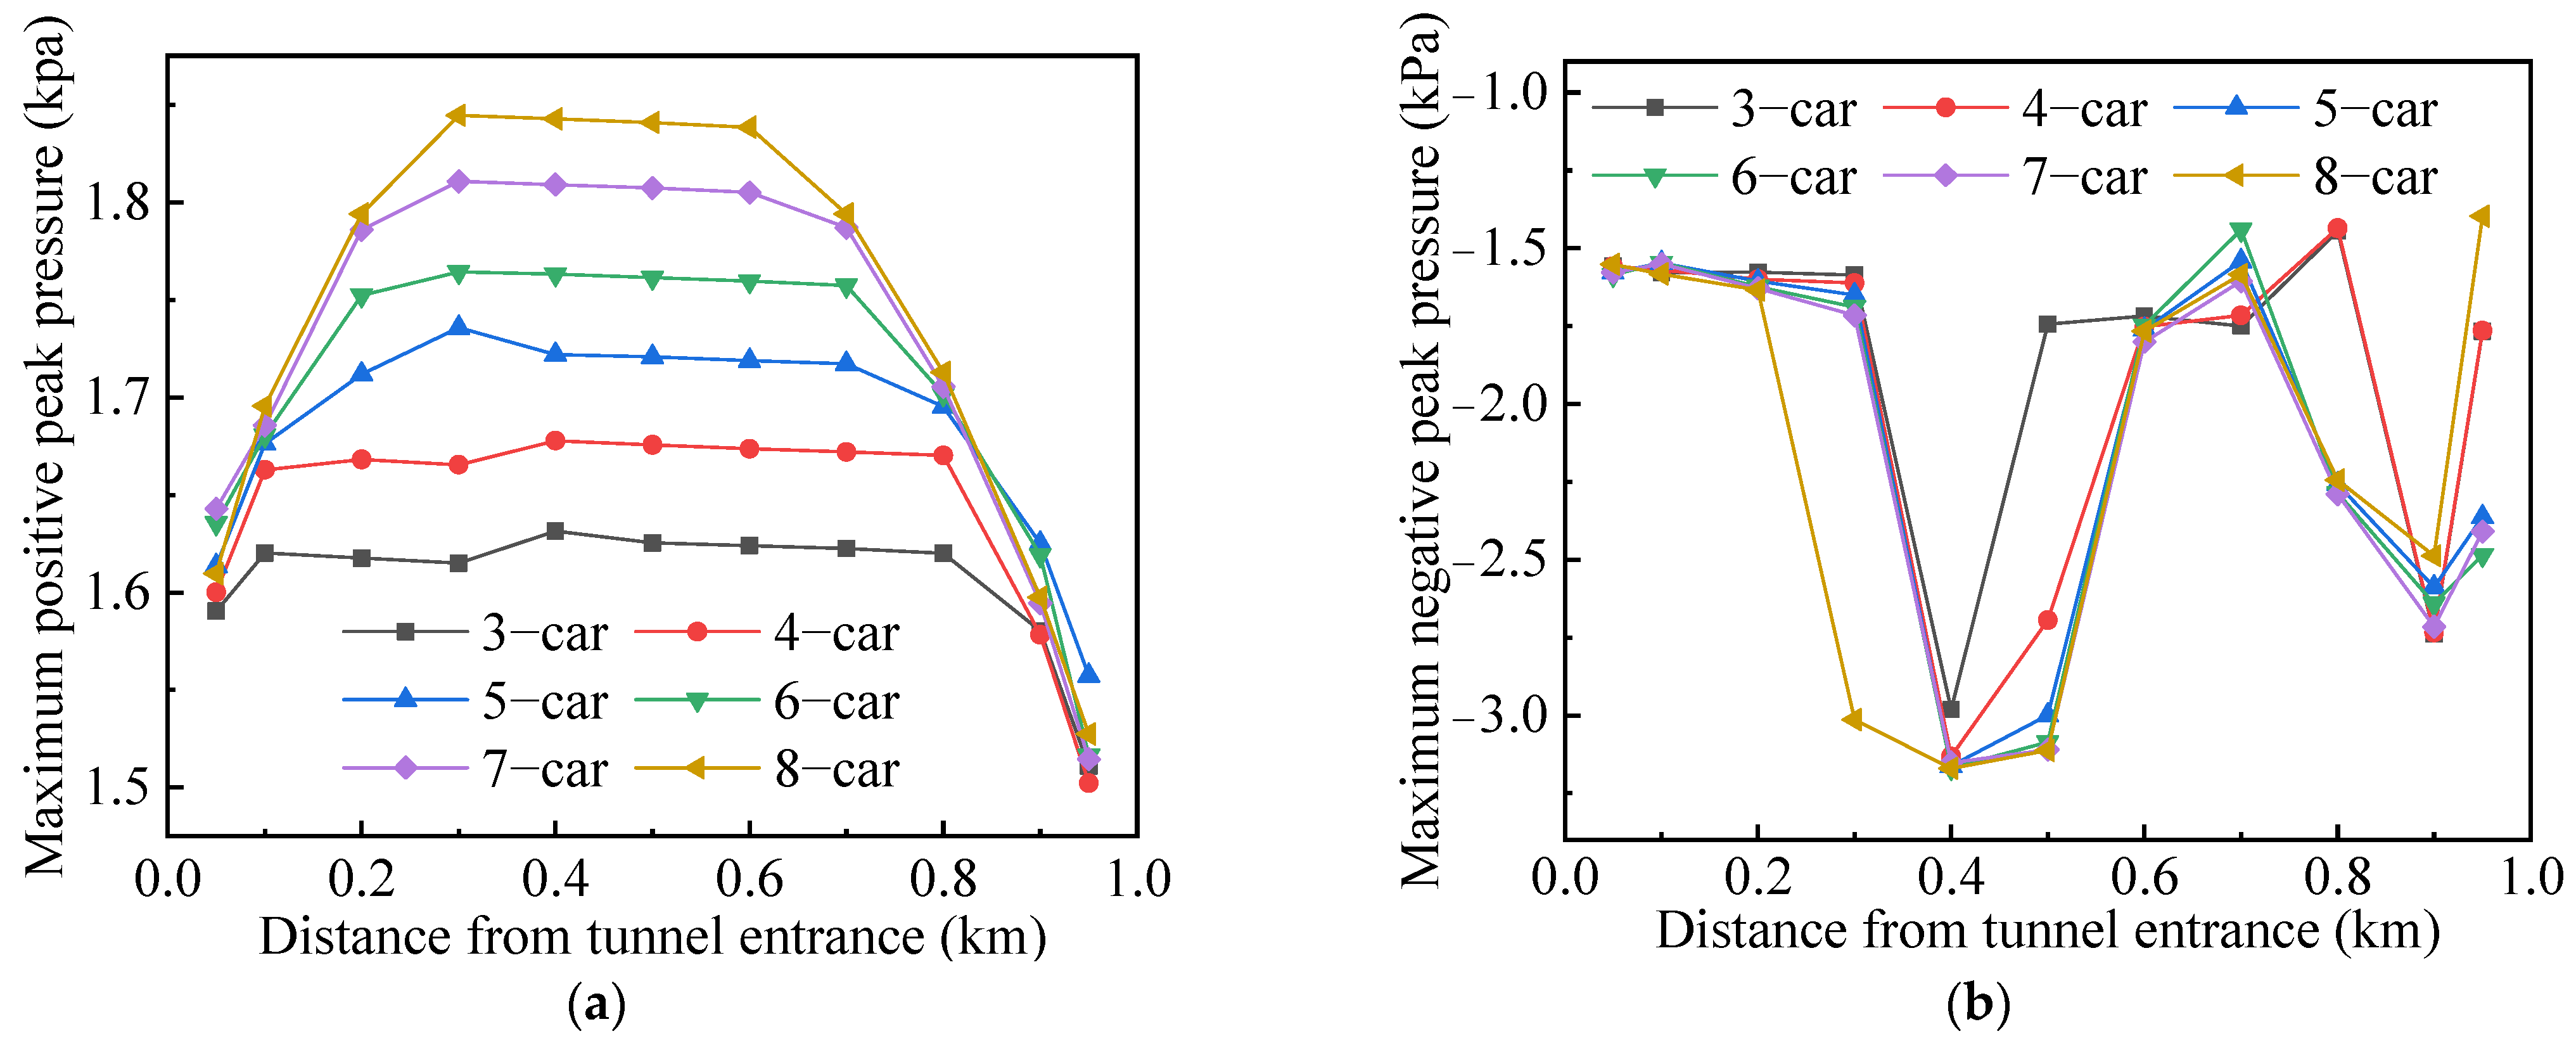
Figure 10 shows the evolution of the initial compression wave at three monitoring points with different car numbers. Table 3 shows the initial positive peak pressures and the time to reach the initial positive peak pressures at the same three monitoring points with different car numbers. The positive peak pressures of the initial compression wave increased with an increase in car number at all monitoring points. Compared with an eight-car train, the initial positive peak pressures of a three-car train at the monitoring points 3, 6, and 8 decreased by 9.8%, 11.7%, and 9.5%, respectively, and the initial positive peak pressures of a four-car train decreased by 7.0%, 9.0%, and 6.8%, respectively. When the car number increased to seven, the initial positive peak pressures at monitoring points 3, 6, and 8 decreased by only 0.45%, 1.85%, and 0.39%, respectively. The time to reach the initial positive peak pressure was delayed with an increase in car number at all three monitoring points. Compared with an eight-car train, the times to reach the initial positive peak pressure of a three-car train at the monitoring points 3, 6, and 8 were advanced by 37.8%, 35.8%, and 22.6%, respectively, while those for a four-car train were advanced by 26.2%, 28.2%, and 17.6%, respectively. When the car number increased to seven, the times to reach the initial positive peak pressure at the monitoring points 3, 6, and 8 were advanced by only 0.49%, 7.7%, and 0.16%, respectively.

4.3. Peak Pressure

4.3.1. Before Train Tail Leaves the Tunnel

Figure 11 shows the distributions of three typical peak pressures (maximum positive peak, negative peak, and peak-to-peak pressures) along the longitudinal axis of the tunnel before the train tail left the tunnel. The x-axis represents the location of the monitoring point along the longitudinal direction of the tunnel, and the y-axis represents the typical peak pressures of the tunnel lining, such as positive, negative, and peak-to-peak pressure. For the maximum positive peak pressure, the effects of car number on the peak pressures near the tunnel middle section were greater than those near the tunnel portals. The peak pressure of the tunnel middle section increased with the increase in car number, and the increases in the peak pressures were approximately equal. The peak pressures of three- and four-car trains at the tunnel middle section compared with those of an eight-car train decreased by 11.4% and 8.7%, respectively. For the maximum negative peak pressure, the effects of car number on the peak pressures were irregular. The effects of car number on the peak pressures near the tunnel entrance were negligible. The peak pressures of three- and four-car trains at the tunnel middle section compared with those of an eight-car train decreased by 44.1% and 13.5%, respectively. The effects of car number on the maximum peak-to-peak and negative peak pressures were consistent.

4.3.2. After the Train Tail Leaves the Tunnel

Figure 12 shows the distributions of three typical peak pressures along the tunnel’s longitudinal axis after train tail had left the tunnel. The x-axis represents the location of the monitoring point along the tunnel’s longitudinal direction, and the y-axis represents the typical peak pressures of the tunnel lining, such as positive, negative, and peak-to-peak pressure. The effects of car number on three typical peak pressures after the train tail had left the tunnel were more complex than those beforehand. For the maximum positive peak pressure, the effects of car number on the peak pressures near the tunnel entrance and the middle section were greater than those near the tunnel exit. The peak pressure at the tunnel middle section increased with an increase in car number. However, the increases in the peak pressures were not equal, which is in contrast to observations made before the train tail had left the tunnel. Compared with an eight-car train, the peak pressures of a three- and four-car train at the tunnel middle section decreased by 48.6% and 46.7%, respectively. For the maximum negative peaks, the effects of car number on the peak pressures near the tunnel exit and middle section were greater than those near the tunnel entrance. Compared with an eight-car train, the peak pressures of the three- and four-car trains at the tunnel middle section decreased by 46.4% and 46.6%, respectively. For the maximum peak-to-peak pressures, the effects of car number on the peak pressures near the tunnel middle section were greater than those near the tunnel entrance and exit. Compared with the eight-car train, the peak pressures of three- and four-car trains at the tunnel middle section decreased by 47.6% and 45.6%, respectively.

4.4. Micropressure Waves
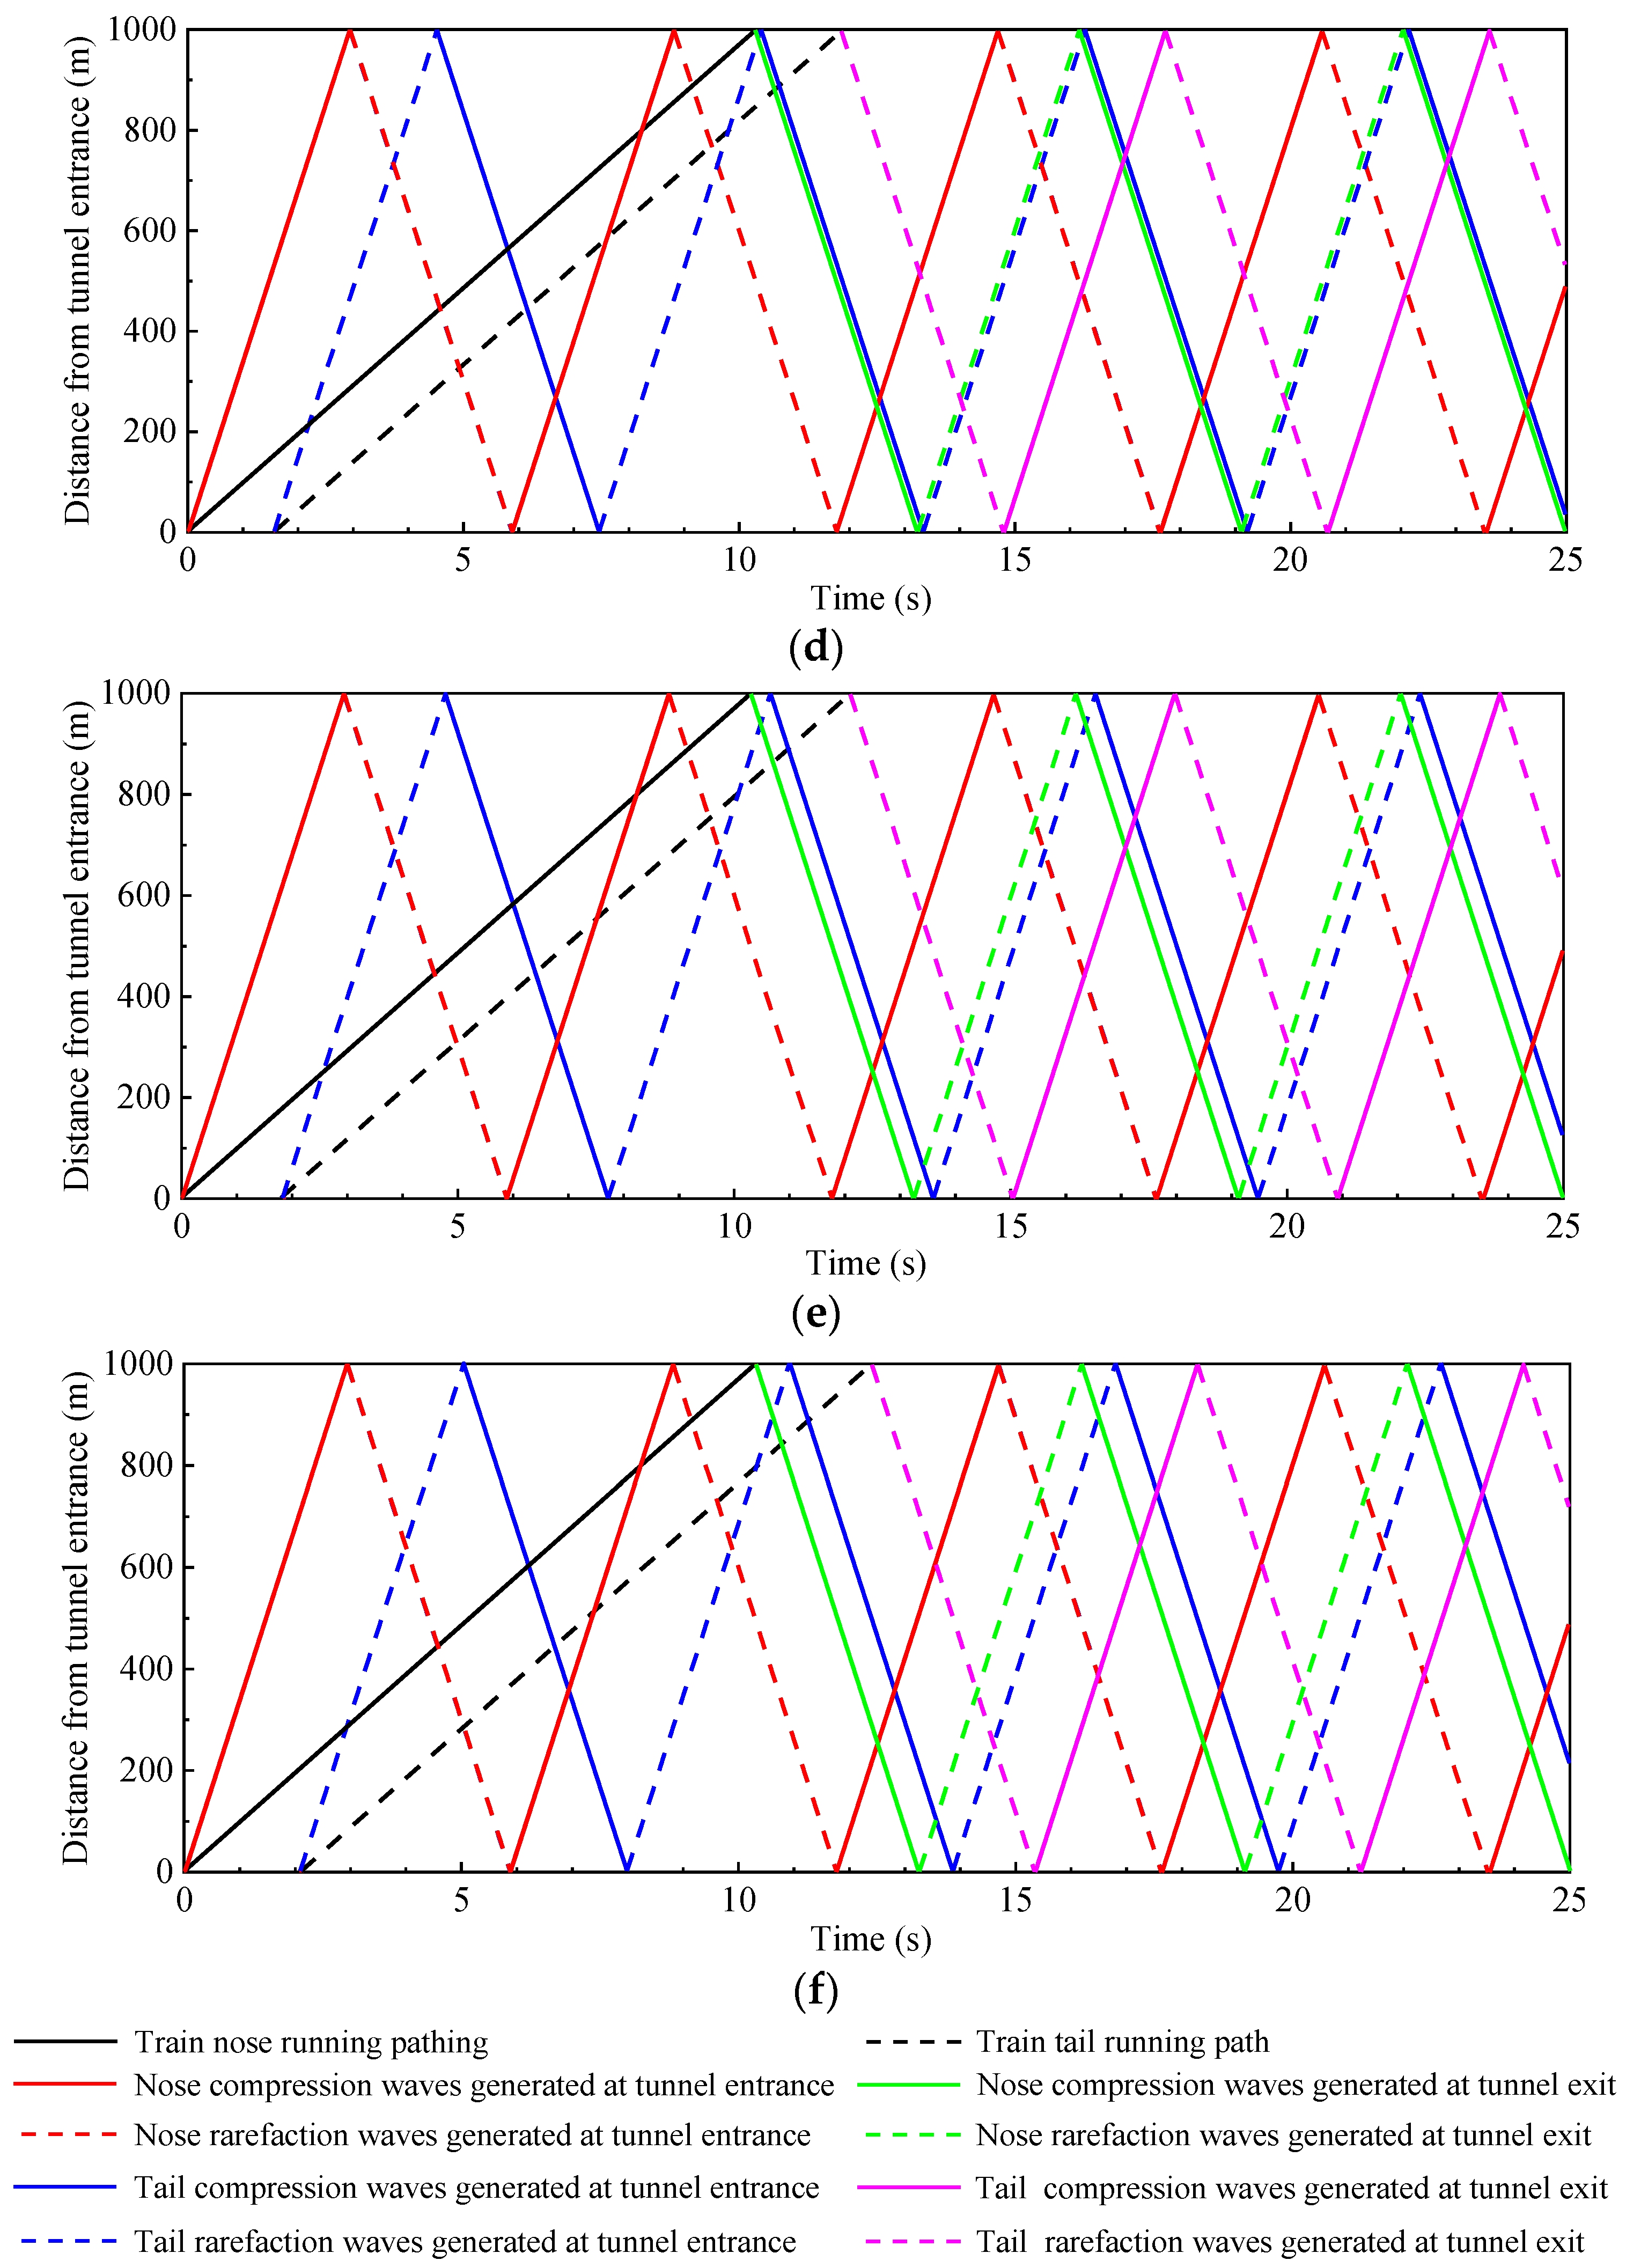
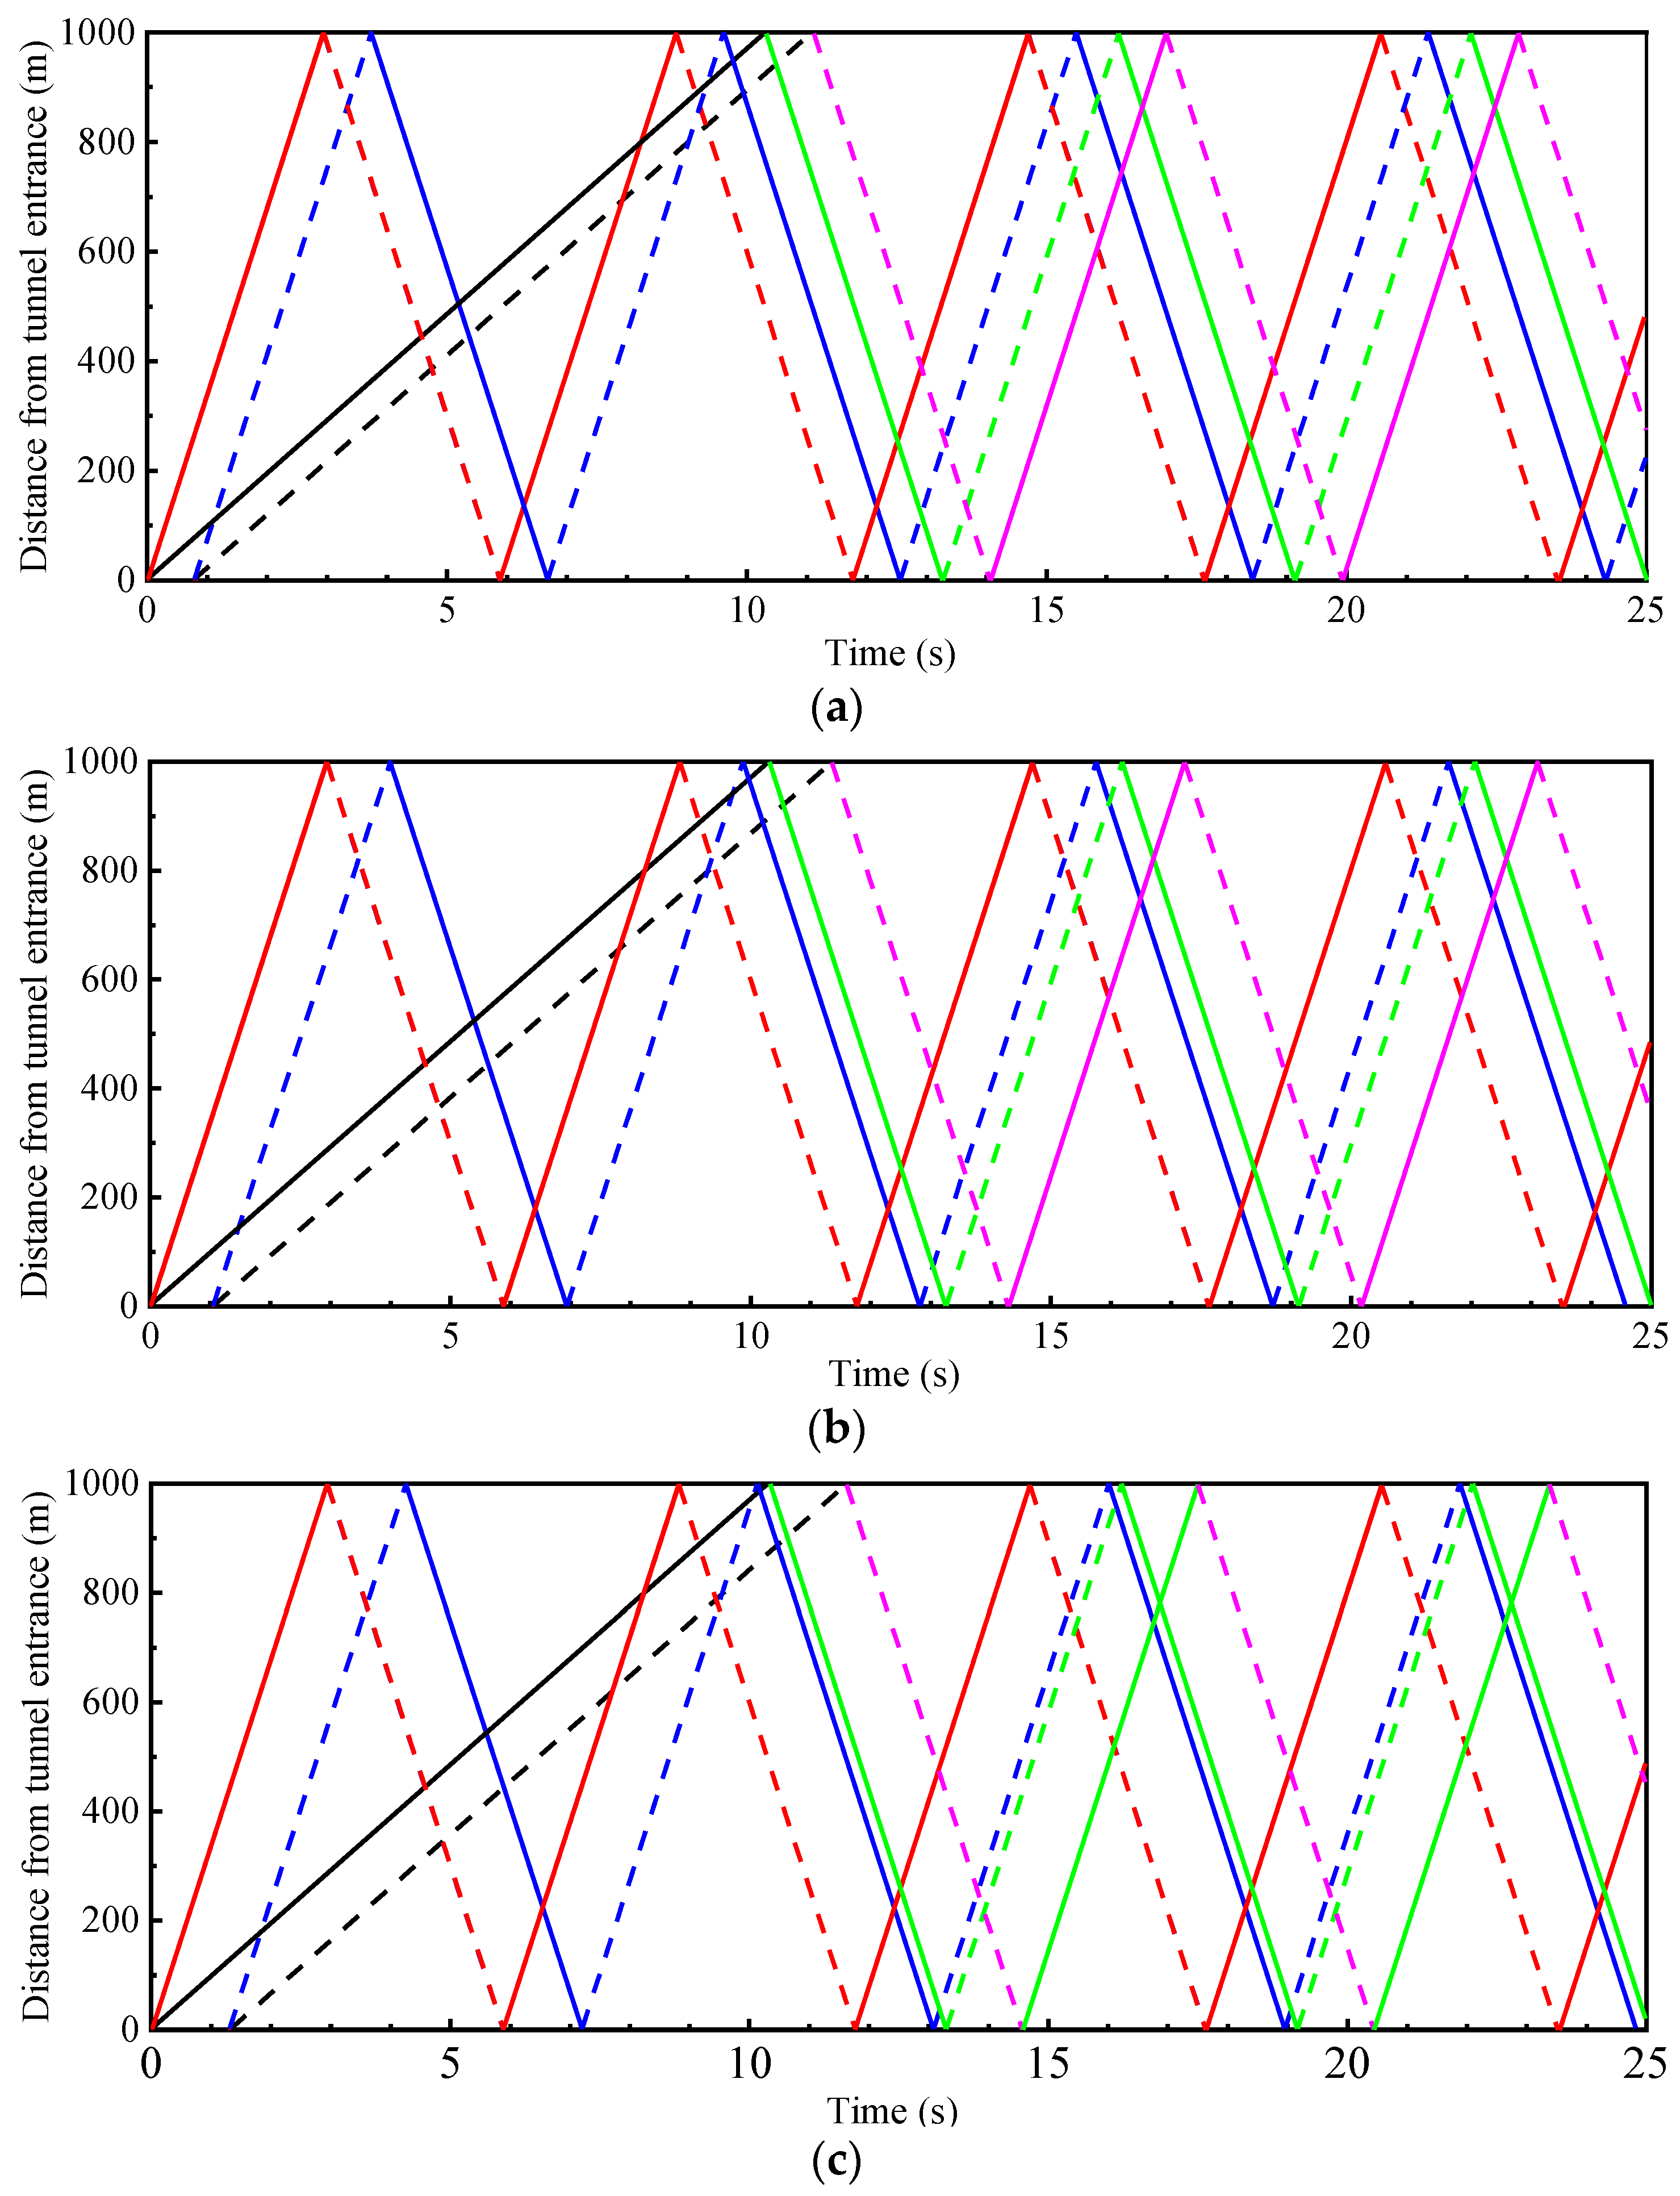
Figure 13 shows the evolution of the micropressure wave for different car numbers at different locations. The times to reach the initial positive peak micropressure wave with different car numbers at different locations are almost the same. However, the times to reach the initial negative peak pressures are periodically delayed. The delay period can be defined as T = loc/v (loc: single train carriage length, v: train speed). The differences in the initial peak pressures (positive and negative peak pressures) between three- and eight-car trains recorded at monitoring point I are 7.6% and 2.6%, respectively.
Figure 14 shows the evolution of micropressure waves at different locations with three- and eight-car trains. The initial positive and negative peak pressures decrease with an increase of the distance outside the tunnel exit.
Figure 15 shows the initial positive peak pressures of the micropressure waves at different locations outside the tunnel exit with different car numbers, and the corresponding fitting curves. The initial positive peak pressures of the micropressure waves exponentially decrease with an increase in the distance from the tunnel exit. The adjusted coefficients of determination (R2) for different car numbers are larger than 0.98. This phenomenon was observed in the results of Liu’s study [13]. It was also observed that the attenuation trend of initial positive peak pressures with the distance outside the tunnel exit was not influenced by car number.

4.5. Wave Diagram

The wave diagrams for different car numbers are shown in Figure 16 for a single high-speed train traveling through a 1000-m-long tunnel at a speed of 350 km/h. The black solid and dotted lines denote the running path of the train nose and tail, respectively. The colored solid and dotted lines denote the compression and rarefaction waves, respectively. The first red and green solid lines denote the initial compression wave induced by the train nose at the tunnel entrance and exit, respectively. The first blue and magenta dotted lines denote the initial rarefaction wave induced by the train tail at the tunnel entrance and exit, respectively. The subsequent colored solid and dotted lines denote the reflected waves from the tunnel portals.
As the running path of the train nose for trains with different numbers of cars is identical, the propagating paths of the initial compression wave and subsequent reflected waves induced by the train nose at the tunnel entrance and exit are coincident. As a result, the aerodynamic pressures experienced by the tunnel lining and micropressure waves which occur at the tunnel portals with different car numbers start to increase at almost the same time. With an increase in car number from three to eight, the time required for the train tail to enter the tunnel increases, and the running path of train tail is shifted backward. As a result, the propagating paths of the initial rarefaction wave and the subsequent reflected waves induced by the train tail at the tunnel entrance and exit are also shifted back overall. Therefore, the time to reach the initial negative peak values of the aerodynamic pressures experienced by the tunnel lining and the micropressure waves which occur at the tunnel portals presents a delayed trend.
Once the train tail leaves the tunnel, the pressure field inside the tunnel becomes more complex due to the reflected pressure waves produced by the train nose and tail at the tunnel exit. For different car numbers, the pressure field presents a significant difference due to the different generation times at which the rarefaction waves are produced by the train nose at the tunnel entrance and exit. As a result, the superimposed effect of pressure waves is different due to the difference in the time when the pressure waves arrive at the monitoring point. Therefore, the effects of car number on the aerodynamic pressures after the train tail leaves the tunnel are more complex than those while the train is still inside the tunnel.

5. Conclusions

To further explore the influence of car number on the aerodynamic effect induced by a high-speed train passing through a tunnel, a series of three-dimensional numerical simulations were performed based on the RNG k-e turbulent model. The rationality of the model parameters used in this numerical method was verified by comparing the results from the numerical simulation with those from field monitoring. The influence of car number on the aerodynamic pressure of the tunnel lining and the micropressure waves which occur at the tunnel portals was investigated in detail. The main results are as follows:
(1) With an increase in car number, the positive peak pressure value of the initial compression waves increases, and the time to reach the initial positive peak pressure is delayed. Compared with an eight-car model, the initial positive peak pressure of a three-car model at the tunnel mid-section decreases by 9.0%, and the time to reach the initial positive peak pressure is advanced by 35.8%.
(2) The effects of car number on three typical peak pressures (positive peak, negative peak, and peak-to-peak pressures) after the train tail leaves the tunnel are more complex than those before train leaves the tunnel. Compared with an eight-car model, the three typical peak pressures of a three-car model at the tunnel middle section decrease by 11.4%, 44.1%, and 32.0% before train tail leaves the tunnel, and decrease by 48.6%, 46.4%, and 47.6% after train tail leaves the tunnel.
(3) The time to reach the initial negative peak pressures of the micropressure wave is periodically delayed; the delay period can be defined as T = loc/v (loc: single train carriage length, v: train speed). The effects of car number on the initial peak pressures (positive and negative peak pressures) of the micropressure wave are limited. The differences in the initial peak pressures between a three- and an eight-car train recorded at monitoring point I are 7.6% and 2.6%, respectively.
(4) Research results regarding the aerodynamic pressure and the micropressure waves resulting from the use of a three- or four-car train instead of an eight-car train should be treated with caution. The influence of car number on the aerodynamic pressure and micropressure waves was studied only by numerical simulation. Other research methods, such as moving model tests and field monitoring, should be applied in the future. Moreover, the influence of car number on the flow field inside the tunnel and the aerodynamic pressure of the car body surface should also be explored in detail.

Author Contributions

Conceptualization, J.-M.D.; software, J.-M.D.; funding acquisition, Q.F.; supervision, Q.F.; formal analysis, G.W.; writing—original draft, J.W.; writing—review and editing, J.-Y.L. All authors have read and agreed to the published version of the manuscript.

Funding

This research was funded by the Key Project of High-speed Rail Joint Fund of National Natural Science Foundation of China grant number U1934210, and the Natural Science Foundation of Beijing, China grant number 8202037.

Data Availability Statement

Data are contained within this article.

Acknowledgments

The authors thank the reviewers for their great help on the article during its review progress.

Conflicts of Interest

The authors declared that there is no conflict of interest.

References

  1. Baker, C.J. A review of train aerodynamics Part 1—Fundamentals. Aeronaut. J. 2014, 118, 201–228. [Google Scholar] [CrossRef]
  2. Saito, S.; Fukuda, T. Design of a tunnel entrance hood for high-speed trains. J. Wind Eng. Ind. Aerodyn. 2020, 206, 104375. [Google Scholar] [CrossRef]
  3. Li, W.-H.; Liu, T.-H.; Huo, X.-S.; Chen, Z.-W.; Guo, Z.-J.; Li, L. Influence of the enlarged portal length on pressure waves in railway tunnels with cross-section expansion. J. Wind Eng. Ind. Aerodyn. 2019, 190, 10–22. [Google Scholar] [CrossRef]
  4. Du, J.-M.; Fang, Q.; Wang, G.; Zhang, D.-L.; Chen, T.-L. Fatigue damage and residual life of secondary lining of high-speed railway tunnel under aerodynamic pressure wave. Tunn. Undergr. Space Technol. 2021, 111, 103851. [Google Scholar] [CrossRef]
  5. Li, X.-H.; Deng, J.; Chen, D.-W.; Xie, F.-F.; Zheng, Y. Unsteady simulation for a high-speed train entering a tunnel. J. Zhejiang Univ. A 2011, 12, 957–963. [Google Scholar] [CrossRef]
  6. Liu, F.; Yao, S.; Zhang, J.; Wang, Y.-Q. Field measurements of aerodynamic pressures in high-speed railway tunnels. Tunn. Undergr. Space Technol. 2018, 72, 97–106. [Google Scholar] [CrossRef]
  7. Miyachi, T. Acoustic model of micro-pressure wave emission from a high-speed train tunnel. J. Sound Vib. 2017, 391, 127–152. [Google Scholar] [CrossRef]
  8. Zhang, L.; Yang, M.-Z.; Niu, J.-Q.; Liang, X.-F.; Zhang, J. Moving model tests on transient pressure and micro-pressure wave distribution induced by train passing through tunnel. J. Wind Eng. Ind. Aerodyn. 2019, 191, 1–21. [Google Scholar] [CrossRef]
  9. Howe, M. Mach number dependence of the compression wave generated by a high-speed train entering a tunnel. J. Sound Vib. 1998, 212, 23–36. [Google Scholar] [CrossRef]
  10. Murray, P.; Howe, M. Influence of hood geometry on the compression wave generated by a high-speed train. J. Sound Vib. 2010, 329, 2915–2927. [Google Scholar] [CrossRef]
  11. Miyachi, T. Non-linear acoustic analysis of the pressure rise of the compression wave generated by a train entering a tunnel. J. Sound Vib. 2019, 458, 365–375. [Google Scholar] [CrossRef]
  12. Ko, Y.-Y.; Chen, C.-H.; Hoe, I.-T.; Wang, S.-T. Field measurements of aerodynamic pressures in tunnels induced by high speed trains. J. Wind Eng. Ind. Aerodyn. 2012, 100, 19–29. [Google Scholar] [CrossRef]
  13. Liu, T.-X.; Jiang, Z.-H.; Chen, X.-D.; Zhang, J.; Liang, X.-F. Wave effects in a realistic tunnel induced by the passage of high-speed trains. Tunn. Undergr. Space Technol. 2019, 86, 224–235. [Google Scholar] [CrossRef]
  14. Yang, Q.-S.; Song, J.-H.; Yang, G.-W. A moving model rig with a scale ratio of 1/8 for high speed train aerodynamics. J. Wind Eng. Ind. Aerodyn. 2016, 152, 50–58. [Google Scholar] [CrossRef] [Green Version]
  15. Song, J.-H.; Guo, D.-L.; Yang, G.-W.; Yang, Q.-S. Experimental investigation on the aerodynamics of tunnel-passing for high-speed train with a moving model rig. J. Exp. Fluid Mech. 2017, 31, 39–45. (In Chinese) [Google Scholar] [CrossRef]
  16. Zhang, L.; Thurow, K.; Stoll, N.; Liu, H. Influence of the geometry of equal-transect oblique tunnel portal on compression wave and micro-pressure wave generated by high-speed trains entering tunnels. J. Wind Eng. Ind. Aerodyn. 2018, 178, 1–17. [Google Scholar] [CrossRef]
  17. Chu, C.-R.; Chien, S.-Y.; Wang, C.-Y.; Wu, T.-R. Numerical simulation of two trains intersecting in a tunnel. Tunn. Undergr. Space Technol. 2014, 42, 161–174. [Google Scholar] [CrossRef]
  18. Wang, S.; Bell, J.; Burton, D.; Herbst, A.H.; Sheridan, J.; Thompson, M.C. The performance of different turbulence models (URANS, SAS and DES) for predicting high-speed train slipstream. J. Wind Eng. Ind. Aerodyn. 2017, 165, 46–57. [Google Scholar] [CrossRef]
  19. Lu, Y.-B.; Wang, T.-T.; Yang, M.-Z.; Qian, B. The influence of reduced cross-section on pressure transients from high-speed trains intersecting in a tunnel. J. Wind Eng. Ind. Aerodyn. 2020, 201, 104161. [Google Scholar] [CrossRef]
  20. Niu, J.-Q.; Zhou, D.; Liang, X.-F.; Liu, S.; Liu, T.-H. Numerical simulation of the Reynolds number effect on the aerodynamic pressure in tunnels. J. Wind Eng. Ind. Aerodyn. 2018, 173, 187–198. [Google Scholar] [CrossRef]
  21. Niu, J.-Q.; Zhou, D.; Liu, F.; Yuan, Y. Effect of train length on fluctuating aerodynamic pressure wave in tunnels and method for determining the amplitude of pressure wave on trains. Tunn. Undergr. Space Technol. 2018, 80, 277–289. [Google Scholar] [CrossRef]
  22. Deng, E.; Yang, W.-C.; He, X.-H.; Ye, Y.-C.; Zhu, Z.-H.; Wang, A. Transient aerodynamic performance of high-speed trains when passing through an infrastructure consisting of tunnel–bridge–tunnel under crosswind. Tunn. Undergr. Space Technol. 2020, 102, 103440. [Google Scholar] [CrossRef]
  23. Dong, T.-H.; Minelli, G.; Wang, J.-B.; Liang, X.-F.; Krajnović, S. The effect of reducing the underbody clearance on the aerodynamics of a high-speed train. J. Wind Eng. Ind. Aerodyn. 2020, 204, 104249. [Google Scholar] [CrossRef]
  24. Chen, X.-D.; Liu, T.-H.; Zhou, X.-S.; Li, W.-H.; Xie, T.-Z.; Chen, Z.-W. Analysis of the aerodynamic effects of different nose lengths on two trains intersecting in a tunnel at 350 km/h. Tunn. Undergr. Space Technol. 2017, 66, 77–90. [Google Scholar] [CrossRef]
  25. Du, J.-M.; Fang, Q.; Wang, J.; Wang, G. Influences of High-Speed Train Speed on Tunnel Aerodynamic Pressures. Appl. Sci. 2022, 12, 303. [Google Scholar] [CrossRef]
  26. Fang, Q.; Du, J.-M.; Li, J.-Y.; Zhang, D.-L.; Cao, L.-Q. Settlement characteristics of large-diameter shield excavation below existing subway in close vicinity. J. Central South Univ. 2021, 28, 882–897. [Google Scholar] [CrossRef]
  27. Jiang, Z.-H.; Liu, T.-H.; Chen, X.-D.; Li, W.-H.; Guo, Z.-J.; Niu, J.Q. Numerical prediction of the slipstream caused by the trains with different marshalling forms entering a tunnel. J. Wind Eng. Ind. Aerodyn. 2019, 189, 276–288. [Google Scholar] [CrossRef]
  28. Fang, Q.; Wang, G.; Yu, F.-C.; Du, J.-M. Analytical algorithm for longitudinal deformation profile of a deep tunnel. J. Rock Mech. Geotech. Eng. 2021, 13, 845–854. [Google Scholar] [CrossRef]
  29. Guo, D.-L.; Shang, K.-M.; Zhang, Y.; Yang, G.-W.; Sun, Z.-X. Influences of affiliated components and train length on the train wind. Acta Mech. Sin. 2016, 32, 191–205. [Google Scholar] [CrossRef] [Green Version]
  30. Zhou, M.-Z.; Fang, Q.; Peng, C. A mortar segment-to-segment contact method for stabilized total-Lagrangian smoothed particle hydrodynamics. Appl. Math. Model. 2022, in press. [Google Scholar] [CrossRef]
  31. Rabani, M.; Faghih, A.K. Numerical analysis of airflow around a passenger train entering the tunnel. Tunn. Undergr. Space Technol. 2015, 45, 203–213. [Google Scholar] [CrossRef]
Figure 1. Train head.
Symmetry 14 00479 g001
Figure 2. Computational domain (unit: m).
Symmetry 14 00479 g002
Figure 3. Boundary conditions. (a) Front view. (b) Side view. (c) Top view.
Symmetry 14 00479 g003
Figure 4. Mesh scheme. (a) Train nose. (b) tunnel portal.
Symmetry 14 00479 g004
Figure 5. Evolution of aerodynamic pressure with different mesh densities.
Symmetry 14 00479 g005
Figure 6. Layout of monitoring points on the tunnel wall (unit: m).
Symmetry 14 00479 g006
Figure 7. Layout of monitoring points outside the tunnel exit (unit: m).
Symmetry 14 00479 g007
Figure 8. Comparison of aerodynamic pressure time histories obtained by numerical simulation and field tests.
Symmetry 14 00479 g008
Figure 9. Evolution of aerodynamic pressure at three monitoring points with different car numbers. (a) Monitoring point 3 (200 m from tunnel entrance). (b) Monitoring point 6 (longitudinal middle section of tunnel). (c) Monitoring point 8 (300 m from the tunnel exit).
Symmetry 14 00479 g009
Figure 10. Evolution of the initial compression wave at three monitoring points with different car numbers: (a) monitoring point 3; (b) monitoring point 6; and (c) monitoring point 8.
Symmetry 14 00479 g010
Figure 11. Distribution of maximum positive peak, negative peak, and peak-to-peak pressures along the longitudinal axis of the tunnel before the train tail left the tunnel exit. (a) Maximum positive peak pressure. (b) Maximum negative peak pressure. (c) Maximum peak-to-peak pressure.
Symmetry 14 00479 g011aSymmetry 14 00479 g011b
Figure 12. Distribution of maximum positive peak, negative peak, and peak-to-peak pressures along the longitudinal axis after the train tail leaves the tunnel. (a) Maximum positive peak pressure. (b) Maximum negative peak pressure. (c) Maximum peak-to-peak pressure.
Symmetry 14 00479 g012aSymmetry 14 00479 g012b
Figure 13. Evolution of micropressure waves with different car numbers at different locations outside tunnel exit. (a) Monitoring point I. (b) Monitoring point V. (c) Monitoring point X.
Symmetry 14 00479 g013
Figure 14. Evolution of micropressure wave at different locations outside tunnel exit for three- and eight-car trains: (a) three-car; and (b) eight-car.
Symmetry 14 00479 g014
Figure 15. Initial positive peak pressure of micropressure wave at different locations outside the tunnel exit with different car numbers and corresponding fitting curves.
Symmetry 14 00479 g015
Figure 16. Wave diagram describing a single high-speed train traveling through a 1000-m-long tunnel at a speed of 350 km/h with different car numbers: (a) three cars; (b) four cars; (c) five cars; (d) six cars; (e) seven cars; and (f) eight cars.
Symmetry 14 00479 g016aSymmetry 14 00479 g016b
Table 1. Specifications of the train and tunnel models.
ModelSpecificationValue
Train modelHead (tail) car length26.5 m
Middle car length25.0 m
Streamlined length of train nose12.0 m
Constant cross-sectional area11.2 m2
Train speed350 km/h
Width3.4 m
Height3.7 m
From tunnel entrance50.0 m
Above tunnel floor0.2 m
Tunnel modelLength1000 m
Internal cross-sectional area100 m2
Center-to-center distance5.0 m
Train versus tunnelBlockage ratio0.11
Table 2. Input parameters for our simulation.
Solver ParametersParameter Setting
Solver typePressure-Based
Turbulent modelRNG k-e model
Scheme of pressure-velocity couplingSemi-implicit Method for Pressure Linked Equations
Spatial discretizationGradientLeast Squares Cell Based
PressureSecond Order
MomentumSecond Order Upwind
Residual valueContinuity equation10−5
Momentum equation10−5
Energy equation10−7
Time Steps Size0.04 s
Max iterations of each time step50
Table 3. Initial positive peak and time to reach initial positive peak pressure at three monitoring points with different car numbers.
Train NumberInitial Positive Peak (kPa)Time to Reach Initial Positive Peak (s)
Monitoring Point368368
three-car1.6181.6251.6231.5282.3922.968
four-car1.6681.6761.6721.8122.6723.160
five-car1.7121.7211.7172.0762.8763.452
six-car1.7521.7611.7572.2923.1523.720
seven-car1.7861.8071.7872.4443.4363.828
eight-car1.7941.8411.7942.4563.7243.834
Publisher’s Note: MDPI stays neutral with regard to jurisdictional claims in published maps and institutional affiliations.

