Article

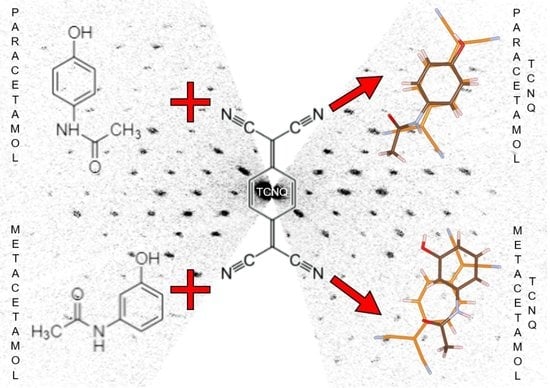
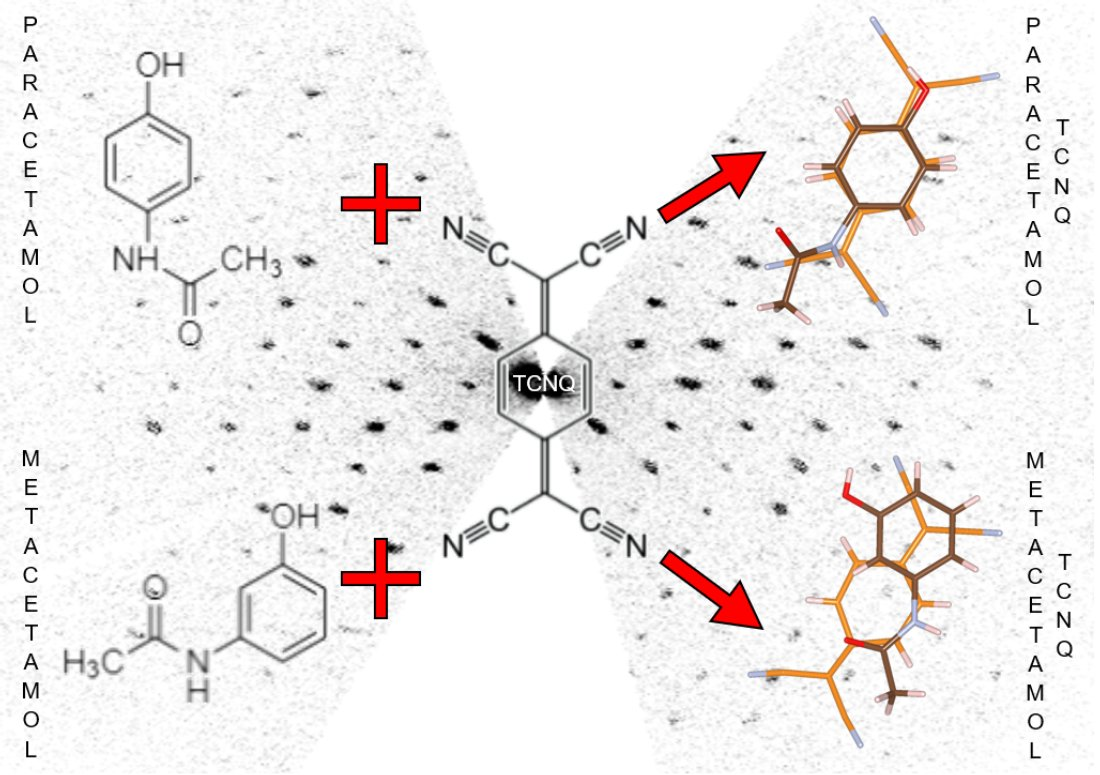
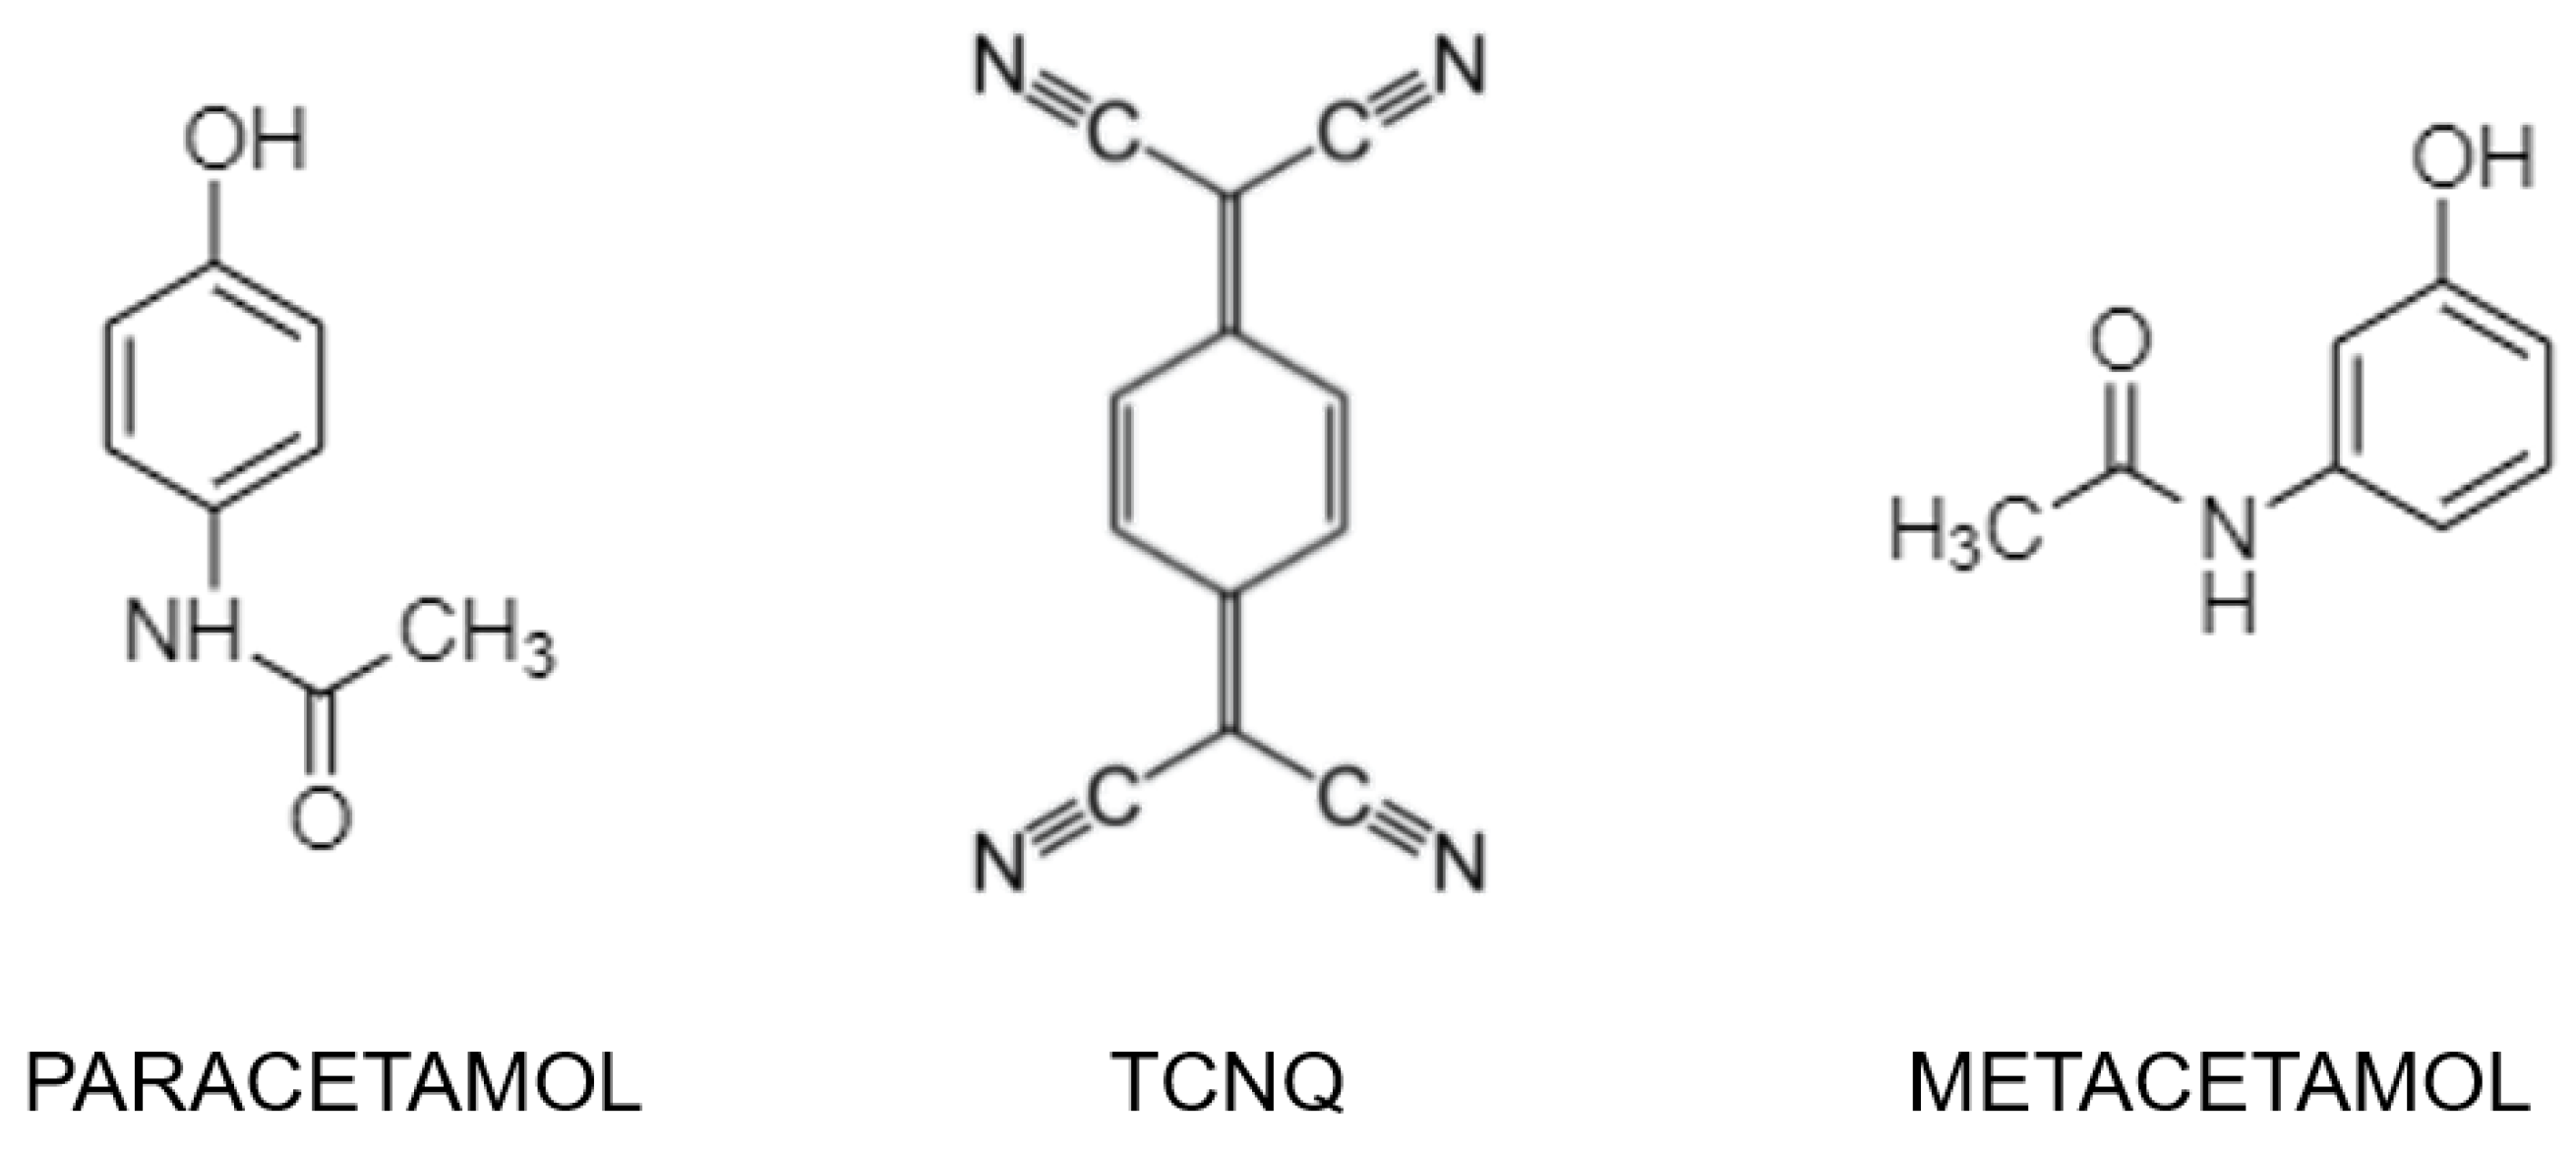
Two New Organic Co-Crystals Based on Acetamidophenol Molecules

1
Center for Materials Interfaces, Electron Crystallography, Istituto Italiano di Tecnologia, Viale Rinaldo Piaggio 34, 56025 Pontedera, Italy
2
Complex Functional Materials Group, School of Chemistry, University of Bristol, Cantock’s Close, Bristol BS8 1TS, UK
*
Author to whom correspondence should be addressed.
Symmetry 2022, 14(3), 431; https://doi.org/10.3390/sym14030431
Submission received: 15 January 2022 / Revised: 2 February 2022 / Accepted: 15 February 2022 / Published: 22 February 2022
(This article belongs to the Special Issue Electron Diffraction and Structural Imaging II)

Abstract

:
Herein we present two new organic co-crystals obtained through a simple solution growth process based on an acetamidophenol molecule, either paracetamol or metacetamol, and on 7,7,8,8-tetracyanoquinodimethane (TCNQ). These co-crystals are part of a family of potential organic charge transfer complexes, where the acetamidophenol molecule behaves as an electron donor and TCNQ behaves as an electron acceptor. Due to the sub-micron size of the crystalline domains, 3D electron diffraction was employed for the structure characterization of both systems. Paracetamol-TCNQ structure was solved by standard direct methods, while the analysis of metacetamol-TCNQ was complicated by the low resolution of the available diffraction data and by the low symmetry of the system. The structure determination of metacetamol-TCNQ was eventually achieved after merging two data sets and combining direct methods with simulated annealing. Our study reveals that both paracetamol-TCNQ and metacetamol-TCNQ systems crystallize in a 1:1 stoichiometry, assembling in a mixed-stack configuration and adopting a non-centrosymmetric P1 symmetry. It appears that paracetamol and metacetamol do not form a strong structural scaffold based on hydrogen bonding, as previously observed for orthocetamol-TCNQ and orthocetamol-TCNB (1,2,4,5-tetracyanobenzene) co-crystals.

Graphical Abstract

1. Introduction

Symmetry is the true heart of crystallography. It is because of the symmetry that the description of a crystal passes from an Avogadro number of atoms to few atoms in the asymmetric unit. This simplifies enormously the problem of solving the crystal structure of an unknown phase. When the crystals become extremely small, in the range of few nanometers, the problem of symmetry determination becomes extremely challenging. The beautiful hints given by the crystal shape are hard to recognize in electron microscopy images of nanocrystals. The guide given by single-crystal diffraction data is not available when the size falls below a few microns. Then, the standard investigation technique becomes powder X-ray diffraction, which suffers from a reduction of dimensionality. In powder diffraction, the signal is one dimensional, while the symmetry is a three-dimensional quantity. Therefore, the determination of symmetry by powder diffraction can only be obtained indirectly through the profile fitting of the derived structural model.
In the last 15 years, since 2007, a new single-crystal diffraction technique became available for nanocrystals [1,2,3]. Because electrons interact stronger with matter than X-ray and can be focused in small bright beams, it is possible to record electron diffraction signals from crystals of a few hundreds of nanometers in any transmission electron microscope (TEM). This effect has been known since the invention of TEM, however, nobody thought to use the TEM as a single-crystal diffractometer until very recently. One reason was that the dynamical scattering, which spoils the simple linear relation between the diffraction intensities and the square modulus of the structure factors, was considered too strong for inorganic structures. On the other hand, organic structures are very beam sensitive so that only a few oriented patterns could be collected from them [4]. Still, electron diffraction had been successfully used for symmetry determination, especially in convergent beam electron diffraction (CBED) mode, but mainly on hard inorganic samples that are rather resistant to beam damage [5,6]. When scientists eventually tried to collect 3D electron diffraction (3D ED) data by recording a sequence of patterns while the crystal is rotated around the TEM goniometer axis [1], they discovered that the dynamical scattering is not so strong to completely hamper the structure solution based on kinematical approximation [7]. In particular, it was noticed that when reflections are integrated over their excitation error, the resulting 3D intensity data set can be considered quasi-kinematical.
The proper integration of reflection intensities was initially achieved by collecting each pattern of the sequence in precession mode, with the electron beam precessing on a cone surface having the vertex fixed on the sample plane [7]. The precession movement allows the Ewald sphere to sweep the reciprocal space around the actual orientation, integrating each nearby reflection over a certain excitation error. Later on, the same result was achieved by fine sampling the reciprocal space with small electrical beam tilts in the so-called rotation electron diffraction method [8]. Both of these acquisition protocols turned out to be very successful for the structure solution of unknown crystal structures [3].
The quasi-kinematical character of electron diffraction intensities guarantees the possibility to have valuable symmetry information, such as extinction conditions. However, the presence of residual dynamical scattering and experimental inaccuracies in the data collection always require them to be validated by a complete structure solution. This is particularly evident in the case of organic structures. Organic materials are beam sensitive; therefore, 3D ED methods should be performed under very low dose conditions. Nowadays this is achieved by the employment of a new generation of very sensitive detectors (direct electron detectors) and by the speeding of data collection with continuous and semi-automatic data collection while the crystal is rotating [9,10,11,12,13]. Yet, continuous rotation data collections on nanocrystalline materials is experimentally complicated. It is very difficult to have sufficient goniometer stability for keeping the electron beam on the same area for a wide angular range [14]. Moreover, the beam sensitivity of some materials is so pronounced to limit the number of patterns that can be collected before high-resolution reflections start to deteriorate. Thus, merging among several data sets may be required to have an adequate reciprocal space coverage [15]. Eventually, it is rather difficult to have a reliable a priori determination of the Laue class based on only intensity data before the correct phasing scheme is fully resolved.
With 3D ED data, we are generally compelled to perform several structure solution attempts with all the space groups compatible with the lattice geometry and with the detected extinction conditions. Interestingly, it is the structure solution that will reveal the real symmetry. A wrong symmetry will result in a structure model that is not chemically sound. For example, orthocetamol crystals exhibit a pseudo-tetragonal unit cell inside the precision of 3D ED data, but the symmetry had to be reduced to monoclinic in order to achieve the correct structure solution [16]. Similarly, the delta-polymorph of indomethacin was determined only after two independent molecules were introduced in the unit cell, obliterating the possibility of centrosymmetry [17].
Three-dimensional ED has been successfully used for the determination of nanocrystalline organic co-crystals [18,19]. In particular, Hitchen et al. [20] revealed the possibility of a new family of organic charge transfer (CT) complexes, based on rigid scaffold chains of orthocetamol molecules connected through hydrogen bonding and coupled with different planar acceptors. Here we report the structure solution of two other co-crystals based on acetamidophenol regioisomers (i.e., metacetamol and paracetamol) and 7,7,8,8-tetracyanoquinodimethane (TCNQ) (Figure 1). The structure determination of these two compounds was particularly challenging due to their beam sensitivity and triclinic symmetry, which reduced the overall data completeness. While the paracetamol-TCNQ co-crystal could be solved ab initio by direct methods, metacetamol-TCNQ co-crystal was determined by simulated annealing using a priori information about molecule connectivity. Both structures were subsequently optimized, verifying they were minima in the conformational energy landscape.

2. Materials and Methods

2.1. Crystallisation

Paracetamol (>98% purity), metacetamol (>97%), and TCNQ (>98%) were obtained from Sigma-Aldrich and used as received without further purification. Donor and acceptor molecules were combined in a 1:1 M ratio in a minimum amount of anhydrous chloroform (Sigma-Aldrich, St. Louis, MO, USA, >99%) at room temperature. After 24 h, solutions were filtered at room temperature. After one week of slow evaporation, crystals of both paracetamol-TCNQ and metacetamol-TCNQ were removed from the solution and subsequently dried for analysis.

2.2. TEM and 3D ED Structure Analysis

High-angle annular dark-field scanning transmission electron microscopy (HAADF-STEM) imaging and 3D electron diffraction (3D ED) were performed with a Zeiss Libra 120 TEM operating at 120 kV and equipped with a thermionic LaB6 source. A small amount of each co-crystal sample was gently crushed and directly loaded on a carbon-coated Cu TEM grid without any solvent or sonication. Three-dimensional ED was performed in STEM mode after defocusing the beam in order to have a parallel illumination on the sample, as described in Lanza et al. [21]. ED patterns were collected in Köhler parallel illumination with a beam size of about 150 nm in diameter, obtained with a 5 µm C2 condenser aperture and recorded by an ASI MEDIPIX single-electron detector [9]. This delivered virtually background-free diffraction patterns and allowed working with a very low electron dose.
For both samples, 3D ED data collections were performed at room temperature. No evidence of beam damage was ever observed, likely due to the extremely low dose rate. Three-dimensional ED data sets cover ranges 70–120°. Camera lengths of 180 mm were used, allowing for a resolution in real space of about 0.7 Å. Data were acquired in stepwise mode, with fixed steps of 1°. After each tilt, a diffraction pattern was acquired, and the crystal position was tracked by defocused STEM imaging. During stepwise experiments, the beam was precessed around the optical axis by an angle of 1° to improve reflection intensity integration [7]. Beam precession was performed using a Nanomegas Digistar P1000 device [22].
Three-dimensional ED data were analyzed with the software PETS 2.0 [23], using a low threshold during reflection search (I/σ = 5). Structure determinations were achieved by both standard direct methods (SDM) and simulated annealing (SA), as implemented in the software SIR2014 [24]. For SA structure determination, the models of single molecules were extracted from the Cambridge Structural Database [25]. Each co-former molecule was modeled as a unique fragment (Figure 1), where the atomic distances and coordination were known. No anti-bump restraint was used. Data were treated with a fully kinematical approximation, assuming that Ihkl was proportional to |Fhkl|2. Least-squares structure refinements were performed based on the most complete acquisitions with the software SHELXL [26], using soft and rigid geometrical constraints. In the final refinement step, all hydrogen atoms were constrained in geometrically idealized positions. Atomic structures were visualized by the software VESTA [27].

2.3. Theoretical Calculations

Computational optimization was performed on both structures using CRYSTAL17 software [28] and calculated using the PBE0/6-31G level with 0 thermal component. Starting geometries were taken directly from experimentally determined models. Structures were compared to assess similarities between 3D ED-generated structures and the lowest energy structures obtained via calculation.

3. Results and Discussion

3.1. Structure Determination of Paracetamol-TCNQ Co-Crystal

Paracetamol-TCNQ crystallizes as yellow platelets up to 500 µm in size (Figure 2a). Such platelets are indeed agglomerates of much smaller crystalline domains, and this hinders the possibility of single-crystal X-ray diffraction experiments. Three-dimensional ED data were then recorded from six single-crystal fragments with a size less than 1µm (Figure 2c). All six 3D ED data sets delivered a triclinic unit cell with approximate parameters a = 7.20 (14) Å, b = 6.60 (13) Å, c = 9.20 (18) Å, and α = 91.1 (5)°, β = 99.7 (5)°, γ = 86.1 (5)°. A close look at 3D ED reconstructions revealed no hint of extinction features (Figure 3a–c). Considering the 1:1 ratio of paracetamol and TCNQ, such a cell would conveniently host only one pair of constituent molecules, which is consistent with the triclinic space group P1 (No. 1).
The structure of paracetamol-TCNQ co-crystal was determined ab initio by SDM using only the most complete 3D ED data set, i.e., the one acquired within the wider angular range and with better defined high-resolution reflections. All 27 non-hydrogen atoms of the structure were found by automatic routines after direct method phasing and both paracetamol and TCNQ molecules were immediately recognizable.

3.2. Structure Determination of Metacetamol-TCNQ Co-Crystal

Metacetamol-TCNQ appears as thin black platelets up to a few cm in length (Figure 2b). Again, each platelet is an agglomerate of much smaller crystalline domains. Three-dimensional ED data were recorded from five single-crystal fragments of different sizes (Figure 2d). All reconstructed 3D ED data delivered a triclinic primitive unit cell with parameters a = 7.30 (15) Å, b = 9.40 (19) Å, c = 9.80 (20) Å and α = 106.0 (5)°, β = 93.4 (5)°, γ = 92.3 (5)°. No extinction features were detected (Figure 3d–f), and cell volume appeared consistent with only one pair of constituent molecules.
Diffraction data from metacetamol-TCNQ turned out to be of lower quality than the ones collected from paracetamol-TCNQ. Indeed, no structure solution could be achieved using a single 3D ED data set. Two data sets were therefore merged with a scale factor based on the strongest reflections (arguably the ones whose intensity values were relatively less affected by dynamical effects, experimental inaccuracies, and background).
Using this merged data set, the structure of metacetamol-TCNQ could be solved by SDM in space group P1 (No. 1). The maxima of the resulting potential map were poorly defined. One atom of metacetamol ring was not spotted by automatic routines, while the TCNQ molecule was largely incomplete, especially around the cyanide group, where atoms were relatively close (C≡N bond distance is expected in the range 1.16–1.11 Å). To some extent, the resolution of the cyanide group was also complicate in the previously reported orthocetamol-TCNQ co-crystal, where considerably better data were available [20].
The structure of metacetamol-TCNQ was independently confirmed by SA method. This global optimization method has been already applied to poor quality 3D ED data for the determination of organic structures [8,17,19,29,30]. SA method appears particularly suitable for this case, because TCNQ molecule is rigid and acetamidophenols have only one free torsion angle.

3.3. Structure Refinement and Energy Minimisation

Structure models of paracetamol-TCNQ and metacetamol-TCNQ were eventually least-squares refined against 3D ED data using SHELXL [26]. Geometrical ties were added stepwise to check the stability of the models. All hydrogen atoms were generated in idealized positions during the last refinement cycle. More details about the structures determination and refinement are listed in Table 1. Final models for paracetamol-TCNQ and metacetamol-TCNQ crystal structures are shown in Figure 4. Related CIF files have been uploaded in the CCDC database, with deposition numbers 2147971 and 2148006, respectively.
Computational optimization was performed on both structures using CRYSTAL17 software [28], as previously done for olanzapine-phenol co-crystal [19]. A comparison of the experimental and calculated structures shows only minor differences in the hydrogen-bond lengths or relative ring angles, while the overall structure remains virtually intact. This confirms that the models determined experimentally based on 3D ED data are indeed structural energy minima (Figure 5).

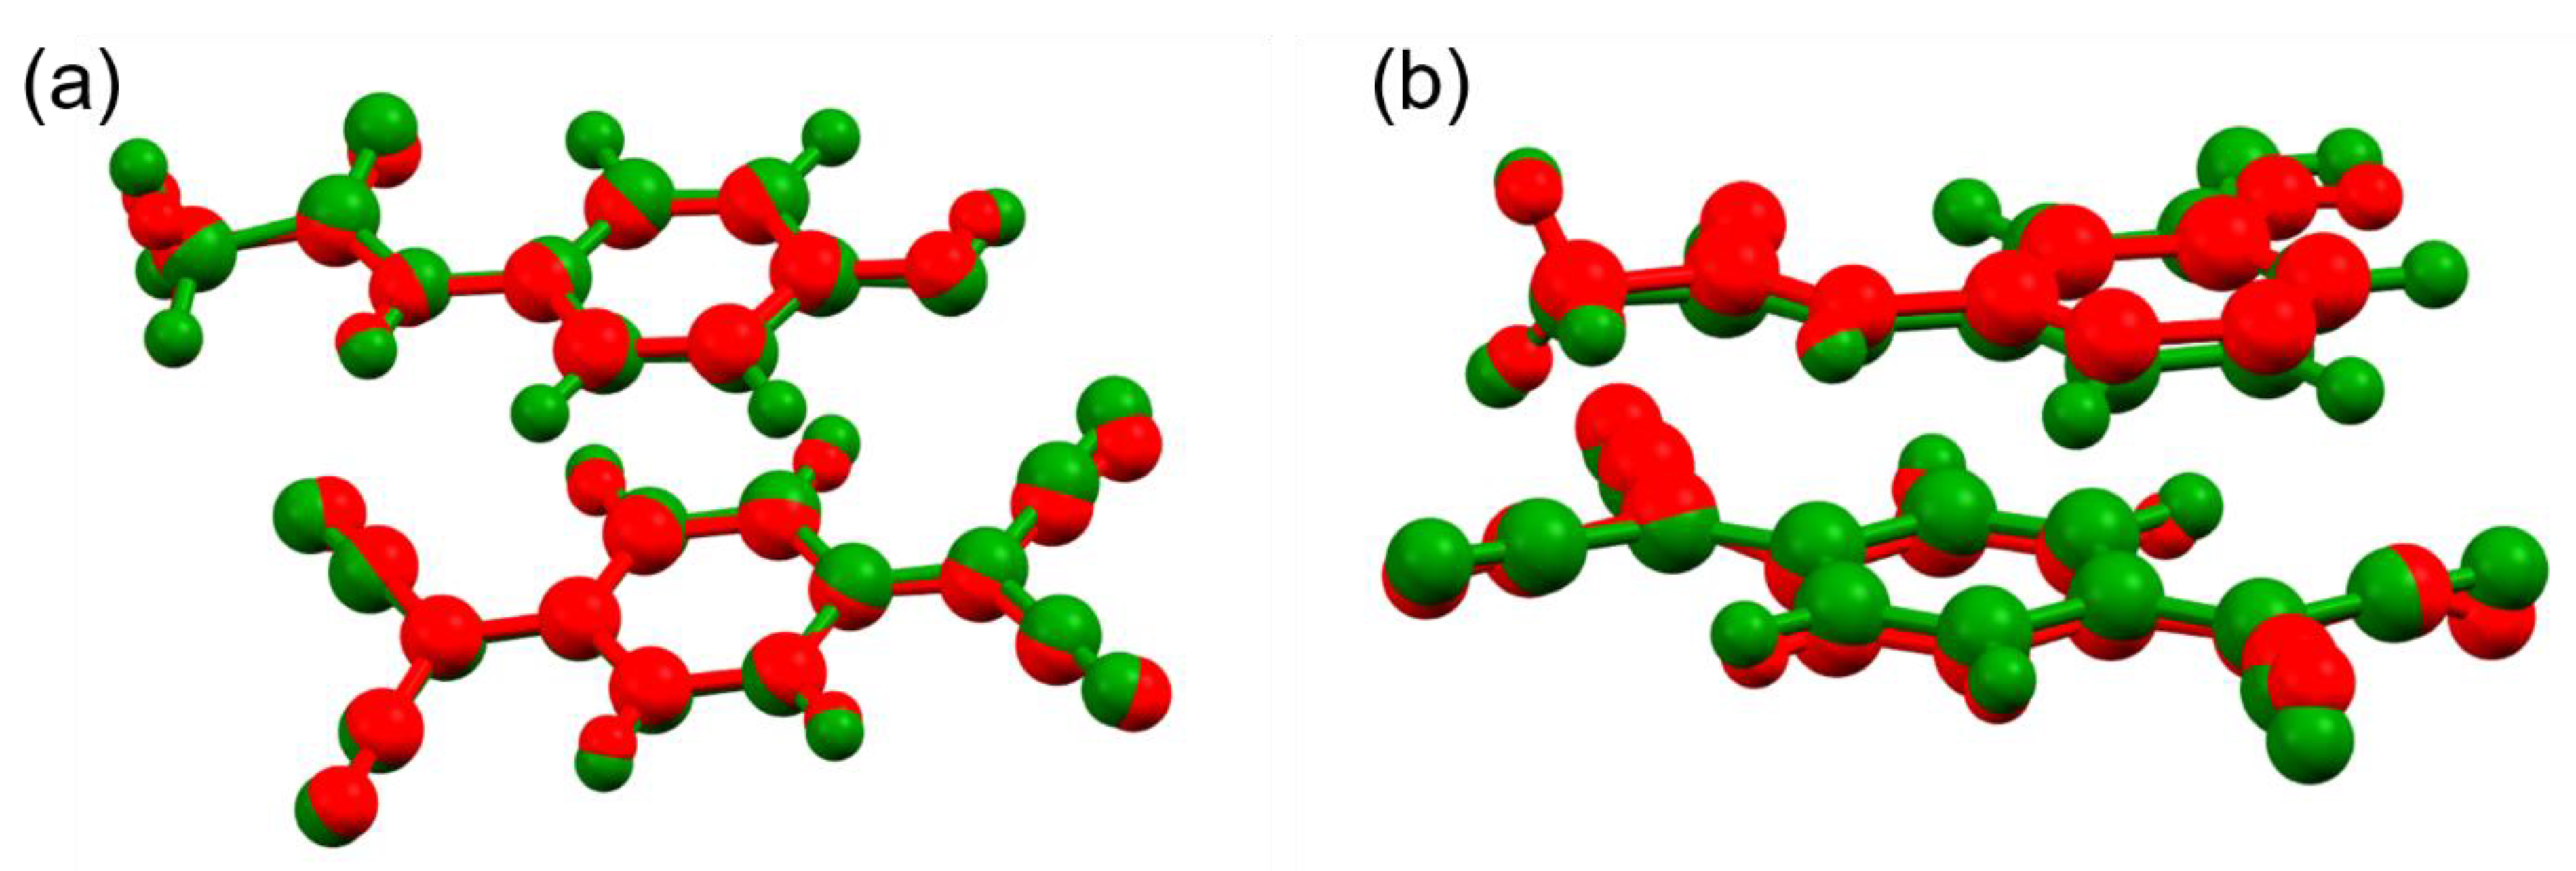
3.4. Structure Description

Paracetamol-TCNQ and metacetamol-TCNQ structures show a mixed-stack motif, as observed in many organic CT co-crystals [20,31,32]. In paracetamol-TCNQ, molecules of paracetamol and TCNQ are piled along their 6-carbon rings, following an ‘eclipsed’ arrangement such as in orthocetamol-TCNQ [20] (Figure 4c). In metacetamol-TCNQ, molecules show a looser piling, and the TCNQ ring is centered on the amide-phenol junction of the metacetamol molecule (Figure 4d). This packing generates a large channel along [001], with a diameter of more than 6 Å (Figure 4f).
Both paracetamol-TCNQ and metacetamol-TCNQ show no evidence of hydrogen bonding between acetamidophenol molecules. This is the most striking difference with orthocetamol-TCNQ co-crystal, whose structure is based on rigid scaffold chains of orthocetamol molecules [20]. Eventually, metacetamol-TCNQ and paracetamol-TCNQ appear more similar to conventional organic CT co-crystals, based on flat and loosely connected molecules.
We also point out the drastic reduction of symmetry from orthocetamol-TCNQ to paracetamol-TCNQ and metacetamol-TCNQ co-crystals. The former crystallizes in monoclinic space group Pc, with four couples of constituent molecules hosted in the asymmetric unit. Instead, both compounds reported in this paper crystallize in the triclinic space group P1, characterized by the only translational symmetry. Because the three compounds were obtained following a comparable crystallization route, such reduction of symmetry is dictated by the different acetamidophenol molecules. In particular, structure differences appear mostly related to the tendency of orthocetamol to form stiff backbone chains [16]. Interestingly, all acetamidophenol-TCNQ co-cocrystals reported up to date are non-centrosymmetric.

4. Conclusions

The structures of paracetamol-TCNQ and metacetamol-TCNQ co-crystals were solved using 3D electron diffraction despite remarkable experimental difficulties, such as small crystal size, beam sensitivity, and low symmetry. This result would be impossible to obtain with conventional single-crystal X-ray methods and hardly feasible even with cutting-edge powder X-ray facilities due to severe peak broadening and overlapping.
This work completes the study of acetamidophenol-TCNQ co-cocrystals produced through the simple evaporation from an anhydrous chloroform solution. While orthocetamol-TCNQ showed a more symmetric arrangement based on rigid scaffold chains of orthocetamol molecules [20], paracetamol-TCNQ and metacetamol-TCNQ crystallize in the lowest symmetric space group P1 and exhibit motifs more similar to typical mixed-stack organic CT co-crystals. This example emphasizes how much structures and symmetry of co-crystals may be affected by seemingly minor differences in the molecular configuration of their constituents, such as the ones that occur among the three acetamidophenol regioisomers.

Author Contributions

Conceptualization, S.R.H. and M.G.; investigation, I.A., J.H., E.M. and J.P.; data curation, E.M.; writing—original draft preparation, I.A., J.H., E.M., J.P. and M.G.; writing—review and editing, I.A., S.R.H. and M.G.; visualization, I.A. and J.H.; supervision, S.R.H. and M.G.; funding acquisition, S.R.H. and M.G. All authors have read and agreed to the published version of the manuscript.

Funding

This research was funded by FELIX project (Por CREO FESR 2014-2020 action), Engineering and Physical Sciences Research Council UK (grants EP/G036780/1 and EP/L015544/1), European Union’s Horizon 2020 Research and Innovation program (grant No. 736899).

Institutional Review Board Statement

Not applicable.

Informed Consent Statement

Not applicable.

Data Availability Statement

CCDC 2147971 contains the supplementary crystallographic data for paracetamol-TCNQ co-crystal and CCDC 2148006 contains the supplementary crystallographic data for metacetamol-TCNQ co-crystal. These data can be obtained free of charge via www.ccdc.cam.ac.uk/data_request/cif (accessed on 14 February 2022), or by emailing [email protected], or by contacting The Cambridge Crystallographic Data Centre, 12 Union Road, Cambridge CB2 1EZ, UK; fax: +44 1223 336 033.

Acknowledgments

I.A., E.M. and M.G. acknowledge the Regione Toscana for funding the purchase of the Timepix. J.H., J.P. and S.R.H. acknowledge MagnaPharm for a collaborative research, the Bristol Centre for Functional Nanomaterials and the Centre for Doctoral Training in Condensed Matter Physics.

Conflicts of Interest

The authors declare no conflict of interest.

References

  1. Kolb, U.; Gorelik, T.; Kübel, C.; Otten, M.T.; Hubert, D. Towards automated diffraction tomography: Part I—Data acquisition. Ultramicroscopy 2007, 107, 507–513. [Google Scholar] [CrossRef] [PubMed]
  2. Shi, D.; Nannenga, B.L.; Iadanza, M.G.; Gonen, T. Threedimensional electron crystallography of protein microcrystals. eLife 2013, 2, e01345. [Google Scholar] [CrossRef]
  3. Gemmi, M.; Mugnaioli, E.; Gorelik, T.E.; Kolb, U.; Palatinus, L.; Boullay, P.; Hovmöller, S.; Abrahams, J.P. 3D electron diffraction: The nanocrystallography revolution. ACS Cent. Sci. 2019, 5, 1315–1329. [Google Scholar] [CrossRef] [PubMed] [Green Version]
  4. Dorset, D.L. Structural Electron Crystallography; Plenum Press: New York, NY, USA, 1995. [Google Scholar]
  5. Steeds, J.W. Convergent beam electron diffraction. In Introduction to Analytical Electron Microscopy; Hren, J.J., Goldstein, J.I., Joy, D.C., Eds.; Springer: Boston, MA, USA, 1979. [Google Scholar]
  6. Zuo, J.M.; Spence, J.C.H. Automated structure factor refinement from convergent-beam patterns. Ultramicroscopy 1991, 35, 185–186. [Google Scholar] [CrossRef]
  7. Mugnaioli, E.; Gorelik, T.; Kolb, U. “Ab Initio” structure solution from electron diffraction data obtained by a combination of automated diffraction tomography and precession technique. Ultramicroscopy 2009, 109, 758–765. [Google Scholar] [CrossRef] [PubMed]
  8. Zhang, D.; Oleynikov, P.; Hovmöller, S.; Zou, X. Collecting 3D electron diffraction data by the rotation method. Z. Kristallogr. 2010, 225, 94–102. [Google Scholar] [CrossRef]
  9. Nederlof, I.; van Genderen, E.; Li, Y.-W.; Abrahams, J.P. A Medipix quantum area detector allows rotation electron diffraction data collection from submicrometre three-dimensional protein crystals. Acta Crystallogr. D 2013, 69, 1223–1230. [Google Scholar] [CrossRef] [Green Version]
  10. Nannenga, B.L.; Shi, D.; Leslie, A.G.W.; Gonen, T. High-resolution structure determination by continuous-rotation data collection in MicroED. Nat. Methods 2014, 11, 927–930. [Google Scholar] [CrossRef] [Green Version]
  11. Gruene, T.; Wennmacher, J.T.C.; Zaubitzer, C.; Holstein, J.J.; Heidler, J.; Fecteau-Lefebvre, A.; De Carlo, S.; Müller, E.; Goldie, K.N.; Regeni, I.; et al. Rapid structure determination of microcrystalline molecular compounds using electron diffraction. Angew. Chem. Int. Ed. 2018, 57, 16313–16317. [Google Scholar] [CrossRef] [Green Version]
  12. Jones, C.G.; Martynowycz, M.W.; Hattne, J.; Fulton, T.J.; Stoltz, B.M.; Rodriguez, J.A.; Nelson, H.M.; Gonen, T. The cryoEM method microED as a powerful tool for small molecule structure determination. ACS Cent. Sci. 2018, 4, 1587–1592. [Google Scholar] [CrossRef]
  13. Huang, Z.; Grape, S.E.; Li, J.; Inge, A.K.; Zou, X. 3D electron diffraction as an important technique for structure elucidation of metal-organic frameworks and covalent organic frameworks. Coordin. Chem. Rev. 2021, 427, 213583. [Google Scholar] [CrossRef]
  14. Gemmi, M.; Lanza, A.E. 3D electron diffraction techniques. Acta Crystallogr. B 2019, 75, 495–504. [Google Scholar] [CrossRef] [PubMed]
  15. Ge, M.; Yang, T.; Wang, Y.; Carraro, F.; Liang, W.; Doonan, C.; Falcaro, P.; Zheng, H.; Zou, X.; Huang, Z. On the completeness of three-dimensional electron diffraction data for structural analysis of metal–organic frameworks. Faraday Discuss. 2021, 231, 66–80. [Google Scholar] [CrossRef] [PubMed]
  16. Andrusenko, I.; Hamilton, V.; Mugnaioli, E.; Lanza, A.; Hall, C.; Potticary, J.; Hall, S.R.; Gemmi, M. The crystal structure of orthocetamol solved by 3D electron diffraction. Angew. Chem. Int. Ed. 2019, 58, 10919–10922. [Google Scholar] [CrossRef]
  17. Andrusenko, I.; Hamilton, V.; Lanza, A.E.; Hall, C.L.; Mugnaioli, E.; Potticary, J.; Buanz, A.; Gaisford, S.; Piras, A.M.; Zambito, Y.; et al. Structure determination, thermal stability and dissolution rate of δ-indomethacin. Int. J. Pharm. 2021, 608, 121067. [Google Scholar] [CrossRef]
  18. Brázda, P.; Palatinus, L.; Babor, M. Electron diffraction determines molecular absolute configuration in a pharmaceutical nanocrystal. Science 2019, 364, 667–669. [Google Scholar] [CrossRef]
  19. Andrusenko, I.; Potticary, J.; Hall, S.R.; Gemmi, M. A new olanzapine cocrystal obtained from volatile deep eutectic solvents and determined by 3D electron diffraction. Acta Crystallogr. B 2020, 76, 1036–1044. [Google Scholar] [CrossRef]
  20. Hitchen, J.; Andrusenko, I.; Hall, C.L.; Mugnaioli, E.; Potticary, J.; Gemmi, M.; Hall, S.R. Organic cocrystals of TCNQ and TCNB based on an orthocetamol backbone solved by three-dimensional electron diffraction. Cryst. Growth Des. 2022, 22, 1155–1163. [Google Scholar] [CrossRef]
  21. Lanza, A.; Margheritis, E.; Mugnaioli, E.; Cappello, V.; Garau, G.; Gemmi, M. Nanobeam precession-assisted 3D electron diffraction reveals a new polymorph of hen egg-white lysozyme. IUCrJ 2019, 6, 178–188. [Google Scholar] [CrossRef]
  22. Vincent, R.; Midgley, P.A. Double conical beam-rocking system for measurement of integrated electron diffraction intensities. Ultramicroscopy 1994, 53, 271–282. [Google Scholar] [CrossRef]
  23. Palatinus, L.; Brázda, P.; Jelínek, M.; Hrdá, J.; Steciuk, G.; Klementová, M. Specifics of the data processing of precession electron diffraction tomography data and their implementation in the program PETS2.0. Acta Crystallogr. B 2019, 75, 512–522. [Google Scholar] [CrossRef] [PubMed]
  24. Burla, M.C.; Caliandro, R.; Carrozzini, B.; Cascarano, G.L.; Cuocci, C.; Giacovazzo, C.; Mallamo, M.; Mazzone, A.; Polidori, G. Crystal structure determination and refinement via SIR2014. J. Appl. Crystallogr. 2015, 48, 306–309. [Google Scholar] [CrossRef]
  25. Groom, C.R.; Bruno, I.J.; Lightfoot, M.P.; Ward, S.C. The Cambridge structural database. Acta Crystallogr. B 2016, 72, 171–179. [Google Scholar] [CrossRef] [PubMed]
  26. Sheldrick, G.M. Crystal structure refinement with SHELXL. Acta Crystallogr. C 2015, 71, 3–8. [Google Scholar] [CrossRef] [PubMed]
  27. Momma, K.; Izumi, F.J. VESTA 3 for three-dimensional visualization of crystal, volumetric and morphology data. J. Appl. Crystallogr. 2011, 44, 1272–1276. [Google Scholar] [CrossRef]
  28. Dovesi, R.; Erba, A.; Orlando, R.; Zicovich-Wilson, C.M.; Civalleri, B.; Maschio, L.; Rérat, M.; Casassa, S.; Baima, J.; Salustro, S.; et al. Quantum-mechanical condensed matter simulations with CRYSTAL. WIREs Comput. Mol. Sci. 2018, 8, e1360. [Google Scholar] [CrossRef]
  29. Das, P.P.; Mugnaioli, E.; Nicolopoulos, S.; Tossi, C.; Gemmi, M.; Galanis, A.; Borodi, G.; Pop, M.M. Crystal structures of two important pharmaceuticals solved by 3D precession electron diffraction tomography. Org. Process Res. Dev. 2018, 22, 1365–1372. [Google Scholar] [CrossRef]
  30. Feyand, M.; Mugnaioli, E.; Vermoortele, F.; Bueken, B.; Dieterich, J.M.; Reimer, T.; Kolb, U.; de Vos, D.; Stock, N. Automated diffraction tomography for the structure elucidation of twinned, sub-micrometer crystals of a highly porous, catalytically active bismuth metal–organic framework. Angew. Chem. Int. Ed. 2012, 51, 10373–10376. [Google Scholar] [CrossRef]
  31. Yu, W.; Wang, X.-Y.; Li, J.; Li, Z.-T.; Yan, Y.-K.; Wang, W.; Pei, J. A photoconductive charge-transfer crystal with mixed-stacking donor–acceptor heterojunctions within the lattice. Chem. Commun. 2013, 49, 54–56. [Google Scholar] [CrossRef]
  32. Zhu, L.; Yi, Y.; Fonari, A.; Corbin, N.S.; Coropceanu, V.; Brédas, J.-L. Electronic properties of mixed-stack organic charge-transfer crystals. J. Phys. Chem. C 2014, 118, 14150–14156. [Google Scholar] [CrossRef]
Figure 1. Molecular schemes of the three constituents used in this study.
Symmetry 14 00431 g001
Figure 2. Light microscopy images of paracetamol-TCNQ (a) and metacetamol-TCNQ (b) platelets. HAADF-STEM images of paracetamol-TCNQ nanocrystals (c) and metacetamol-TCNQ nanocrystals (d) selected for 3D ED data collection.
Symmetry 14 00431 g002
Figure 3. Selected planar cuts of the 3D ED reconstruction from paracetamol-TCNQ (ac) and metacetamol-TCNQ (df) co-crystals.
Symmetry 14 00431 g003
Figure 4. Paracetamol-TCNQ (a,c,e) and metacetamol-TCNQ (b,d,f) structures viewed along selected projections. Carbon atoms of paracetamol and metacetamol molecules are in brown, carbon atoms of TCNQ molecule are in orange, nitrogen atoms are always in light blue, oxygen atoms are in red, and hydrogen atoms are in light grey. The [001] channel in metacetamol-TCNQ is emphasized by a dashed circle (diameter about 6 Å).
Symmetry 14 00431 g004
Figure 5. Overlay of the experimental (red) and calculated (green) structures of paracetamol-TCNQ (a) and metacetamol-TCNQ (b) co-crystals.
Symmetry 14 00431 g005
Table 1. Selected parameters from structures determination and refinement.
Paracetamol-TCNQMetacetamol-TCNQ
ab initio structure determination by SIR2014
Data resolution (Å)0.80.9
Sampled reflections (No.)22962763
Independent reflections (No.)12511403
Independent reflection coverage (%)7176
Global thermal factor U iso2)0.028200.03214
Rint (%)20.1916.01
RSIR (%)27.6029.82
structure refinement by SHELXL
Data resolution (Å)0.90.9
Reflections total (No.)14922763
Reflections > 4σ (No.)6481449
R14σ (%)37.0134.60
R1all (%)39.4646.28
GooF2.1613.850
Publisher’s Note: MDPI stays neutral with regard to jurisdictional claims in published maps and institutional affiliations.

