Article

GIS Partial Discharge Pattern Recognition Based on Multi-Feature Information Fusion of PRPD Image

1
School of Electrical and Mechanical Engineering, Pingdingshan University, Pingdingshan 467000, China
2
Shanghai Huace Navigation Technology Ltd., Wuhan 430000, China
*
Author to whom correspondence should be addressed.
Symmetry 2022, 14(11), 2464; https://doi.org/10.3390/sym14112464
Submission received: 13 October 2022 / Revised: 10 November 2022 / Accepted: 15 November 2022 / Published: 21 November 2022
(This article belongs to the Special Issue Symmetry in Power and Electronic Engineering)

Abstract

:
Partial discharge (PD) pattern recognition is a critical indicator for evaluating the insulation state of gas-insulated switchgear (GIS). Aiming at the disadvantage of traditional PD pattern recognition methods, such as single feature extraction and low recognition accuracy, a pattern recognition method of PD based on multi-feature information fusion is proposed in this paper. Firstly, a recognition model based on quasi-Hausdorff distance is established according to the statistical characteristics of the phase-resolved partial discharge (PRPD) image, and then a modified convolutional neural network recognition model is established according to the image features of the PRPD image. Finally, Dempster–Shafer (D–S) evidence theory is used to fuse the two pattern recognition results and complement the advantages of the two approaches to improve the accuracy of partial discharge pattern recognition. The experimental results show that the total recognition accuracy rate of this method for four typical PD is more than 94.00%, and the recognition rate is significantly improved compared to support vector machine and normal convolution neural network. Maintaining stability in typical bipedal robots is challenging due to two main reasons.

1. Introduction

With the advantages of good insulation, high reliability, and small space, gas-insulated switchgear (GIS) are widely used in power system. However, the GIS often works in a complex environment of high temperature and high pressure which is easy to cause insulation defects. Moreover, in the process of manufacturing, transportation, and assembly, there will inevitably be some hidden dangers. The common insulation defects include metal tip defects, free metal particle defects, floating electrode defects, and insulation void defects [1]. When the insulation defects appear in GIS, partial discharge (PD) will occur accompanied by an ultra-high frequency (UHF) signal. PD is not only the cause of insulation deterioration of GIS in substation but also the cause of insulation deterioration [2]. If not handled in time, it will eventually lead to the insulation breakdown of GIS. Because different insulation fault defects need to take corresponding treatment methods, it is necessary to accurately and effectively recognize the insulation fault types of equipment and then take corresponding treatment to avoid insulation deterioration or even breakdown of equipment [3,4]. It is an important technical means to ensure the stable operation of substations and power systems.
Generally speaking, PD image is the main manifestation of PD features. There are three types of commonly used PD images, including time-resolved partial discharge (TRPD) image, phase-resolved partial discharge (PRPD) image, and phase-resolved pulse sequence (PRPS) image [5]. In particular, the PRPD image can intuitively show the relationship between discharge frequency phase ( φ ), discharge energy (q), and discharge times (n) corresponding to partial discharge pulses, which are popularly used in PD pattern recognition [6,7]. In terms of the classification method of GIS PD pattern recognition based PRPD image, there are two types of popular methods, including traditional machine learning methods supported by feature engineering and deep learning methods based on automatic feature extraction. Based on auto-encoder, principal component analysis, probability statistics, and feature engineering, the key feature parameters are extracted to represent the PD pattern. In particular, the pulse feature method, wavelet transform, and Fourier transform are used to construct the feature [8] in feature engineering. Then, PD pattern recognition is performed by decision trees [9], random forests [10], support vector machines [11], artificial neural networks [12], and other classifiers. With the rapid development of deep learning algorithms, such as the convolution neural network (CNN) [13,14,15], deep belief network (DBN) [16], and recurrent neural network (RNN) [17], they are popularly used for GIS PD pattern recognition classification, and the feasibility is proved through practice. For instance, a novel GIS PD pattern recognition method by using CNN and long short-term memory (LSTM) was proposed in [18], and the effectiveness of this method is verified by the experimental PD dataset. However, the current PD pattern recognition method is mostly based on one type of statistical feature or image feature resulting in low accuracy for PD pattern recognition. Therefore, proposing a new method for the fusion of multi-feature information of the PRPD image for GIS PD pattern recognition is necessary.
This work proposes a GIS partial discharge pattern recognition method based on multi-feature information fusion of the PRPD image, which takes advantage of statistical features and image features to improve the recognition accuracy. This is implemented by applying both machine learning methods and deep learning methods to GIS partial discharge pattern recognition. In particular, the proposed PD pattern recognition method has two major pattern recognition layers: the Hausdorff-like distance algorithm supported by statistical features is utilized for GIS partial discharge pattern recognition, and modified CNN based on automatically extracted image features is also used for GIS partial discharge pattern recognition. Then, taking the results of these two PD pattern recognition models as inputs, a fusion evaluation decision is made based on the D–S evidence theory. The proposed method was validated and evaluated through an experiment in the laboratory and GIS substation. The experimental results show the working of the proposed method for GIS PD pattern recognition in improving recognition accuracy. The main contributions of this work are threefold: (1) developing a modified convolutional neural network for GIS PD pattern recognition; (2) proposing a GIS partial discharge pattern recognition method based on multi-feature information fusion of PRPD image; (3) applying the proposed method to laboratory and GIS substation PD pattern recognition experiment for method verification.
The rest of the paper is organized as follows. Section 2 details the proposed GIS PD pattern recognition method. Section 3 applies the proposed method to the laboratory and GIS substation and assessed the proposed method with results analyzed. The paper is concluded in Section 4.

2. Method

The most common GIS PD pattern has 4 types, including corona discharge, free metal discharge, surface discharge, and floating electrode discharge. The proposed GIS PD pattern recognition method fuse PRPD image statistical feature and image feature to improve the recognition accuracy. Following an overview of the proposed method, the three components of the recognition method, including the Hausdorff-like distance algorithm recognition model, modified convolutional neural network recognition model, and fuse recognition decision based on D–S evidence theory are detailed in this section.

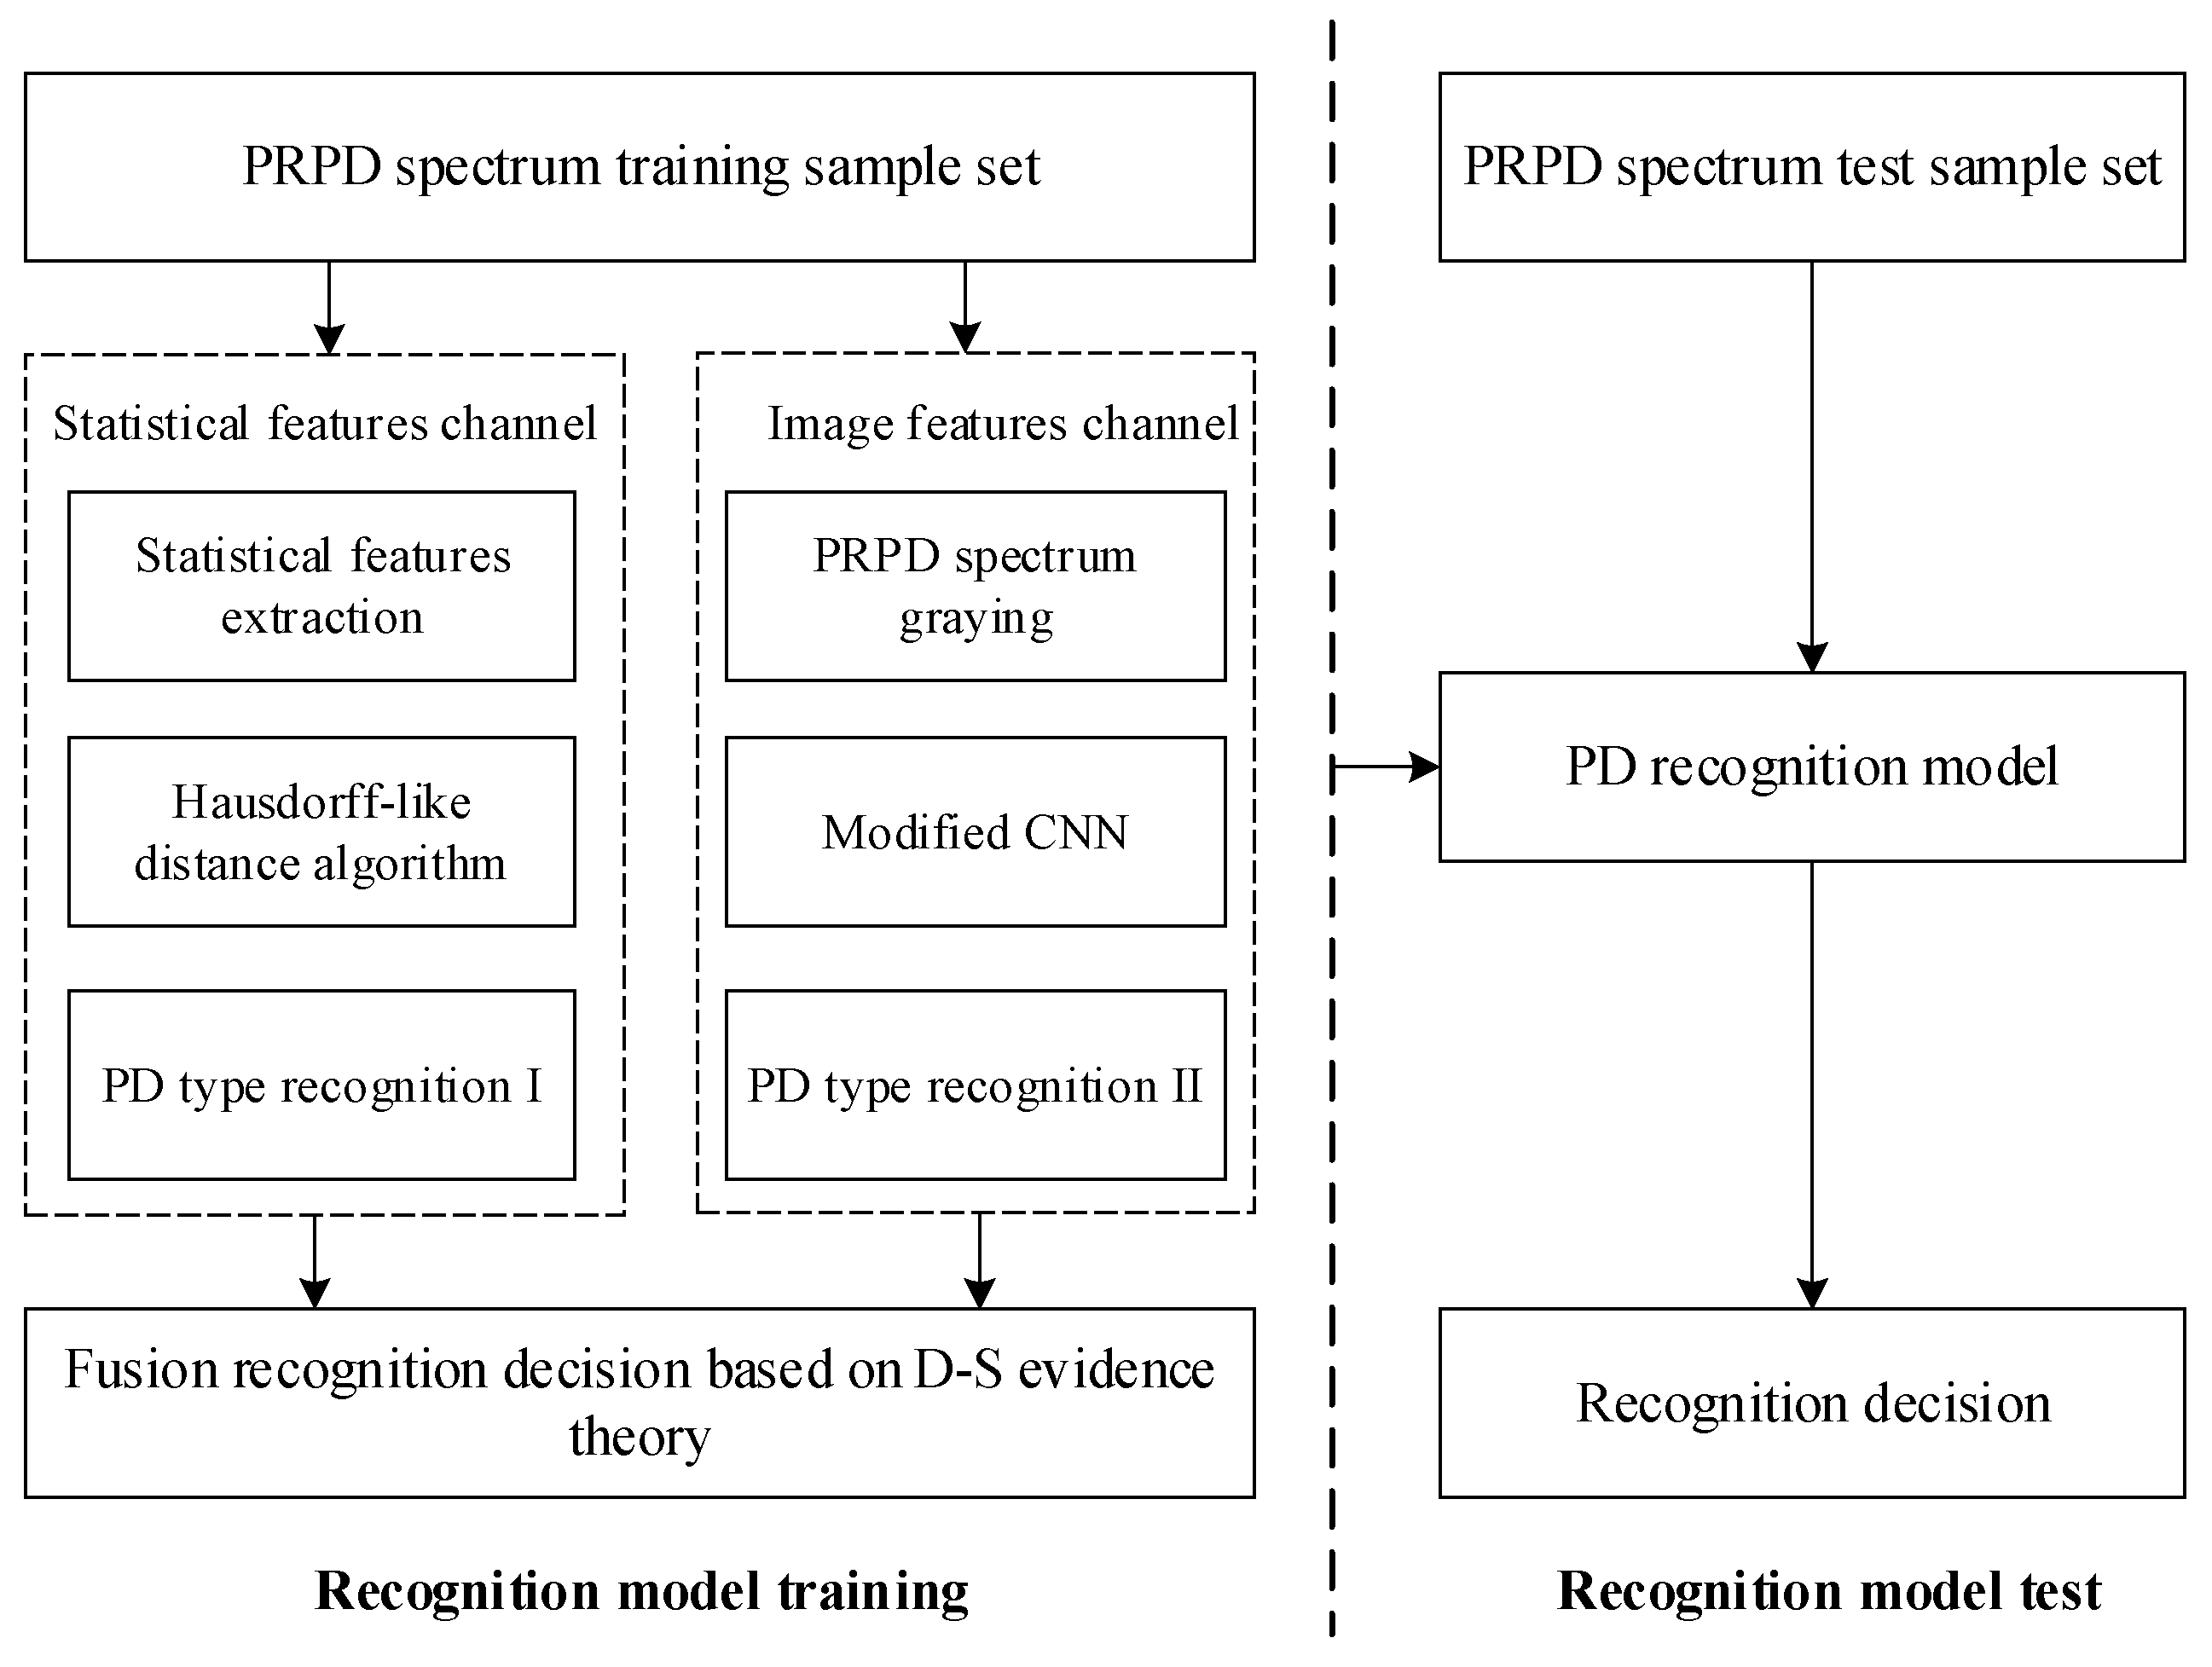
2.1. Method Overview

The overview of the proposed GIS PD pattern recognition method based on multi-feature information fusion of the PRPD image is illustrated in Figure 1. The pattern recognition method has two stages, including the recognition model training stage and the recognition model test stage and the recognition model stage which has two recognition channels, including the statistical features channel and the image features channel. The two channels both take the PRPD image as inputs, the outputs of these two channels are combined through the D–S evidence theory function, the results of which are then regarded as the GIS PD pattern recognition results.

2.2. Statistical Features Channel

The statistical features channel is implemented through the Hausdorff-like distance algorithm in this work. The statistical features of PRPD spectra extracted by statistical operators can reduce the influence of randomness of partial discharge to the greatest extent, with high robustness and simple steps. Hausdorff-like distance is a distance measure for two groups of feature vectors, and the nearest neighbor criterion is used to classify.

2.2.1. Statistical Features Extraction

The statistical calculation of one cycle PD signal can obtain three basic quantities: discharge frequency phase ( φ ), discharge energy (q), and discharge times (n). These 3 basic quantities are further processed to divide the local discharge signal of one cycle into m phase windows equally, and then calculate its φ , q, and n values for each phase window to obtain the φ i , q i and n i sequence. Then, these three sequence values are used for the four statistical features extraction in this work, including skewness ( S k ), kurtosis ( K u ), asymmetry phases ( Φ ) and phase correlation coefficient ( C c ) [19,20].
The skewness ( S k ) is used to describe the difference in the shape of the PRPD image, indicating the symmetric distribution of the image [21]. If the S k value is 0, the image is symmetrical; if the S k value is greater than 0, it means that the image is left; and if the S k value is less than 0, it means that the image is biased to the right. The skewness of the PRPD image can be computed as:
S k = i = 1 m φ i μ 3 · p i Δ φ / δ 3 ,
where m represents the number of phase windows in the half power frequency period of the PRPD image, φ i is the phase of the i-th phase window, Δ φ stands for the phase width, μ , p i and δ , respectively, denote the mean, probability density, and variance of PD in the i-th phase window of PRPD image as the φ i is the variable. In this paper, the S k in the positive half-cycle, negative half-cycle, and the whole power cycle are taken as three feature parameters ( l 1 , l 2 , l 3 ) of the PRPD image, which is used to describe the left and right skewness of PD distribution relative to the normal distribution in the corresponding phase window.
The kurtosis ( K u ) is used to describe the prominence of the PRPD image shape compared to the normal distribution. If the value is 0, the shape of the PRPD image is the same as the normal distribution; if its value is positive, it means that the shape of the PRPD image has a sharp and steep characteristic compared with the normal distribution. A negative value indicates that the shape of the PRPD image has a flattering feature compared to the normal distribution. In particular, kurtosis is defined as:
K u = i = 1 m φ i μ 4 p i Δ φ / δ 4 3 ,
The S k in the positive half-cycle, negative half-cycle, and the whole power cycle are taken as the other three feature parameters ( l 4 , l 5 , l 6 ) of the PRPD image, which is utilized to indicate the degree of protrusion of the PRPD image concerning the normal distribution in the corresponding phase window.
The phase asymmetry ( Φ ) is used to describe the asymmetry of phase values corresponding to max discharges of the PRPD image in the positive and the negative half of the voltage cycle, which can be expressed as:
Φ = φ φ + ,
where φ + and φ represent the phase values corresponding to max discharges of the PRPD image in the positive and the negative half of the voltage cycle, respectively. Then, the phase asymmetry ( Φ ) is defined as the feature parameter ( l 7 ).
The phase correlation coefficient ( C c ) is used to describe the degree of similarity between the positive and negative half cycles of the profile of the PRPD image. The closer the value is to 0, the greater the difference between the positive and negative half-perimetric shapes of the image. The closer its value is to 1, the smaller the difference between the positive and negative half-perimetric shape of the image. The C c is defined as:
C c = i = 1 n q i + · q i i = 1 m q i + · q i / m i = 1 m q i + 2 i = 1 m q i + 2 / m · i = 1 m q i 2 i = 1 m q i 2 / m ,
where q i + and q i represent the average discharge energy of positive and negative half cycles within the i-th phase window in the PRPD image, respectively. For different types of PD types, the correlation of positive and negative half-cycle distribution of the PRPD image is different, so the phase correlation coefficient ( C c ) is defined as the feature parameter ( l 8 ).
According to the above calculation, the statistical feature vector of the PRPD image can be expressed as [ l 1 , l 2 , l 3 , l 4 , l 5 , l 6 , l 7 , l 8 ], which including skewness ( S k ), kurtosis ( K u ), asymmetry phases ( Φ ) and phase correlation coefficient ( C c ). The S k indicates the symmetric distribution of the PRPD image, the K u is used to describe the prominence of the PRPD image shape compared to the normal distribution, the Φ is used to describe the asymmetry of phase values corresponding to max discharges of the PRPD image in the positive and the negative half of the voltage cycle, and C c is used to describe the degree of similarity between the positive and negative half of the voltage cycles. The combination of these features can fully reflect the shape characteristics of the PRPD image, so they are selected as feature vectors in this work.

2.2.2. Hausdorff-like Distance Algorithm

The Hausdorff distance algorithm is used to measure the similarity between two groups of feature vectors, and the nearest neighbor criterion is used to classify [22]. However, the Hausdorff distance algorithm is very sensitive to a single anomaly parameter. Therefore, to improve the adaptability of the algorithm to noise, this paper proposes a Hausdorff-like distance algorithm to realize the PD pattern recognition based on the statistical characteristics of the PRPD image.
The Hausdorff-like distance algorithm redefines the feature vector distance as the root mean square of the distance from each point in feature vector A to the nearest point in feature vector B, which can be expressed as:
h l ( A , B ) = 1 N i = 1 N min b j B a i b j 2 , a i A ,
where N denotes the dimension of feature vector a i b j represents the geometric distance between these two points. Therefore, the Hausdorff-like distance between vector A and B can be expressed as follows:
H L ( A , B ) = m a x ( h l ( A , B ) , h l ( B , A ) ) ,
which means the maximum of the feature vector distance from vector A to vector B and the distance from vector B to vector A.

2.2.3. Implementation of PD Type Recognition

The process of PD-type recognition is summarized below:
Step 1: The Hausdorff-like distance between statistical feature vectors of PRPD images in the training sample set is calculated, which is marked as H L ( A , B ) , A , B M , and M stand for the set of statistical feature vectors of the training PRPD images sample.
Step 2: Finding standard PRPD images’ statistical feature vectors for specific PD types. The statistical feature vectors of PRPD images training samples with the same PD type is marked as Q, and the maximum of the minimum Hausdorff-like distance between the statistical feature vectors within Q was calculated, which is marked as follows:
H A q = max A q Q min B q Q H L A q , B q .
The statistical feature vectors with the smallest H A q were taken as the standard PRPD images statistical feature vectors for this type of PD type, and marked as Q s .
Step 3: Calculate the critical classification Hausdorff distance d. The most Hausdorff distance between the statistical feature vectors of the PRPD images set with the same PD type and the type’s standard PRPD images’ statistical feature vectors is defined as the critical classification Hausdorff distance, which is marked as follows:
d = max A q Q H L A q , Q s ,
Step 4: Calculate the probability of PD pattern classification. The statistical feature vector Hausdorff distance H m s between the PRPD image to be identified and the standard PRPD image was calculated. The difference between the critical classification Hausdorff distance d and H m s is taken as the input, and the Sigmoid activation function is used to calculate the classification activation value. Finally, the Softmax function is used to process the relevant classification activation values and output the classification result probabilities of the four PD types.

2.3. Image Features Channel

The convolutional neural network is a kind of feedforward neural network with a deep structure including convolution calculation, which overcomes the limitations of traditional machine learning in feature selection methods. To accurately identify the four typical PD types, this paper develops a modified convolutional neural network to realize pattern recognition based on PRPD image features, as shown in Figure 2. This method uses multi-layer CNN as the feature extractor and introduces the global mean pooling technology to replace the fully connected layer part to reduce the training parameters and training time of the model. The structure of the modified CNN algorithm is mainly composed of an input layer, a feature extraction layer, and a classification output layer. The feature extraction layer is similar to the traditional CNN, which can contain multiple convolution layers, activation layers, and pooling layers stacked in turn. In the classification output layer, a global mean pooling layer is designed to replace the fully connected layer, and then the Softmax classifier is connected to PD pattern recognition.

2.3.1. Input Layer

The input layer is used to perform necessary operations such as standardization and format normalization on the acquired raw PRPD image, and convert the raw PRPD image into the type that the CNN model can train. In this paper, the collected raw PRPD image is first cut or supplemented into 100 × 100 pixel pictures. Since the grayscale image of the PRPD image can reflect all its information, this work uses image grayscale technology to convert the PRPD image into a grayscale image. The acquired raw PRPD image is an RGB image composed of red, green, and blue colors. The following formula can be used to gray:
H ( i , j ) = 0.30 R ( i , j ) + 0.59 G ( i , j ) + 0.11 B ( i , j ) ,
where H ( i , j ) represents the gray value at pixel ( i , j ) , R ( i , j ) , G ( i , j ) and B ( i , j ) are the red, green and blue components at pixel point ( i , j ) of the PRPD image, respectively.

2.3.2. Feature Extraction Layer

The feature extraction layer consists of three operating functions, including convolution operation, activation operation, and pooling operation. According to the needs of PD pattern recognition, the feature extraction layer is constructed by alternately stacking multiple operating functions.
The convolution operation has multiple convolution kernels, and its essence is to operate on the receptive field by moving the convolution kernel. Each element that makes up the convolution kernel contains a weight coefficient and bias [23]. The convolution operation can be regarded as the convolution between the convolution kernel and the feature maps of the previous layer, and the output feature maps are formed by nonlinear transformation through the excitation function. The specific calculation can be expressed as follows:
X i , j l + 1 = f j = 1 L i = 1 m X i , j l × w i , j l + b ,
where X i , j l denotes the j-th eigenvalue of the i-th feature map in the l-th layer of the network, L represents the width of the convolution kernel, m is the height of the convolution kernel, w i , j l indicates the weight coefficient, b is the bias, and f ( · ) is the activation function. In this work, the Relu activation function is selected to complete nonlinear changes and improve the expression ability of the model.
As the convolution operation increases the number of output feature maps, the output dimension also increases sharply while the feature extraction ability is improved, which is easy to cause dimensional disaster. The pooling operation is used to minimize the dimension of the output feature map without losing the original main features, which not only reduces the calculation of parameters but also selects the main representative features. In this work, the maximum pooling operation is used to calculate the pooling output, which is defined as follows:
Y i = max X i n × n r ( n , n ) ,
where Y i stands for the pooling operation output, X i n × n is the i-th n × n size region, r ( n , n ) represents a pooling window of size n × n . The pooling window traverses the entire feature map by sliding, so as to realize the pooling operation of all signals.

2.3.3. Classification Output Layer

The classification output layer consists of global average pooling operation and Softmax classifier [24]. The global average pooling technology is introduced to replace the fully connected operation in the traditional convolutional neural network to reduce the training parameters and testing time of the model. The global average pooling operation is used to integrate the local features which are extracted in the feature extraction layer.
The previous layer of the global average pooling operation is the convolution operation. For the n classification problem, the output dimension of the convolution kernel of the last convolutional operation in the feature extraction layer can be set to n, thus n output feature maps will be obtained. Then, n global average pooling kernels are used to obtain the mean value corresponding to each pooling kernel. That is, by making each feature map generate a value, we can obtain n values that are equivalent to the output of the fully connected layer. In the last, the n values are passed to the Softmax classifier. The mathematical expression for global average pooling can be written as:
S avg - pooling l = 1 h · w i = 1 h j = 1 w X i , j l ,
where S avg - pooling l represents the result obtained by global average pooling in l-th layer, X i , j l indicates that the output feature map pixels, and the X i , j l area corresponding to the mean pooling kernel ranges from pixels in row 1 to row h in the horizontal direction and from pixels in column 1 to column w in the vertical direction.
The Softmax function is used to complete the design of the Softmax classifier. Suppose that the set of training input samples is X = x 1 , x 2 , , x i , , x T , and the category of the input sample elements is one of the set C = c 1 , c 2 , , c k , , c K , and then the probability of classifying the input sample x i to be c k which is one of the set C can be expressed by the Softmax function as follows:
P c k x i = e x i T c k 1 k = 1 K e x k T c k ,
where, e x i T c k is the correlation between category c k and the entire classification category x i , and 1 / k = 1 K e x k T c k is the normalization function.

2.4. Fusion Recognition Decision Based on D–S Evidence Theory

In this paper, D–S evidence theory is used to fuse the PD pattern recognition results based on PRPD image statistical features and image features [25,26], to improve the accuracy of PD pattern recognition. This paper identifies four PD types, and the recognition result set can be expressed as: θ = A 1 , A 2 , A 3 , A 4 . The PD pattern recognition results based on PRPD image statistical features and image features were used as two independent pieces of evidence. Then, the trust function of each piece of evidence can be expressed as:
m i A j = α i A j j = 1 4 A j ,
where α i is the reliability coefficient of the i-th evidence, the value domain is 0∼1, and the larger values represent the more credible evidence. In this paper, the α 1 = 0.8 for image statistical features and the α 2 = 0.9 for image features. The PD pattern recognition accuracy of individual evidence is used as its reliability coefficient in this work. Dempster’s rule of combination is used to calculate the final decision result under the pieces of evidence from the two recognition models. In other words, Dempster’s rule of combination is the final output of the two recognition models’ fusion. Then, the calculation formula can be expressed as:
m A j = m 1 m 2 A j = 1 1 K D C = A j m 1 ( D ) m 2 ( C )
where D and C are the two subsets of the recognition result set θ , and K is the conflict coefficient, which can be expressed as:
K = D C m 1 ( D ) m 2 ( C ) .
The D–S evidence combination theory is used to fuse the results obtained from the two recognition models, which can more accurately identify the partial discharge pattern.

3. Experimentation

To facilitate the verification of the proposed PD pattern recognition method, a PD experiment platform was set up in the laboratory environment with a PD detector as the acquisition equipment. In particular, the PD signals for 4 PD types including corona discharge (CD), free metal discharge (FMD), surface discharge (SD), and floating electrode discharge (FED) were acquired for recognition model training and testing. In this experiment, 250 sets of PD signals were acquired for each PD type, and 1000 sets of PD signals were acquired in total. Then, the discharge frequency phase ( φ ), discharge energy (q), and discharge times (n) of the PD signal in each power frequency cycle were obtained by statistical calculation. The PD PRPD image was constructed based on these three basic quantities, as shown in Figure 3.
There are obvious characteristic differences among the PRPD image of various PD types: the phase distribution of PD pulse in the corona discharge type is mainly located at the peak of applied voltage, and the amplitude is high. Under the free metal discharge type, the PD pulse phase distribution is relatively scattered, the discharge times are less, and the discharge quantity is average and spread throughout the whole phase. The PD pulse phase distribution under the surface discharge type is mainly located at the rising edge of the positive half circumference and the falling edge of the negative half circumference. The PD pulse phase distribution of the floating electrode discharge type is symmetrical at the peak of the applied voltage.

3.1. Recognition Performance Based on Different Size Training Sets

To verify the recognition performance based on different size training sets of the PD pattern recognition method proposed in this paper, the acquired 1000 PRPD sets are divided into training sets and test sets randomly according to the ratio of 0.8:0.2, 0.6:0.4 and 0.4:0.6. Three recognition models were obtained by using their three training sets for three times model training. Then, the three test sets are, respectively, input into these three recognition models, and the recognition results obtained are shown in Figure 4. The diagonal black box indicates the number of samples whose predicted type is consistent with the actual type, the white box represents the number of incorrectly identified samples, the last row gray box represents the precision rate of the recognition model and refers to the number of correctly predicted samples divided by the total number of predicted samples. The last column gray box represents the recall rate, which refers to the number of correctly predicted samples divided by the total number of actual samples. The dark gray box at the end represents the total recognition accuracy rate.
It is clear that the recognition precision rate and the recall rate are both high as the ratio of training sets and test sets is 0.8:0.2, exceeding 93%. The precision rate of floating electrode discharge reached 95.95%, the recall rate of corona discharge reached 94.55%, and the total recognition accuracy rate is 94.00%. As the number of training set decreases, both the recognition precision rate and recall rate decrease. When the ratio of training sets and test sets is 0.4:0.6, the recognition precision rate and recall rate are both lower than 89%. Moreover, corona discharge and surface discharge are easy to identify confusion, and free metal discharge and floating electrode discharge are easy to identify confusion.

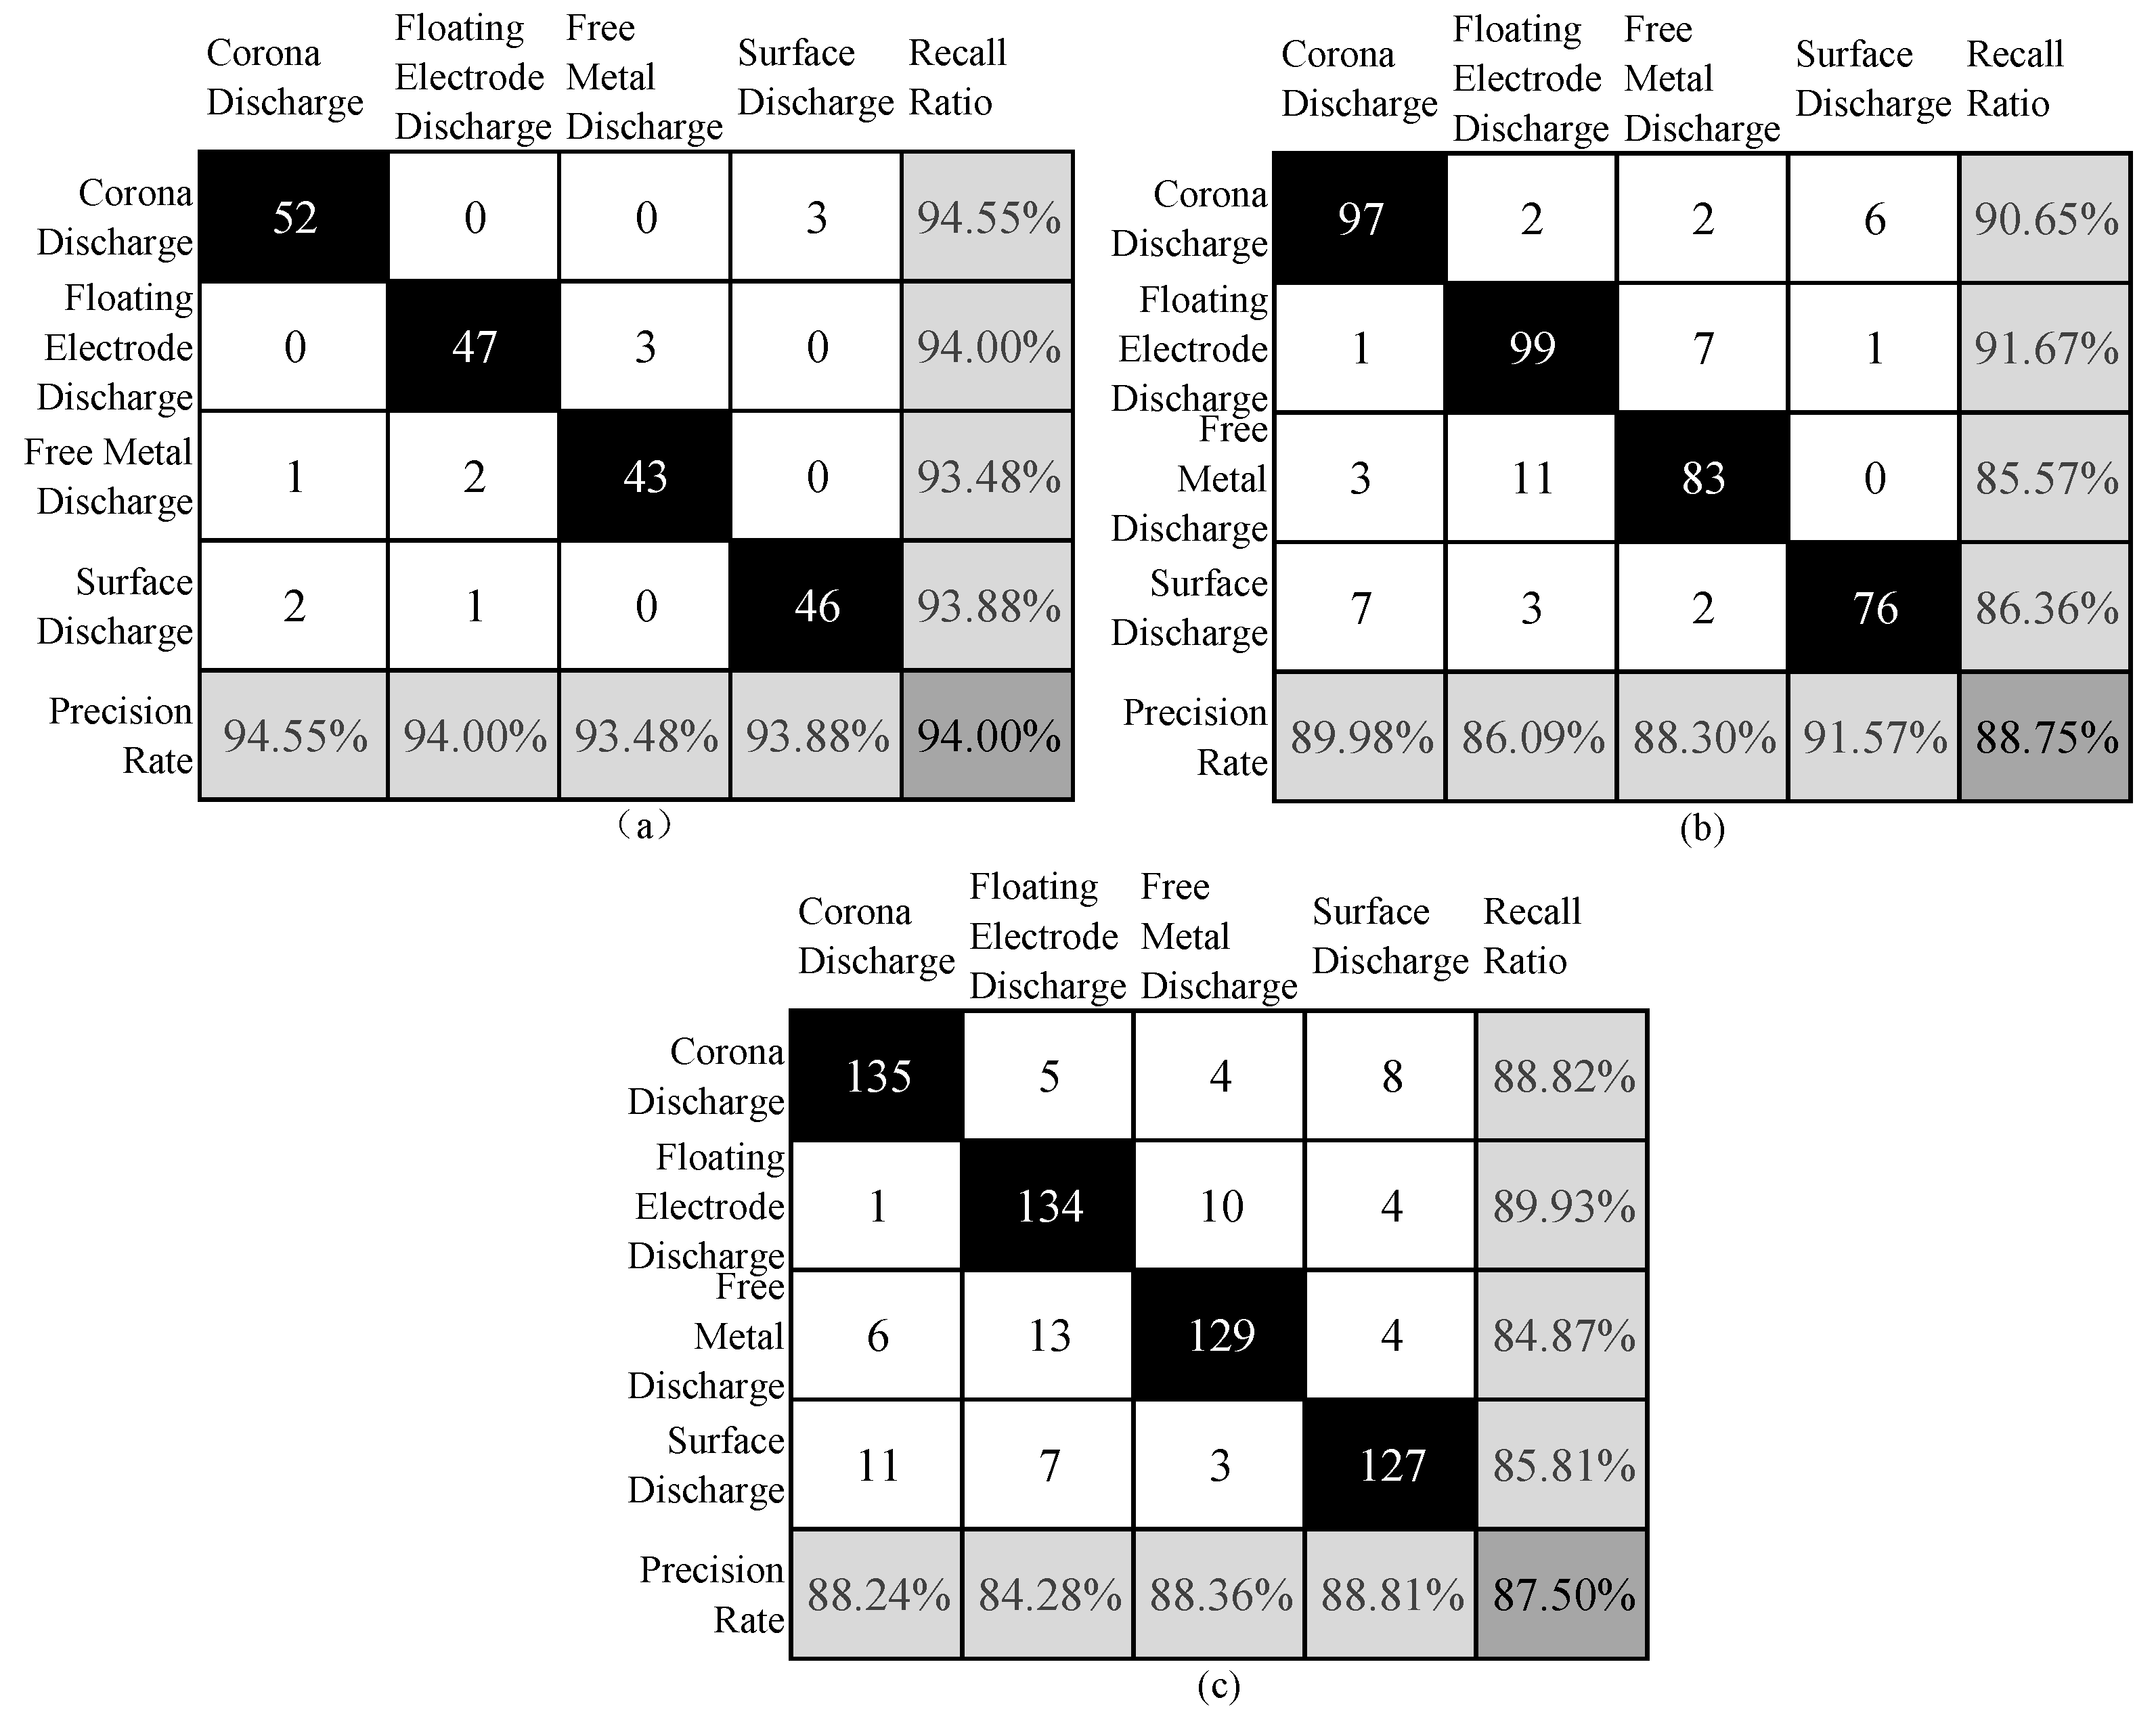
3.2. Recognition Performance Based on Different Recognition Method

To verify the performance of the proposed recognition model, a support vector machine (SVM) and normal convolutional neural network (CNN) algorithm are used to conduct comparative experiments, and then the recognition results are compared and analyzed. In particular, the SVM uses the statistical features of the PRPD image and chooses the radial basis function as the kernel function with the parameter of 0.01 and a penalty factor of 1200. The traditional convolutional neural network algorithm adopts PRPD spectrogram image features, and its recognition process is detailed in Section 2.3.
According to the above experiment, increasing the number of training samples helps to improve the precision rate and recall rate. Therefore, in this experiment, the acquired 1000 PRPD sets are divided into training sets and test sets randomly according to the ratio of 0.8:0.2. The recognition results of normal CNN and SVM are shown in Figure 5. The total recognition accuracy rates based on SVM, normal CNN, and the proposed method are 85.50% and 86.00%, respectively. The normal CNN has a good effect on corona discharge and floating electrode discharge recognition, the precision rate is 88.24% and 88.89%, and the recall rate reaches 86.54% and 90.57%, respectively. The recognition performance of surface discharge is relatively poor, it is mainly manifested as a low precision rate and recall rate, as 82.61% and 79.17%, respectively. The SVM has a good effect on surface discharge recognition, and the precision rate and the recall rate reach 89.13% and 87.76%, respectively. It can be seen that the recognition performance of these two methods does not reach satisfactory results.
The recognition performance improvement of the proposed recognition method in this paper compared with normal CNN and SVM for the four PD types are summarized in Figure 6. It can be seen that the precision rate and recall rate of the proposed method is significantly improved compared with normal CNN, the precision rate improved by more than 9%, except for floating electrode discharge, the recall rate of the other three PD types increased by more than 9%. The normal CNN realizes the PD type recognition by automatically obtaining PRPD map features. The shape and contour of similar images are relatively close, which seriously affects the accuracy of the local placement pattern recognition [27]. In contrast to SVM, the precision rate and recall rate of the proposed method also have significantly improved, the lowest promotion is the precision rate of floating electrode discharge recognition which is 5%. SVM uses the statistical characteristic parameter for PD-type recognition. For very close statistical characteristic parameter values, it is difficult to accurately identify PD type by a single analysis [28]. The method proposed in this paper improves the accuracy of PD-type recognition by complementing the advantages of image features and statistical features. Overall, the recognition model proposed in this paper is better than normal CNN and SVM in terms of PD pattern recognition.

3.3. Field Case Analysis

The recognition model trained by the experimental data is applied to the PD pattern recognition of GIS in the field, and the practical application effect of the model is tested. PD signals were collected at a GIS substation in Pingdingshan, the photo of the field acquisition process is given in Figure 7.
A randomly selected PRPD image is shown in Figure 8, the phase distribution of PD pulse spread at the peak of applied voltage and has a certain symmetry. The PRPD image is input into the trained recognition model, and the output result is determined that the possibility of floating electrode discharge is 99.2%, which needs to be paid more attention to and repaired as soon as possible.
A large number of PRPD images of unknown types were collected in the field and input to the trained recognition model for classification, the output results are shown in Table 1. Among them, the number of surface discharge and floating electrode discharge defects was more, which were 19 and 26, respectively. The number of corona discharge and free metal discharge was small, with only 2 and 5, respectively. The detection pattern recognition results have a certain reference value.

4. Conclusions

PD pattern recognition plays a key role in evaluating the insulation state of gas-insulated switchgear. Focusing on improving the PD accuracy of PD pattern recognition, this paper presents a GIS PD pattern recognition method based on multi-feature information fusion of the PRPD image. In particular, the proposed method has two recognition channels: the Hausdorff-like distance algorithm recognition channel supported by PRPD statistical features, and the modified CNN recognition channel based on the automatically extracted image feature. The results based on two case experiments demonstrate that increasing the number of training samples could improve the recognition accuracy rate, and using the same training samples, the recognition accuracy rate of the proposed method is significantly improved compared to SVM and normal CNN.

Author Contributions

K.Y. contributed to the conception of the study, the background research, method design and analysis of the experimental results; Y.W. performed methodological guidance and writing review; S.L. and P.L. wrote the manuscript; Y.X. provided methodological guidance, writing review and funding support; B.L. reviewed and revised the manuscript; K.D. carried out the experiment. All authors have read and agreed to the published version of the manuscript.

Funding

This research is funded by the Project of the Science and Technology Department of Henan Province under Grant 222102220116, Grant 212102210017, and Grant 222102210152, and by the High-level talent start-up fund of Pingdingshan University under Grant PXY-BSQD-2021019.

Institutional Review Board Statement

The study was conducted in accordance with the Declaration of Helsinki, and approved by the Institutional Review Board of School of Electrical and Mechanical Engineering Academic Committee.

Informed Consent Statement

Informed consent was obtained from all subjects involved in the study.

Data Availability Statement

Not applicable.

Conflicts of Interest

The authors declare no conflict of interest.

References

  1. Han, X.; Li, J.; Zhang, L.; Pang, P.; Shen, S. A novel pd detection technique for use in gis based on a combination of uhf and optical sensors. IEEE Trans. Instrum. Meas. 2018, 68, 2890–2897. [Google Scholar] [CrossRef]
  2. Mor, A.R.; Heredia, L.C.C.; Muñoz, F.A. A novel approach for partial discharge measurements on gis using hfct sensors. Sensors 2018, 18, 4482. [Google Scholar]
  3. Jing, Q.; Yan, J.; Lu, L.; Xu, Y.; Yang, F. A novel method for pattern recognition of gis partial discharge via multi-information ensemble learning. Entropy 2022, 24, 954. [Google Scholar] [CrossRef] [PubMed]
  4. Li, P.; Peng, X.; Yin, K.; Xue, Y.; Wang, R.; Ma, Z. 3d localization method of partial discharge in air-insulated substation based on improved particle swarm optimization algorithm. Symmetry 2022, 14, 1241. [Google Scholar] [CrossRef]
  5. Wu, Z.; Lyu, B.; Zhang, Q.; Liu, L.; Zhao, J. Phase-space joint resolved pd characteristics of defects on insulator surface in gis. IEEE Trans. Dielectr. Electr. Insul. 2020, 27, 156–163. [Google Scholar] [CrossRef]
  6. Araújo, R.C.; de Oliveira, R.M.; Barros, F.J. Automatic prpd image recognition of multiple simultaneous partial discharge sources in on-line hydro-generator stator bars. Energies 2022, 15, 326. [Google Scholar] [CrossRef]
  7. Wang, Y.; Yan, J.; Sun, Q.; Li, J.; Yang, Z. A mobilenets convolutional neural network for gis partial discharge pattern recognition in the ubiquitous power internet of things context: Optimization, comparison, and application. IEEE Access 2019, 7, 150226–150236. [Google Scholar] [CrossRef]
  8. Xu, Y.; Qian, Y.; Yang, F.; Li, Z.; Sheng, G.; Jiang, X. Dc cable feature extraction based on the pd image in the non-subsampled contourlet transform domain. IEEE Trans. Dielectr. Electr. Insul. 2018, 25, 533–540. [Google Scholar] [CrossRef]
  9. Soltani, A.A.; Shahrtash, S.M. Decision tree-based method for optimum decomposition level determination in wavelet transform for noise reduction of partial discharge signals. IET Sci. Meas. Technol. 2020, 14, 9–16. [Google Scholar] [CrossRef]
  10. Peng, X.; Li, J.; Wang, G.; Wu, Y.; Li, L.; Li, Z.; Bhatti, A.A.; Zhou, C.; Hepburn, D.M.; Reid, A.J.; et al. Random forest based optimal feature selection for partial discharge pattern recognition in hv cables. IEEE Trans. Power Deliv. 2019, 34, 1715–1724. [Google Scholar] [CrossRef]
  11. Li, X.; Wang, X.; Yang, A.; Rong, M. Partial discharge source localization in gis based on image edge detection and support vector machine. IEEE Trans. Power Deliv. 2019, 34, 1795–1802. [Google Scholar] [CrossRef]
  12. Adam, B.; Tenbohlen, S. Classification of multiple pd sources by signal features and lstm networks. In Proceedings of the 2018 IEEE International Conference on High Voltage Engineering and Application (ICHVE), Athens, Greece, 10–13 September 2018; pp. 1–4. [Google Scholar]
  13. Song, H.; Dai, J.; Sheng, G.; Jiang, X. Gis partial discharge pattern recognition via deep convolutional neural network under complex data source. IEEE Trans. Dielectr. Electr. Insul. 2018, 25, 678–685. [Google Scholar] [CrossRef]
  14. Wang, Y.; Yan, J.; Yang, Z.; Zhao, Y.; Liu, T. Gis partial discharge pattern recognition via lightweight convolutional neural network in the ubiquitous power internet of things context. IET Sci. Meas. Technol. 2020, 14, 864–871. [Google Scholar] [CrossRef]
  15. Li, G.; Wang, X.; Li, X.; Yang, A.; Rong, M. Partial discharge recognition with a multi-resolution convolutional neural network. Sensors 2018, 18, 3512. [Google Scholar] [CrossRef] [PubMed] [Green Version]
  16. Karimi, M.; Majidi, M.; MirSaeedi, H.; Arefi, M.M.; Oskuoee, M. A novel application of deep belief networks in learning partial discharge patterns for classifying corona, surface, and internal discharges. IEEE Trans. Ind. Electron. 2019, 67, 3277–3287. [Google Scholar] [CrossRef]
  17. Nguyen, M.-T.; Nguyen, V.-H.; Yun, S.-J.; Kim, Y.-H. Recurrent neural network for partial discharge diagnosis in gas-insulated switchgear. Energies 2018, 11, 1202. [Google Scholar] [CrossRef] [Green Version]
  18. Liu, T.; Yan, J.; Wang, Y.; Xu, Y.; Zhao, Y. Gis partial discharge pattern recognition based on a novel convolutional neural networks and long short-term memory. Entropy 2021, 23, 774. [Google Scholar] [CrossRef] [PubMed]
  19. Janani, H.; Shahabi, S.; Kordi, B. Separation and classification of concurrent partial discharge signals using statistical-based feature analysis. IEEE Trans. Dielectr. Electr. 2020, 27, 1933–1941. [Google Scholar] [CrossRef]
  20. Janani, H.; Jayasinghe, P.; Jozani, M.J.; Kordi, B. Statistical feature extraction and system identification algorithms for partial discharge signal classification using laguerre polynomial expansion. IEEE Trans. Dielectr. Electr. Insul. 2020, 27, 1924–1932. [Google Scholar] [CrossRef]
  21. Khan, Q.; Refaat, S.S.; Abu-Rub, H.; Toliyat, H.A. Partial discharge detection and diagnosis in gas insulated switchgear: State of the art. IEEE Electr. Insul. Mag. 2019, 35, 16–33. [Google Scholar] [CrossRef]
  22. Liu, Q.; Peng, H.; Chen, J.; Gao, H. Design and implementation of parallel algorithm for image matching based on hausdorff distance. Microprocess. Microsyst. 2021, 82, 103919. [Google Scholar] [CrossRef]
  23. Wang, Z.J.; Turko, R.; Shaikh, O.; Park, H.; Das, N.; Hohman, F.; Kahng, M.; Chau, D.H.P. Cnn explainer: Learning convolutional neural networks with interactive visualization. IEEE Trans. Vis. Comput. Graph. 2020, 27, 1396–1406. [Google Scholar] [CrossRef]
  24. Alzubaidi, L.; Zhang, J.; Humaidi, A.J.; Al-Dujaili, A.; Duan, Y.; Al-Shamma, O.; Santamaría, J.; Fadhel, M.A.; Al-Amidie, M.; Farhan, L. Review of deep learning: Concepts, cnn architectures, challenges, applications, future directions. J. Big Data 2021, 8, 1–74. [Google Scholar] [CrossRef] [PubMed]
  25. Bogoya, J.M.; Vargas, A.; Schütze, O. The averaged hausdorff distances in multi-objective optimization: A review. Mathematics 2019, 7, 894. [Google Scholar] [CrossRef] [Green Version]
  26. Aksoy, S.G.; Nowak, K.E.; Purvine, E.; Young, S.J. Relative hausdorff distance for network analysis. Appl. Netw. Sci. 2019, 4, 80. [Google Scholar] [CrossRef] [Green Version]
  27. Wang, Y.; Yan, J.; Yang, Z.; Jing, Q.; Wang, J.; Geng, Y. Gan and cnn for imbalanced partial discharge pattern recognition in gis. High Volt. 2022, 7, 452–460. [Google Scholar] [CrossRef]
  28. Ling, Y.; Bai, D.; Wang, M.; Gong, X.; Gu, C. Svm-based partial discharge pattern classification for gis. J. Phys. Conf. Ser. 2018, 960, 012051. [Google Scholar] [CrossRef]
Figure 1. The overview of the proposed GIS PD pattern recognition method.
Symmetry 14 02464 g001
Figure 2. The Network structure of PD pattern recognition based on modified convolutional neural network.
Symmetry 14 02464 g002
Figure 3. Typical PRPD map for each PD type.
Symmetry 14 02464 g003
Figure 4. The recognition results of three recognition models under different size training sets: (a) The ratio of training sets and test sets is 0.8:0.2; (b) The ratio of training sets and test sets is 0.6:0.4; (c) The ratio of training sets and test sets is 0.4:0.6.
Symmetry 14 02464 g004
Figure 5. The recognition results of normal CNN and SVM: (a) The normal CNN recognition results; (b) The SVM recognition results.
Symmetry 14 02464 g005
Figure 6. The recognition performance improvement of the proposed recognition method compared with normal CNN and SVM: (a) The precision rate results; (b) The recall rate results.
Symmetry 14 02464 g006
Figure 7. The photo of PD signals field acquisition process at a GIS substation.
Symmetry 14 02464 g007
Figure 8. A randomly selected PRPD image.
Symmetry 14 02464 g008
Table 1. Recognition results of PRPD image of unknown PD defects.
PD Defect TypeCorona DischargeFloating Electrode DischargeFree Metal DischargeSurface DischargeTotal
Number22651952
Publisher’s Note: MDPI stays neutral with regard to jurisdictional claims in published maps and institutional affiliations.

