Article

Inclusive Charged-Particle Kinematic Distributions at LHC Energies: Data versus Theory

1
Department of Physics, Abdul Wali Khan University Mardan, Mardan 23200, Pakistan
2
School of Nuclear Science and Technology, University of Chinese Academy of Sciences, Beijing 100049, China
3
Department of Physics, Islamia College Peshawar, Peshawar 25120, Pakistan
4
Department of Basic Sciences, Shanxi Agricultural University, Jinzhong 030801, China
5
Department of Physics, College of Science, Princess Nourah bint Abdulrahman University, P.O. Box 84428, Riyadh 11671, Saudi Arabia
6
Department of Physics, College of Sciences, University of Bisha, P.O. Box 344, Bisha 61922, Saudi Arabia
7
Physics Department, Faculty of Science, Al-Azhar University, Assiut 71524, Egypt
*
Authors to whom correspondence should be addressed.
Symmetry 2022, 14(11), 2401; https://doi.org/10.3390/sym14112401
Submission received: 8 October 2022 / Revised: 24 October 2022 / Accepted: 10 November 2022 / Published: 13 November 2022
(This article belongs to the Section Physics)

Abstract

:
The transverse momentum distributions of inclusive charged particles in pseudorapidity bins with a width of 0.2 are reported for a simulation study of PYTHIA8, Sibyll, and EPOS. The models’ predictions are compared with the experimental measurements reported by the CMS experiment in symmetric p p collisions, allowing the maximum energy for new particle production at s = 0.9, 2.36, and 7 TeV. While comparing the models’ predictions with the data, we found that the default module of the PYTHIA model reproduced a good prediction of the data because it tuned the lower cut-off phase space parameter of the transverse momentum. In the second place, the EPOS model reproduced predictions that were close to the data, while the Sibyll model reproduced the data in a narrow region of the p T distributions. In addition to that, the fit of the p T distribution of the data by the standard distribution function was used to obtain the effective temperature of the hadronic medium. The effective temperature increased with an increase in the pseudorapidity and had a more significant value at higher center-of-mass energies, which may indicate a change in the reaction mechanism or possible formation of a different phase of hadronic matter.

1. Introduction

In high-energy particle collisions, the transverse momentum spectra and pseudorapidity distributions of charged particles account for some of the fundamental physical quantities and the mechanism of the production of particles [1,2,3,4]. In the literature, such and other similar studies can be found in [5,6,7,8,9,10]. These studies offer precise measurements of the production of particles in event generators such as PYTHIA [11,12], Sibyll [13], EPOS [14], and QGSJET [15]. The models are used to make predictions, such as inExtensive Air Shower simulations and physics beyond the standard model. Additionally, such analyses are vital to the understanding of ultra-relativistic heavy-ion collisions for the possible formation of hot and dense nuclear matter that is called quark gluon plasma [16,17] after passing through several phases of this nuclear matter. In the present work, we used Sibyll2.3d, EPOS LHC, and the three available modules of Parton showers in PYTHIA8.307 (Simple shower, Vincia shower, and Dire shower) and compared them with the experimental measurements. For simplicity, we will use Pythia, Sibyll, and EPOS throughout this manuscript. The CMS collaboration measured the transverse momentum distributions of all charged particles in small bins of pseudorapidity [18,19]. The transverse momentum was measured from 0.1 to 2 GeV/c, while the range of pseudorapidity used was 0.0 to 2.4 in bins of 0.2. We followed the same initial conditions in our simulations and compared the models’ predictions with the experimental measurements at 0.9, 2.36, and 7 TeV [18,19]. A symmetric system of p p collisions was used for the measurements, which were reproduced in the models at the above-mentioned center-of-mass energies. A symmetric system has the advantage of allowing the maximum energy to be available for the production of new particles. Therefore, the asymmetric fixed-target experiments were replaced by symmetric collider experiments. Although an asymmetric system can be obtained in the colliders by making the colliding particles’ mass and energy different, a symmetric system has the advantage of producing an extremely hot and energy-dense medium of the produced particles, which is required in most heavy-ion collision studies [20].
In addition to the comparison of the models’ predictions with the experimental data, we analyzed the measurements with a fit procedure. We used the standard distribution function and extracted the effective temperature from the transverse momentum spectra for each pseudorapidity bin. We compared the values of the effective temperature at different values of | η | and the three different energies. Since the temperature extracted by the standard distribution has the same meaning as that in the ideal gas model, we used this distribution to fit the experimental data, and we included the standard distribution index (S) and chemical potential ( μ ). In the standard distribution, the probability density function depending on p T has the following form [21]:
f p T ( p T , T ) = 1 N d N d p T = C p T m T y min y max cosh y × exp m T cosh y μ T + S 1 d y ,
In this equation, m T is the transverse mass, which is given by
m T = p T 2 + m 0 2 ,
where p T is the transverse momentum, m 0 is rest mass of the particle, and N is the number of particles. y min and y max represent the minimum and maximum rapidity, respectively. The values of the parameter S for bosons and fermions, respectively, are −1 and +1, while C is a normalization constant, which normalizes the integral of Equation (1) to unity.
Furthermore, the value of μ in Equation (1) depends on the particle, in which i shows the type of particle. The chemical potential ( μ i ) is given by the following: Equation [22,23,24].
μ i = 1 2 T c h ln k i .
The ratio of negatively charged particles to the corresponding positively charged particles is given by k i . In the statistical thermal model, T c h is used to represent the chemical freeze-out temperature [25,26,27,28] and can be shown as follows:
T c h = T lim 1 + exp 2.60 ln s N N / 0.45
In Equation (3), the saturation temperature is T lim = 0.1580 GeV [29]. Similar studies presenting model predictions with measurements are reported in [30,31,32,33,34,35,36,37,38,39,40]. The rest of the paper is organized as follows: The introduction section is followed by a section on the method and formalism (Section 1), where the event generators and the fit function are briefly described. Section 3 contrasts the model predictions with the experimental data for comparison, and a detailed discussion is outlined. The results of the fit procedure are also presented in this section. Finally, a summary and conclusions are given in Section 4.

2. The Method and Formalism

2.1. PYTHIA8.3

The Pythia MC event generator [41] was used to generate particles at a high energy, where the color force, which was governed by quantum chromodynamics (QCD), was dominant. This model was based on the production of multiparticles between collisions at the fundamental scale. This implies hard interactions between subatomic particles, such as pp, ep, and ee collisions. This can be used to compare theoretical data or detector corrections and provide opportunities for further experiments. PYTHIA6, an older version of PYTHIA8, has an improved version of the combination of the PYTHIA5, JETSET7, and SPYTHIA programs. The model can be used for numerous phenomenological problems in high-energy physics, neutrino physics, and astroparticle and nuclear physics. The model uses the Lund string mode for particle production and hadronization. The historical background and primary development of the Pythia and jetset models are given in [42]. The Pythia model has three main parts. These are the (i) process level, (ii) parton level, (iii) and hadron level. Resonances with short mean lifetimes and processes with higher transverse momenta are included in the process level. At high-energy scales, the second process is perturbatively described with a limited number of particles. The third process includes the emission of initial and final state particles, where different parton shower models are used. The last process also includes multiparton interactions, color reconnection, and the treatment of beam remnants. Finally, an event consists of a partonic structure that includes jets and the underlying event description. The third level takes care of the confinement of partons into color singlet systems of hadrons by QCD. In the Pythia model, hadronization is represented by color strings that fragment into hadrons. From the user’s point of view, PYTHIA8.3 is a C++ library. The model offers comprehensive choices for modeling a large number of physical processes that take place in collider experiments. The model offers three modules for parton shower simulations. These are the Simple/Default, Vincia, and Dire showers. (1) The Default/Simple parton shower: In Pythia8, this is the default and the earliest algorithm of parton showers. The origin of this module is the mass-ordered showers in PYTHIA/JETSET [43,44,45,46]. The model combines the evolution of a shower of initial state interactions and final state interactions with multiparton interactions in one sequence. The Default shower provides a large selection of matching and merging methods compared to the Vincia or Dire parton shower models. (2) The Vincia antenna shower is based on the antenna formalism. This model was first used by the ARIADNE model [47,48]. The Vincia shower implements an interleaved p T -ordered evolution. Vincia shares many features with ARIADNE in the final state interaction of QCD radiation. The treatment of the Vincia model is different from the ARIADNE model for initial state reactions. (3) The Dire parton shower is an alternative parton showering model [49]. The purpose of this parton shower is to use the modeling of soft-emission effects from dipole showers. The Dire module aims to combine the dipole shower in an antenna with the parton showers. This model is described in [50,51,52,53,54,55].

2.2. Sibyll

Sibyll [13,56,57] is an MC event generator that is based on the Dual Parton Model and Lund MC fragmentation. Sibyll is a standard event generator in the simulation of extensive air showers. The design of Sibyll is based on the production of projectiles and targets. The main focus of the Sibyll model is its use for the development of extensive air showers. Sibyll2.3d is the latest version of the model. Elements of the Gribov–Regge theory are represented in the newer version of Sibyll. The DPM is based on quarks and diquarks that are used by Sibyll. The Sibyll model also makes use of the Minijet [58,59,60] and Lund MC fragmentation models [61,62].

2.3. EPOS

EPOS is a quantum-mechanical energy-conserving model that utilizes a multi-scattering approach. The model is based on the parton ladder, its splitting, and its off-shell remnants. This is an MC event generator that is used for hadronic interactions in which the exchange of partons between two hadrons for their interaction occurs [63]. There are different versions of the EPOS model. Before describing the EPOS LHC, we will briefly describe the EPOS-1.99 version of the model.

2.3.1. EPOS1.99

EPOS is a widely used nuclear and hadronic interaction model. The EPOS-1.61 was the first version of EPOS, which was also based on the multi-scattering Gribov–Reggi theory. When used in air shower simulation programs such as CORSIKA [64], the older version EPOS-1.61 is used to treat low-energy interactions. In the EPOS-1.99 model, the high-density effects are also considered, leading to a collective effect in the collisions of heavy nuclei. The parton model introduces gluons and quarks, which interact with the exchange of gluons. According to this model, there are two parts of the parton ladder. One is the hard part, which is responsible for the hard scattering of the partons, while the second part is the soft part, which is parameterized for the Regge pole.

2.3.2. EPOS LHC

The EPOS LHC is a post-LHC model that depends on the scattering of multiple partons in the Grebov–Regge theory. To reproduce experimental data on hadronic interactions, the EPOS LHC model was tuned to LHC experiments up to s = 7 TeV [14,65]. Nonlinear effects are also included in the EPOS LHC models, and they are on the parton level rather than the hadron level in order to calculate the pomeron–pomeron coupling. The modifications introduced in the EPOS LHC are the flow parameterization of the thermalized matter produced at high-density heavy-ion or pp collisions, the core decay, and the formation of baryons (with, as compared to string fragmentation, the multistrange production being more important). Below 7 TeV, the model’s two versions have similar predictions, but they have different results at higher energies. Nonlinear effects are produced in the EPOS LHC models. Gluon re-scattering, i.e., elastic as well as inelastic, is produced.

3. Results and Discussion

Simulation studies of the transverse momentum spectra of charged particles in small bins of pseudorapidity in comparison with the experimental data at 0.9, 2.36, and 7 TeV are presented here. Sibyll, EPOS, and Pythia were used to simulate the experimental data at the three energies mentioned above. Furthermore, the standard distribution function was used to fit the experimental data and analyze the hadronic matter produced under such collisions.

Comparison with the Data

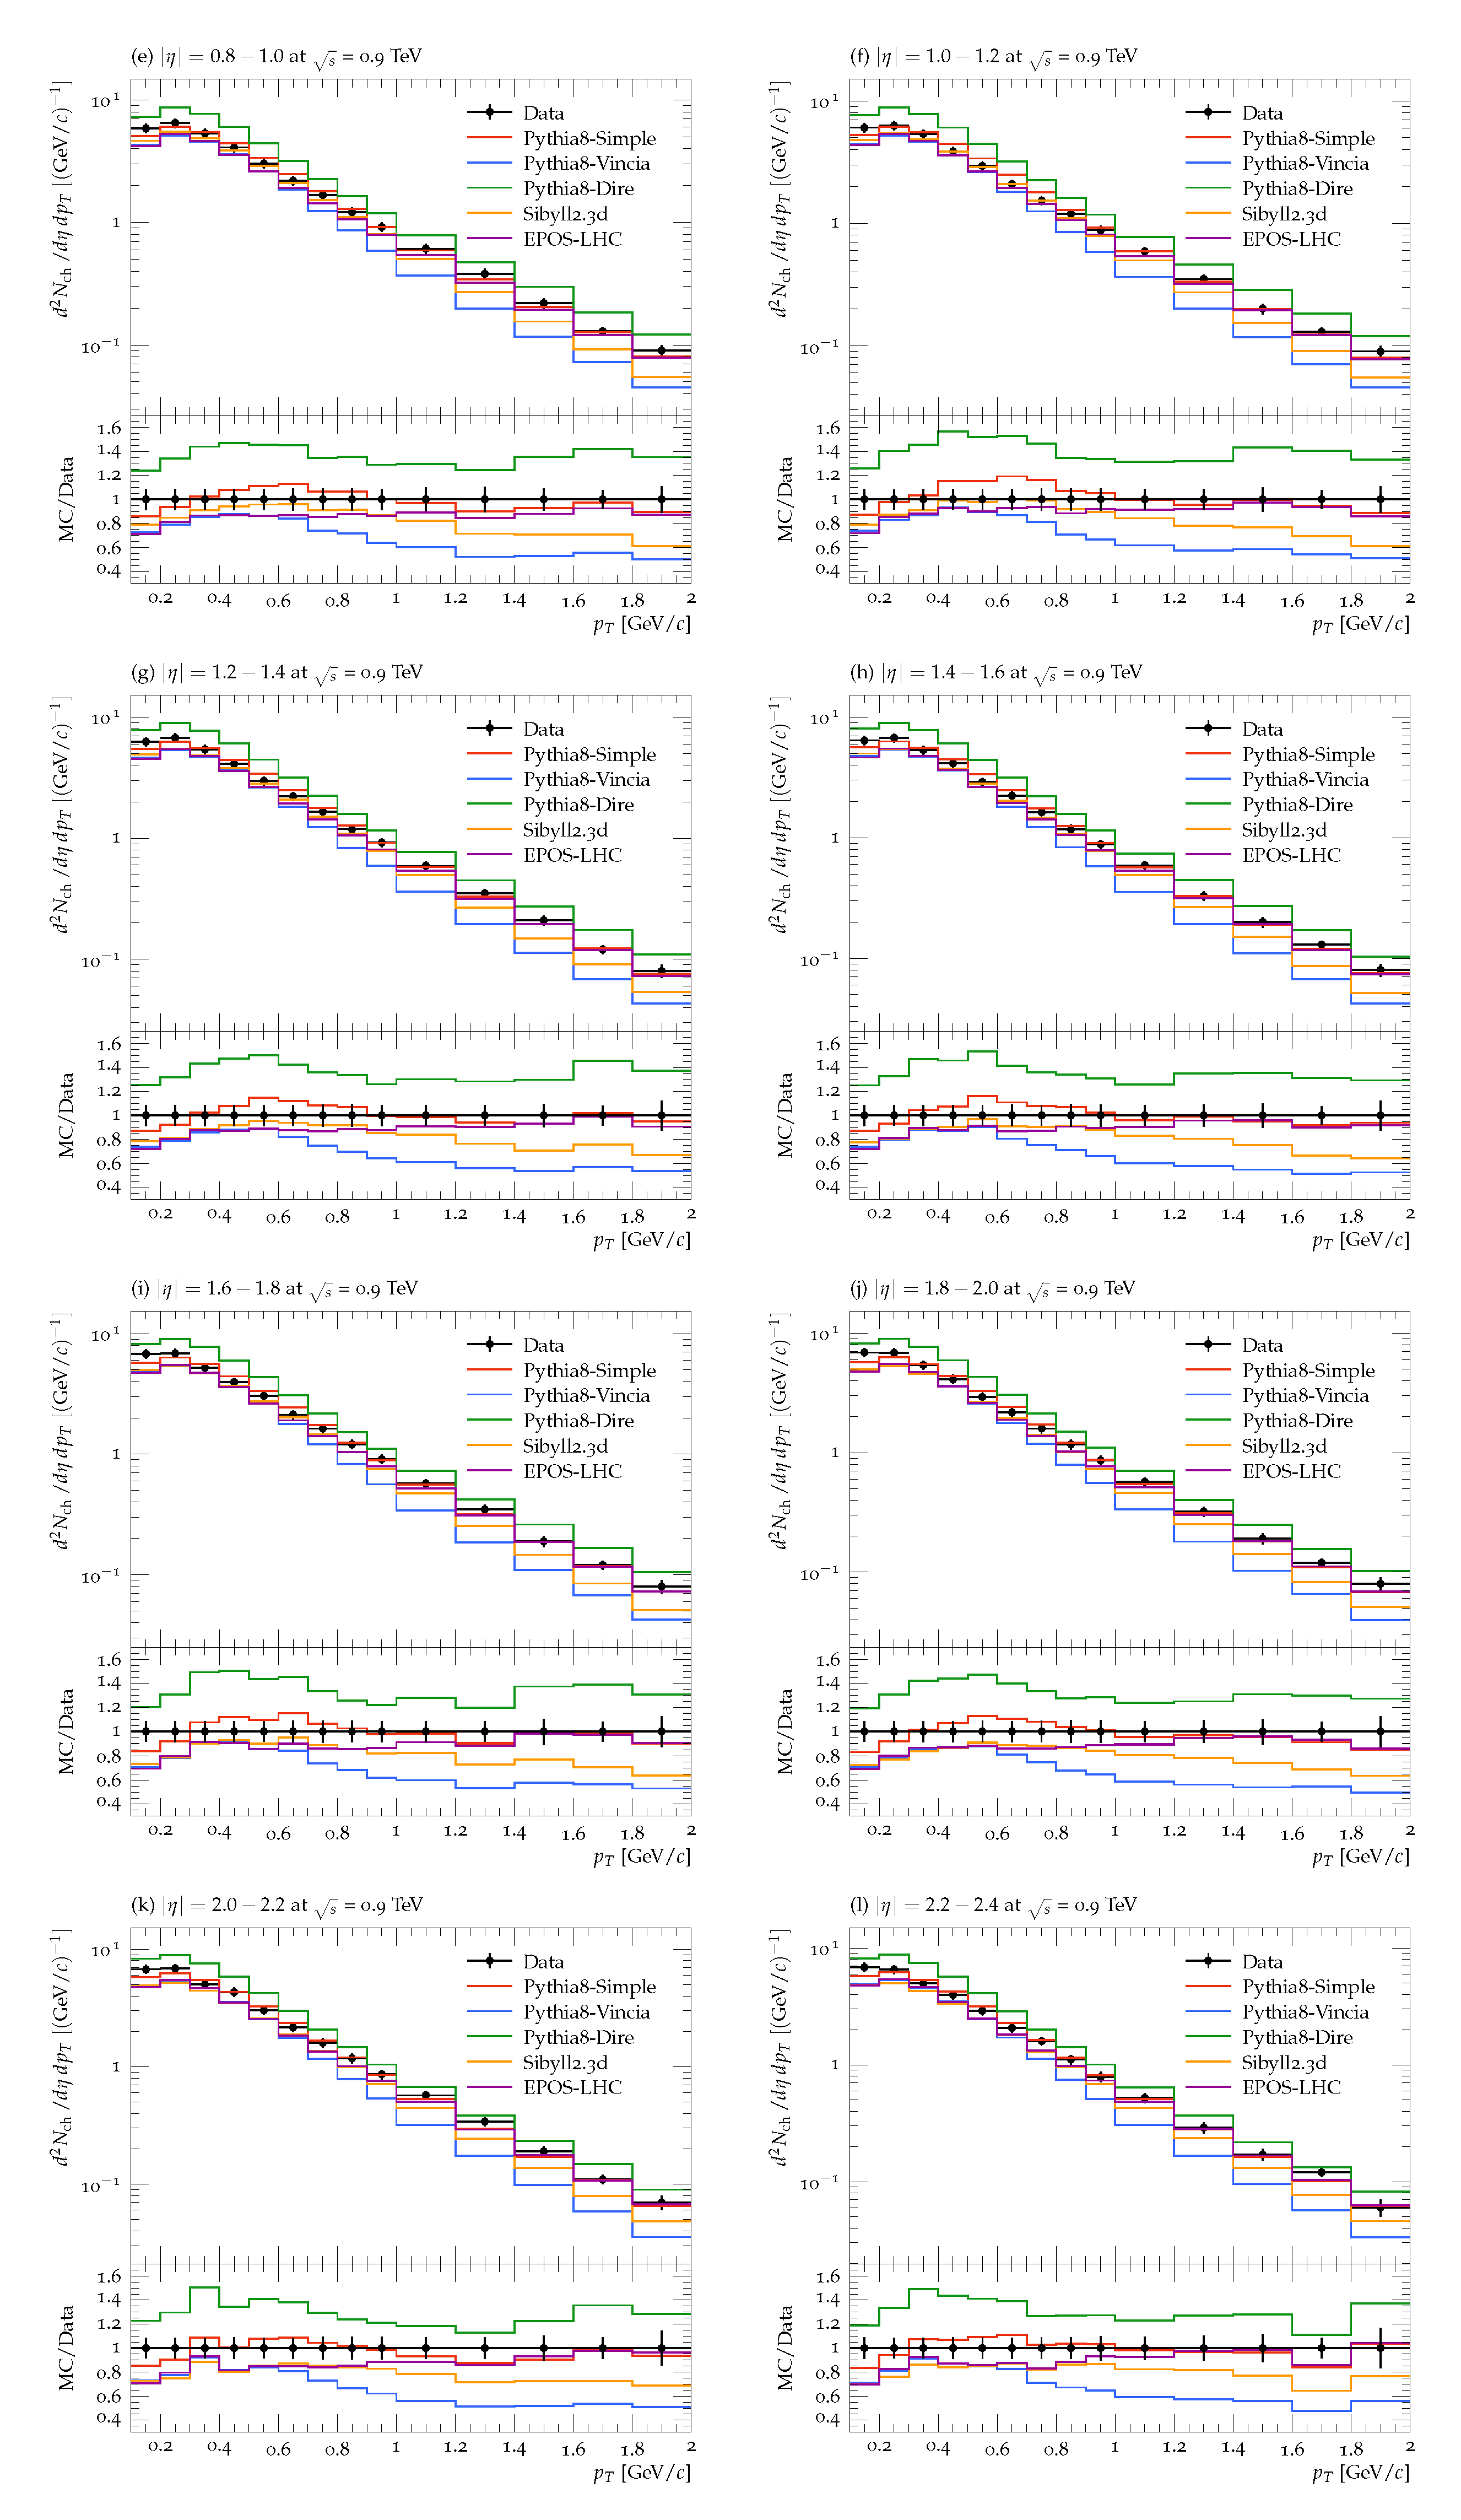
Figure 1 shows the transverse momentum spectra of the charged particles at 0.9 TeV in pseudorapidity bins with a width of 0.2 from 0.0 to 2.4. From left to right, the plots are for | η | = 0.1, 0.2, 0.3,....,2.3.
Of the three modules of Pythia, only the Simple module reproduced the experimental data within the experimental uncertainties for | η | = 0.1. At only p T = 0.1 and 0.5 GeV, the module underpredicted and overpredicted, respectively, by about 20% and 10%. On the other hand, the Vincia and Dire models underpredicted and overpredicted over the entire range of p T by up to 50%. The Vinia model had a closer prediction for 0.3 l e p T ≤ 0.6 GeV/c. Between the other two models, the EPOS LHC had a better prediction, as it reproduced the data at high values of p T . For p T < 1.4 GeV/c, the model underpredicted by about 10%, and the underprediction was up to 30% at p T = 0.1 GeV/c. At the same time, the Sibyll model predicted the data for 0.3 ≤ p T ≤ 0.8 GeV/c, but underpredicted otherwise. The experimental data slightly increased from p T = 0.1 GeV/c, showing a peak at p T = 0.3 GeV/c, followed by a monotonic decrease in the differential yield of the charged particles. All models reproduced the same behavior, but exaggerated the peak. The latter is clear from the ratio plot, which is given at the bottom of each plot. If we scale the models’ predictions to best match the experimental data, the peak at the value of p T = 0.3 was exaggerated by all of the models. For | η | = 0.3, the behavior of models for the p T distribution of the charged particles was the same as that for | η | = 0.1, but the values were relatively scaled down. For example, the Pythia—Simple model still had the best prediction over the entire p T range, but here, it touched the lower ends of the experimental uncertainties at high values of p T . Furthermore, the model here described the region of a slight bump that was observed in the previous case. With a further scale-down in the case of EPOS, the model underpredicted the entire p T range by up to 15%. On the other hand, the Sibyll model’s prediction was the least affected by the change in | η | , and its predictions were similar to those before. The model underpredicted the entire p T range, with a closer match around the bump area. At the same time, the other two modules of Pythia had better predictions than before and were within the 40% limit, at most. With a further increase in | η | , there was no significant change in the behavior of the models’ predictions; therefore, similar results to those described for | η | = 0.1 were produced. We can summarize our finding about the models’ predictions of the charged particles’ p T distributions for different | η | compared to the experimental data at 0.9 TeV as follows. The Pythia model with the Simple parton shower module reproduced the data well. For the Pythia module, we tuned the parameter p T H a t M i n (a lower cut-off phase space value for the transverse momentum, as the processes tend to diverge at p T → 0), which was found to scale the prediction. The best fit of the model with the Simple module was found at p T H a t M i n = 4.3. We also used the value of p T H a t M i n = 4.3 for the Vincia and Dire modules. The predictions of the Sibyll and EPOS models were also the same in shape, but a different scale factor may have aligned them with the experimental data. This means that the same results could be obtained by the other models in the study as well if a proper scaling factor would be used.
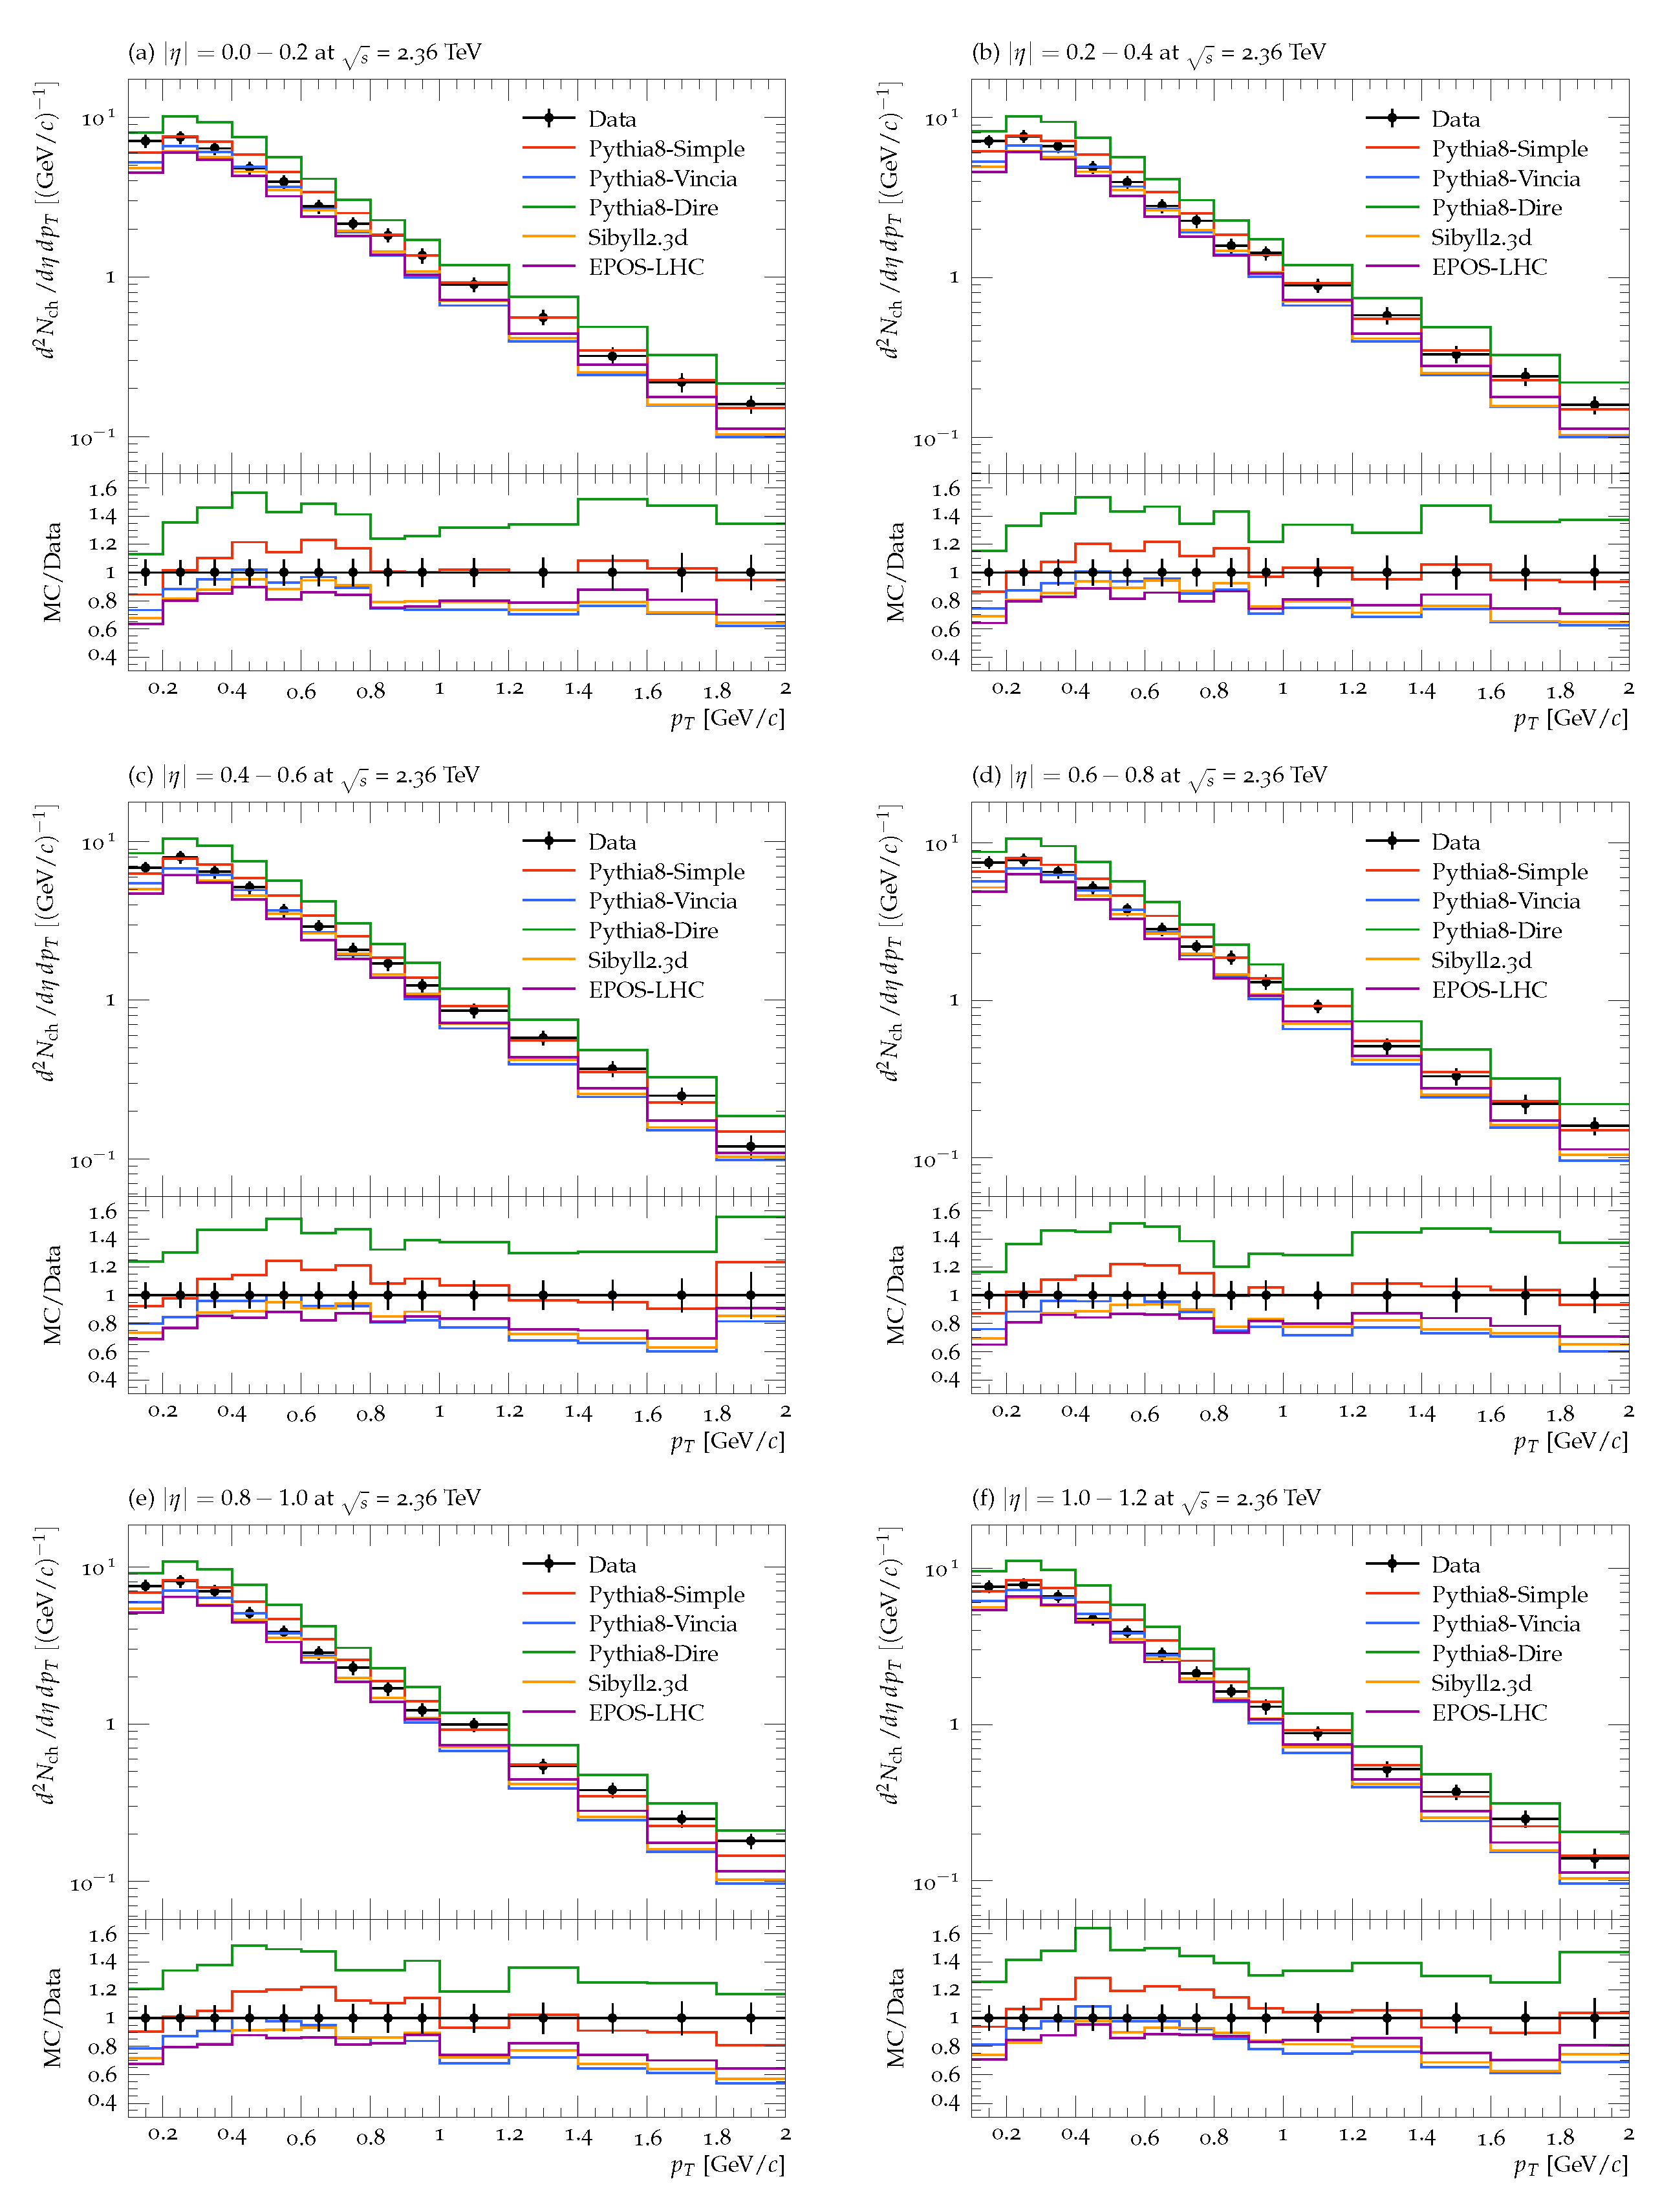
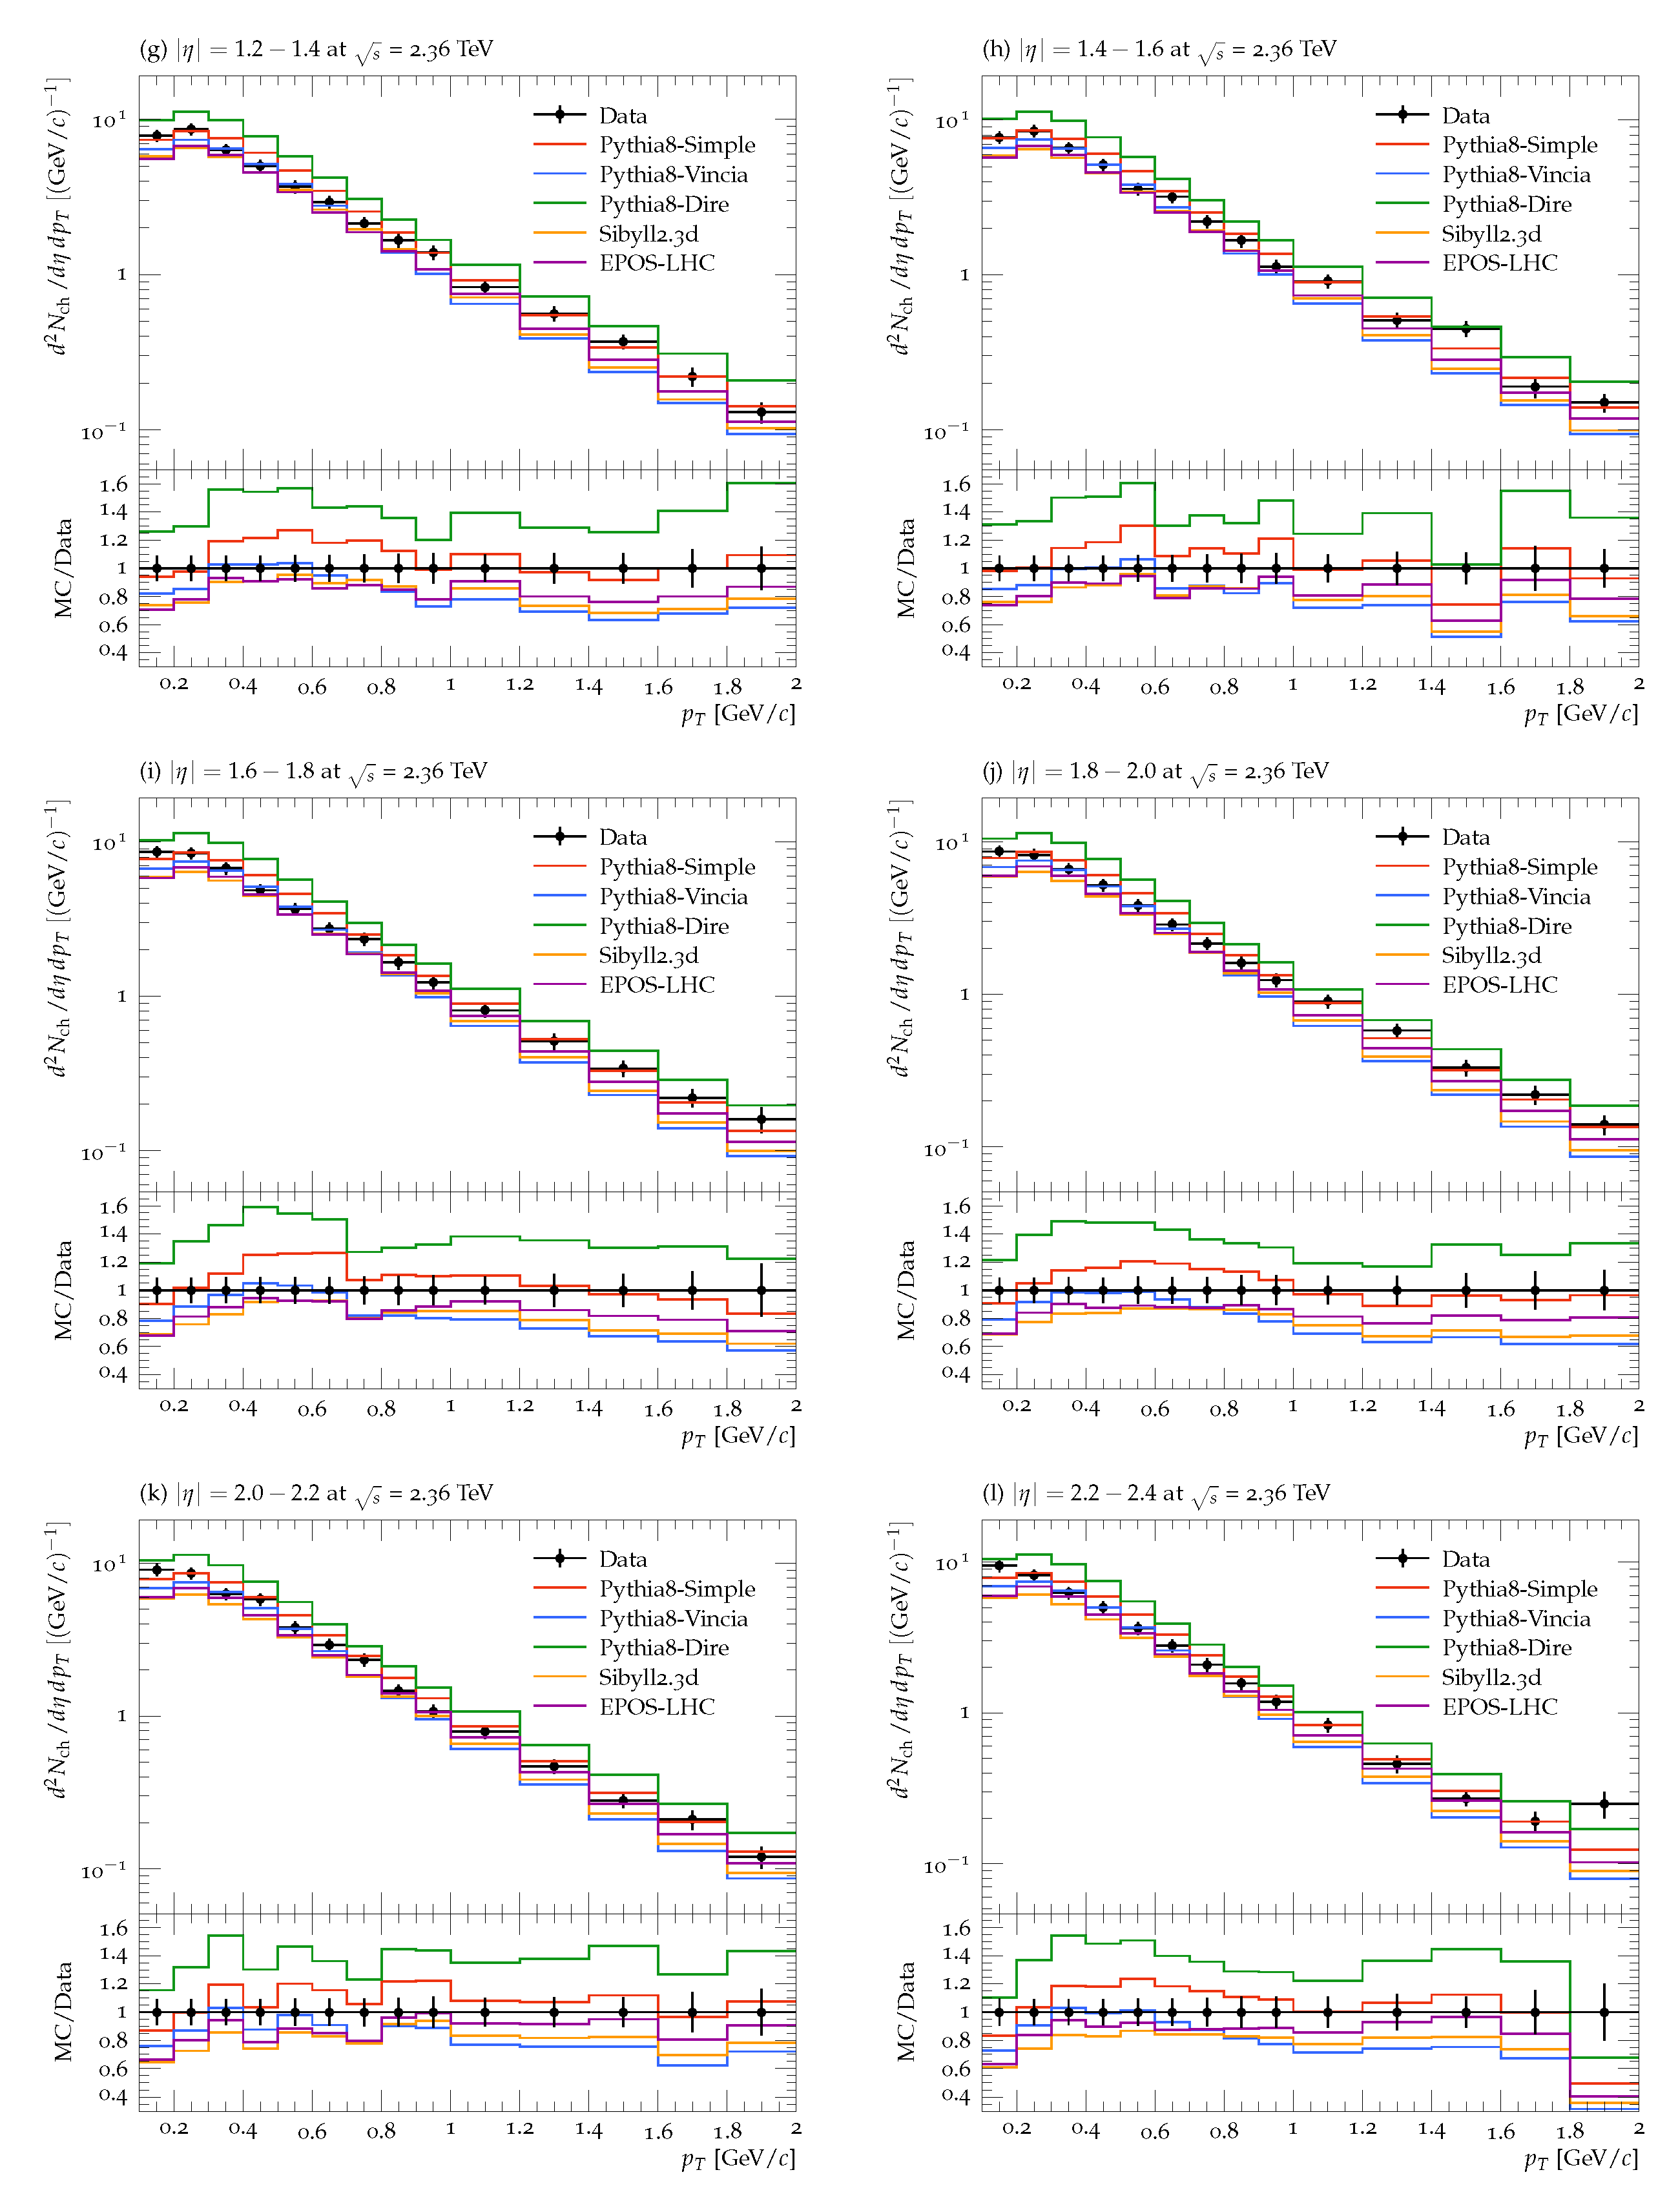
Figure 2 shows the simulation predictions resulting from the three modules of Pythia and the Sibyll and EPOS models compared to the experimental measurements at 2.36 TeV. The Simple module of Pythia reproduced the experimental data within the experimental uncertainties for | η | = 0.1, except for 0.4 < p T < 0.8, where a bump was observed, and the model overestimated by about 20%. The Dire model, on the other hand, overpredicted the data over the entire range of p T by up to 60%, which was higher than in the case of 0.9 TeV. At this energy, Pythia—Vincia, EPOS, and Sibyll reproduced more or less the same predictions for the p T distribution at | η | = 0.1. The EPOS model was further scaled down, which was apparent at the higher p T end after the bump region, while Dire and Sibyll had better predictions compared to those in the case of lower energy. The latter models reproduced the data in the bump region, but underpredicted otherwise. The variation in the behavior of the experimental data with p T , in general, was reproduced by all models; the models reproduced an increase from the first to the second point, followed by a monotonic decrease with p T . With | η | , there was an insignificant change in the predictions of the models, but generally, a slight scaling up was observed at higher values of | η | , which was in contrast to the previous case, where the values were scaled down. It was also clear that with an increase in | η | , the EPOS, Sibyll, and Pythia—Dire models predicted the data in a wider range of p T , particularly at the bump of the distributions, which was where the Pythia—Simple module overestimated.
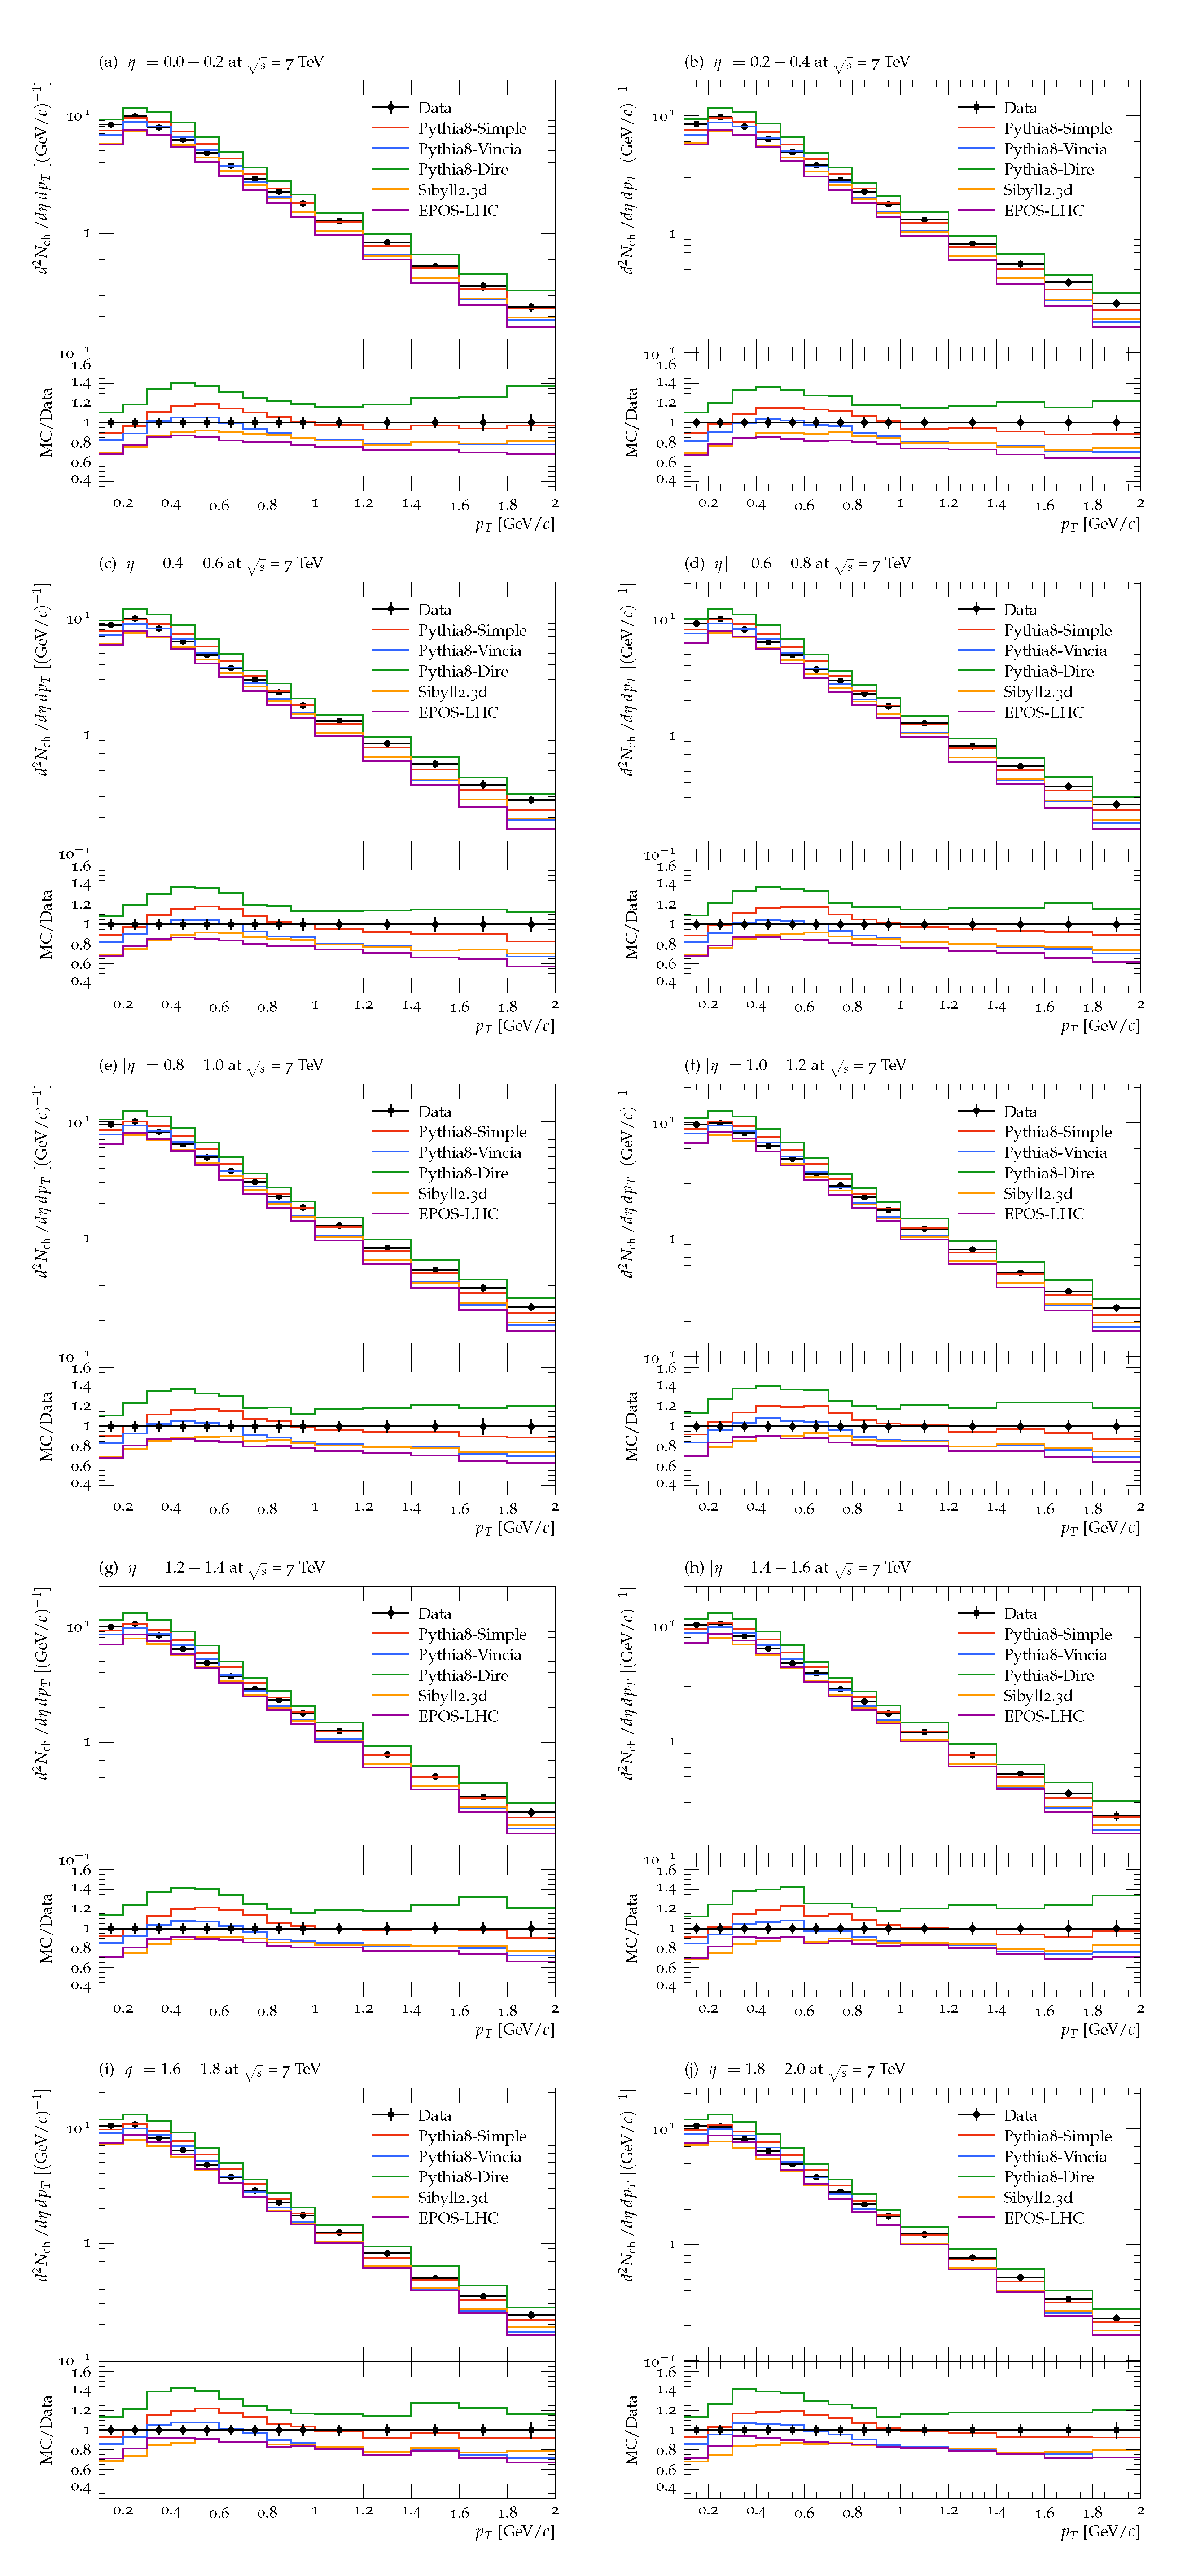
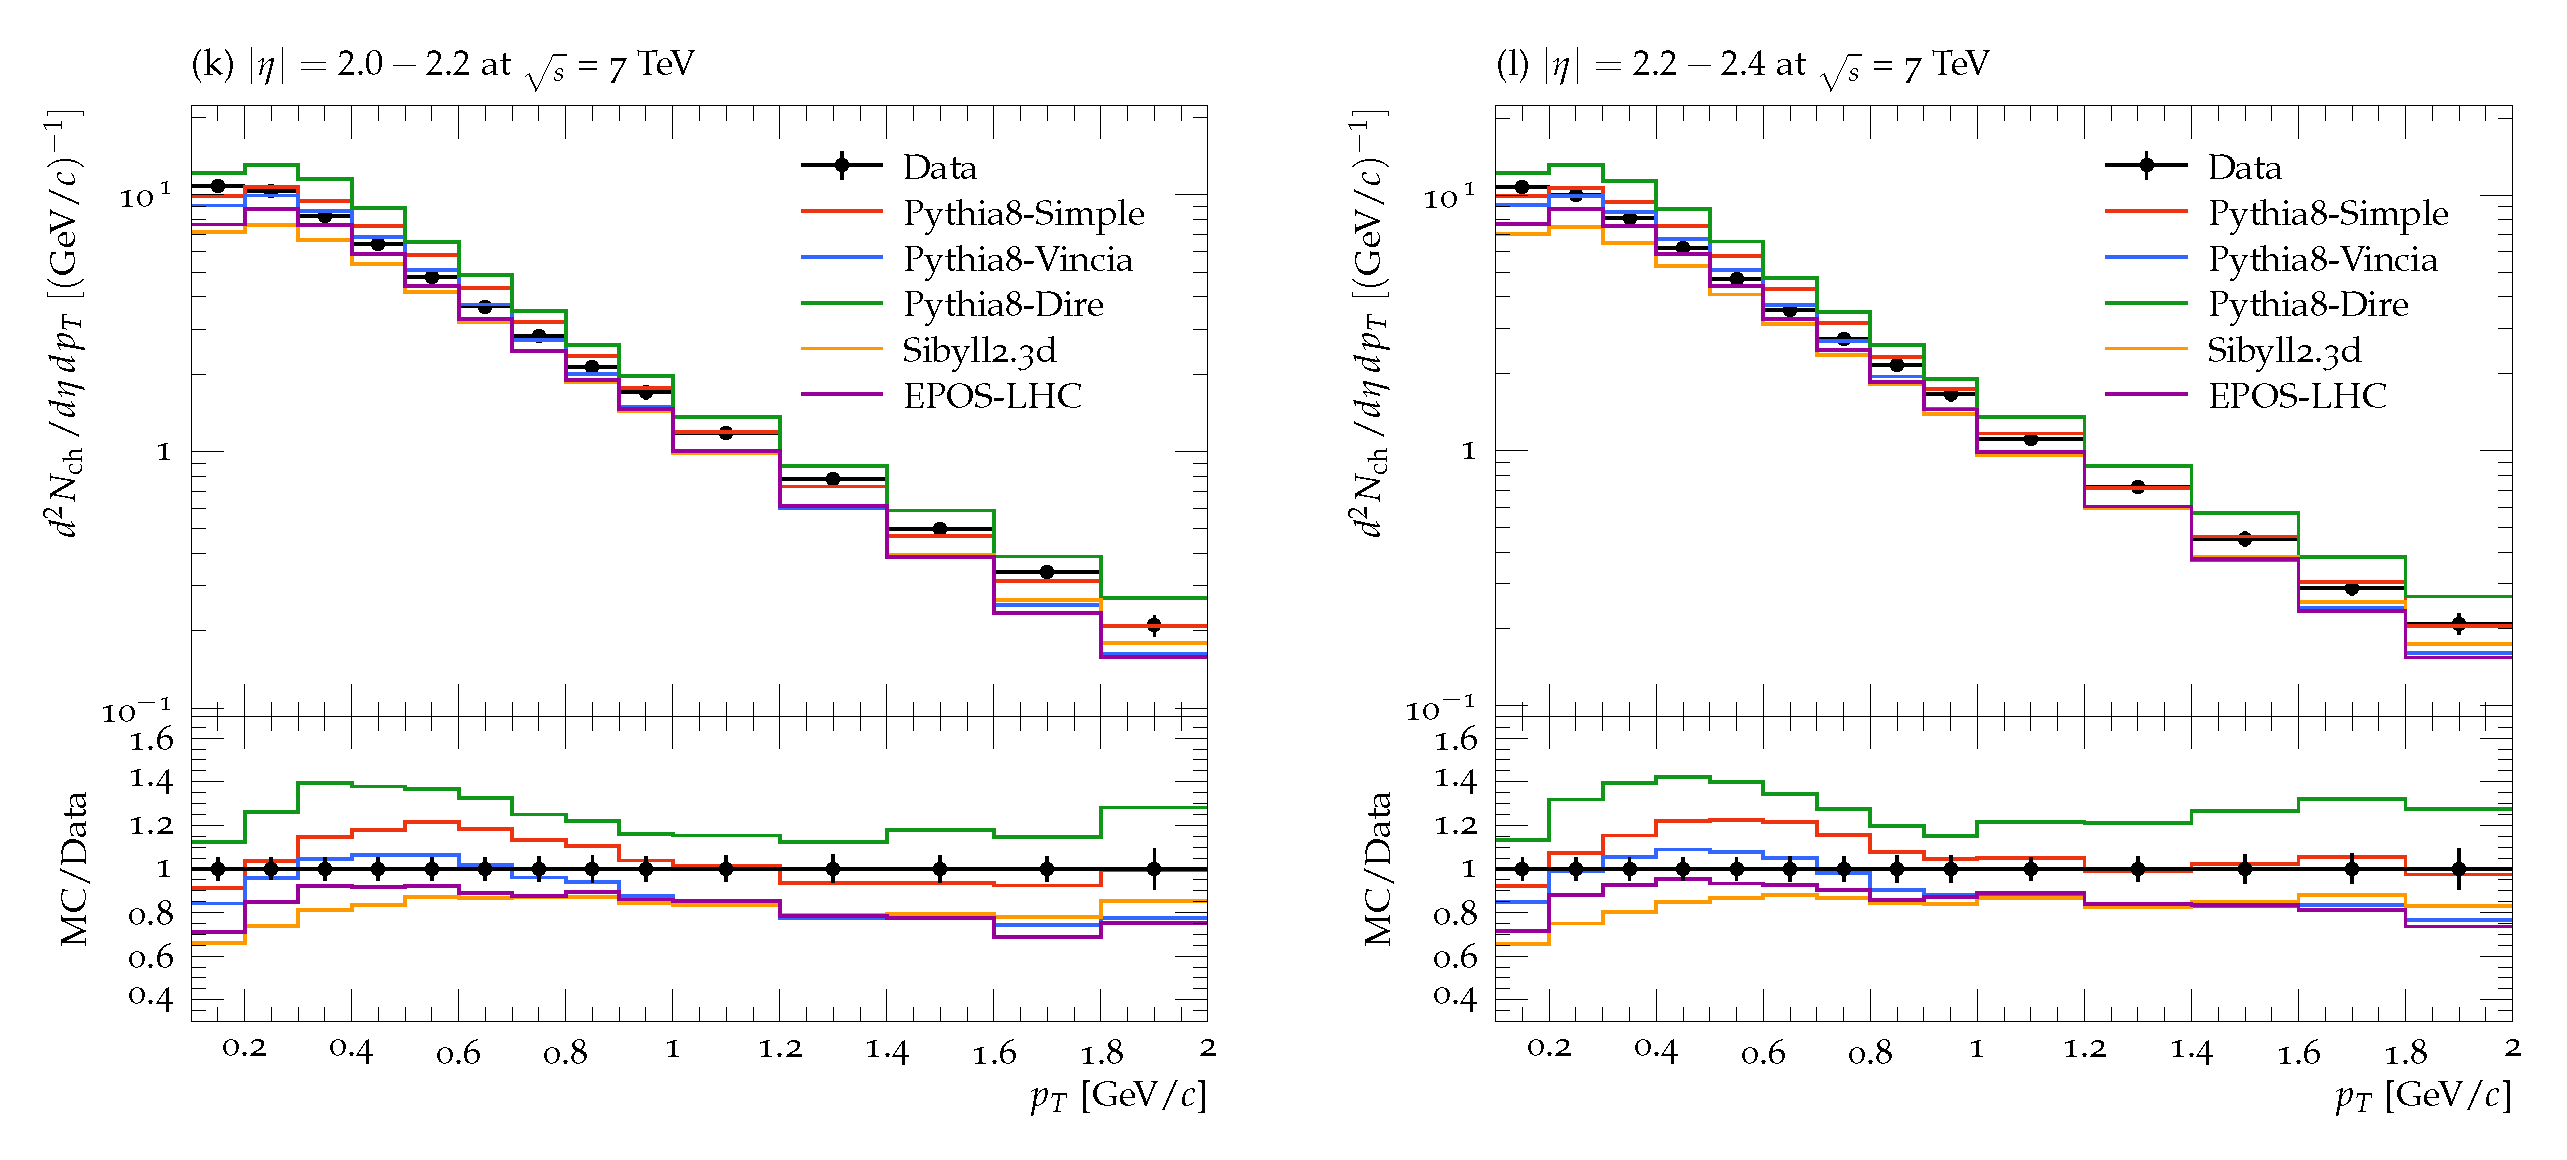
Figure 3 is the same as Figure 1 and Figure 2, but the simulations and data are now at 7 TeV. Except for the bump region, 0.4 < p T < 0.8, the Simple module of Pythia reproduced the experimental data within the experimental uncertainties for | η | = 0.1, where it overestimated by about 20%. The Dire model overpredicted the data by 40% at maximum; thus, it offered better prediction than in the cases of lower energies. In this case, Pythia—Vincia, EPOS, and Sibyll reproduced the same predictions for p T > 0.7 GeV/c at | η | = 0.1. For p T < 0.7 GeV/c, Pythia—Vincia reproduced the data well, while Sibyll and EPOS underpredicted. With an increase in the value of | η | , the models’ predictions slightly improved. For example, for | η | = 2.3, the Vincia module of Pythia and the EPOS model had closer results to the data, while the Sibyll model underpredicted for p T < 0.7 GeV/c, though the models had the same predictions for higher values of p T . Pythia—Simple was still the best among all and reproduced the data over most of the p T range, except at the bump, where the model overpredicted, as before.
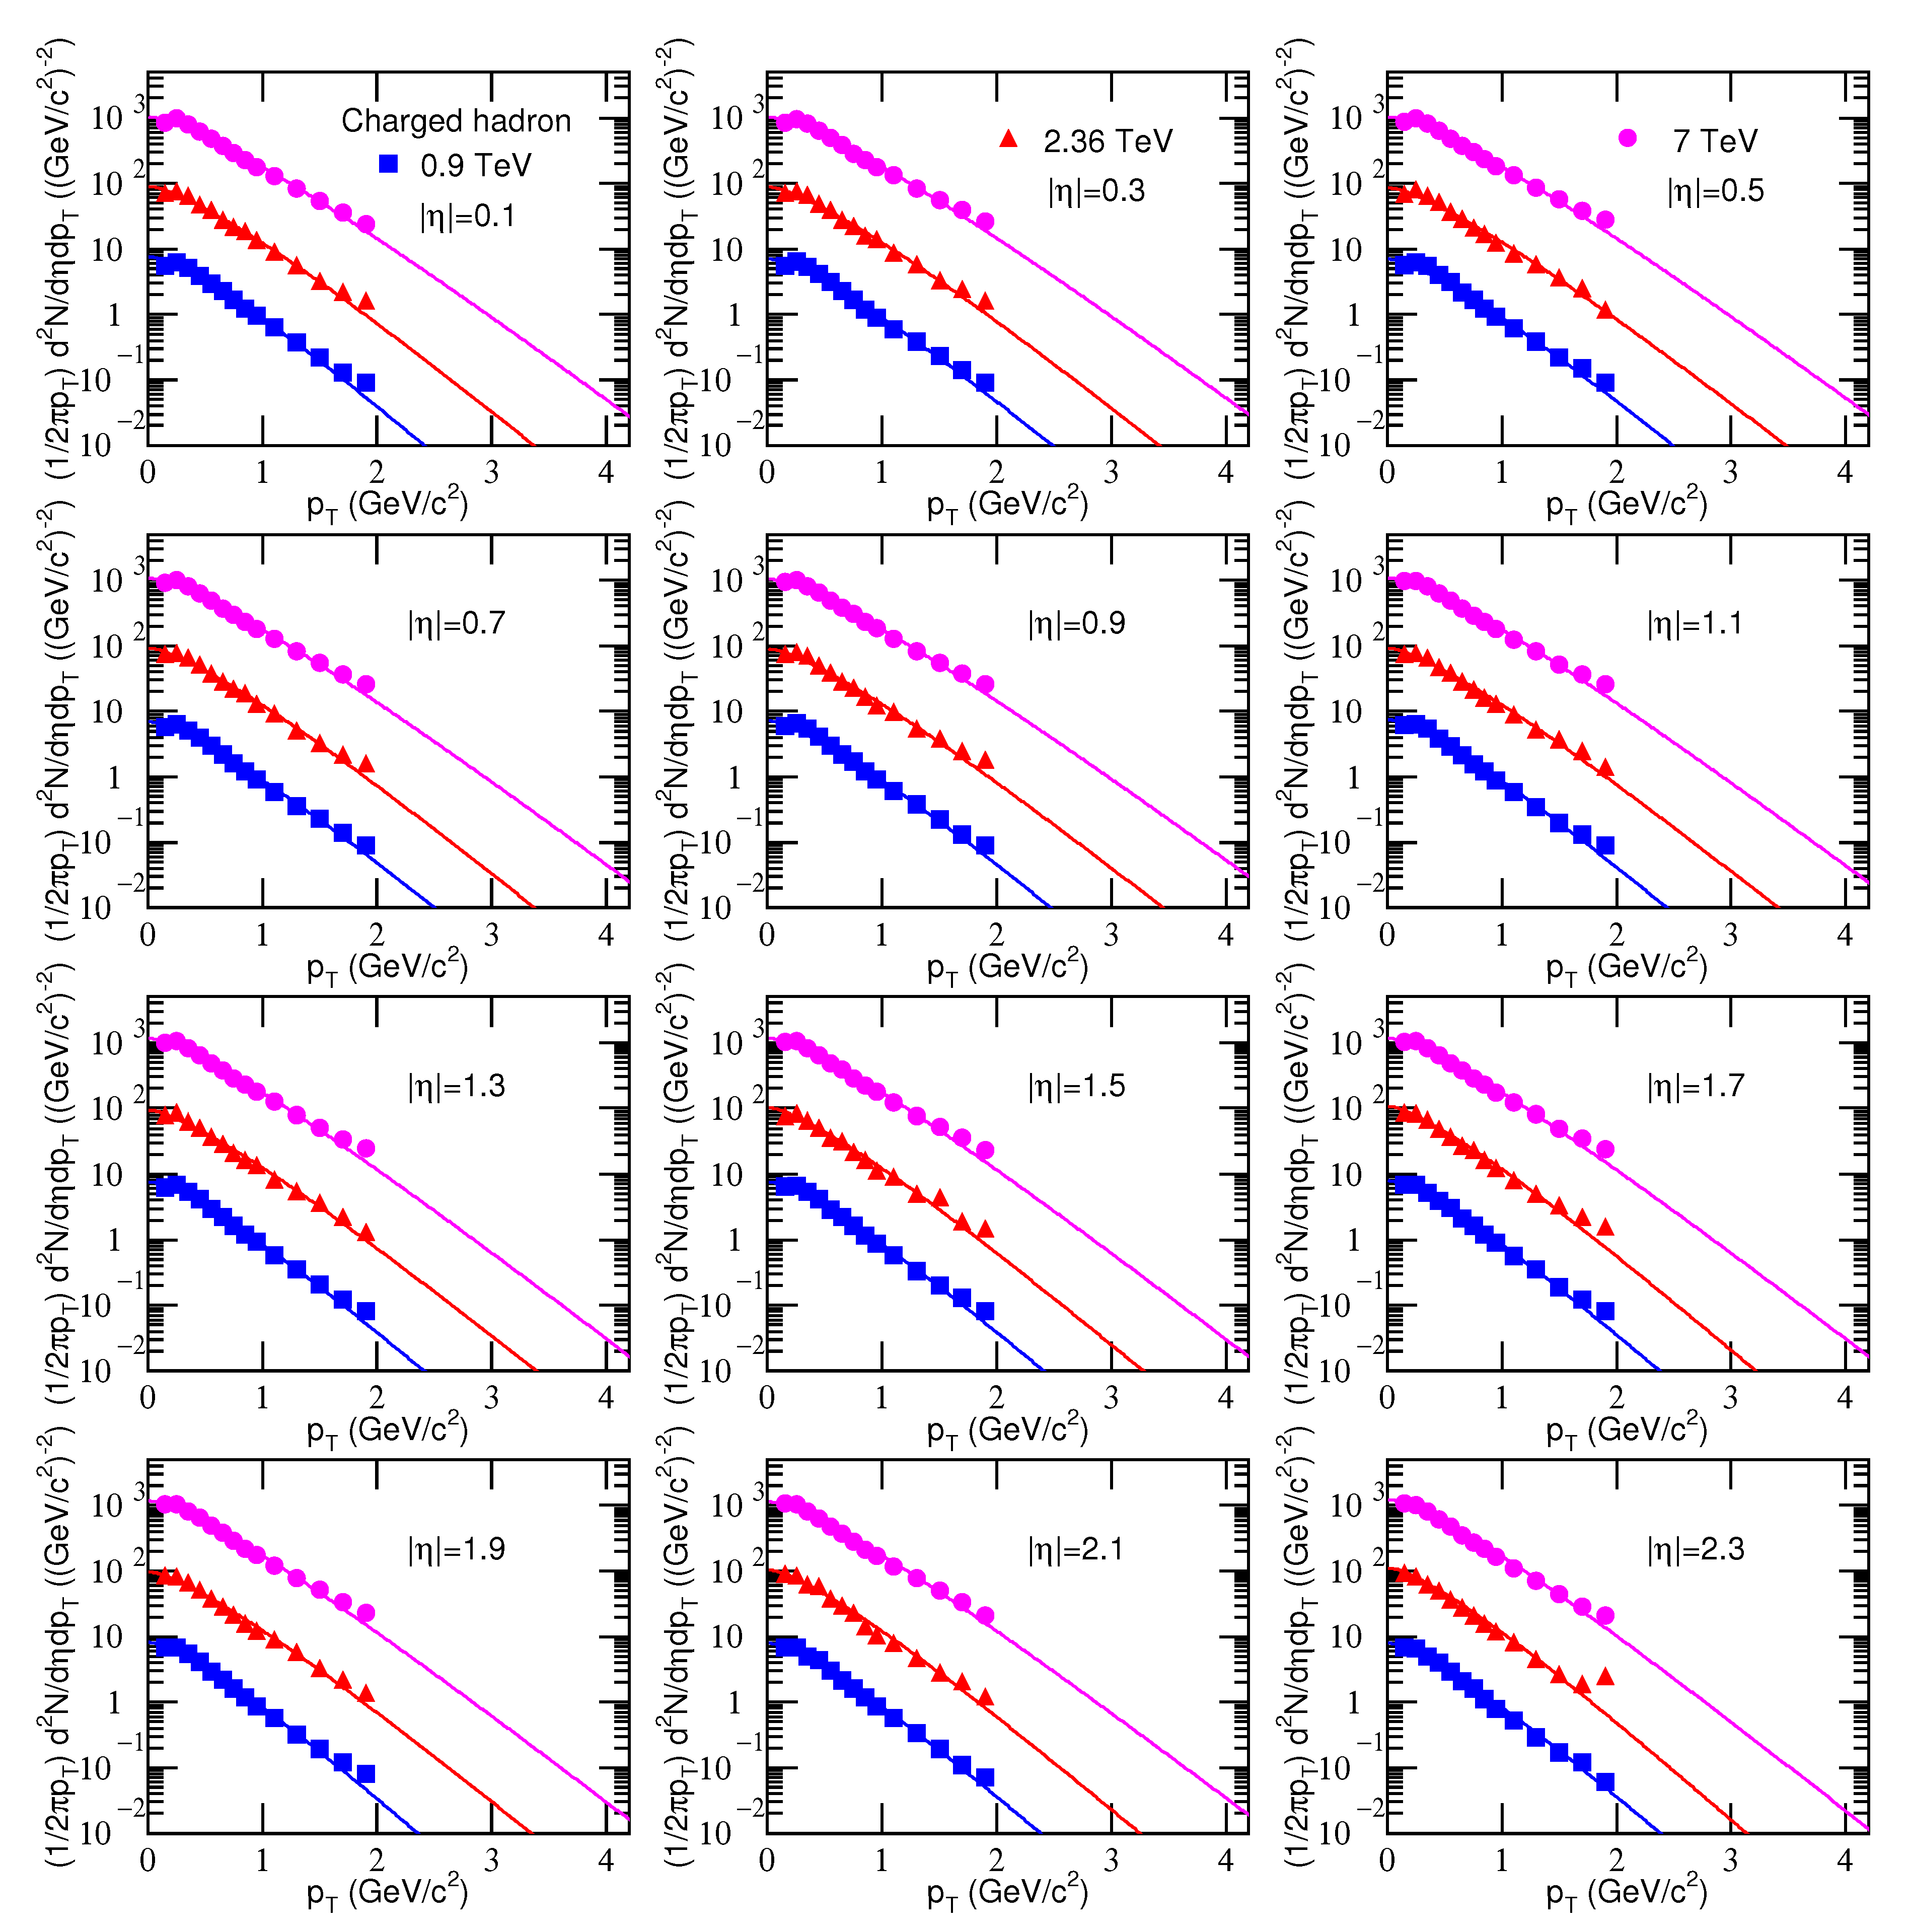
The results of the fitting of the standard distribution with the p T distributions of the experimental data are shown in Figure 4 at s = 0.9, 2.36, and 7 TeV. The curves show that the fitting function fit the data well. The distributions are presented in bins of pseudorapidity with a width of 0.2 from 0.0 to 2.4. Here, the markers represent the experimental measurements at the three energies, while the curves are the results of the fitting with the standard distribution function given in Equation (1). The fitting procedure allowed us to extract global parameters of the hadronic matter. In the present case, we derived the effective temperature of the hadronic matter, which carried information on the transverse flow velocity and kinetic freeze-out temperature. The behavior of the effective temperature as a function of the pseudorapidity at the three center-of-mass energies is given in Figure 5. The effective temperature slowly increased with | η | up to | η | = 0.9 and sharply after that. Furthermore, the values of the effective temperature increased with the energy. Furthermore, the increase in temperature with the energy was more prominent at higher values of | η | than at lower values.
The point at which a change in the effective temperature occurred, from a slower change to quicker increase, showed a possible change in the reaction mechanism and/or the hadronic matter produced in such collisions. This might be explained in two ways: (1) The produced hadronic matter changes from baryons being dominant to mesons being dominant in the hadron phase. (2) The hadronic matter changes into a de-confined phase of QGP droplets from ordinary nuclear matter.

4. Conclusions

The transverse momentum distributions of inclusive charged particles in small regions of pseudorapidity in p p collisions at the center-of-mass energies of s = 0.9. 2.36, and 7 TeV are reported. Three available modules of Pythia for hadron showers, Sibyll, and EPOS were used to simulate the spectra, and the results thereof were compared with the measurements from the CMS collaboration. Furthermore, the fit of the p T distribution of the experimental data according to the standard distribution function was used, and it fit the data well. The effective temperature of the hadronic matter was extracted for the experimental data as a function of pseudorapidity at the three center-of-mass energies. We summarize our findings as follows. The Simple/Default module for the simulation of parton showers in the Pythia model reproduced good predictions of the data in comparison with the predictions made with the other parton shower modules and the EPOS and Sibyll models. We tuned a parameter that limited the lower cut-off phase space of the transverse momentum during the simulations. The parameter was found to scale the predictions of the models. We found the best fit for the Simple module and used the same parameter value for the other two modules of Pythia. Another model with a closer prediction of the data was the EPOS model, while the Sibyll model could reproduce the data in a limited region of the p T distributions. With an increase in the center-of-mass energy, it was observed that, generally, the predictions of the models improved compared to the predictions at lower energies.
The effective temperature extracted by the standard distribution function from the spectra increased with an increase in the pseudorapidity. The parameter had more significant values at higher center-of-mass energies.
The point at which a change in the effective temperature occurred, from a slower change to a quicker increase, showed a possible change in the reaction mechanism and/or the hadronic matter produced in such collisions. The latter might be due to a change in the hadron production mechanism and/or a phase transition might occur at the boundary.

Author Contributions

Conceptualization, M.A., M.W. and L.-L.L.; methodology, M.A. and R.K.; software, M.A.; validation, M.A.K., H.I.A. and A.-H.A.-A.; formal analysis, M.A. and A.-H.A.-A.; investigation, R.K.; resources, H.I.A.; data curation, L.-L.L.; writing—original draft preparation, M.A. and M.W.; writing—review and editing, M.A.K. and A.-H.A.-A.; visualization, M.W.; supervision, M.A.; project administration, A.-H.A.-A.; funding acquisition, H.I.A. All authors have read and agreed to the published version of the manuscript.

Funding

This work received funding from Princess Nourah bint Abdulrahman University Researchers Supporting Project number (PNURSP2022R106), Princess Nourah bint Abdulrahman University, Riyadh, Saudi Arabia.

Data Availability Statement

The data used to support the findings of this study are included within the article and are cited at relevant places within the text as references.

Acknowledgments

We acknowledge the support from the Abdul Wali Khan University Mardan, which was provided in the form of an environment conducive to research. This work was supported by the Princess Nourah bint Abdulrahman University Researchers Supporting Project number (PNURSP2022R106), Princess Nourah bint Abdulrahman University, Riyadh, Saudi Arabia.

Conflicts of Interest

The authors declare no conflict of interest. Furthermore, the funders had no role in the design of the study; in the collection, analyses, or interpretation of data; in the writing of the manuscript, or in the decision to publish the results.

Compliance with Ethical Standards

The authors declare that they are in compliance with ethical standards regarding the content of this paper.

References

  1. Biallas, A.; Bleszynski, M.; Czyz, W. Multiplicity distributions in nucleus-nucleus collisions at high energies. Nucl. Phys. B 1976, 111, 461–476. [Google Scholar]
  2. Bjorken, J.D. Highly relativistic nucleus-nucleus collisions: The central rapidity region. Phys. Rev. D 1983, 27, 140. [Google Scholar]
  3. Kharzeev, D.; Nardi, M. Hadron production in nuclear collisions at RHIC and high-density QCD. Phys. Lett. B 2001, 507, 121–128. [Google Scholar]
  4. Grosse-Oetringhaus, J.F.; Fiete, J.; Reygers, K. Charged-particle multiplicity in proton–proton collisions. J. Phys. G Nucl. Part. Phys. 2010, 37, 083001. [Google Scholar]
  5. Alver, B.; Back, B.B.; Baker, M.D.; Ballintijn, M.; Barton, D.S.; Betts, R.R.; Bickley, A.A.; Bindel, R.; Budzanowski, A.; Busza, W.; et al. Charged-particle multiplicity and pseudorapidity distributions measured with the PHOBOS detector in Au+ Au, Cu+ Cu, d+ Au, and p + p collisions at ultrarelativistic energies. Phys. Rev. C 2011, 83, 024913. [Google Scholar]
  6. Adamczyk, L.; Adkins, J.K.; Agakishiev, G.; Aggarwal, M.M.; Ahammed, Z.; Ajitanand, N.N.; Alekseev, I.; Anderson, D.M.; Aoyama, R.; Aparin, A.; et al. Bulk properties of the medium produced in relativistic heavy-ion collisions from the beam energy scan program. Phys. Rev. C 2017, 96, 044904. [Google Scholar]
  7. Toia, A. ALICE Collaboration. Bulk properties of Pb–Pb collisions at TeV measured by ALICE. J. Phys. G 2011, 38, 124007. [Google Scholar] [CrossRef] [Green Version]
  8. Sahoo, R.; Mishra, A.N.; Behera, N.K.; Nandi, B.K. Charged particle, photon multiplicity, and transverse energy production in high-energy heavy-ion collisions. Adv. High-Energy Phys. 2015, 2015, 612390. [Google Scholar]
  9. Sarkisyan, E.K.G.; Mishra, A.N.; Sahoo, R.; Sakharov, A.S. Multihadron production dynamics exploring the energy balance in hadronic and nuclear collisions. Phys. Rev. D 2016, 93, 054046. [Google Scholar]
  10. Basu, S.; Nayak, T.K.; Datta, K. Beam energy dependence of pseudorapidity distributions of charged particles produced in relativistic heavy-ion collisions. Phys. Rev. C 2016, 93, 064902. [Google Scholar] [CrossRef] [Green Version]
  11. Sjöstrand, T.; Mrenna, S.; Skands, P. PYTHIA 6.4 physics and manual. J. High Energy Phys. 2006, 05, 026. [Google Scholar]
  12. Da Silva, A.V.; Bierlich, C.; Chinellato, D.D.; Takahashi, J. Studying the effect of the hadronic phase in nuclear collisions with PYTHIA and UrQMD. Springer Proc. Phys. 2020, 250, 319. [Google Scholar] [CrossRef]
  13. Fletcher, R.S.; Gaisser, T.K.; Lipari, P.; Stanev, T. SIBYLL: An Event generator for simulation of high-energy cosmic ray cascades. Phys. Rev. D 1994, 50, 5710–5731. [Google Scholar] [CrossRef] [Green Version]
  14. Pierog, T.; Karpenko, I.; Katzy, J.M.; Yatsenko, E.; Werner, K. EPOS LHC: Test of collective hadronization with data measured at the CERN Large Hadron Collider. Phys. Rev. C 2015, 92, 034906. [Google Scholar] [CrossRef] [Green Version]
  15. Ostapchenko, S. Monte Carlo treatment of hadronic interactions in enhanced Pomeron scheme: QGSJET-II model. Phys. Rev. D 2011, 83, 014018. [Google Scholar]
  16. Adams, J.; Aggarwal, M.; Ahammed, Z.; Amontee, J.; Anderson, B.D.; Arkhipkin, D.; Averichev, G.S.; Badyal, S.K.; Bai, Y.; STAR Collaboration; et al. Experimental and theoretical challenges in the search for the quark–gluon plasma: The STAR Collaboration’s critical assessment of the evidence from RHIC collisions. Nucl. Phys. A 2005, 757, 102. [Google Scholar]
  17. Heinz, U.W.; Jacob, M. Evidence for a new state of matter: An assessment of the results from the CERN lead beam programme. arXiv 2000, arXiv:nucl-th/0002042. [Google Scholar]
  18. Khachatryan, V.; CMS Collaboration; Sirunyan, A.M.; Tumasyan, A.; Adam, W.; Bergauer, T.; Dragicevic, M.; Erö, J.; Friedl, M.; Frühwirth, R.; et al. Transverse-momentum and pseudorapidity distributions of charged hadrons in pp collisions at s = 0.9 and 2.36 TeV. J. High Energy Phys. 2010, 2010, 41. [Google Scholar] [CrossRef] [Green Version]
  19. Khachatryan, V.; Sirunyan, A.M.; Tumasyan, A.; Adam, W.; Bergauer, T.; Dragicevic, M.; Erö, J.; Fabjan, C.; Friedl, M.; Frühwirth, R.; et al. Transverse-Momentum and Pseudorapidity Distributions of Charged Hadrons inppCollisions ats s = 7 TeV. Phys. Rev. Lett. 2010, 105, 022002. [Google Scholar] [CrossRef] [Green Version]
  20. Yang, P.-P.; Duan, M.-Y.; Liu, F.-H.; Sahoo, R. Analysis of Identified Particle Transverse Momentum Spectra Produced in pp, p–Pb and Pb–Pb Collisions at the LHC Using TP-like Function. Symmetry 2022, 14, 1530. [Google Scholar] [CrossRef]
  21. Cleymans, J.; Worku, D.S. Relativistic thermodynamics: Transverse momentum distributions in high-energy physics. Eur. Phys. J. A 2012, 48, 60. [Google Scholar]
  22. Adler, S.S.; Afanasiev, S.; Aidala, C.; Ajitanand, N.N.; Akiba, Y.; Alexander, J.; Amirikas, R.; Aphecetche, L.; Aronson, S.H.; Averbeck, R.; et al. Identified charged particle spectra and yields in Au+Au collisions at s N N = 200 GeV. Phys. Rev. 2004, 69, 034909. [Google Scholar]
  23. Koch, P.; Rafelski, J.; Greiner, W. Strange hadrons in hot nuclear matter. Phys. Lett. B 1983, 123, 151–154. [Google Scholar]
  24. Braun-Munzinger, P.; Magestro, D.; Redlich, K.; Stachel, J. Hadron production in Au-Au collisions at RHIC. Phys. Lett. 2001, 518, 41–46. [Google Scholar]
  25. Andronic, A.; Braun-Munzinger, P.; Stachel, J. Thermal hadron production in relativistic nuclear collisions. Acta Phys. Pol. B 2009, 40, 1005–1012. [Google Scholar]
  26. Andronic, A.; Braun-Munzinger, P.; Stachel, J. The horn, the hadron mass spectrum and the QCD phase diagram—The statistical model of hadron production in central nucleus-nucleus collisions. Nucl. Phys. A 2010, 834, 237c–240c. [Google Scholar]
  27. Cleymans, J.; Oeschler, H.; Redlich, K.; Wheaton, S. Comparison of chemical freeze-out criteria in heavy-ion collisions. Phys. Rev. C 2006, 73, 034905. [Google Scholar]
  28. Andronic, A.; Braun-Munzinger, P.; Stachel, J. Hadron production in central nucleus-nucleus collisions at chemical freeze-out. Nucl. Phys. A 2006, 772, 167–199. [Google Scholar]
  29. Andronic, A.; Braun-Munzinger, P.; Redlich, K.; Stachel, J. Decoding the phase structure of QCD via particle production at high energy. Nature 2018, 561, 321–330. [Google Scholar]
  30. Ajaz, M.; HajIsmail, A.A.K.; Ahmed, A.; Wazir, Z.; Shehzadi, R.; Younis, H.; Khan, G.; Khan, R.; Ali, S.; Waqas, M.; et al. Centrality dependence of dristibutions and nuclear modification factor of charged particles in Pb–Pb interactions at s = 2.76 TeV. Results Phys. 2021, 30, 104790. [Google Scholar]
  31. Ajaz, M.; Waqas, M.; Peng, G.X.; Yasin, Z.; Younis, H.; Ismail, A.A.K.H. Study of pT spectra of light particles using modified Hagedorn function and cosmic rays Monte Carlo event generators in proton–proton collisions at s s = 900 GeV. Eur. Phys. J. Plus 2022, 137, 52. [Google Scholar] [CrossRef]
  32. Ajaz, M.; Ismail, A.A.K.H.; Waqas, M.; Suleymanov, M.; AbdelKader, A.; Suleymanov, R. Pseudorapidity dependence of the bulk properties of hadronic medium in pp collisions at 7 TeV. Sci. Rep. 2022, 12, 8142. [Google Scholar] [CrossRef]
  33. Ullah, S.; Ajaz, M.; Wazir, Z.; Ali, Y.; Khan, K.H.; Younis, H. Hadron production models’ prediction for pT distribution of charged hadrons in pp interactions at 7 TeV. Sci. Rep. 2019, 9, 11811. [Google Scholar] [CrossRef] [Green Version]
  34. Tabassam, U.; Ali, Y.; Suleymanov, M.; Bhatti, A.S.; Ajaz, M. The production of π, K, p and p ¯ in p-Pb collisions at sNN = 5.02 TeV. Mod. Phys. Lett. A 2018, 33, 1850094. [Google Scholar] [CrossRef]
  35. Ajaz, M.; Waqas, M.; Li, L.-L.; Ismail, A.A.K.H.; Tabassam, U.; Suleymanov, M. Bulk properties of the medium in comparison with models’ predictions in pp collisions at 13 TeV. Eur. Phys. J. Plus 2022, 137, 592. [Google Scholar] [CrossRef]
  36. Waqas, M.; Peng, G.; Ajaz, M.; Khubrani, A.; Dawi, E.; Khan, M.A.; Tawfik, A. Pseudorapidity dependence of the transverse momentum distribution of charged particles in pp collisions at 0.9, 2.36, and 7 TeV. Res. Phys. 2022, 42, 105989. [Google Scholar] [CrossRef]
  37. Ajaz, M.; Khan, R.; Wazir, Z.; Khan, I.; Bibi, T. Model prediction of transverse momentum spectra of strange hadrons in pp collisions at s = 200 GeV. Int. J. Theor. Phys. 2020, 59, 3338. [Google Scholar]
  38. Khan, R.; Ajaz, M. Model predictions of charge particle densities and multiplicities in the forward region at 7 TeV. Mod. Phys. Lett. A 2020, 35, 2050190. [Google Scholar] [CrossRef]
  39. Ajaz, M.; Tufail, M.; Ali, Y. Study of the Production of Strange Particles in Proton–Proton Collisions at s = 0.9 TeV. Arab. J. Sci. Eng. 2020, 45, 411–416. [Google Scholar] [CrossRef]
  40. Yang, P.-P.; Ajaz, M.; Waqas, M.; Liu, F.-H.; Suleymanov, M.K. Pseudorapidity dependence of the p T spectra of charged hadrons in pp collisions at s = 0.9 and 2.36 TeV. J. Phys. G Nucl. Part. Phys. 2022, 49, 055110. [Google Scholar] [CrossRef]
  41. Sjöstrand, T.; Ask, S.; Christiansen, J.R.; Corke, R.; Desai, N.; Ilten, P.; Mrenna, S.; Prestel, S.; Rasmussen, C.O.; Skands, P.Z. An introduction to PYTHIA 8.2. Comput. Phys. Commun. 2015, 191, 159–177. [Google Scholar] [CrossRef] [Green Version]
  42. Sjöstrand, T. The Pythia event generator: Past, present and future. Comput. Phys. Commun. 2020, 246, 106910. [Google Scholar]
  43. Sjöstrand, T. A model for initial state parton showers. Phys. Lett. B 1985, 157, 321–325. [Google Scholar] [CrossRef]
  44. Bengtsson, M.; Sjöstrand, T. Coherent parton showers versus matrix elements—Implications of PETRA/PEP data. Phys. Lett. B 1987, 185, 435–440. [Google Scholar] [CrossRef]
  45. Bengtsson, M.; Sjöstrand, T. A comparative study of coherent and non-coherent parton shower evolution. Nucl. Phys. B 1987, 289, 810–846. [Google Scholar] [CrossRef]
  46. Norrbin, E.; Sjöstrand, T. QCD radiation off heavy particles. Nucl. Phys. B 2001, 603, 297–342. [Google Scholar] [CrossRef] [Green Version]
  47. Lönnblad, L. ARIADNE version 4: A Program for simulation of QCD cascades implementing the color dipole model. Comput. Phys. Commun. 1992, 71, 15. [Google Scholar] [CrossRef]
  48. Höche, S.; Reichelt, D.; Siegert, F. Momentum conservation and unitarity in parton showers and NLL resummation. J. High Energy Phys. 2018, 2018, 118. [Google Scholar] [CrossRef] [Green Version]
  49. Höche, S.; Prestel, S. The midpoint between dipole and parton showers. Eur. Phys. J. C 2015, 75, 461. [Google Scholar] [CrossRef] [Green Version]
  50. Höche, S.; Prestel, S. Triple collinear emissions in parton showers. Phys. Rev. D 2017, 96, 074017. [Google Scholar] [CrossRef] [Green Version]
  51. Höche, S.; Krauss, F.; Prestel, S. Implementing NLO DGLAP evolution in parton showers. J. High Energy Phys. 2017, 2017, 93. [Google Scholar] [CrossRef] [Green Version]
  52. Dulat, F.; Höche, S.; Prestel, S. Leading-color fully differential two-loop soft corrections to QCD dipole showers. Phys. Rev. D 2018, 98, 074013. [Google Scholar] [CrossRef] [Green Version]
  53. Prestel, S.; Spannowsky, M. HYTREES: Combining matrix elements and parton shower for hypothesis testing. Eur. Phys. J. C 2019, 79, 546. [Google Scholar] [CrossRef] [Green Version]
  54. Andersen, J.R.; Gütschow, C.; Maier, A.; Prestel, S. A Positive Resampler for Monte Carlo events with negative weights. Eur. Phys. J. C 2020, 80, 1007. [Google Scholar] [CrossRef]
  55. Gellersen, L.; Prestel, S.; Spannowsky, M. Coloring mixed QCD/QED evolution. SciPost Phys. 2022, 13, 034. [Google Scholar]
  56. Riehn, F.; Engel, R.; Fedynitch, A.; Gaisser, T.K.; Stanev, T. A new version of the event generator Sibyll. PoS ICRC 2016, 2015, 558. [Google Scholar]
  57. Ahn, E.-J.; Engel, R.; Gaisser, T.K.; Lipari, P.; Stanev, T. Cosmic ray interaction event generator SIBYLL 2.1. Phys. Rev. D 2009, 80, 094003. [Google Scholar]
  58. Gaisser, T.K.; Halzen, F. “Soft” Hard Scattering in the Teraelectronvolt Range. Phys. Rev. Lett. 1985, 54, 1754. [Google Scholar]
  59. Pancheri, G.; Srivastava, Y. Jets in Minimum Bias Physics. Conf. Proc. C 1985, 28, 850313. [Google Scholar]
  60. Durand, L.; Hong, P. QCD and rising cross sections. Phys. Rev. Lett. 1987, 58, 303. [Google Scholar]
  61. Bengtsson, H.-U.; Sjostrand, T. The Lund Monte Carlo for hadronic processes—PYTHIA version 4.8. Comput. Phys. Commun. 1987, 46, 43–82. [Google Scholar] [CrossRef]
  62. Sjostrand, T. Status of fragmentation models. Int. J. Mod. Phys. A 1988, 3, 751–823. [Google Scholar] [CrossRef]
  63. Drescher, H.J.; Hladik, M.; Ostapchenko, S.; Pierog, T.; Werner, K. Parton-based gribov-regge theory. Phys. Rept. 2001, 350, 93–289. [Google Scholar] [CrossRef]
  64. Heck, D.; Knapp, J.; Capdevielle, J.N.; Schatz, G.; Thouw, T. CORSIKA: A Monte Carlo code to simulate extensive air showers. FZKA-6019. 1998. [Google Scholar]
  65. Pierog, T. LHC results and high energy cosmic ray interaction models. J. Phys. Conf. Ser. 2013, 409, 012008. [Google Scholar]
Figure 1. The predictions of Monte-Carlo event generators (Pythia, Sibyll, EPOS) in comparison with the experimental data for the transverse momentum distributions of all charged particles at 0.9 TeV. The distributions are presented in bins of pseudorapidity with a width of 0.2 from 0.0 to 2.4. The markers represent the experimental measurements, while the lines are the model predictions. The red, green, blue, yellow, and pink colors are used to show the models’ predictions for Pythia—Simple, Pythia—Vincia, Pythia—Dire, Sibyll, and EPOS, respectively. Each plot’s lower panel is the ratio of the Monte-Carlo prediction to the data.
Symmetry 14 02401 g001aSymmetry 14 02401 g001b
Figure 2. The predictions of Monte-Carlo event generators (Pythia, Sibyll, EPOS) in contrast with the experimental data for the transverse momentum distributions of all charged particles at 2.36 TeV. The distributions are presented in bins of pseudorapidity with a width of 0.2 from 0.0 to 2.4. The markers represent the experimental measurements, while the lines are the model predictions, as shown in the legend of the plot. Each plot’s lower panel is ratio of the Monte-Carlo prediction to the data.
Symmetry 14 02401 g002aSymmetry 14 02401 g002b
Figure 3. The predictions of Monte-Carlo event generators (Pythia, Sibyll, EPOS) in contrast with the experimental data for the transverse momentum distributions of all charged particles at 7 TeV. The distributions are presented in bins of pseudorapidity with a width of 0.2 from 0.0 to 2.4. The markers represent the experimental measurements, while the lines are the models’ predictions, as shown in the plots’ legends. The lower panel of each plot is the ratio of the data to the Monte-Carlo prediction.
Symmetry 14 02401 g003aSymmetry 14 02401 g003b
Figure 4. The results of the fitting procedure with the standard distribution in Equation (1) are presented for the p T distributions of the experimental data at 0.9, 2.36, and 7 TeV. The distributions are presented in bins of pseudorapidity with a width of 0.2 from 0.0 to 2.4. Here, the markers represent the experimental measurements at the three energies, while the lines are the results of the fitting with the standard distribution function.
Symmetry 14 02401 g004
Figure 5. The effective temperatures as a function of the particles’ pseudorapidity are presented for the experimental data. The square, triangle, and circle are used to show the effective temperature values at 0.9, 2.36, and 7 TeV, respectively.
Symmetry 14 02401 g005
Publisher’s Note: MDPI stays neutral with regard to jurisdictional claims in published maps and institutional affiliations.