1. Introduction
Crowd density estimation is a critical problem in computer vision that significantly impacts applications such as autonomous driving, visual surveillance, crowd management, public space design, and warning visually distracted drivers before an accident occurs. In recent years, there has been an increase in research into crowd density estimation, with an increase in the number of researchers attempting to design more complex projects to address the issue. Studies show that a maximum threshold has not been reached despite extensive research on crowd density estimation. The irregular scale of objects in an image due to occlusion or an object’s varying distance from a camera and varying scene density are the leading causes of the current state-of-the-art challenge. Fundamentally, there are two different approaches to deal with the problem, i.e., traditional methods such as pixel-level and object-level density estimation and a deep learning-based approach.
The traditional methods employ low-level feature processing algorithms. Several crowd density estimations have been proposed using this approach considering object distribution in the scene, such as sparse density and dense crowd scenes. The works [
1,
2,
3] apply background subtraction and edge detection for congested crowd density estimation. Here, they explore that the linear combination of parameters such as the number of pixels after segmentation (e.g., number of non-background pixels) and the number of thinned edge pixels determine the number of people in the scene. Their approach also comprises geometrical correction due to camera perspectives to account that the same person’s dimensions may change at different locations. When a substantial occlusion occurs, the linear function that maps pixel counts to the number of objects in the scene fails. In the other problem domain, sparse density estimation, the proposed algorithms focus on counting individual objects in a scene by analyzing image texture and detecting an individual object. Algorithms that rely on texture features are investigated at a coarser grain than pixel-based methods. The works [
4,
5,
6] estimate the objectness score using texture analysis procedures such asa gray-level dependency matrix, straight line segments, Fourier analysis, fractal dimension, and texture analysis. Finally, classifiers such as neural networks, Bayesian models, and SVMs determine whether a specific scene region contains a required object.
The second approach is based on the convolutional neural network (CNN); the proposed techniques in this approach can be classified as detection or regression-based. A detection-based approach [
7,
8,
9] locates objects in the scene using detectors, and the number of detected objects is then used to calculate the crowd count. The detection-based methods correctly work for an ideal scene with sparse crowd density and large-scale objects. Regression-based methods [
10,
11,
12,
13,
14,
15] compute a crowd’s density without explicitly detecting and localizing each individual. They primarily learn the mapping between a feature of image patches to crowd counts directly. Regression-based methods typically perform well in crowded patches because they can capture general density information while taking advantage of the rich context in local patches. Furthermore, several modules are incorporated into standard CNN regression and classification models to improve the density estimation accuracy. For example, multi-column architectures [
16] are a popular solution. In a multi-column architecture, each branch layer has a different kernel size, architecture depth, and cost function. Finally, for a better density estimation result, the output from each branch layer is combined.
The current state-of-the-art performances still have a gap for a dynamic scene with changing spatial and temporal domains and a background with varying size objects. For example, image patches of varying density are standard in snapshots. Some areas of a location have dense crowds, while others have sparse crowds, and still, others have only a background. A scene, on the other hand, changes over time. For example, a street may be congested with people or cars during the working day, especially in the morning and evening. However, the exact location may be devoid of people or vehicles during the holiday. The other challenge is a scene with very small to very large objects.
We propose a framework for the problem mentioned above by leveraging CNN’s scale separation and interaction structure. CNN contains cascading layers of convolution, nonlinearity, and dimension reduction operations. A convolution processes information in a local neighborhood, but the cascading of convolution layers causes the relationship between image features to have long-term modeling dependencies in images. This dependency results in complex geometrical shapes aggregated from the tiniest neighborhood, progressively aggregated broader and broader. CNN’s successive nonlinearity and pooling operations diminish the feature strength of small or occluded objects, resulting in only objects with dominant feature maps such as large-scale objects, and a scene with a sparse object distribution participating in a crowd density estimation function. Therefore, to handle all object scales and the dynamic nature of a scene, we propose a parallel multi-scale receptive field framework that uses feature maps generated from the framework’s various depths. We examine the framework prediction accuracy using the feature maps derived from the framework’s lower layers.
The experiments show that the framework prediction is overestimated compared to the background truth. We explore that overrating is caused by a weak interrelationship between receptive field units and high background noise at lower layers. On the other hand, when the framework’s higher layers feature maps are used as input for the density estimation function, the framework predicts an underrated value compared to the background truth. Since successive pooling and convolution operations on small-size objects cause, object’s feature maps do not participate in prediction because their signals almost contain no information at the end of the framework. Accordingly, to take advantage of each layer and tackle the problems related to each layer, we employ non-local attention [
17] and global attention [
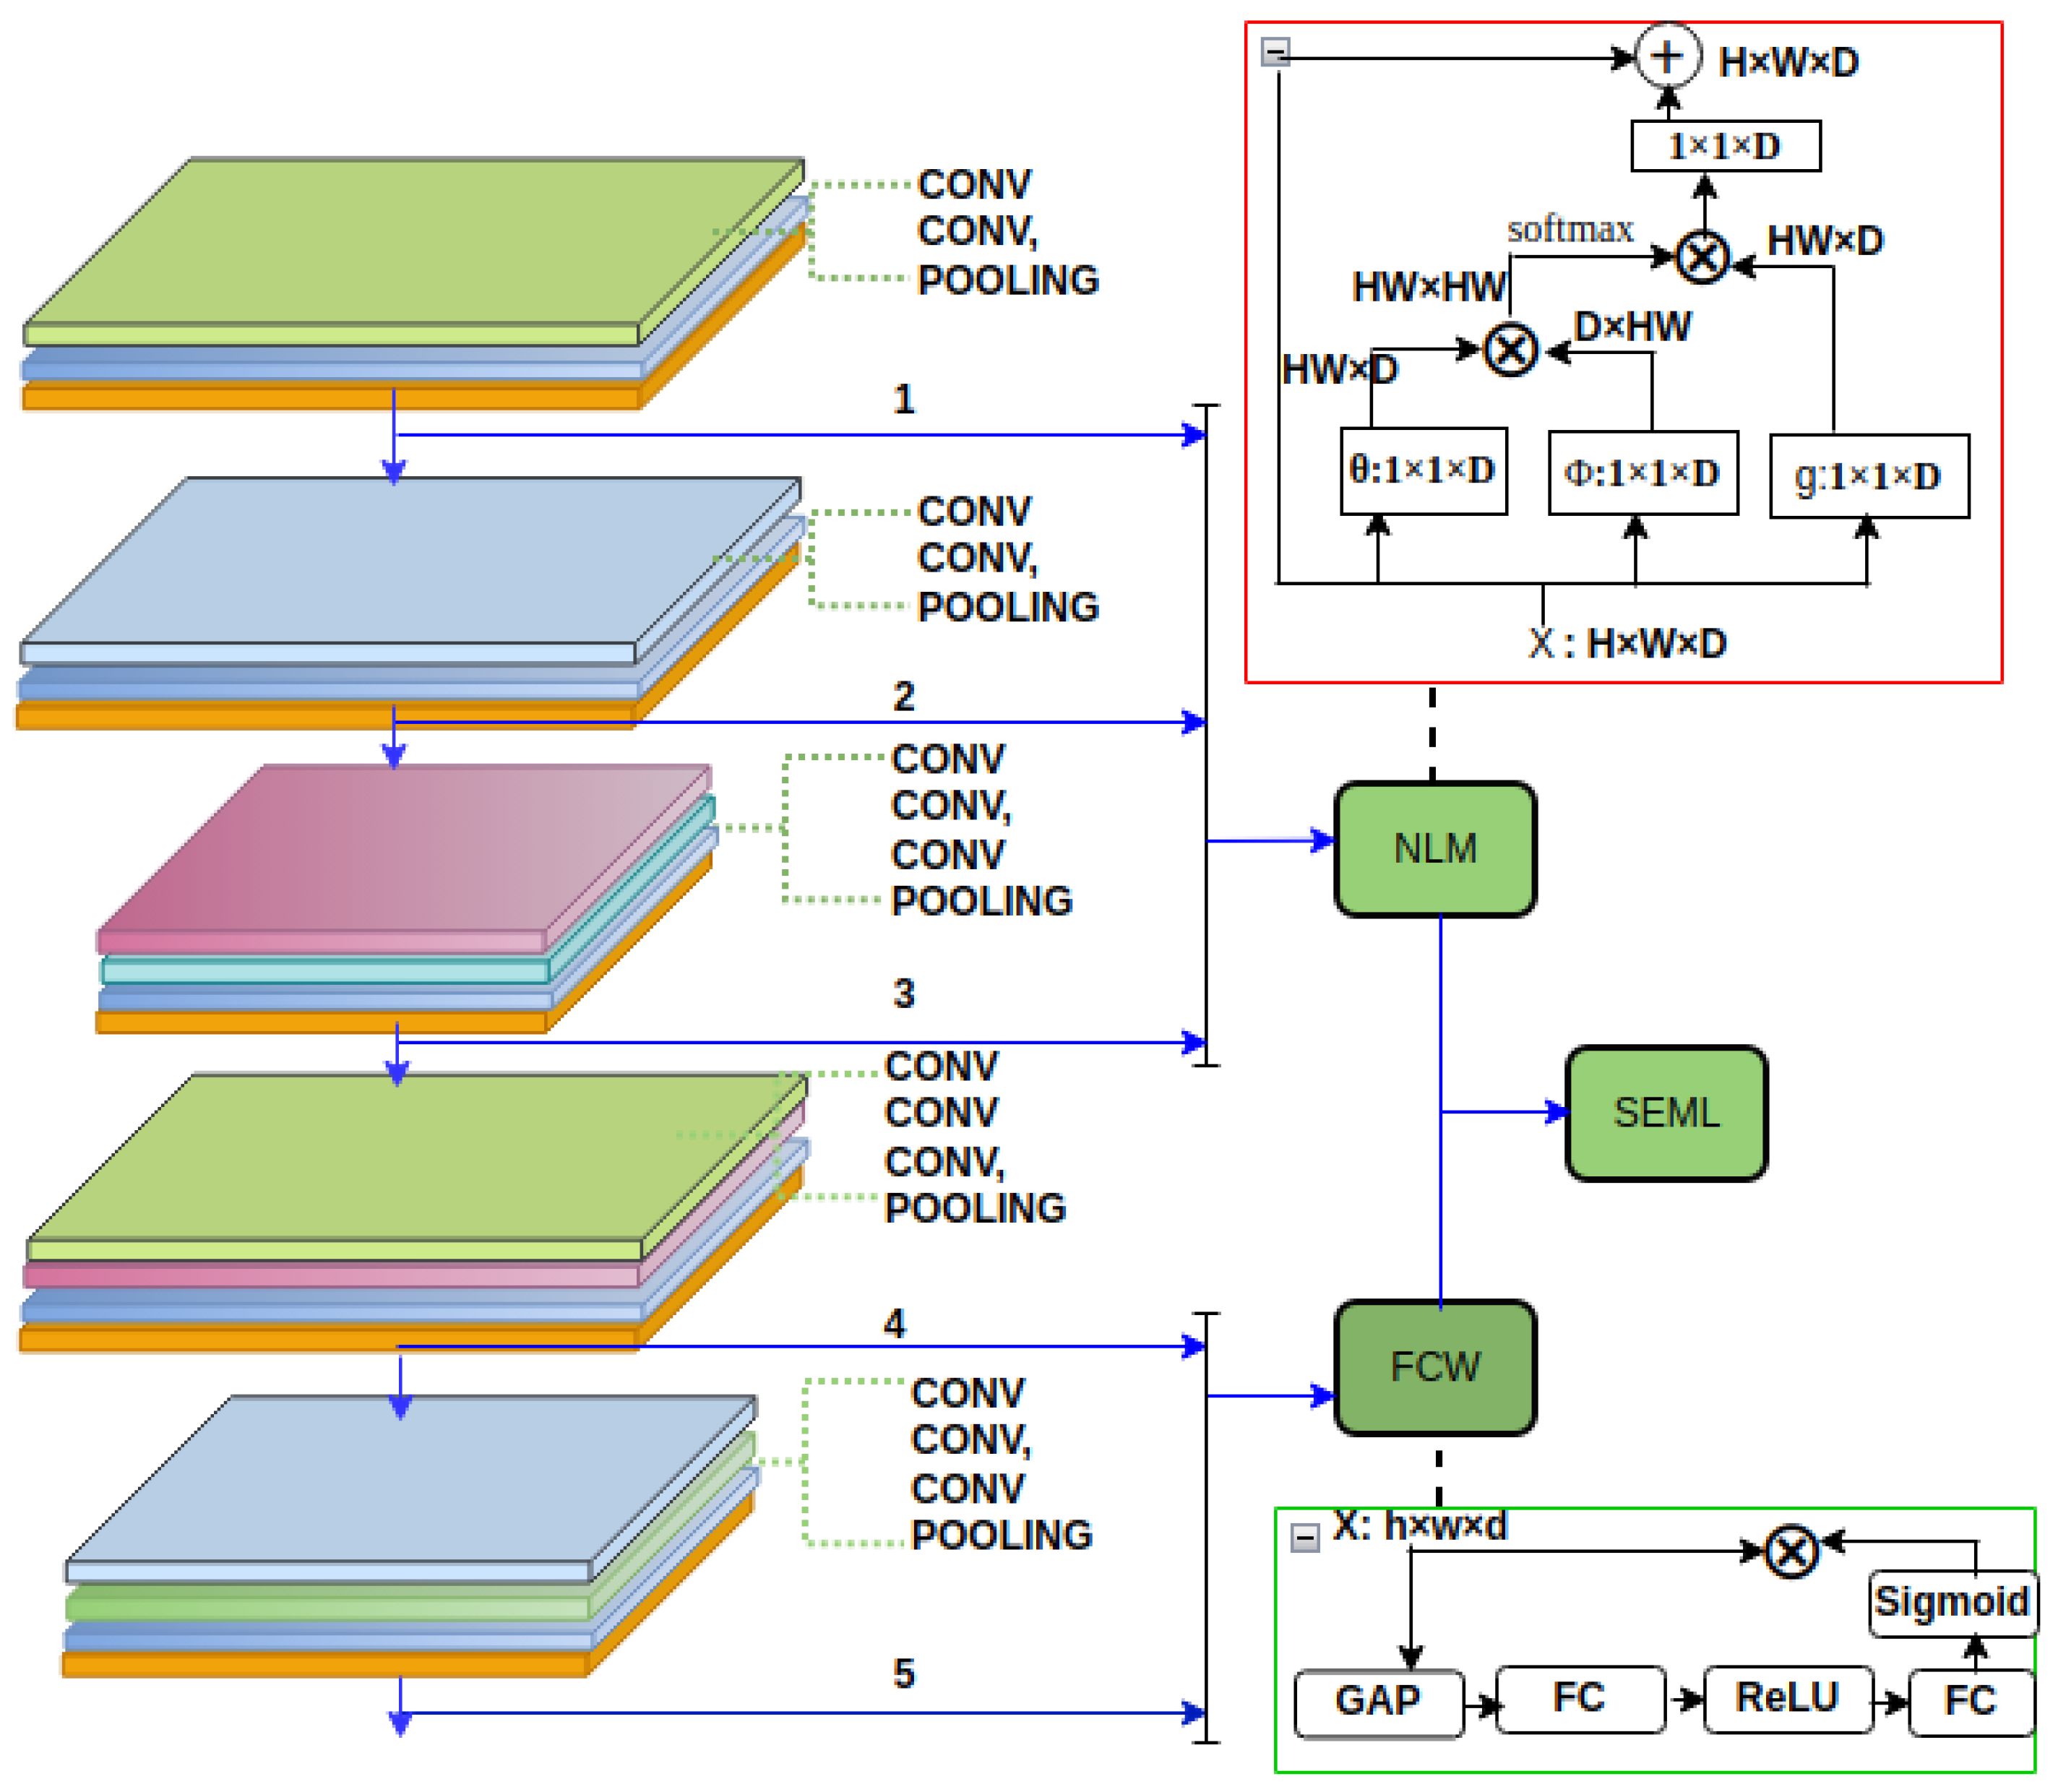
18] on the lower and higher layers of the framework, respectively. The non-local attention module creates a long-range interaction between several parts of an image without deep stacks of convolutional operations, i.e., makes a descendant hierarchy that combines non-local and local data. The global attention module eliminates the feature map’s depth containing no feature maps because, at the higher layers, most feature maps’ depth has weak signals. Eventually, we propose ensemble stack meta-learning of all branch’s outputs to predict crowd density, as shown in
Figure 1. The main contributions made in this work are as follows:
We propose a parallel multi-scale receptive field framework that uses feature maps generated by the framework’s various depths. In addition, we also investigate the effect of the attention operation on crowd density prediction in a dynamic scene with objects of various scales.
We propose an ensemble stack meta-learning that best combines the framework outputs’ predictions resulting from various depth feature maps. As a result, the framework can use the capabilities of a variety of high-performing layers to make predictions that outperform any single layer’s feature maps.
We examine how a CNN’s scale separation and integration properties can aid crowd density prediction with varying scales, which means that a high-dimensional feature of an image can be projected to a low-dimensional real value, such as the number of people in a crowd.
Detail experiments and analyses are conducted on the Shanghai Tech dataset [
19] and UCF CC 50 [
20]. Our approach achieves a MAE of 263 and an MSE of 398.2 on the UCF CC 50 dataset.
We organized the rest of the paper as follows: we describe related work in
Section 2. Then, the proposed architecture and the description of its components are presented in
Section 3. Subsequently, we conduct detailed experiments, analyze the result, and conduct an ablation study. The last section summarizes the paper and makes some directions for further research.
2. Related Works
Various approaches have been proposed to estimate crowd density; the previous studies employ image processing techniques. In this approach, after removing the image background and thinning the edges, the number of individual objects in the image was approximated using linear regression of the number of pixels [
21,
22,
23]. The other methods relied on the detection of individual objects. This method is not suitable for dense crowds because not everything will face the camera, and there will be a lot of occlusions. This section looks into CNN-based crowd counting methods, including fundamental CNN-based, multi-column-based, and single-column-based methods.
2.1. Fundamental CNN-Based Methods
This network structure utilizes the core CNN layers without integrating additional feature data. They are typically included in the first work that involves using CNN for density prediction and crowd count [
24,
25,
26]. It works well in a setting with a sparse distribution of objects and large object sizes, but for other settings, it gives a worse result.
2.2. Multi-Column Based Method
Because typical network topologies utilize a large number of columns to record multi-scale information corresponding to a wide range of receptive fields, the precision of crowd counting is exceptional. This contributes to the remarkable precision with which crowd counting can be performed. Similar to the concepts of Mixture of Counting CNNs (MoC-CNN) [
27,
28] and contextual pyramid CNNs (CP-CNN) [
29], scale-aware attention networks (SAAN) [
30] generate high-quality density maps by fusing global and local contextual information. In spite of this, it is equipped with a visual attention mechanism that allows it to automatically choose the optimal size for both the global and local image patch levels. MXML [
31] employs a statistical network for the examination of standard characteristics when conducting an analysis on multiple columns. The mutual learning method (MML) proposed for use in analyzing individual mini-batch training data is able to optimize specific columns alternately while maintaining the current state of other columns. Using a front-end dilated-CNN with variable dilation rates and a back-end adaptive deformable convolution, Ref. [
32] makes accurate predictions about the locations of objects. Experiments conducted by Li et al. [
33] demonstrated that despite the significant advancements made by these multi-column networks, they still have some shortcomings. This was demonstrated despite the significant progress made by these networks. A multi-column CNN-based approach has a number of disadvantages, including a lengthy training period, information redundancy due to different branches, the requirement for density level classifiers prior to sending images into networks, and the consumption of numerous parameters for density level classifiers as opposed to preparing them for the generation of final density maps. These disadvantages can be mitigated by employing a CNN-based method with a single column. As a result, a large number of researchers are encouraged to utilize networks that are easier to use, more productive, and more efficient. As a result, new network architectures based on a single column are emerging to meet the requirements of more challenging crowd-counting scenarios.
2.3. Single-Column Based Methods
The principle of single-column network architectures [
34,
35,
36,
37,
38,
39,
40,
41] is to avoid increasing network complexity by deploying a single CNN with a deeper depth as opposed to the bloated structure of multi-column architectures. Architecture and training efficiency have contributed to the recent rise in popularity of single-column network layouts. Our technique is a part of a single-column architecture. We use the features of each layer of the base model (in our case, VGG-16) for prediction. Despite the fact that each layer’s features are capable of representing different object scales and densities, some layers have high background noise while others have low feature values. Therefore, we developed a module to circumvent this restriction. The final component, The stack ensemble meta-learning module, allows the framework predictions for each layer to contribute to the final prediction in proportion to their trust or estimated performance.
3. The Proposed Architecture
This section contains our proposed architecture, called parallel multi-size receptive fields and stack ensemble meta-learning (PMSRML), its components, basic design ideas, experiments and analyses, and an ablation test. Non-local attention, feature map channel weights, and stack ensemble meta-learning are the three modules in the proposed architecture.
3.1. The CNN Scales Separation and Integration Property
The CNN scale separation mechanism enables all CNN frameworks to approximate a low-dimensional regression output
for a high-dimensional input signal
x [
42]. This scale separation nature of a CNN enables each object scale in an image to be represented in various depths of CNN layers. Each scale of objects in an image is represented in various depths of CNN layers. Due to the fact that convolutional and recurrent operations process a local neighborhood in space, the network’s lower layers are responsible for representing smaller-scaled objects.
The cascade of convolution operations creates long-range dependencies between receptive field units, resulting in large objects representing the higher layers. The non-linearity operations [
43] provide an interaction across a scale resulting in objects in an image represented in different depths of a framework.
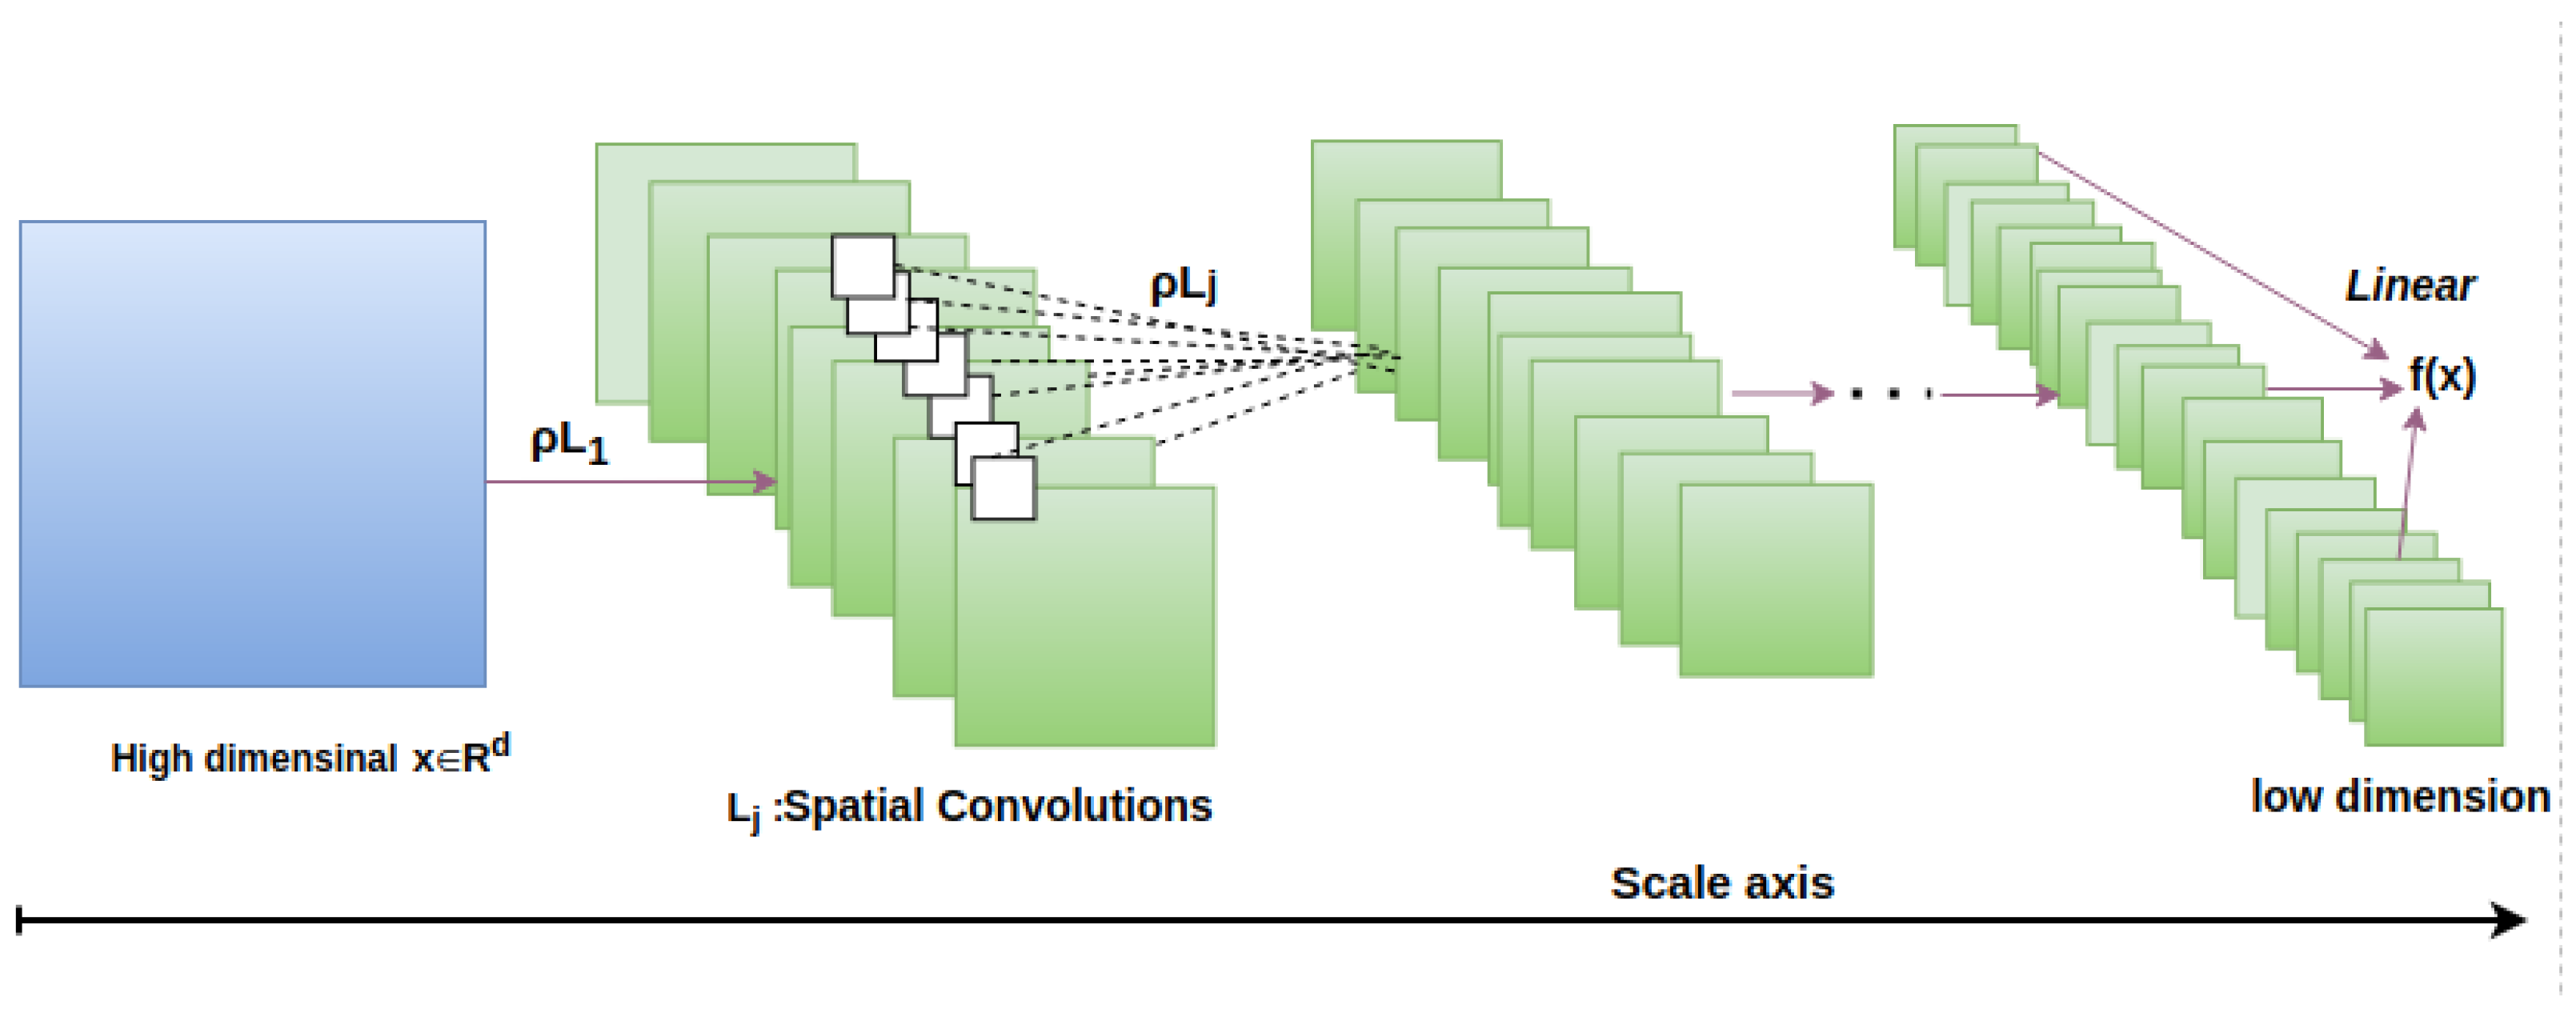
Figure 2 is a representation of how a scale increases as an input image passes from the input layer to the output layer of a framework. Here,
f is a function (framework), and
X is the framework’s input, which has a size of
pixels. The input is processed by a cascade of convolution layers followed by nonlinear operations
. At the very first layers of the framework, information is represented by individual pixels or by the integration of several neighboring pixels. Then, a cascading of convolution layers and nonlinear operation take a collection of pixels and turn them into a meaningful representation of an object. As a consequence of this, the aforementioned form of computational architecture makes it possible to separate scales and transforms a high-dimensional input value,
X, into a one-dimensional output value,
, as a result of an attraction of a piece of signal, as shown in
Figure 3.
3.2. Non-Local Attention Module
Using each layer’s features for the prediction can help accommodate a wide variety of object scales and densities; however, these features are plagued by a large number of bugs that negatively impact the framework’s performance and increase resource utilization. A receptive field unit value in the lower layers is obtained by averaging the values of neighboring pixels with similar grey-level values. The issue with this unit output is that approximating only grey level values in a single pixel is not robust to noise and is too small to consider detail and structure. This limitation allows noise and background details to participate in the framework’s crowd density estimation, resulting in incorrect output. As a result, we employ non-local operations in the framework’s lower layers [
17,
44]. (i.e., the output of layers one, two, and three, as shown in
Figure 1).
The non-local operation module improves feature maps by allowing a value of each receptive field unit to interact with all other values in feature maps, resulting in non-local behavior for the receptive’s unit value, which means it is robust to noise and can handle detail structure without cascading of convolution operations. A global reference for each pixel-level prediction is defined in Equation (1)
where each output position value is determined by the covariance between the expected pixel and every other pixel, where each pixel is assumed to be a random variable. The restored pixel is simply a weighted sum of all pixel values, where the weights represent the relationship between each pixel and the target pixel. Here,
i is the output position’s index, and
j is the index that enumerates all possible positions.
x is the input image,
is the output at index
i and
y is the output signal of the same size as
x. A function
f, which is defined in Equation (2), calculates a scalar between
i and all
j. The function
g computes a representation of the input signal at
j is defined in Equation (3); factor
is the normalization factor, as
, where
N is the number of positions in
x. Several variants of functions
f and
g can be instantiated for a reader interested in investigating how various forms of functions
f and
g can be referred to [
17,
45]; for our problem, the framework’s predicted output outperforms other instantiated functions when
f is defined as a dot similarly function.
where
is a weight matrix to be learned. It is implemented as a
convolution in space. As shown in
Figure 1 of the red container, here
and
is a weight vector that projects the concatenated vector to a scalar.
3.3. Feature Map’s Channels Weigh Module
We investigate the presence of a weak signal in the majority of feature maps of each higher layer, which is not significant but increases computational complexity.
Figure 4 depicts the distribution of channel signals in the higher layers of the feature map; approximately half of the channel signals have zero value output. As a result, the squeeze and excitation operation [
18] is adopted to the proposed framework. This operation contains a parameter that appropriately re-weights each channel, making it more sensitive to significant features while ignoring irrelevant features. The feature maps pass through several operators, as shown in
Figure 1 of a green container, including global average pooling (GAP), which is used to extract global information from each feature map channel, and excitation operators, which is a series of a fully connected layer, Relu, a fully connected layer, and Sigmoid. Eventually, the module output then scales the input feature maps; during the scaling operation, the original feature map and the output of the sigmoid activation function are multiplied element by element.
3.4. The Stack Ensemble Meta-Learning
We used feature maps created from various depths as input to test the framework’s prediction performance. We noticed that some layers’ prediction output has a high variance and low bias, whereas others have low variance and high bias. As a result, we propose stack ensemble meta-learning to improve prediction while balancing the tradeoff between bias and variance. Ensembles are employed to produce greater prediction performance on a predictive modeling task than a single predictive model [
46].
The stack ensemble meta-learning module allows the framework predictions for each depth to contribute to the final prediction in proportion to their trust or estimated performance. Experiments demonstrate that a prediction model that uses features generated from the shallow to deep layers of a model yields distinct results. With approvals for the use of ensembles of models, we could make more accurate predictions. We use features derived from the framework’s layers 1, 2, and 3 as depicted in
Figure 1. for the prediction of density, the experimental evaluation demonstrates that the prediction of the framework overestimates the underlying reality. Low interrelationships between receptor field units and a high level of noise in the lower layers are responsible for overrating, according to our preliminary findings. In contrast, when the density estimation function is provided to feature from the framework’s bottom layers as shown in
Figure 1 (4, 5) feature maps, the framework predicts a value that is less than the true value. Thus, to get a better prediction and generalization we employed the stack ensemble meta-learning. Stacked generalization is an ensemble technique that seeks a diverse group of members by varying the model types fitted to the training data and combining them with a model’s predictions. Stacking is a general procedure in which learners are instructed to group together. Individual learners are called first-level learners, while combined learners are called second-level learners or meta-learners. First, the row of data is provided as input to the base model. Next, a higher layer and lower layer feature pass through the non-local operation and feature map’s channel weight module. The stack ensemble meta-model then discovers (SEML) how to optimally combine the predictions of the non-local operation module and the feature map’s channel weight module. The predictions from both models are then concatenated into a vector and supplied to the SEML as input. The SEML then generates a conclusive forecast for the row of data. The output of this module generates more precise predictions and generalizations than its sub-modules, as defined by Equation (4).
where
and
represent the weights learned by SEML, and
and
represent the output from the sub-models.
and
are the bias parameters. A modeling averaging ensemble combines the prediction from each model equally and frequently yields better average performance than a single model. There are times when we would like less-competent models to contribute more to an ensemble prediction and times when we would like less-competent models to contribute more. Stack ensemble meta-learning is a method that allows multiple models to contribute to a prediction based on their reliability or estimated performance.
4. Experiments and Results
We evaluated the proposed framework on a standard challenging dataset. We will start by briefly introducing two standard datasets. Following that, we set our method to test on these datasets.
UCF CC 50 [
20]
dataset: This dataset comprises 50 grayscale images, each with a head annotation. The number of persons per image ranges from 94 to 4543, with an average of 1280 people per image. Images from various contexts, such as concerts, political rallies, religious meetings, stadiums, and so on, are included in the dataset. We use 5-fold cross-validation to assess the performance of our method.
ShanghaiTech [
19]
dataset: A collection of 1198 annotated images with 330,165 people with head center annotations. This dataset is divided into two units: Part A and Part B. The crowd images in Part B are sparser than in Part A. We use 300 photos for training and 182 images for testing in Part A, and 400 images for training and 316 images for testing in Part B, as described in [
19].
Table 1 contains a detailed summary of both datasets.
4.1. Implementation Details and Evaluation Metrics
Our proposed method was evaluated on two major crowd counting datasets [
19,
20] collected from real-world surveillance cameras. The proposed model was optimized with 200 epochs for all datasets. We set the initial learning rate at 1 × 10
−3 and dropped it to 1 × 10
−5 after 100 epochs. We utilized 5-fold cross-validation to estimate the ability of the model to generalize to new data. To balance the bias-variance trade-off and to improve the generalization of the model, weight constraints in conjunction with dropout (0.5) at the dense layer were applied, and the constraint was applied after every weight update.
To increase the size of the training dataset, each training sample was augmented with 0.3% noise. Adding noise to input samples is thus a straightforward method of data augmentation. Furthermore, the number of training samples for the regression network is increased. As in previous works [
33,
47,
48], mean absolute error (also known as MAE) and mean squared error (MSE) are two of the metrics that we use for evaluation. The MAE metric is used to measure how accurate the algorithm is at estimating the size of a crowd, while the MSE metric is used to measure how well the estimation is performed. Ground truth annotations for each head center in the standard benchmarks are included in each image in the datasets.
where
N is the number of test images,
denotes the number of people in the
ith image, and
denotes the estimated number of people in the
ith image. MAE, in general, reflects the accuracy of the estimates, whereas MSE indicates the robustness of the estimations [
49].
4.2. Experimental Result on UCF CC 50
Table 2 compares the proposed approach with other state-of-the-art methods on the UCF CC 50 dataset. Utilizing all of an image’s foreground features is the standard method for making precise predictions with minimal computational complexity. Nonetheless, when using a CNN for feature extraction, several essential features are discarded during feature propagation as a result of successive pooling and convolution operations; in particular, feature maps for small-sized objects do not contribute to prediction because their signals contain almost no information at the end of the framework. Therefore, numerous strategies have been proposed to capitalize on each layer’s benefits and address each layer’s issues.
A dilated convolution is implemented in the method from [
33]. This method processes C feature maps by incrementally aggregating contextual data at increasing scales without degrading resolution. It is a viable replacement for the pooling player, resulting in a significant improvement in accuracy. Nevertheless, there are approximately
network parameters in total; the alternative method [
31] employs three columns of different-sized filters to obtain distinct scale characteristics.
In other words, it is analogous to adding a statistical network to determine how much information each column contains about the other. Multi-column learning can be facilitated by decreasing the volume of mutual information. Each column in the McML mutual learning scheme is optimized, while the remaining columns in each training data set remain unchanged. Gating CNN employs a visual attention mechanism to automatically select a particular scale at both the global image level and the local image patch level. This is accomplished by looking at the entire image. The first step in the process of adaptively selecting expert CNNs is to assign weights to the predictions of the expert CNNs. This allows the desired result to be achieved. This strategy is comparable to ours in terms of utilizing an attention mechanism to select specific features. Nonetheless, this method employs multiple parallel CNN models, which increases computational complexity, and the results of each parallel model are given equal weight, i.e., the result is the mean of all models. This contrasts with our procedure, which assigns a weight to each set of features based on their contribution.
The results presented in
Table 2 are derived from a review of the pertinent literature, and their validation procedures vary. For example, Ref. [
50] used k-means on SIFT descriptors extracted from the holdout 20 images, and a codebook of K entries were constructed. Then, each pixel was represented by a vector of length K, which is 1 at the dimension corresponding to the entry of the SIFT descriptor at that pixel and 0 for all other dimensions; the other approach [
51] used 5% of the data for testing and the rest for training in addition to a method for determining the optimal number of training samples. The work presented in [
20] employed 10-fold cross-validation, whereas the work presented in [
19,
47] utilized employee hold out validation techniques, and the work [
27,
31,
33]. Apart from the above, our method employs k-fold cross-validation with varying k values.
4.3. Experimental Result on ShanghaiTech
The ShanghaiTech PartB (SHB) [
19] is one of the largest databases that has been collected in real outdoor scenes and was used as a benchmark for our evaluation experiments. A total of 40 images from the dataset were chosen at random for the purpose of validation. Results of our analysis and comparison with other cutting-edge approaches are shown in
Table 3. Congested crowds are difficult to estimate using detection-based frameworks [
54,
55] because of the wide range in object density and size on the SHB dataset.
4.3.1. Individual Input Feature Maps and Their Integration Ablation Analysis
This ablation study examined the individual feature maps’ feature content’s capability for crowd density estimation and how the percent of the performance improves when all framework layers are integrated and used for density estimation.
Table 4 shows the MSE and MAE for each layer and their integration on the UCF CC 50 dataset.
4.3.2. The NLM and SEML Attention Module Ablation Analysis
We experimented without integrating the non-local attention and feature map’s channel weight modules into the main framework to examine their effects. We note that the mean square error automatically raises. Noise and background details features participate in the framework’s crowd density estimation function, resulting in biased prediction, as shown in
Table 5.
We experimented to determine the effect of NLM and FCW on sparse and crowded samples; we find that when the lower layer feature is integrated with NLM, it yields superior results in comparison to FCW. Due to the aggregation of multi-scale contextual information, they are less accurate when applied to dispersed crowds. However, the best result is produced by the FCW sub-model. All very closed objects in the higher layers of features are dominated by a large object, resulting in the disappearance of all small-scale objects’ features. Consequently, only large or dispersed objects can be identified. Consequently, to manage numerous congested areas, we use levels of features to predict crowd density. Finally, we weight their prediction results according to their STEM contribution. In
Table 4 and
Table 5, we display all sub-module integrations.
5. Discussion
In this paper, we discuss the regularity properties of a convolutional neural network (CNN) that allow a high-dimensional image , such as the number of pixels in an image, to be represented by a low-dimensional image , which is the number of crowds in an image. Additionally, the paper investigated how a CNN can recognize objects of various sizes.
A CNN’s key characteristics of multi-scale, regular deformation and sparseness make it the optimal tool for handling the dynamically changing nature of crowd density and the scale of various objects. First, the bottom layers of a CNN aggregate very fine, small-scale information, which is close neighbor information, and then, through the cascading of convolutional and sub-sampling operations, they gradually aggregate information on a larger scale.
This paper predicts a dynamically changing crowd using each layer of a CNN feature because a crowd has various scales ranging from small scales, such as very crowded objects, to large scales, such as sparse objects (large objects). A CNN’s sparsity is also an intriguing characteristic. This property is a result of the nonlinearity function (rectifier) present in each CNN layer, which renders numerous model coefficient parameters null. Therefore, pattern representation with a high-quality sparse dictionary is possible, resulting in reduced computational complexity and a discernible prediction result for crowd density estimation.
In addition, this paper investigates which CNN layers are optimal for dense and sparse crowds. Experiments indicate that the bottom layers of a CNN are effective at predicting dense crowds. The features, however, contain background noise and redundant information. As shown in
Figure 1, we employ a non-local operation module to accommodate such constraints. This is used to improve feature maps by permitting the value of each receptive field unit to interact with all other values in feature maps, resulting in non-local behavior for the receptive’s unit value, which is noise-resistant and capable of handling intricate structures without cascading convolution operations.
The features of the refined image’s upper layers represent the global information (features of large objects). However, the presence of a weak signal in the majority of each higher layer’s feature maps is not significant, but it does increase computational complexity. Consequently, this paper investigates the feature map’s channel weight module (FCW) for removing a low-signal feature map that is irrelevant for crowd estimation. In order to handle all object scales, the paper utilizes all CNN layer features for predictions. The paper concludes by proposing stacked ensemble meta-learning, which discovers how to optimally combine the predictions of the non-local operation module and the channel weight module of the feature map. The predictions from both models are then combined into a vector and provided as input to the STEM. The STEM then generates a conclusive prediction for the data row.
The proposed method predicts sparse to dense crowd densities with remarkable accuracy and minimal computational complexity. However, there is still a discrepancy between the ground truth and the most advanced prediction results. Consequently, a maximum accuracy result can be achieved by increasing the size of the dataset and utilizing a variable size of kernels to maintain resolution, which is essential for improving prediction. The other alternative is unsupervised learning, which can resolve the labeling issue and make a system more adaptable.
6. Conclusions
In this paper, parallel multi-size receptive fields and stack ensemble meta-learning (PMSRML) is proposed. It exploits CNN’s scale separation and interactive nature to produce a robust scale-adaptive crowd counter for each image using multiple feature maps of varying scales; to handle all object scales, all CNN layer features are used for predictions in this paper. The conclusion of the paper proposes stacked ensemble meta-learning, which finds the optimal way to combine the predictions of the non-local operation module and the channel weight module of the feature map. The predictions from both models are then combined into a vector and fed into the STEM as an input. The STEM then produces an authoritative prediction for the data row. Extensive experiments on standard crowd counting standards demonstrate the efficacy and significance of the proposed method in comparison to the current state-of-the-art. The proposed method accurately predicts sparse to dense crowd densities with minimal computational effort. However, there is still a discrepancy between the ground truth and the results of the most advanced prediction models. Increasing the size of the dataset and utilizing a variable size of kernels to maintain resolution, which is essential for enhancing prediction, yields the highest level of accuracy. Unsupervised learning is an alternative. It can solve the problem of labeling and increase the flexibility of a system.
Author Contributions
Conceptualization, A.A.A., W.T.; Formal analysis, A.A.A., W.T.; Funding acquisition, W.T. and A.A.A.; Investigation, A.A.A. and W.T.; Methodology, A.A.A.; Resources, A.A.A.; Supervision, W.T., A.A.A. and N.W.H.; Visualization, A.A.A., W.T., M.U.A. and N.W.H.; Writing—original draft, A.A.A., W.T.; Writing—review & editing, A.A.A., W.T., M.U.A. and N.W.H. All authors have read and agreed to the published version of the manuscript.
Funding
This work is supported by the University of Electronic Science and Technology of China, School of Information and Software Engineering, under the National Key Research and Development Plan and Award. Grant number 2018AAA0103203.
Data Availability Statement
Not applicable.
Acknowledgments
We would like to extend our gratitude to Wenhong Tian for his detailed oversight, as well as to the Editors and Reviewers for the contributions they made to this article.
Conflicts of Interest
The authors declare no conflict of interest.
References
- Davies, A.C.; Yin, J.H.; Velastin, S.A. Crowd monitoring using image processing. Electron. Commun. Eng. J. 1995, 7, 37–47. [Google Scholar] [CrossRef]
- Rahmalan, H.; Nixon, M.S.; Carter, J.N. On crowd density estimation for surveillance. In Proceedings of the 2006 IET Conference on Crime and Security, London, UK, 13–14 June 2006. [Google Scholar]
- Kong, D.; Gray, D.; Tao, H. A viewpoint invariant approach for crowd counting. In Proceedings of the 18th International Conference on Pattern Recognition (ICPR’06), Hong Kong, China, 20–24 August 2006; Volume 3, pp. 1187–1190. [Google Scholar]
- Marana, A.; da Costa, L.; Lotufo, R.; Velastin, S. On the efficiency of texture analysis for crowd monitoring. In Proceedings of the International Symposium on Computer Graphics, Image Processing, and Vision (Cat. No.98EX237), Rio de Janeiro, Brazil, 20–23 October 1998. [Google Scholar]
- Wu, X.; Liang, G.; Lee, K.K.; Xu, Y. Crowd density estimation using texture analysis and learning. In Proceedings of the 2006 IEEE International Conference on Robotics and Biomimetics, Kunming, China, 17–20 December 2006; pp. 214–219. [Google Scholar]
- Chan, A.B.; Liang, Z.S.J.; Vasconcelos, N. Privacy preserving crowd monitoring: Counting people without people models or tracking. In Proceedings of the 2008 IEEE Conference on Computer Vision and Pattern Recognition, Anchorage, AK, USA, 24–26 June 2008; pp. 1–7. [Google Scholar]
- Shi, M.; Yang, Z.; Xu, C.; Chen, Q. Revisiting perspective information for efficient crowd counting. In Proceedings of the IEEE/CVF Conference on Computer Vision and Pattern Recognition, Long Beach, CA, USA, 15–20 June 2019; pp. 7279–7288. [Google Scholar]
- Liu, W.; Salzmann, M.; Fua, P. Context-aware crowd counting. In Proceedings of the IEEE/CVF Conference on Computer Vision and Pattern Recognition, Long Beach, CA, USA, 15–20 June 2019; pp. 5099–5108. [Google Scholar]
- Saleh, F.; Aliakbarian, M.S.; Salzmann, M.; Petersson, L.; Gould, S.; Alvarez, J.M. Built-in foreground/background prior for weakly-supervised semantic segmentation. In Proceedings of the European Conference on Computer Vision, Munich, Germany, 8–14 September 2016; Springer: Berlin/Heidelberg, Germany, 2016; pp. 413–432. [Google Scholar]
- Idrees, H.; Soomro, K.; Shah, M. Detecting humans in dense crowds using locally-consistent scale prior and global occlusion reasoning. IEEE Trans. Pattern Anal. Mach. Intell. 2015, 37, 1986–1998. [Google Scholar] [CrossRef]
- Wang, Q.; Chen, M.; Nie, F.; Li, X. Detecting coherent groups in crowd scenes by multiview clustering. IEEE Trans. Pattern Anal. Mach. Intell. 2018, 42, 46–58. [Google Scholar] [CrossRef] [PubMed]
- Heim, E.; Seitel, A.; Andrulis, J.; Isensee, F.; Stock, C.; Ross, T.; Maier-Hein, L. Clickstream analysis for crowd-based object segmentation with confidence. IEEE Trans. Pattern Anal. Mach. Intell. 2017, 40, 2814–2826. [Google Scholar] [CrossRef] [PubMed]
- Gao, S.; Ye, Q.; Xing, J.; Kuijper, A.; Han, Z.; Jiao, J.; Ji, X. Beyond group: Multiple person tracking via minimal topology-energy-variation. IEEE Trans. Image Process. 2017, 26, 5575–5589. [Google Scholar] [CrossRef]
- Ling, M.; Geng, X. Indoor crowd counting by mixture of gaussians label distribution learning. IEEE Trans. Image Process. 2019, 28, 5691–5701. [Google Scholar] [CrossRef]
- Sindagi, V.A.; Patel, V.M. Ha-ccn: Hierarchical attention-based crowd counting network. IEEE Trans. Image Process. 2019, 29, 323–335. [Google Scholar] [CrossRef] [PubMed]
- Sindagi, V.A.; Patel, V.M. Cnn-based cascaded multi-task learning of high-level prior and density estimation for crowd counting. In Proceedings of the 2017 14th IEEE International Conference on Advanced Video and Signal Based Surveillance (AVSS), Lecce, Italy, 29 August–1 September 2017; pp. 1–6. [Google Scholar]
- Buades, A.; Coll, B.; Morel, J.M. A non-local algorithm for image denoising. In Proceedings of the 2005 IEEE Computer Society Conference on Computer Vision and Pattern Recognition (CVPR’05), San Diego, CA, USA, 20–26 June 2005; Volume 2, pp. 60–65. [Google Scholar]
- Hu, J.; Shen, L.; Sun, G. Squeeze-and-excitation networks. In Proceedings of the IEEE Conference on Computer Vision and Pattern Recognition, Salt Lake City, UT, USA, 18–23 June 2018; pp. 7132–7141. [Google Scholar]
- Zhang, Y.; Zhou, D.; Chen, S.; Gao, S.; Ma, Y. Single-image crowd counting via multi-column convolutional neural network. In Proceedings of the IEEE Conference on Computer Vision and Pattern Recognition, Las Vegas, NV, USA, 27–30 June 2016; pp. 589–597. [Google Scholar]
- Idrees, H.; Saleemi, I.; Seibert, C.; Shah, M. Multi-source multi-scale counting in extremely dense crowd images. In Proceedings of the IEEE Conference on Computer Vision and Pattern Recognition, Portland, OR, USA, 23–28 June 2013; pp. 2547–2554. [Google Scholar]
- Regazzoni, C.S.; Tesei, A. Distributed data fusion for real-time crowding estimation. Signal Process. 1996, 53, 47–63. [Google Scholar] [CrossRef]
- Regazzoni, C.S.; Tesei, A.; Murino, V. A real-time vision system for crowding monitoring. In Proceedings of the IECON’93-19th Annual Conference of IEEE Industrial Electronics, Maui, HI, USA, 15–19 November 1993; pp. 1860–1864. [Google Scholar]
- Mogale, D.; De, A.; Ghadge, A.; Aktas, E. Multi-objective modelling of sustainable closed-loop supply chain network with price-sensitive demand and consumer’s incentives. Comput. Ind. Eng. 2022, 168, 108105. [Google Scholar] [CrossRef]
- Fu, M.; Xu, P.; Li, X.; Liu, Q.; Ye, M.; Zhu, C. Fast crowd density estimation with convolutional neural networks. Eng. Appl. Artif. Intell. 2015, 43, 81–88. [Google Scholar] [CrossRef]
- Wang, C.; Zhang, H.; Yang, L.; Liu, S.; Cao, X. Deep people counting in extremely dense crowds. In Proceedings of the 23rd ACM International Conference on Multimedia, Brisbane, Australia, 26–30 October 2015; pp. 1299–1302. [Google Scholar]
- Krizhevsky, A.; Sutskever, I.; Hinton, G.E. Imagenet classification with deep convolutional neural networks. Adv. Neural Inf. Process. Syst. 2012, 25, 84–90. [Google Scholar] [CrossRef]
- Kumagai, S.; Hotta, K.; Kurita, T. Mixture of counting cnns: Adaptive integration of cnns specialized to specific appearance for crowd counting. arXiv 2017, arXiv:1703.09393. [Google Scholar]
- Abebe, A.A.; Tian, W.; Acheampong, K.N. Extended Single Shoot Multibox Detector for Traffic Signs Detection and Recognition in Real-time. In Proceedings of the 2020 17th International Computer Conference on Wavelet Active Media Technology and Information Processing (ICCWAMTIP), Chengdu, China, 18–20 December 2020; pp. 373–379. [Google Scholar]
- Sindagi, V.A.; Patel, V.M. Generating high-quality crowd density maps using contextual pyramid cnns. In Proceedings of the IEEE International Conference on Computer Vision, Venice, Italy, 22–29 October 2017; pp. 1861–1870. [Google Scholar]
- Hossain, M.; Hosseinzadeh, M.; Chanda, O.; Wang, Y. Crowd counting using scale-aware attention networks. In Proceedings of the 2019 IEEE Winter Conference on Applications of Computer Vision (WACV), Waikoloa Village, HI, USA, 7–11 January 2019; pp. 1280–1288. [Google Scholar]
- Cheng, Z.Q.; Li, J.X.; Dai, Q.; Wu, X.; He, J.Y.; Hauptmann, A.G. Improving the learning of multi-column convolutional neural network for crowd counting. In Proceedings of the 27th ACM International Conference on Multimedia, Nice, France, 21–25 October 2019; pp. 1897–1906. [Google Scholar]
- Guo, D.; Li, K.; Zha, Z.J.; Wang, M. Dadnet: Dilated-attention-deformable convnet for crowd counting. In Proceedings of the 27th ACM International Conference on Multimedia, Nice, France, 21–25 October 2019; pp. 1823–1832. [Google Scholar]
- Li, Y.; Zhang, X.; Chen, D. Csrnet: Dilated convolutional neural networks for understanding the highly congested scenes. In Proceedings of the IEEE Conference on Computer Vision and Pattern Recognition, Salt Lake City, UT, USA, 18–23 June 2018; pp. 1091–1100. [Google Scholar]
- Sheng, B.; Shen, C.; Lin, G.; Li, J.; Yang, W.; Sun, C. Crowd counting via weighted VLAD on a dense attribute feature map. IEEE Trans. Circuits Syst. Video Technol. 2016, 28, 1788–1797. [Google Scholar] [CrossRef]
- Zhang, L.; Shi, M.; Chen, Q. Crowd counting via scale-adaptive convolutional neural network. In Proceedings of the 2018 IEEE Winter Conference on Applications of Computer Vision (WACV), Lake Tahoe, NV, USA, 12–15 March 2018; pp. 1113–1121. [Google Scholar]
- Cao, X.; Wang, Z.; Zhao, Y.; Su, F. Scale aggregation network for accurate and efficient crowd counting. In Proceedings of the European Conference on Computer Vision (ECCV), Munich, Germany, 8–14 September 2018; pp. 734–750. [Google Scholar]
- Chen, X.; Bin, Y.; Sang, N.; Gao, C. Scale pyramid network for crowd counting. In Proceedings of the 2019 IEEE Winter Conference on Applications of Computer Vision (WACV), Waikoloa Village, HI, USA, 7–11 January 2019; pp. 1941–1950. [Google Scholar]
- Valloli, V.K.; Mehta, K. W-net: Reinforced u-net for density map estimation. arXiv 2019, arXiv:1903.11249. [Google Scholar]
- Jiang, X.; Xiao, Z.; Zhang, B.; Zhen, X.; Cao, X.; Doermann, D.; Shao, L. Crowd counting and density estimation by trellis encoder-decoder networks. In Proceedings of the IEEE/CVF Conference on Computer Vision and Pattern Recognition, Long Beach, CA, USA, 16–17 June 2019; pp. 6133–6142. [Google Scholar]
- Ilyas, N.; Ahmad, Z.; Lee, B.; Kim, K. An effective modular approach for crowd counting in an image using convolutional neural networks. Sci. Rep. 2022, 12, 1–12. [Google Scholar] [CrossRef]
- Wang, M.; Cai, H.; Han, X.; Zhou, J.; Gong, M. STNet: Scale Tree Network with Multi-level Auxiliator for Crowd Counting. IEEE Trans. Multimed. 2022. [Google Scholar] [CrossRef]
- LeCun, Y.; Haffner, P.; Bottou, L.; Bengio, Y. Object recognition with gradient-based learning. In Shape, Contour and Grouping in Computer Vision; Springer: Berlin/Heidelberg, Germany, 1999; pp. 319–345. [Google Scholar]
- Xu, B.; Wang, N.; Chen, T.; Li, M. Empirical evaluation of rectified activations in convolutional network. arXiv 2015, arXiv:1505.00853. [Google Scholar]
- Wang, X.; Girshick, R.; Gupta, A.; He, K. Non-local neural networks. In Proceedings of the IEEE Conference on Computer Vision and Pattern Recognition, Salt Lake City, UT, USA, 18–23 June 2018; pp. 7794–7803. [Google Scholar]
- Vaswani, A.; Shazeer, N.; Parmar, N.; Uszkoreit, J.; Jones, L.; Gomez, A.N.; Kaiser, Ł.; Polosukhin, I. Attention is all you need. Adv. Neural Inf. Process. Syst. 2017, 30. [Google Scholar] [CrossRef]
- Liu, Y.; Yao, X. Ensemble learning via negative correlation. Neural Netw. 1999, 12, 1399–1404. [Google Scholar] [CrossRef]
- Boominathan, L.; Kruthiventi, S.S.; Babu, R.V. Crowdnet: A deep convolutional network for dense crowd counting. In Proceedings of the 24th ACM International Conference on Multimedia, Amsterdam, The Netherlands, 15–19 October 2016; pp. 640–644. [Google Scholar]
- Zhang, C.; Li, H.; Wang, X.; Yang, X. Cross-scene crowd counting via deep convolutional neural networks. In Proceedings of the IEEE Conference on Computer Vision and Pattern Recognition, Boston, MA, USA, 7–12 June 2015; pp. 833–841. [Google Scholar]
- Willmott, C.J.; Matsuura, K. Advantages of the mean absolute error (MAE) over the root mean square error (RMSE) in assessing average model performance. Clim. Res. 2005, 30, 79–82. [Google Scholar] [CrossRef]
- Lempitsky, V.; Zisserman, A. Learning to count objects in images. Adv. Neural Inf. Process. Syst. 2010, 23, 1324–1332. [Google Scholar]
- Li, M.; Zhang, Z.; Huang, K.; Tan, T. Estimating the number of people in crowded scenes by mid based foreground segmentation and head-shoulder detection. In Proceedings of the 2008 19th International Conference on Pattern Recognition, Tampa, FL, USA, 8–11 December 2008; pp. 1–4. [Google Scholar]
- Onoro-Rubio, D.; López-Sastre, R.J. Towards perspective-free object counting with deep learning. In Proceedings of the European Conference on Computer Vision, Amsterdam, The Netherlands, 8–16 October 2016; Springer: Berlin/Heidelberg, Germany, 2016; pp. 615–629. [Google Scholar]
- Babu Sam, D.; Surya, S.; Venkatesh Babu, R. Switching convolutional neural network for crowd counting. In Proceedings of the IEEE Conference on Computer Vision and Pattern Recognition, Honolulu, HI, USA, 21–26 July 2017; pp. 5744–5752. [Google Scholar]
- Dai, J.; Li, Y.; He, K.; Sun, J. R-fcn: Object detection via region-based fully convolutional networks. Adv. Neural Inf. Process. Syst. 2016, 29. [Google Scholar] [CrossRef]
- Ren, S.; He, K.; Girshick, R.; Sun, J. Faster r-cnn: Towards real-time object detection with region proposal networks. Adv. Neural Inf. Process. Syst. 2015, 28. [Google Scholar] [CrossRef] [PubMed]
- Marsden, M.; McGuinness, K.; Little, S.; O’Connor, N.E. Fully convolutional crowd counting on highly congested scenes. arXiv 2016, arXiv:1612.00220. [Google Scholar]
Figure 1.
Representation of the proposed architecture. The first three (1–3) depth layers of framework-generated features are processed by the non-local operation module (NLM), while the last two (4–5) depth layers are processed by the feature map’s channel weight module (FCW). Stacked ensemble meta-learning ultimately integrates each depth’s predictions (SEML).
Figure 2.
Representation of how to scale growth as a framework’s layer increases, with small scales on the lower layer and large scales on the higher level. As a result, all CNN frameworks may approximate a low-dimensional regression output f(x) for a high-dimensional input signal x using the CNN scale separation method.
Figure 3.
Representation of the interaction graph that exists across all of the framework’s layers. As shown in the figure on the left, the raw image axis (u1, u2) is made up of scattered pixels. The image is then processed by a convolution layer, which reduces a group of adjacent pixels to a single value, as shown in the illustration in the middle of the figure. Large objects are generated by interacting with successive CNN layers, which represent interactions between small objects. Therefore, in order to estimate density, nearly all layers of the framework are taken into account.
Figure 4.
Each row, which displays a sample signal distribution, represents the framework’s first, second, third, fourth, and fifth depth feature maps. The strength of feature contents in each depth of the higher layer feature maps is degrading; about half of the depth’s feature comprises merely the image’s main objects.
Table 1.
The following dataset statistics assess the framework’s performance. The number of images (no. images) is the total number of images; min, max, and avg are the minimum, maximum, and average pedestrian numbers per image, respectively.
Table 1.
The following dataset statistics assess the framework’s performance. The number of images (no. images) is the total number of images; min, max, and avg are the minimum, maximum, and average pedestrian numbers per image, respectively.
| Dataset | | Resolution | No. Images | Min | Max | Avg | Total |
|---|
| ShanghaiTech | Part A
Part B | different
768 × 1024 | 482
716 | 33
9 | 3139
578 | 501.4
123.6 | 241,677
88,488 |
| UCF CC 50 | | different | 50 | 94 | 4543 | 1279.5 | 63,974 |
Table 2.
Comparison of the proposed framework with other state-of-the-art on the UCF CC 50 dataset.
Table 2.
Comparison of the proposed framework with other state-of-the-art on the UCF CC 50 dataset.
| Method | MAE | MSE |
|---|
| Lempitsky et al. [50] | 493.4 | 487.1 |
| Zhang et al. [51] | 467.0 | 498.5 |
| Idrees et al. [20] | 419.5.0 | 541.6 |
| Boominathan et al. [47] | 452.5 | - |
| Zhang et al. [19] | 377.6 | 509.1 |
| Onoro et al. [52] | 333.7 | 425.3 |
| Sam et al. [53] | 318.1 | 439.2 |
| SaCNN [35] | 314.9 | 424.8 |
| MoC-CNN [27] | 361.7 | 493.5 |
| ic-CNN + McML [31] | 242.9 | 357 |
| Csrnet [33] | 266.1 | 397.5 |
| PMSRML | 263 | 398 .2 |
Table 3.
Comparison of the proposed framework with other state-of-the-art on ShanghaiTech PartB dataset.
Table 3.
Comparison of the proposed framework with other state-of-the-art on ShanghaiTech PartB dataset.
| Method | MAE | MSE |
|---|
| R-FCN [54] | 52.35 | 70.12 |
| Cross-scene [48] | 32.00 | 49.80 |
| Faster R-CNN [55] | 44.5 | 53.22 |
| FCN [56] | 23.89 | 33.58 |
| Switching-CNN [53] | 21.6 | 31.98 |
| CP-CNN [29] | 21.1 | 30 |
| PMSRML | 20.3 | 30 |
Table 4.
An ablation investigation of the framework prediction error was conducted for various input feature maps and their stacking.
Table 4.
An ablation investigation of the framework prediction error was conducted for various input feature maps and their stacking.
| Layer
| MAE | MSE |
|---|
| 1 | 523.4 | 521.1 |
| 2 | 480.5 | 531.6 |
| 3 | 490.0 | 498.5 |
| 4 | 452.5 | 469.4 |
| 5 | 318.1 | 467.1 |
| Integration of all layer features | 263 | 398.2 |
Table 5.
The MAE and MSE for each module, as well as how they are integrated into the framework to improve the performance. ShanghaiTech PartB dataset.
Table 5.
The MAE and MSE for each module, as well as how they are integrated into the framework to improve the performance. ShanghaiTech PartB dataset.
| The Framework Integrated with
| MAE | MSE |
|---|
| NLM | 28.9 | 44.8 |
| FCW | 32 | 49.8 |
| NLM + FCW | 20.3 | 30 |
| Publisher’s Note: MDPI stays neutral with regard to jurisdictional claims in published maps and institutional affiliations. |
© 2022 by the authors. Licensee MDPI, Basel, Switzerland. This article is an open access article distributed under the terms and conditions of the Creative Commons Attribution (CC BY) license (https://creativecommons.org/licenses/by/4.0/).


