Review

Hybrid Feature Selection of Breast Cancer Gene Expression Microarray Data Based on Metaheuristic Methods: A Comprehensive Review

by
Nursabillilah Mohd Ali
1,2,
Rosli Besar
1,* and
Nor Azlina Ab. Aziz
1
1
Faculty of Engineering & Technology, Multimedia University, Melaka 75450, Malaysia
2
Faculty of Electrical Engineering, Universiti Teknikal Malaysia Melaka, Melaka 76100, Malaysia
*
Author to whom correspondence should be addressed.
Symmetry 2022, 14(10), 1955; https://doi.org/10.3390/sym14101955
Submission received: 7 August 2022 / Revised: 21 August 2022 / Accepted: 25 August 2022 / Published: 20 September 2022

Abstract

:
Breast cancer (BC) remains the most dominant cancer among women worldwide. Numerous BC gene expression microarray-based studies have been employed in cancer classification and prognosis. The availability of gene expression microarray data together with advanced classification methods has enabled accurate and precise classification. Nevertheless, the microarray datasets suffer from a large number of gene expression levels, limited sample size, and irrelevant features. Additionally, datasets are often asymmetrical, where the number of samples from different classes is not balanced. These limitations make it difficult to determine the actual features that contribute to the existence of cancer classification in the gene expression profiles. Various accurate feature selection methods exist, and they are being widely applied. The objective of feature selection is to search for a relevant, discriminant feature subset from the basic feature space. In this review, we aim to compile and review the latest hybrid feature selection methods based on bio-inspired metaheuristic methods and wrapper methods for the classification of BC and other types of cancer.

1. Introduction

Breast cancer (BC) is the most dominant diagnosed cancer type. BC is the first leading cause of cancer-related deaths in women and the second leading cause of cancer deaths worldwide (https://www.who.int/cancer/prevention/diagnosis-screening/breast-cancer/, accessed on 3 May 2022). The World Health Organization (WHO) estimates that more than 8 million deaths are caused by cancer, which makes it the leading cause of death worldwide. According to Bray et al. (2018), BC remains the primary cancer among women [1]. Unsurprisingly, when a woman reaches 85 years old, the likelihood is one in eight (≈12%) that she gets BC once in her lifetime [2]. In addition, approximately 1.9% of all BC patients are below 35 years old [3]. BC is primarily caused by the uncontrolled progression of cells in breast tissues, becoming either benign or malignant. A benign tumor is noninvasive, whereas a malignant tumor is invasive because the cells can spread to other parts of the body and ultimately cause metastasis [4]. Metastasis is associated with the sign of disease progression [5]. According to Hisham and Yip (2004), 50–60% of BC cases in Malaysia are identified at Stage 3 and Stage 4, and thus, the patients’ endurance in the country is one of the poorest [6]. Several possibilities and factors that cause BC include obesity, not having children, early menarche period (early age of menstruation period), a short period of milk formation (lactation), engaging in detrimental lifestyles, as well as geographical, racial, and ethnic attributes [1,7,8,9].
Classifications of microarray cancer data focusing on DNA profiles have been published in many studies. The popularity of this topic among researchers shows the importance of this study. The findings from the study can help early diagnosis and prognosis [10,11,12]. One of the most challenging applications of microarray profiles is cancer analysis and classification.
Cancer analysis is normally carried out by medical doctors to understand and identify the mutations that cause cancer. These mutations affect changes in the gene expression level. However, classifying the gene expression profiles is a challenging task and is considered an NP-hard problem [13]. This is because not all genes are relevant to cancer. Applying or utilizing all genes in the microarray gene expression profiles can lead to inaccurate cancer diagnosis and high computational costs. In addition, microarray gene expressions are frequently high-dimensional data containing thousands of genes or features; however, they have a small sample size. Some machine learning methods are incapable of obtaining good results when the number of features is larger than the sample size.
To address these problems, feature or gene selection is applied to the BC microarray and the microarray of the other types of cancer. Feature selection (FS) methods are categorized into four groups, namely, (1) filter, (2) wrapper, (3) embedded, and (4) hybrid (ensemble) methods. Filter methods use statistical properties to determine each feature individually. Wrapper methods use learning methods to identify the optimal subset of features. The accuracy is dependent on the specific classifier employed. Wrapper methods typically apply metaheuristic or evolutionary methods, and these methods have shown superior performance. Embedded methods are typically built-in with the classifier in order to determine the optimal feature subset. Hybrid methods combine both filter and wrapper methods, and these methods are popular among researchers. Hybrid methods exploit the advantages of the filter and wrapper methods.
In this paper, we review and compare the latest hybrid methodologies that apply optimization or metaheuristic methods as the wrapper approach. In the first step of hybrid methods, pre-preprocessing is carried out to remove noise, including redundant noise. In the second step, the metaheuristic algorithm-based wrapper method is implemented. Recent progress in microarray gene expression profile technology has revealed that metaheuristic algorithm-based FS methods give superior results. The performance of these methods is assessed based on the classification accuracy and the number of selected genes. Figure 1 shows a schematic representation of the hybrid FS of microarray BC classification [14]. The hybrid-based FS approach consists of two stages. The filter-based and wrapper FS based on a metaheuristics optimization method. In the classification stage, the selected genes from the FS step were used to identify BC features with the highest classification accuracy.
This work is divided into several sections. In the following section, we briefly discuss the methodology of the literature review. In the third section, we present an overview of microarray gene expression profiles. In the fourth section, we present a background of FS methods, the selection of popular metaheuristic algorithms, and classification methods. In the fifth section, we review hybrid methods with an emphasis on BC and other types of cancer. Finally, we present an analysis of future trends and the key conclusions of this review.

2. Review Methodology

A comprehensive review of hybrid feature selection-related English articles published in the last decade (2007–2022) was conducted in August 2022 using Web of Science, IEEE Explore, Science Direct, Scopus, and Springer Link. As part of our strategy, we created a keyword-based search string. They were: “Microarray Dataset”, “Hybrid Feature Selection”, “Bio-inspired meta-heuristic method”, and “Classification”. We incorporated original English language publications.
Inclusion criteria:
  • Articles on hybrid feature selection, bio-inspired meta-heuristic algorithms, and machine learning;
  • Full articles on the outcomes of microarray BC and other cancer.
Exclusion criteria:
  • Commentaries, reviews, and articles with no full text and book chapters;
  • Study on cancer or a certain type of human disease.
The literature review was carried out in the manner outlined above. For the chosen article that met the inclusion requirements, the titles and abstracts, results, and the article text were evaluated. Following discussion, the author resolved the issues over eligibility for a consensus decision.

3. Microarray Gene Expression Profiles

Microarray gene expression profiles are a collection of human cancer data that can be used to predict and classify whether the sample is cancerous or non-cancerous. A deep understanding of the differentially expressed genes of human cancer data can facilitate identifying predictive and prognosis biomarkers.
The advancement of genomic assessment tests using biomarker arrays enables the identification of molecular gene data. These biomarkers are also known as gene tests or assays. Genomic tests have changed the standard clinical-pathological tools in selecting adjuvant chemotherapy for patients. These data are used for the prognosis analysis of cancer recurrence probability and for identifying the potential genes for drug targets [15,16,17].
With the emergence of novel BC classification algorithms and methods, it is important to evaluate the contribution of these methods in discovering potential biomarkers for drug targets and the strategies for implementing them.
Genes are made up of deoxyribonucleic acid (DNA), which is a heritable substance in humans and other organisms. DNA microarray is a good platform to aid scientists in monitoring the gene profiles in organisms. The microarray data contain the number of gene probes with a number of samples to solve relevant and useful information in the gene expression profiles. The microarray data represent the number of genes and samples. These data consist of two-dimensional arrays, D, that contain thousands of genes and a small sample size. D can be expressed as the following matrix:
D =     x 1 1       x 1 n       c 1                      x p 1     x p n         c p    
where the row vector x m in D is described as x m 1     ,        , x m k , c m and refers to the gene profile expression. Here, x m k refers to the level of gene profile expression, m represents the sample number, k is the feature number, and cm is the classification of the m-th sample [18]. The subscript p and superscript n represent the row and column of the matrix, respectively. The element c is either a binary number or integer depending on the number of classes. It shall be noted that c can be binary (cancerous and non-cancerous) or multiclass.

4. Feature Selection, Metaheuristics, and Classification Methods for Microarray BC Data

4.1. Feature Selection (FS)

FS or gene selection has been widely used to deal with a high number of input features of the microarray data. The datasets are asymmetrical where the number of samples from different classes is not balanced [19]. To deal with this, FS typically takes place prior to data classification. Only relevant features are selected and then applied to the classifier, which reduces the computational cost of the classification and results in less data noise as well as a smaller number of features.
FS can be described as a process of selecting a small subset of gene features to reduce repetition or redundancy and to boost important targets in the classification process. There are three objectives of FS: (1) to avoid overfitting and boost model performance, (2) to reduce high-dimensional data and select only relevant data, and (3) to provide more effective models with good processing costs. FS methods can be categorized into four types, namely, (1) filter, (2) wrapper, (3) embedded, and (4) hybrid (ensemble) methods [20]. The widely used FS methods are Information Gain (IG) [21], Relief and Fisher Score (filter-based methods), and Lasso (embedded-based method) [22]. The details of FS in bioinformatics research have been summarized in previous studies [23,24]. Figure 2 shows the categories of FS methods.
In the filter method, the classifier is not considered and there are no learning algorithms involved. The features are individually evaluated and ranked to select the features with the highest score. There are two types of model search methods, namely, (1) univariate and (2) multivariate. Univariate means that the features are ranked individually and independently, and classification performance is not considered. In contrast, multivariate means there are relationships among the features, and they are ranked by groups. Hence, multivariate methods are more reliable to control the redundant features and improve the classification. However, multivariate methods result in higher computational complexity. Examples of univariate and multivariate methods are Euclidean distance, IG, and correlation-based feature (CFS). The most popular statistical method is gene ranking. For instance, IG rank uses the conditional distribution of the probability function of the class label of the microarray gene feature vector. However, the IG method is incapable of handling redundant features. The Fisher Score considers microarray data and this method is also incapable of handling redundant features because the method evaluates features separately. The Fisher Score method assigns high features to the same class and aims to search a subset for the subset of features in order to maximize the lower bound of the conventional Fisher Score and to solve a large amount of data. The Relief method selects features randomly from the sample data class and determines the nearest instance with the same class label by distinguishing it from the neighbor of a different class. This method can be used to handle multi-class problems either from binary or multiclass targets. In brief, most of the filter methods are based on statistical tests and gene rank features from which the individual feature of the microarray data is determined.
The wrapper method creates and builds the FS algorithm with the classifier algorithm. Since the combination of FS and classifier algorithm is compatible, it is possible to determine the feature space. This will lead to higher computational complexity and slow processing time. To overcome these problems, an evolutionary or optimization algorithm can be incorporated so that only the optimum features are selected and processed. For example, in [25,26,27], GA is applied to search for the optimal feature subset from the feature pool. A fuzzy inference system has been used to predict the results using the cost function wrapper model.
The embedded method typically combines the FS method and the classifier. The FS method performs in the training process and is particularly used for a specific learning approach. Compared with the wrapper model, this method is more compliant and effective. The most popular method is Support Vector Machine-Recursive Feature Elimination (SVM-RFE), in which the SVM-RFE algorithm is introduced based on three approaches (nonlinear SVM and least absolute shrinkage and selection operator (Lasso)) built-in or embedded in the classifier.
Lastly, the hybrid or ensemble methods comprise combinations or modifications of more than one FS and classifier methods such as the combination of filter and wrapper methods, where there are more than two types of filter and wrapper methods. The basic idea of hybrid methods is that the combination of several FS methods will reduce the feature variables, and then the exhaustive search model is employed to obtain the remaining features within a reasonable time frame. The hybrid method is intensive and computationally complex because the method combines the filter and wrapper method at two different levels, namely, (1) feature dimensional reduction and (2) optimal subset FS using the wrapper method. However, this method may reduce the accuracy because both filter and wrapper methods are incorporated in different search areas [27]. To overcome this problem, a hybrid with more than one approach can reduce the error rate and increase the accuracy of the results. The filter and wrapper methods that use Random Forest (RF) as the classifier are among the popular hybrid methods, in which two different FS methods are used for gene selection and the gene fitness is determined by the RF classifier.
Many FS studies have been carried out to propose new methods and approaches and find the most relevant and useful genes for a better predictive response. Most of the widely used FS is based on the filter method in which a single gene or a subset of genes is used based on a statistical concept. Meanwhile, the wrapper methods are computationally intensive and may result in overfitting. Thus, many wrapper methods are equipped with the latest or new optimization algorithms. The emerging hybrid and embedded methods are popular recently and these methods have gained much attention from researchers. Optimization algorithms have also become the trend nowadays, where researchers use this new concept with other types of FS. The four types of FS methods are summarized in Table 1.

4.2. Metaheuristic Methods

Ten prominent metaheuristic methods, namely, (1) the genetic algorithm (GA), (2) particle swarm optimization (PSO), (3) the harmony search algorithm (HSA), (4) ant colony optimization (ACO), (5) artificial bee colony (ABC) optimization, (6) the firefly algorithm (FA), (7) cuckoo search (CS), (8) the gravitational search algorithm (GSA), (9) grey wolf optimization (GWO), and (10) the whale optimization algorithm (WOA), are presented in this section. These algorithms have been applied for microarray FS and are presented in the next section.

4.2.1. Genetic Algorithm

GA is a heuristic process inspired by natural selection and biological evolutionary theory [28]. The algorithm is composed of three selection operations, namely, (1) natural selection, (2) crossover, and (3) mutation. The main objective of the GA is to simulate the survival of the fittest of each individual selection in a population. The search space contains a number of individual genes that are combined to form a chromosome. The chromosome comprises solutions that solve the problems before the genes are transferred to the next generation. Within the selection operation, the fittest individuals are chosen, and consequently, in the crossover selection, two individuals are chosen based on their fitness score. From the crossover operation, offspring are created by exchanging themselves from within the two individual genes until a random crossover point is achieved. New offspring will be produced iteratively to the population after exchanging the gene among the individual crossover. However, some of the new offspring are created with either high or low random bits, depending on the mutation operation. Mutation is important to sustain the difference within the population and to avoid immature convergence.

4.2.2. Particle Swarm Optimization (PSO)

PSO is a population-based optimization algorithm inspired by natural behavior (bird swarms, fish schooling, and ant colonies) [29]. The main objective of PSO is to search for the optimum solution through the stochastic and deterministic elements of the particles’ trajectories. These particles are also known as agents, which will move randomly to improve the best solution in a population of particle solutions. The particle solution then moves through the search space according to the algorithm settings, including the particle’s position and velocity. The particle can be identified as agent search (xbest) and group search (gbest). Every particle will look for the best position in the search space and the position of the particles will be continuously updated and sought by other particles. The particle will change its position based on the new velocity substituted by the xbest, gbest, and other parameter settings, namely, inertia weight, two positive constant values, and two random parameter threshold values (0~1). In order to motivate the search in the possible location, the inertia weight is typically defined with a higher initial value and lower final value before the initial particles are randomly distributed. Implementing PSO is relatively easy and simple compared to other optimization methods because the parameters are easily tuned and robust.

4.2.3. Harmony Search Algorithm (HSA)

The HSA was first introduced by Geem, Kim, and Loganathan (2001) as s metaheuristic algorithm [30]. Since its appearance in 2001, this algorithm has garnered attention from researchers and has demonstrated its effectiveness and advantages for various applications. The HSA is a metaheuristic optimization algorithm that imitates the musical state of harmony. The aim of the HSA is to emulate the perfect sound of harmony in music by finding the possible combination of music pitch signals and storing the values into the harmony memory (HM). The HM process is slightly similar to the population-based GA and swarm intelligence. There are three components in the HSA, namely, (1) initialization, (2) improvisation, and (3) updating. In the first step, the HM is initialized, where the number of solutions to the optimization problem is randomly generated. In the second step, each solution is improvised and obtained based on the Harmony Memory Considering Rate (HMCR). The HMCR can be defined as the probability of selecting a solution that comes from the HM elements. Lastly, in the third step, the HM updates the best fitness value from the second step by replacing and eliminating the worst solution from the HM elements.

4.2.4. Ant Colony Optimization (ACO)

ACO was introduced in 1996 by Dorigo, Maniezzo, and Colorni. ACO is a metaheuristic optimization that mimics the nature of the ant species and their food-searching behavior [31]. ACO was invented based on the ant criteria in finding the shortest path to a food source near the colony. Therefore, the objective of the ACO is to seek the best path in a weighted graph; namely, the node or edge components of the path to the food source. The ants will then randomly look for any food source near their colony. The food quality is subsequently evaluated when the ants meet a food source. The ants will return to the colony and leave pheromones or markers along the path to lead other ants to follow the same path to the food source. Therefore, based on a certain probability, the other ants will subsequently follow the same path, where the marks of the pheromones will remain and strengthen on the same path. The pheromone imprint on the path will be strongly owing to the growing number of ants that follow that path.

4.2.5. Artificial Bee Colony Optimization (ABC)

ABC is a swarm-based optimization algorithm invented by Karaboga (2005) [32]. Similar to ACO, ABC mimics the foraging behavior of honeybees. A group of bees is called a swarm that productively fulfills tasks of social assistance. In the group, there are three different roles of bees, namely, (1) worker bees, (2) onlooker bees, and (3) scout bees. All of these bees are considered as the number of solutions in the swarm. The worker bees will first find any good food source and will share the information about the food source with the onlooker bees. The information gathered from the worker bees will subsequently be used by the onlooker bees to select the high-quality food source (fitness) and differentiate them from the lower-quality ones. The scout bees produced by some employed bees will leave their food sources to find a new food source.

4.2.6. Firefly Algorithm (FA)

FA is a bio-inspired optimization algorithm introduced by Yang (2009) [33]. FA mimics the behavior of fireflies and is inspired by their brightness tendencies toward one another. Each firefly attracts one another using its brightness intensity. In FA, there are three steps, namely, (1) attractiveness, (2) randomization, and (3) absorption. Like other optimization concepts, the search for the optimal solution or fitness happens in the FA. In the first step (attractiveness), the fireflies are attracted to each other. In the second step, the high brightness intensity affects the connection between the fireflies. The fireflies emitting lower brightness move toward the fireflies with intense light. The fireflies with strong bright light will move randomly. Lastly, the brightness of the fireflies is absorbed or determined by the objective function component.

4.2.7. Cuckoo Search Algorithm (CS)

CS is a bio-inspired optimization algorithm inspired by the reproductive component of cuckoo birds to increase the population [34]. The aim of the CS is to lay new eggs and select the best solution (cuckoo egg) to change the poor solution in the nest. In this case, the solution of the swarm is the egg and nest. In the basic concept, the cuckoos normally place their eggs in other cuckoos’ nests, hoping that their descendants are raised by the substitute parents. There are cases in which some of the eggs do not belong to the cuckoo. Next, eggs with the best quality and the best nests will move forward to the next peers. Lastly, the host nest is selected by discovering the egg laid by the cuckoo with a certain probability value. In this case, the host bird can build a new nest and lay new eggs, abandon the nest, or throw out the eggs. These eggs are called foreign eggs. Foreign eggs are discarded from the nest or all of the eggs in the nest are abandoned.

4.2.8. Gravitational Search Algorithm (GSA)

GSA was first introduced by Rashedi, Nezamabadi-Pour, and Saryazdi (2009) [35]. GSA is an optimization algorithm based on Newton’s law and mass interactions. In this algorithm, the individual’s population (known as masses) and their performances are presented using their masses. GSA follows Newton’s law where all mass is attracted to each other. Individuals with good solutions have heavy masses and move slower than lighter masses (bad solutions).

4.2.9. Grey Wolf Optimization (GWO)

GWO is a bio-inspired optimization algorithm based on grey wolves that hunt prey in mutual cooperation. The GWO algorithm was introduced by Mirjalili et al. (2014) to simulate the mechanism and behavior of grey wolves through the process of hunting and attacking [36]. There are three GWO algorithm steps, namely, (1) surrounding, (2) hunting, and (3) attacking. When the grey wolves have decided on the prey’s location, they start to surround the prey. After surrounding their prey, based on certain parameter settings in the GWO algorithm, the grey wolves hunt the prey and keep updating their new distance to the prey and their new positions. Lastly, the grey wolves start to make for capture and the results are released. The grey wolves finish the hunt by attacking the prey until the prey stops moving.

4.2.10. Whale Optimization Algorithm (WOA)
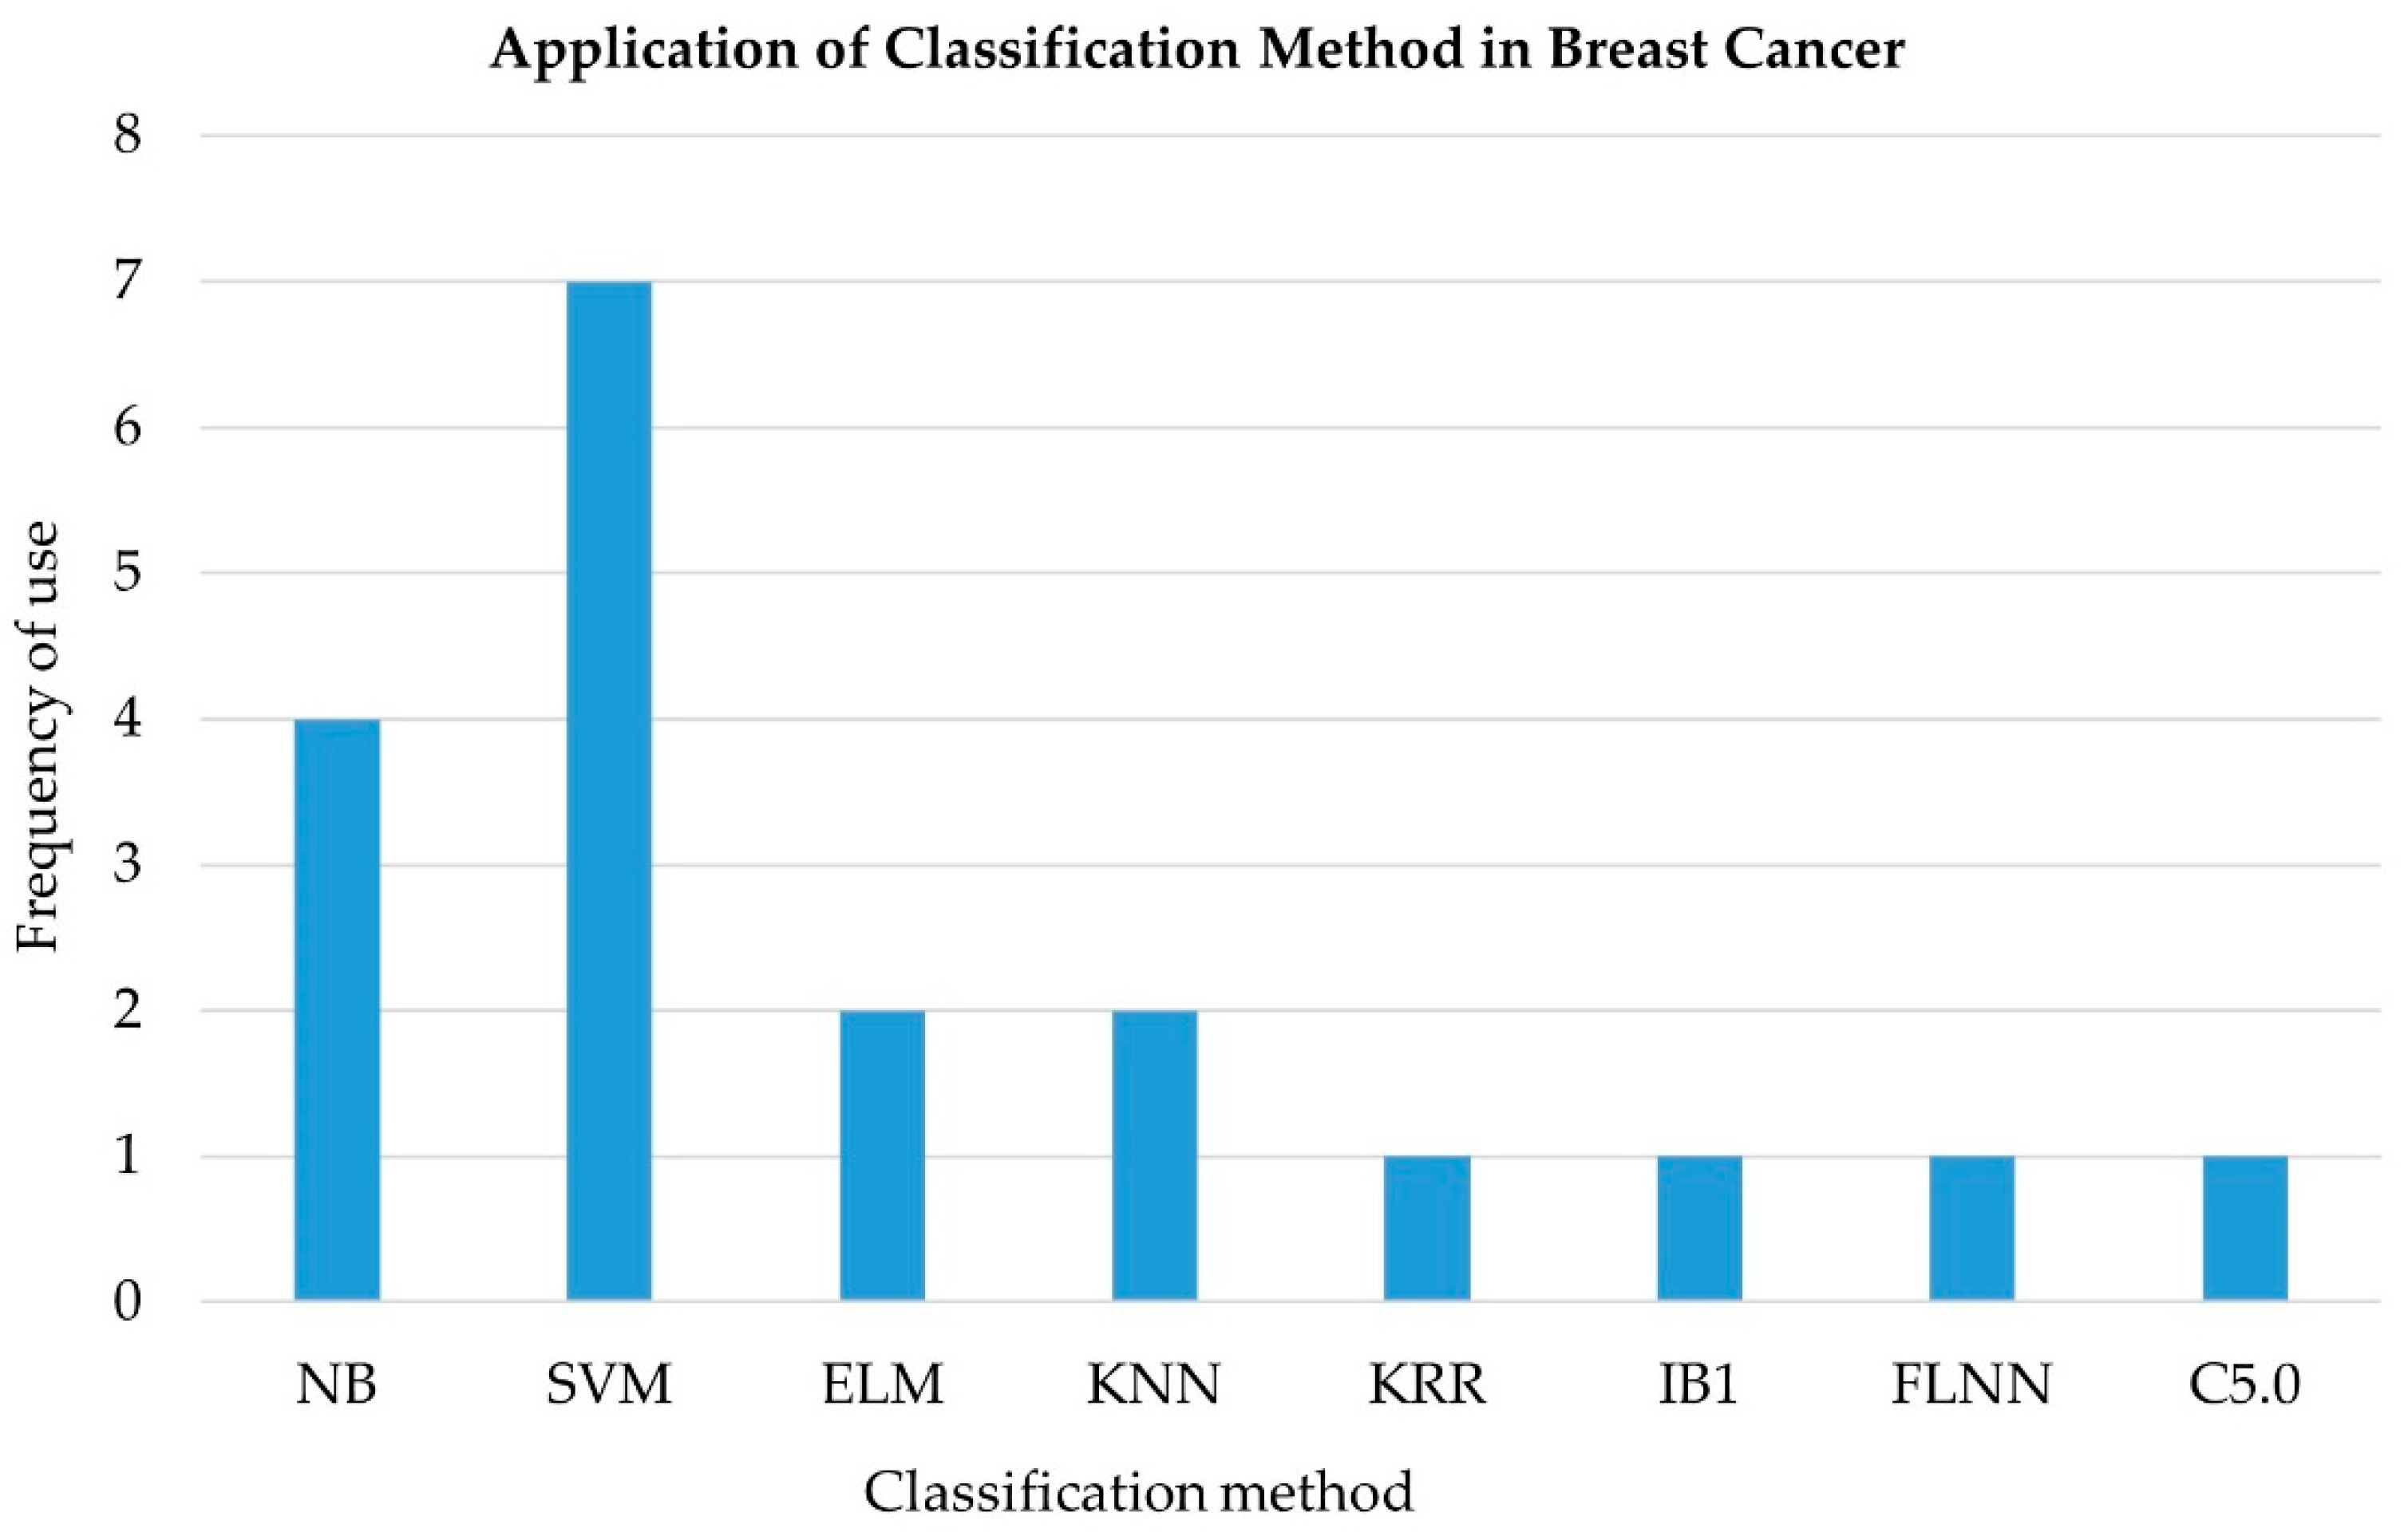
The WOA is a recently introduced bio-inspired meta-heuristic optimization method based on the hunting mechanism of humpback whales. The WOA algorithm was developed by Mirjalili and Lewis in 2016 [37]. This algorithm is inspired by the bubble-net foraging mechanism of humpback whales. The strategy contains three basic steps of hunting: encircling prey, seeking prey, and attacking the target. It has been demonstrated that this approach can outperform other meta-heuristic algorithms in solving diverse and complicated tasks such as feature selection and data clustering. The emerging study trend on WOA is predicted to continue in the future [38].

4.3. Classification

Classification is a branch of data mining widely used for class prediction and identification using a machine learning algorithm. There are three types of machine learning algorithms, namely, (1) supervised learning, (2) semi-supervised learning, and (3) unsupervised learning. These algorithms can be chosen based on fully labeled, partially labeled, and unlabeled data, respectively, to determine the biological disease configurations and gene prediction. Supervised learning uses class-labeled data for classification. The class label is defined and known according to a set of training data in the process of assignment. Semi-supervised learning combines a small number of labeled data and unlabeled data, whereas unsupervised learning only involves unlabeled data. Unsupervised learning is unbiased when it comes to utilizing any experts or knowledge to classify the data. There are two processes involved in the classification steps: testing and training. In the following section, the most prevalent classification methods that are widely applied in microarray cancer classification will be discussed.

4.3.1. Support Vector Machine (SVM)

SVM is a supervised learning method that can be used to solve classification and regression problems [39]. SVM is applied in optimal classifying problems to discover the best hyperplane or line that divides the classes from the data boundaries of one or more feature vectors. SVM algorithms are popular in classifying problems owing to their promising results in many applications. The support vector and margin define the hyperplane. The term support vector can be best defined as the feature or data points that divide closest to the hyperplane (also known as the decision boundary). However, the margin is known as the best distance between the hyperplane location and nearby data points. There are two typical cases of SVM, namely, linear and non-linear separable data, hence known as linear SVM and nonlinear SVM, respectively. In linear separable SVM, the orientation and position of the hyperplane will be the best line that separates the data into two different categories so that the data will fit into a single class. The maximizing margin can be defined as the distance with the nearby data points or support vector to determine the best hyperplane location. However, for nonlinear separable data, the aim is to find nonlinear hypersurfaces in which the support vector data points will be taken from the linear data. In the context of microarray cancer classification, the disease can be classified according to tumor and nontumor classes of separable data. The main advantage of using SVM is that it is a powerful method to classify a large number of high-dimensional datasets for both linear and nonlinear data. SVM works comparatively well in high-dimensional data and it is very efficient because the number of features or genes is larger than the number of samples. However, in the context of gene classification, training with SVM involves a highly discriminatory algorithm because SVM is computationally complex to represent the feature space of gene profiles.

4.3.2. Random Forest (RF)

RF classifier is an ensemble learning method that is widely applied to solve classification problems based on decision tree structures [40]. The name forest refers to a combination of a large number of individual trees that work together as an ensemble. RF is originally based on a combination of decision trees, from which the decision trees ultimately merge to build the RF. The class that receives many votes will become the model prediction, which means that there is a chance of generating the correct prediction as the number of uncorrelated forests of trees increases in the model. The uncorrelated forest means that the models are not diversified between each other. However, a bagging bootstrap aggregation will be utilized in cases where the models are not correlated with each other. Bagging means the RF will allow every tree to pick up a sample randomly from the dataset with replacement. Hence, it will result in distinct tree structures. RF can be used for solving classification problems that involve more than two classes, namely, binary and multiclass problems.

4.3.3. K-Nearest Neighbor (KNN)

KNN is a supervised machine learning algorithm that is primarily used in data prediction and regression [41]. This algorithm is widely used to classify new instances based on similarity measures. KNN is also known as a nonparametric learning model that does not consider all the data points collectively together, depending on the similarity measure of features to predict the data based on closely neighboring points during classification. The properties of parameters vary according to the reasonable assumptions in order to sort the rank of the sample data by classifying the data with the most voted neighbors for the optimal value of K. A KNN classifier will calculate every data point based on the Euclidean (the most frequently used), Manhattan, or Hamming distance between the testing and training data. KNN is easy to be implemented and the algorithm needs to adjust the parameters of the K value to sort the nearest data points. However, KNN increases in computational complexity as the size of the feature data increases and the algorithm requires high memory storage because it stores all of the training data during classification.

4.3.4. Naïve Bayes (NB)

Naïve Bayes is originally based on the Bayes theorem. NB is one of the simplest classifiers with simple computation to execute new cases between the assumptions of independent value to the predictor [42]. NB computes the posterior probability using the input for every attribute against every class. The high value of posterior probability will give the correct outcomes or predictions. The NB classifier consists of a probabilistic algorithm that performs well in many classification problems such as filtering spam emails. The basic idea behind the classifier is simple, and it only requires various input data to predict the output. For instance, NB will find the most likely output from the condition probability involved. The naïve assumption is the assumption where feature values can be determined involving large data. The NB classifier can also be used for linear, exponential, and nonlinear data. However, a few parameters need to be adjusted to avoid the likelihood value being zero. The major advantage of the NB classifier is that the classifier can handle large dimensional data and perform better in complex models. However, because NB is based on assumption, the algorithm suffers from inaccuracy since the estimation probability is often incorrect.

4.3.5. Logistic Regression (LR)

The LR classifier is a supervised classifier used to classify discrete classes based on probability theory [43]. Probability theory can be defined as the measure of the possibility of any occurrence that will occur in a random measurement. An example of discrete target classes is as follows: 1 for true and 0 for false. The LR classifier is also known as a binary classifier and it can be used to predict the target class either for categorical or numerical variables.

4.3.6. Fuzzy Logic

FL classification interpretation is based on linguistic terms to determine the state of truth usual to the logical Boolean concept (i.e., true or false). This algorithm involves a fuzzy set in which the level of membership is applied to each set of problems to perform the computation [44]. Like the human brain, FL works until certain limits are surpassed, and then the algorithm will cause additional effects from the motor reaction. The main advantage of the FL classifier is that the algorithm is capable of dealing with uncertainty and nonlinear applications. FL is easy to be implemented because it is based on the human way of thinking.

4.3.7. Artificial Neural Network (ANN)

An ANN, also known as a neural network, is a bio-inspired algorithm based on the mechanism of the human brain [45]. The human brain contains many complex, interconnected neurons to receive signals before the signals are transferred to the human body. The ANN classifier attempts to reconstruct and imitate the computational complexity of a biological neural network, although it is not equivalent to the number of neurons that work in the human brain. There are three basic topologies in constructing an ANN, namely, (1) the input layer, (2) the hidden layer, and (3) the output layer. Each layer is interrelated to one another. The ANN uses nonlinear statistical tools to model complex connections between the input and output layers to recognize data structures and patterns. Moreover, the ANN receives learning information from the input layer to be passed through the network in which the received information acts as an activation value. This activation value is processed to flow through the network and the hidden layer until it ends up in the output layer. The output layer reforms the activation value of the hidden layer into the target output.

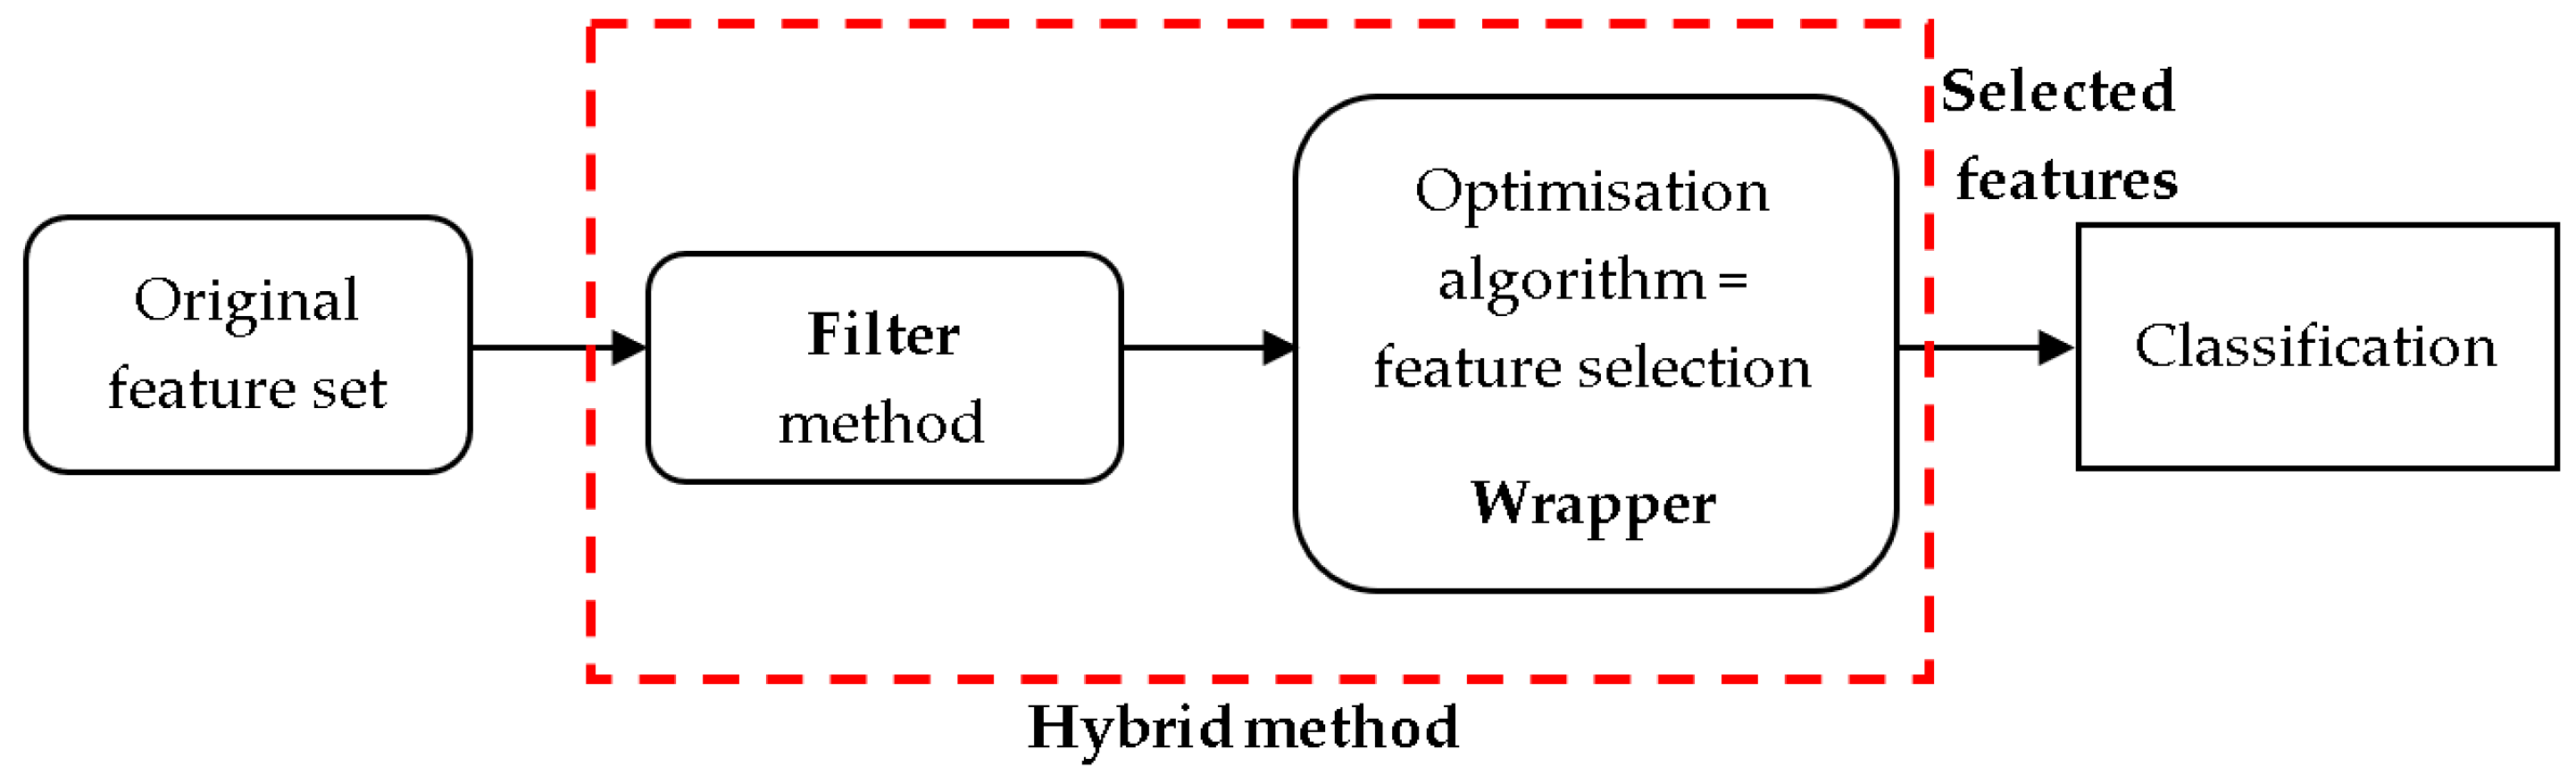
5. Hybrid Feature Selection Based on Metaheuristic Optimization Methods

It is challenging and imperative to compute only the most informative genes and the most optimum features when dealing with microarray data. Hybrid FS methods for BC and other types of cancer data are summarized in Table 2 and Table 3. In general, the findings reveal that when optimization methods are used as the wrapper method, superior performance is achieved, with only a small number of genes being utilized and a small percentage of reduced genes from the original genes. The performance of hybrid FS methods is dependent on three factors, namely, (1) the number of selected genes, (2) the percentage of reduced genes, and (3) the classification accuracy.

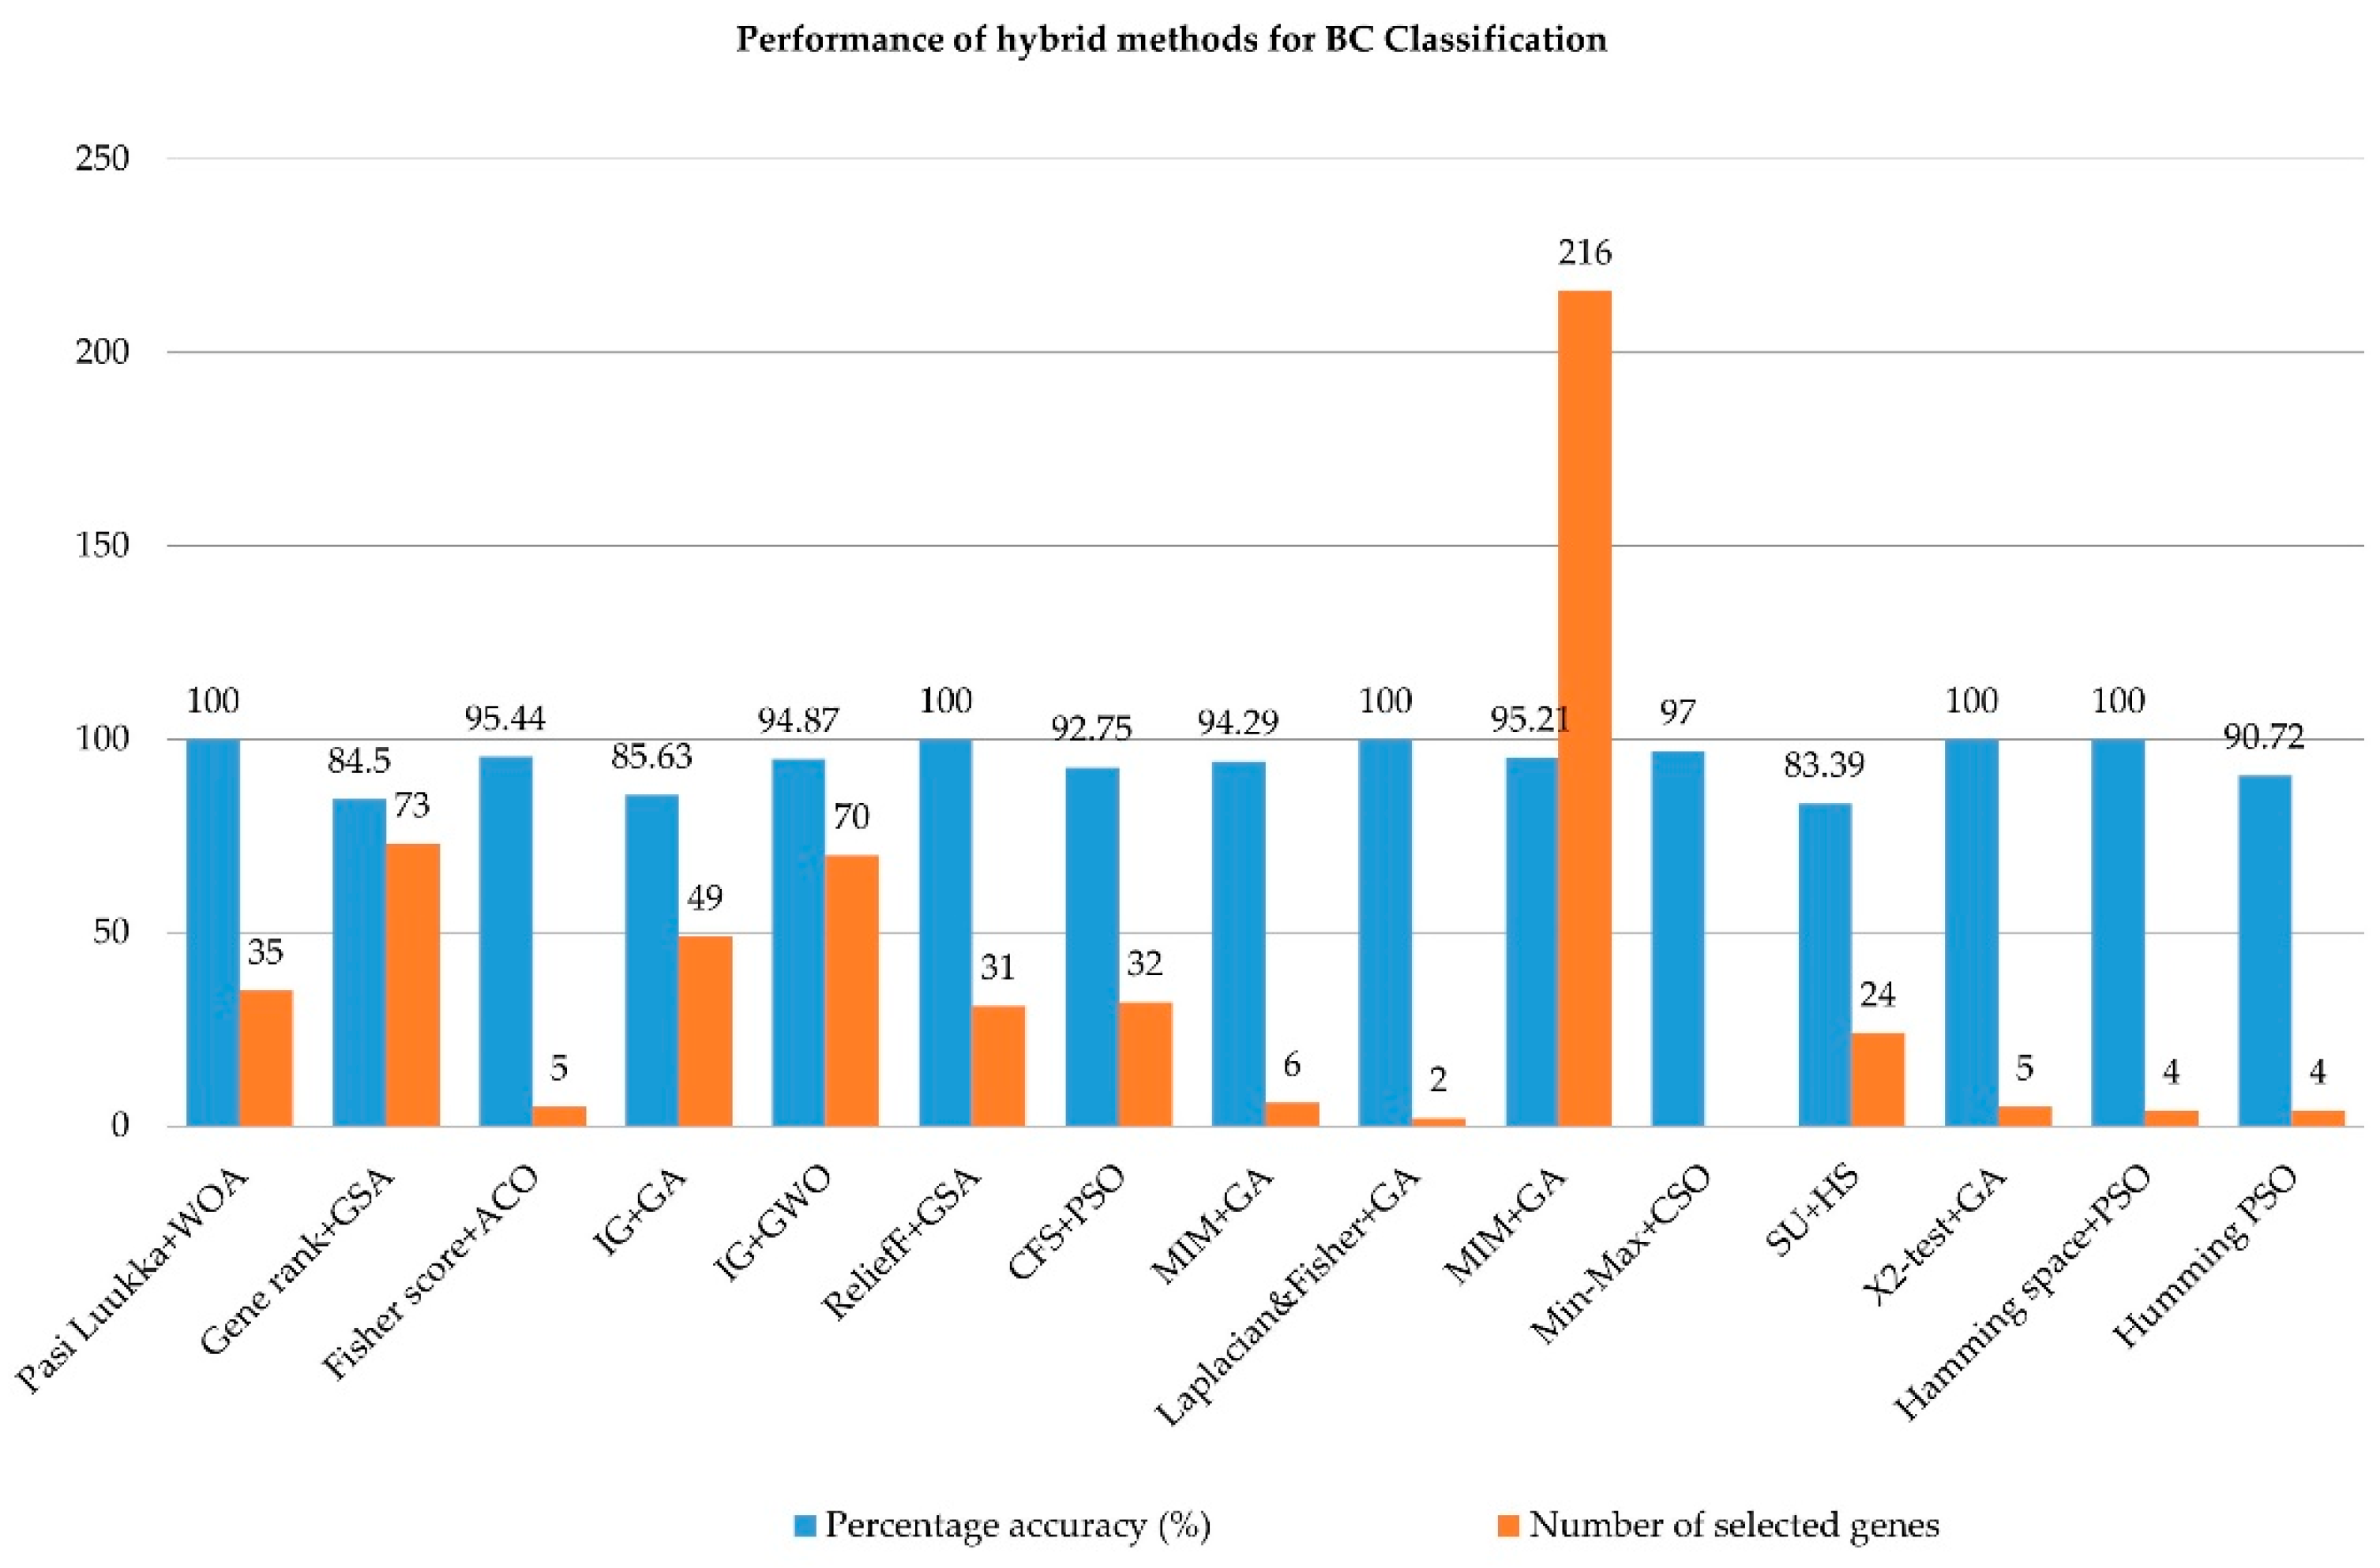
5.1. Hybrid Methods for BC Classification

Kundu et al. (2022) [46] suggested a novel hybrid (filter-wrapper approach) incorporating the Pasi Luukka filter method and an improved WOA algorithm. In the first step, the Pasi Lukka filter method was performed to identify the top 300 genes from the microarray datasets. In the second step, the enhanced WOA algorithm was used to minimize the features subset. The purpose of WOA as the wrapper algorithm was to tackle continuous optimization in binary search problems. Binary and multiclass microarray cancer datasets were employed, including BC, to evaluate the suggested technique. SVM was utilized as a classifier on the training data using the feature subsets obtained from the wrapper technique with five-fold cross-validation. Kundu et al. (2022) also tested their method on other types of cancer. The findings revealed that the suggested method outperformed other wrapper methods, and most of the dataset reached 100% classification accuracy.
Tahmouresi et al. (2022) [47] proposed a hybrid FS method that combines gene rank and improved BGSA (the combination known as pyramid (PGSA)). Gene rank was used as the filter method to limit the number of genes from microarray data. Next, improved binary GSA (IBGSA) was utilized as the wrapper method to select the best gene subset. In each cycle of gene selection, PGSA works with the classifier to maximize the accuracy. SVM was utilized to obtain the fitness value from the proposed method using 10-fold cross-validation. The results revealed that the proposed method outperformed other wrapper methods, with more than 70% of features reduced from the original feature set.
Hamim et al. (2021) [48] proposed a hybrid method for gene selection, which combines a Fisher Score-based filter method with the ACO algorithm. The method was termed HFACO as the purpose was to reduce the number of genes from the microarray data. There are two steps involved. In the first step, a filter approach was employed to reduce the number of genes with high scores picked as the informative genes. Following this, the gene subsets from the filter step were applied during the wrapper step. ACO optimization was implemented for the wrapper method. The ACO algorithm was able to efficiently determine the optimal gene subset. The resultant gene subset from the wrapper FS was classified using SVM, KNN, and C5.0 models with 10-fold cross-validation. The C5.0 classifier was based on a decision tree algorithm, where the C5.0 classifier has the ability to handle high-dimensional datasets. The combination of HFACO with the C5.0 classifier exhibited high classification accuracy compared to other classifiers.
Afif and Astuti (2021) [49] presented a hybrid (filter-wrapper method) comprising IG and GA to forecast BC data using the FLNN classifier. The IG was the filter method whereas the GA was the wrapper technique. In the classification step, the gene assessment from the wrapper technique was evaluated using FLNN. The proposed method was tested utilizing a BC dataset where the microarray BC data had up to 24,481 genes. Two distinct learning rate (LR) parameter values, respectively, 0.01 and 0.6, and in various orders, were applied to the classification step. These were applied to examine the effect of these parameters’ values. The results indicated that BC tends to have more optimal results utilizing an LR of 0.01 compared to the LR of 0.6 with an accuracy of 85.63%. They also evaluated their proposed method for four types of cancer (colon, lung, ovarian, and prostate), and over 90% classification accuracy was achieved.
Loey et al. (2020) [50] proposed a hybrid (filter-wrapper method), comprising IG and GWO to predict BC data using an SVM classifier. In the first step, IG was used as the filter method to calculate the relevant IG values in ascending order with a certain threshold. Next, the highest values from the threshold step were chosen before integrating with GWO. The proposed method was found to work only with a certain number of wolves of GWO after classification using SVM.
Han et al. (2019) [51] proposed to integrate BC data using ReliefF and Recursive Binary GSA (RBGSA) method. The ReliefF is the filter method whereas the RBGSA is the wrapper method. In the classification stage, the gene fitness from the FS step was evaluated using Multinomial Naïve Bayes (MNB) classifier. The proposed method was tested using a BC dataset where the microarray BC data had up to 24,481 genes. The BC cancer data were then tested and compared with the results obtained from the Relief-RBGSA and ReliefF-BGSA methods. The results showed that the hybrid ReliefF-RBGSA outperformed six other existing algorithms with 100% accuracy and a small number of selected genes (31) for the BC data. They also tested their proposed method for five other types of cancer (colon cancer, cancer of the central nervous system, leukemia, lung cancer, and ovarian cancer), and 100% accuracy was achieved for four out of five datasets.
Jain et al. (2018) [52] introduced a hybrid gene selection method using a combination of filter and wrapper methods, namely CFS with improved-Binary PSO (iBPSO). An NB classifier was used in their work. The proposed method was termed CFS-iBPSO-NB. Multivariate CFS was used in the filter step, whereas iBPSO was applied in the wrapper step to select the optimal subset of genes derived from the filter phase. The NB classifier with 10-fold cross-validation was used to evaluate the proposed method. The objective of using iBPSO was to avoid the early convergence of the local optima of the conventional BPSO. The results obtained from the CFS-iBPSO-NB using the BC dataset were compared with those of seven hybrid FS methods with different classifiers to validate the accuracy and number of selected genes attained. The hybrid CFS-iBPSO-NB algorithm achieved more than 90% accuracy in the BC dataset. Out of 24,481 original genes, only 32 differentially expressed genes were selected, which corresponds to only 0.13% of the number of genes. They also tested their proposed method with 10 binary and multiclass benchmark microarray datasets. The results showed that seven datasets achieved 100% classification accuracy, with less than 1.5% in the number of predictive gene subsets.
Shukla et al. (2018) [53] introduced a hybrid framework for gene selection, which combines conditional mutual information maximization (CMIM) and adaptive GA (AGA). The method was called CMIMAGA, as the objective was to determine the number of discriminate genes from the microarray cancer data. There were two stages involved. In the first stage, the filter method was used to eliminate insignificant features. In the second stage, the AGA was used as the wrapper method to further interpret the useful feature subset produced from the first step. The AGA is a method that enables the GA to normalize the possibility of crossover and mutation for the GA convergence. The AGA method is used in the search process to find the best fitness chromosome (solution) before it is passed to the classifiers. The proposed method was tested using the BC dataset. There was an incredible improvement in BC accuracy using the proposed FS method compared to the wrapper method. They also tested their proposed method for other types of cancer datasets. The results using CMIMAGA with the Extreme Learning Machine (ELM) classifier demonstrated the highest classification accuracy compared to using CMIMAGA with SVM and KNN classifiers.
Dashtban and Balafar (2017) [26] proposed a new optimization method for microarray BC gene selection data using a combination of artificial intelligence and GA methods (Intelligent Dynamic GA (IDGA)). The optimization method involved two stages. In the first stage, filter methods (Laplacian and Fisher Score) were used independently to select the top 500 genes based on score rank. In the second step, IDGA, which was based on reinforcement learning and random restart hill climbing, was used to record the best predictive genes. SVM, KNN, and NB were applied as the classifiers. The results showed that 100% classification accuracy was achieved on the BC dataset using SVM and NB classifiers. Dashtban and Balafar (2017) also tested their method on other types of cancer. The results showed 100% classification accuracy for other cancer datasets using the SVM classifier. The IDGA combined with the Fisher Score yielded the best result compared with the IDGA with the Laplacian Score.
Lu et al. (2017) [27] proposed a hybrid FS method, which combines Mutual Information Maximization (MIM) and adaptive GA (MIMAGA). The MIM was chosen as the filter method to select genes with good dependency on all the other genes. AGA was subsequently combined with MIM after the selected genes were set at 300. ELM was used as the classifier. The MIMAGA was then compared with other existing algorithms, such as sequential forward selection (SFS), Relief, and MIM with an ELM classifier using the same BC data and the same number of genes. The results showed that the MIMAGA yielded higher accuracy compared with the other methods. Next, the proposed method was compared to four other classifiers, namely, (1) the backpropagation (BP) algorithm, (2) SVM, (3) ELM, and (4) regularized ELM. The proposed method was able to reduce the number of genes in the BC data to below 300 from up to 20,000 genes with an average of 80% classification accuracy. They also tested their proposed method on five other binary and multiclass datasets. The classification accuracy of all classifiers was more than 80%.
Mohapatra et al. (2016) [54] introduced a new hybrid FS method for microarray data based on the modified cat swarm optimization (MCSO) algorithm. In the first phase, the max-min method was used for feature scaling and normalization. In the second phase, the wrapper method (MCSO) was applied to improve the outcome ability of the best cat’s location using 10 feature subsets. Following this, KNN was applied using five-fold cross-validation to determine the classification accuracy of the feature subset and the optimal features. This process was done while deciding the fitness value of the MCSO algorithm. Five classifiers were utilized in this method, namely, (1) ridge regression (RR), (2) online sequential RR (OSRR), (3) wavelet kernel RR (WKRR), (4) radial basis function kernel RR (RKRR), and (5) SVM. The results indicated that WKRR outperformed other classifiers for the dataset used in their study.
Shreem et al. (2016) [55] proposed a hybrid (filter-wrapper) FS method using symmetrical uncertainty (SU) with HS (SUHS algorithm). This method consisted of two steps. In the first step, the SU filtered out the redundant and irrelevant features in the BC data. Every gene was allocated a score to represent the correlation of genes according to the class. The genes were ranked from the highest to lowest in the next step. Next, the wrapper method was used, which combines the HSA with two different classifiers (IB1 and NB). The experiment was repeated 10 times using the BC dataset. The results showed that the combination of the SUHS algorithm with the IB1 classifier presented more than 80% classification accuracy compared to the NB classifier. The proposed method selected fewer than 30 genes for BC. Shreem et al. (2016) also tested their proposed method for other types of cancer datasets (leukemia, colon cancer, lymphoma, ovarian cancer, and SRBCT). The results showed that the proposed method outperformed other existing methods with a minimum number of selected genes.
Lee and Leu (2011) [56] introduced a hybrid method for the gene selection of microarray data. The proposed method utilized an X2-test for homogeneity combined with a GA and dynamic parameter setting (GADP). The aim of the proposed method was to produce a number of informative genes. In the first step, the sum of the square ratio between groups to within groups was applied in the FS to generate 500 genes from the microarray data. The GADP method was then employed to produce the gene subset. The X2-test was subsequently used to take a particular number of genes produced by the GADP. The SVM classifier was used to validate the efficiency of the selected genes. The results showed 100% accuracy for the BC dataset. Lee and Leu (2011) also tested their proposed method on five other datasets. The proposed method outperformed the existing method, where four datasets achieved 100% accuracy with a minimum number of selected genes.
Alba et al. (2007) [57] proposed a hybrid FS method for microarray data. In their method, Geometric PSO (GPSO) was chosen as the wrapper method and hybridized in the FS phase with SVM as the classifier. Hamming space was implemented in the GPSO prior to generating the gene selection in binary representation. The fitness of the particle from the GPSO was then calculated by applying 10-fold cross-validation using an SVM classifier. The experiment was performed 10 times using 10 feature subsets. The wrapper approach was applied using the standard PSO and GA methods with the SVM classifier. The results showed that the proposed method yielded a classification accuracy of more than 90%, where the number of selected genes was four.
Table 2. Comparison of hybrid-based optimization algorithms for the classification of microarray BC data. The symbol “-“ means no data available.
NoStudiesHybrid Based Optimization MethodClassification MethodNo. of Selected GenesNo. of GenesPercentage of Selected Genes (%)Classification AccuracyBreast Cancer-Associated
Filter MethodWrapper-Based Optimization Method(%)/Reference
1[46]Pasi LuukkaWOASVM354567.68100[58]
4429051.5194.12[59]
2[47]Gene RankGSASVM7320,5450.35584.5[60]
3[48]Fisher ScoreACOC5.0524,4810.0295.44[61]
4[49]IGGAFLNN4924,4810.285.63[62]
5[50]IGGWOSVM7024,4810.2994.87[63]
6[51]ReliefFGSANB3124,4810.13100-
7[52]CFSPSONB3224,4810.1392.75[64,65]
8 MIMGAELM624,4810.0294.29[61]
[53]SVM--87.06
KNN--85.17
9[26]Laplacian and Fisher ScoresGAKNN---95.5[66]
SVM232260.06100
NB- -100
10[27]MIMGAELM21624,4820.8895.21-
11[54]Max-min scaling/normalizationCSOKRR-24,481-97[67]
12[55]SUHSNB1424,4810.0675.97[65]
IB1240.0983.39
13[56]StatisticalGASVM532260.15100[66]
X2-test
14[57]Hamming spaceGASVM424,4810.0290.72[68]
PSO40.02100

5.2. Hybrid Methods for Classification of Other Types of Cancer

Abasabadi et al. (2022) [69] proposed a hybrid method consisting of SLI (sorted label interference) and enhanced GA. The aim of the proposed SLI filter method was to sort and rank features based on their ability. GA was then utilized to determine the features at the top of feature ranking in order to look for the optimal feature subset. The fitness value was obtained using two distinct classifiers, notably KNN and ANN. Eleven datasets from Wisconsin and high dimensional microarray datasets were employed to examine the efficiency of this method. KNN and ANN classifiers were employed in their work. The proposed method was evaluated 100 times using 10-fold cross-validation with and without feature selection methods. The proposed method showed outstanding classification accuracy utilizing hybrid FS with a KNN classifier compared to other current methods with a small number of selected genes.
Kowsari et al. (2022) [70] introduced a combination of signal-to-noise ratio (SNR) and multi-objective PSO to classify microarray data. The aim of the proposed method employing the SNR filter method was to filter out the unimportant features and sort the top 100 features that had performed effectively. The findings from the filter approach were applied in the multi-objective PSO in order to optimize the accuracy with the smallest number of selected features. An adaptive KNN classifier was implemented on the selected genes and was tested 10 times. The results showed that the proposed method obtained great classification accuracy, with two datasets obtaining 100% accuracy.
Sazzed (2021) [71] developed a hybrid approach consisting of ANOVA-SRC, and binary PSO to categorize high dimensional microarray data (ANOVA-SRC-BPSO). The proposed FS method was completed in three steps (ANOVA test, followed by Spearman correlation, and the wrapper method). In the first step, the ANOVA test procedure was employed to separate the correlated and highly significant genes. In the second step, the SRC was applied to delete redundant and insignificant features. In the third step, the wrapper-based method, namely BPSO, was applied based on the obtained features from the second step. BPSO was applied to select the best feature subset. The proposed method was evaluated on seven datasets using an SVM classifier with the aim of obtaining the highest classification accuracy. The proposed results were compared to the benchmark methods in the literature review, with four datasets attaining 100% accuracy.
Zhang et al. (2020) [72] proposed a novel gene selection hybrid method, which combines IG and a modified binary krill herd (MBKH) algorithm. In their work, the KH algorithm was for the first time utilized in high-dimensional microarray datasets. The proposed method was applied in two steps. In the first step, the IG filter method was performed to rank all features. Next, the highly discriminating features that have higher IG weight were selected. In the second step, the MBKH algorithm was subsequently applied to select the best position of the gene subset acquired from the filter method. The proposed method was tested on nine datasets using KNN, SVM, and NB classifiers with the aim of comparing and achieving the highest classification accuracy. The proposed results were compared to the three classifiers, with four datasets attaining 100% accuracy using the KNN classifier.
Pragadeesh et al. (2019) [73] proposed a hybrid method comprising IG and an improved GA algorithm in order to select genes from the microarray dataset. The purpose of the study was to apply a bio-inspired method to determine the optimal feature subset using a systematic random search and to identify the reduced selected features. In the first step, the IG filter approach was used to select the most informative genes. The selected genes acquired from the filter method were then employed in the second step (wrapper method). Next, the improved GA algorithm was used to minimize the selected genes. The proposed method was tested on three datasets using SVM. The findings revealed that high classification accuracy was attained in the three datasets.
Almugren and Alshamlan (2019) [74] proposed a new hybrid bio-inspired (filter-wrapper) method for the FS of microarray cancer data, which was given the name F-Score Firefly (ZXFFF-SVM) algorithm. This method involved two steps. In the first step, the F-Score was used as the filter method to minimize the dimensionality of the cancer data and reduce the search space by selecting five different filtered data with an interval of 100. Next, the accuracy of the filtered data was classified using leave-one-out cross-validation (LOOCV) to generate the highest accuracy with a small number of selected features. The selected genes from the filter stage were further applied in the FA to determine the best firefly in order to generate the fitness value to be classified using the classifier. The fitness values obtained from the FA were classified using an SVM classifier to increase the classification accuracy while generating the minimum number of chosen genes. Five different microarray data were used, and most of them had between 2000 and 7200 genes. The proposed method was compared to other existing methods in the literature review, and the results of three out of five datasets demonstrated that the proposed method had 100% classification accuracy.
Baliarsingh, et al. (2019) [75] proposed a novel FS method for microarray cancer data based on a bio-inspired optimization algorithm (Salp Swarm algorithm (SSA)) with a kernel ELM (KELM) classifier. In the first stage, a Fisher Score was used as the filter method to select the highly relevant genes of the data. The proposed method introduced a new parameter for SSA, namely weightage and chaotic (WCSSA) strategies with the aim to progress the salp position value. Following this, the WCSSA algorithm was used to select the optimal gene values before the values were passed to the KELM classifier to maximize the classification accuracy and determine the most discriminated feature subset. The proposed WCSSA-KELM method was repeated 10 times using 10 cross-validation methods using binary and multiclass cancer data. The performance was compared to the standard SSA and other conventional methods. The findings showed that the proposed method outperformed the SSA-KELM method and other existing methods, with the majority of the test achieving more than 95% classification accuracy with a minimum number of selected genes.
Musheer, et al. (2019) [76] proposed a hybrid gene selection method comprising Independent Component Analysis (ICA) and ABC (ICA-ABC). In the first step, ICA was used as the filter method to select an average of 50–180 features from each gene microarray data. The ABC algorithm was subsequently applied to choose the gene subset obtained from the filter method. The proposed method was further tested with an NB classifier to maximize the classification accuracy. The proposed method was compared with other stochastic wrapper methods (PSO and GA) with an SVM classifier using six binary class microarray data. The results demonstrated that the proposed method attained the highest classification accuracy using the NB classifier.
Baliarsingh et al. (2019) [77] developed a hybrid FS method (ANOVA-EJFOA). The ANOVA statistical test was chosen as the filter method to select the relevant features from seven microarray datasets. Next, the Forest Optimization Algorithm (FOA) was used as the wrapper method to select the best gene subset using the Enhanced Jaya (EJ) algorithm. The aim of embedding the EJ method into the proposed method was to tune the two parameters of FOA, namely, the local and global seeding parameters, in order to enhance the optimum gene subset and avoid local optima of the randomness error. SVM was used to compute the fitness value from the proposed method using 10-fold cross-validation and the experiment was repeated 10 times. Seven microarray datasets were used, from which three of them were binary class and the others were multiclass. The results demonstrated that the proposed method outperformed other benchmark algorithms, with more than 99% of features reduced from the original feature set.
Baliarsingh et al. (2019) [78] proposed a hybrid method consisting of the Fisher Score and the ReliefF method with an emperor penguin optimizer (EPO) algorithm in order to select genes from the microarray dataset. The aim of this study was to apply a bio-inspired method to simulate a balance exploration within FS with predictive parameter values by applying a local search algorithm (EPO algorithm). In the first phase, two filter methods, (Fisher Score and ReliefF methods) were used to select 500 important genes, and SVM was used to classify the important genes. The Fisher Score method demonstrated better results compared with the ReliefF method. The selected genes obtained from the Fisher Score method were then used in the second phase (wrapper step). Next, the EPO algorithm, with the aid of a local search strategy, was used to enhance the optimal genes. The proposed method was classified using SVM on seven binary and multiclass microarray datasets. The proposed method obtained the highest classification accuracy compared with other methods. However, the proposed method is computationally expensive and complex.
Vijay and GaneshKumar (2018) [79] developed a Hybrid Stem Cell (HSC) method for Fuzzy classification based on microarray cancer data. AC optimization and novel adaptive stem cell optimization (ASCO) were proposed. In the initial step, the mutual information (MI) approach was employed to select the useful and relevant genes. Five microarray datasets were used to analyze the performance of the proposed method. The classification accuracy was compared to other fuzzy classification methods. The hybrid colony algorithm (HCA) accuracy was compared with other fuzzy-based classification systems (e.g., HCA), and the fuzzy classification was combined with bio-inspired systems such as PSO and GA. The findings showed that high classification accuracy was achieved compared with other methods.
Alshamlan (2018) [80] proposed a new hybrid bio-inspired FS algorithm for microarray data classification. The proposed method combined a CFS filter and the ABC algorithm. This hybrid method was named Co-ABC. In the initial step, the CFS filter method was used to remove fussy and unnecessary data from the high dimensional features of the microarray data. The resulting filtered gene subset was then classified using an SVM classifier for use in the wrapper method (ABC). The objective was to minimize the computational cost to be applied in the ABC algorithm by selecting a high number of informative genes. Six binary and multiclass microarray data were evaluated using the proposed method. The experiment was repeated 30 times and the proposed method was compared to PSO and GA with the same classifier. The proposed method outperformed other methods, where five datasets achieved 100% accuracy with a minimum number of selected genes.
Motieghader et al. (2017) [81] proposed a hybrid comprising Learning Automata (LA) and GA (GALA). The proposed LA filter method was based on penalty and reward learning rules. The gene selection was determined based on the rewards and penalties. GA was then used to determine the best gene subset. Six binary and multiclass datasets were applied to evaluate the efficiency of this method. An SVM classifier was used in their study. The proposed method was tested 40 times independently. The proposed method yielded remarkable classification accuracy compared to other existing methods with a minimum number of selected genes.
Aziz et al. (2017) [82] proposed a hybrid method comprising an independent ICA filter with an ABC wrapper approach to select genes from the microarray cancer data. In the first stage, the ICA filter method was used to reduce the feature vector of the microarray data. In the second stage, the ABC search algorithm was used to determine the optimal gene subset. The aim of the hybrid ICA-ABC approach was to optimize the feature vectors of the microarray data. Six microarray datasets were used to evaluate the proposed method. The proposed method was compared with the minimum Redundancy Maximum Relevance (mRMR) filter method and other bio-inspired optimizers such as GA and PSO. The fitness of the selected genes obtained from the hybrid method was evaluated using an NB classifier and LOOCV. The results demonstrated that the hybrid ICA-ABC FS method was able to produce a small gene subset compared to other methods in the literature.
Mohamed et al. (2017) [83] proposed a combination of enhanced mRMR and CS to classify microarray drug response and cancer data (mRMR-CS). The objective of the proposed method was to select the best gene rank by dividing the dataset into training and testing data and to reduce the high dimensional space of the microarray data. The results from the filter score were applied in the following bio-inspired methods: PSO, CS, and ABC. The SVM and KNN classifiers were implemented on the selected genes using 10-fold cross-validation. Four binary microarray cancer data were used to evaluate the proposed method. The findings indicated that the hybrid of the mRMR-CS FS method outperformed other methods with a minimum number of selected genes.
Salem et al. (2017) [84] proposed a hybrid method comprising IG and standard GA (IG-SGA) for the selection of genes in the microarray cancer data. The IG filter method was initiated to choose the significant genes from the microarray data. The IG threshold was introduced to control the classification accuracy and set the number of relevant genes. Next, SGA was employed to reduce the number of features (genes) attained from the filter method. The proposed method was applied to seven binary microarray datasets using a genetic programming (GP) classifier and a 10-fold cross-validation process. The results showed that the proposed method achieved high classification accuracy, with two datasets achieving 100% accuracy.
Alshamlan et al. (2015) [85] proposed a novel hybrid method of gene selection, namely, mRMR-Genetic Bee Colony (GBC). The GBC algorithm was a hybrid of GA and the ABC algorithm. In the proposed GBC, GA operations were hybridized with ABC for the onlooker bee (crossover operation) phase and the scout bee (mutation operation) phase. During the wrapper phase (gene selection), the GA parameters were combined with the ABC algorithm based on the crossover operation (onlooker bee) and the mutation operation (scout bee). For the filter method, the mRMR method was used in conjunction with the SVM classifier [86] to select a set of computed genes, demonstrating 100% accuracy. The performance of the proposed algorithm was validated on six binary and multiclass microarray datasets. The classification accuracy of each dataset was examined using the SVM classifier. The proposed algorithm was compared with other bio-inspired methods using similar filter methods, namely, mRMR-ABC, mRMR-GA, and mRMR-PSO. The results showed that five datasets achieved 100% accuracy.
In another work, Alshamlan et al. (2015) [87] proposed a hybrid FS algorithm based on mRMR with the ABC algorithm (mRMR-ABC). The mRMR filter method was applied during the initial step to reduce the irrelevant and redundant genes. Next, the mRMR was applied in the SVM classifier to produce a gene set that generated an accuracy of 100%. Most of the informative genes were notified by the development of the ABC algorithm on the dataset produced from the filter step. The classification accuracy of the proposed algorithm was validated using the SVM classifier. The proposed algorithm was benchmarked with a similar filter method and two different bio-inspired algorithms, namely, mRMR-GA and mRMR-PSO. The results indicated that the mRMR-ABC methodology achieved 100% accuracy in five datasets.
Chuang et al. (2011) [88] developed a novel gene selection hybrid method, which combines CFS and Taguchi GA (CFS-TGA). The proposed FS method was conducted in two steps (filter method, followed by the wrapper method). In the first step, the CFS filter method was applied to remove the insignificant features. In the second step, the TGA procedure was applied to the resulting features to select only the best gene subset. The TGA was a hybridization of the Taguchi method and GA, where the Taguchi method was included during the crossover and mutation process of the GA procedure. GA was used as a local search algorithm to choose features for the crossover operation. The classification accuracy of the proposed method was tested using the KNN classifier on the binary and multiclass datasets. The proposed results were compared to the benchmark methods in this literature review. The results of the proposed method showed high classification accuracy compared to other methods.
Sharbaf et al. (2016) [89] proposed a hybrid (filter-wrapper) FS method (CLA-ACO). During the filter step, the genes were ranked using the Fisher Criterion as the filter method to reduce the complexity of the search region in the microarray data space. Following this, the best genes obtained from the filter step were applied during the wrapper step. Cellular LA and AC optimization were used for the wrapper method. CLA is a learning algorithm based on the penalty and reward concept. Both parameters were conducted to progress the CLA-ACO framework in attaining the best target features and interacting with one another. The resulting gene subset from the wrapper FS was classified using SVM, NB, and KNN. Four binary and multiclass microarray datasets were used to evaluate the performance of the proposed method. Moreover, the proposed method was compared to four different methods, namely, T-test, IG, Fisher Score, and Z-score. The proposed method outperformed other existing methods with a small number of selected genes.
Table 3. Comparison of hybrid-based optimization algorithms for the classification of the other types of cancer. The symbol “-“ means no data available.
ItemStudiesHybrid Based Optimization MethodClassification MethodNo of Selected GenesPercentage of Selected Genes (%)No of GenesClassification
Accuracy
Dataset Associated with Cancer for Possible Diagnosis
Filter MethodWrapper-Based Optimization Method(%)
1[46]Pasi LuukkaWOASVM211.052000100Colon
251.082308100SRBCT
300.4217129100Leukemia
370.29512,53410011_Tumors
220.4025470100DLBCL
2[69]SLIGAKNN290.407712999.97CNS
110.552000100Colon
290.407712999.99Leukemia
3[70]SNRPSOKNN--707099.47DLBCL
--828094.62Leukemia
--12,533100Prostate
--12,625100CML
--200098.81Colon
4[71]Spearman CorrelationPSOSVM180.9200092Colon
440.617712997CNS
60.0847128100DLBCL
230.3237129100Leukemia
30.02412,533100Lung
90.08610,50997Prostate
60.262308100SRBCT
5[72]IGKH 170.85200096.47Colon
140.196712990.34CNS
40.0567129100ALL-AML
230.18312,60196.12Lung
30.019815,154100Ovarian
80.1127129100ALL-MLL3
KNN150.21712999.44ALL-MLL4
110.08712,58299.72MLL
60.262308100SRBCT
120.6200096.06Colon
160.224712992.78CNS
40.0567129100ALL-AML
200.15912,60195.98Lung
40.02615,154100Ovarian
80.112712998.89ALL-MLL3
SVM150.21712997.53ALL-MLL4
130.10312,58299.31MLL
70.303230898.65SRBCT
120.6200090.97Colon
120.168712982.5CNS
140.196712998.94ALL-AML
30.02412,60173.58Lung
NB100.06615,15499.82Ovarian
120.168712992.31ALL-MLL3
30.042712977.33ALL-MLL4
200.15912,58290.97MLL
210.91230893.15SRBCT
6[73]IGGASVM170613.6112,533100Lung
284418.7715,15495.05Ovarian
290.407712992.86CNS
7 F-ScoreFASVM150.75200094.3Colon
[74]20.037129100Lung
50.077129100Leukemia-1
80.352308100SRBCT
100.14712997.8Leukemia-2
8[75]Fisher ScoreSSAKELM30.04712999Leukemia
50.25200095.5Colon
40.0315,154100Ovarian
40.06712999.38ALL-AML-3
30.07402699.71Lymphoma-3
70.32308100SRBCT
50.0412,60098.9Lung
9 ICAABCNB160.8200098.17Colon
[76]120.17712998.18Acute
160.1312,60098.38Prostate
90.0712,62594.39High-grade glioma
240.1912,53392.76Lung Cancer II
150.21712997.12Leukemia-2
SVM150.75200097.09Colon
130.18712996.72Acute
130.10312,60097.2Prostate
140.1112,62593.21High-grade glioma
220.1812,53395.23Lung Cancer II
190.27712996.43Leukemia-2
10 ANOVAFOASVM40.06712998.57Leukemia-2
[77]30.15200096.9Colon
40.0315,154100Ovarian
40.06712998.55Leukemia-3
30.07402699.87Lymphoma-3
50.22230897.77SRBCT
40.0312,60094.56Lung cancer-5
11 Fisher Score and ReliefFEPOSVM70.1712998.82Leukemia
[78]80.4200096.44Colon
50.0315,154100Ovarian
80.11712997.66ALL-AML-3
60.15402699Lymphoma-3
60.26230898.91SRBCT
50.0412,60092.45Lung-5
12[51]ReliefFGSANB50.25200095.02Colon
90.137129100Central Nervous System
50.077129100ALL-AML
90.0712,533100Lung
40.0315,154100Ovarian
13[53]MIMGA 90.45200098.89Colon
ELM70.17402699.07DLBCL
80.11712999.14Leukemia
70.32308100SRBCT
130.112,60096.34Lung
SVM--200089.31Colon
--402697.07DLBCL
--712992.67Leukemia
--230896.79SRBCT
--12,60085.96Lung
--200085.97Colon
KNN--402695.3DLBCL
--712989.79Leukemia
--230895.23SRBCT
--12,60087.78Lung
14[52]CFSPSONB40.2200094.89Colon
100.14712995.84Central nervous system
40.067129100ALL-AML
100.0812,533100Lung
30.0215,154100Ovarian
60.087129100ALL-AML-3
200.28712997.63ALL-AML-4
240.64026100Lymphoma
300.2412,582100MLL
341.472308100SRBCT
15[79]Mutual InformationACFuzzy--2000100Colon
System--7129100Leukemia
--12,60090.85Prostate
16[80] ABC 90.45200096.77Colon
CFSSVM30.047129100Leukemia1
20.037129100Lung
40.172308100SRBCT
20.054026100Lymphoma
60.087129100Leukemia2
GA 80.4200090.32Colon
240.347129100Leukemia1
200.287129100Lung
381.652308100SRBCT
170.424026100Lymphoma
360.57129100Leukemia2
PSO 70.35200091.94Colon
150.217129100Leukemia1
50.077129100Lung
351.522308100SRBCT
--4026-Lymphoma
--7129-Leukemia2
17 MIMGAELM70.1713097.62Leukemia
[27]190.95200089.09Colon
930.7412,60097.69Prostate
30.0212,53597.8Lung
301.3230995.8SRBCT
18[81]LAGASVM80.42000100Colon
20.037129100ALL_AML
60.26230899.94SRBCT
30.0212,58295.71MLL
100.17572789.15Tumors_9
100.0812,53485.23Tumors_11
19[82]ICAABCNB160.8200098.14Colon
120.17712998.68Leukemia
160.1312,60098.88Prostate
120.112,62594.22Glioma
240.1912,53392.45Lung
150.21712997.33Leukemia-2
PSO201200091.17Colon
190.27712995.81Leukemia
320.2612,60093.21Prostate
230.1812,62591.11Glioma
410.3312,53389.19Lung
400.56712997.13Leukaemia-2
GA180.9200093.38Colon
170.24712996.76Leukemia
270.2112,60095.32Prostate
180.1412,62595.23Glioma
270.2212,53391.68Lung
350.49712994.12Leukemia-2
20[83]mRMRCSKNN80.11712971.43Central Nervous
824.1200085.48Colon
2062.897129100Lung
80.0612,60071.43Prostate
80.11712971.43Central Nervous
SVM33516.75200087.1Colon
3334.677129100Lung
80.0612,60071.43Prostate
21[26]Laplacian or Fisher ScoreGAKNN--230891.6SRBCT
--402697.9DLBCL
--712997.2Leukemia
--12,60095.6Prostate
SVM180.782308100SRBCT
90.224026100DLBCL
150.217129100Leukemia
140.1112,60096.3Prostate
NB--230889.2SRBCT
--402695.8DLBCL
--712993.1Leukemia
--12,60093.4Prostate
22[84]IGGAGP30.04712997.06Leukemia
603200085.48Colon
380.53712086.67Central nervous sys
110.38288074.4Lung-Ontario
90.137129100Lung-Michigan
1101.54712994.8DLBCL
260.2112,600100Prostate
23[55]SUHSNB260.367129100ALL-AML
90.45200087.53Colon
170.24712981.42CNS
90.224026100Lymphoma
120.0815,15499.65Ovarian
371.6230899.89SRBCT
24 mRMRGBCSVM100.5200098.38Colon
40.067129100Leukemia-1
[85]40.067129100Lung
60.262308100SRBCT
40.14026100Lymphoma
80.117129100Leukemia-2
25[87]mRMRABCSVM150.75200096.77Colon
140.197129100Leukemia-1
80.117129100Lung
100.432308100SRBCT
50.124026100Lymphoma
200.287129100Leukemia-2
26[56]StatisticalGASVM80.42000100Colon
X2 test80.352308100SRBCT
50.077129100ALL/AML
60.154026100DLBCL
260.1616,30687.04GCM
27[88]CFSGAKNN240.42572690.59_Tumors
1371.0912,53310011_Tumors
530.3515,00974.3914_Tumors
440.74592099.45Brain_1
330.3210,367100Brain_2
220.415327100Leukemia-1
350.3111,225100Leukemia-2
1951.5512,60098.42Lung
291.262308100SRBCT
240.2310,50999.22Prostate
170.315469100DLBCL
28 Fisher CriterionACNB50.07712997.6ALL-AML Leukemia
[89]60.0512,60099.1Prostate
120.112,58298.95MLL
120.17712986.3ALL-AML-4
SVM20.03712995.95ALL-AML Leukemia
140.1112,60098.35Prostate
--12,582-MLL
--7129-ALL-AML-4
KNN30.04712995.95ALL-AML Leukemia
90.0712,60099.4Prostate
180.1412,58297.55MLL
150.21712980.99ALL-AML-4

6. Analysis and Discussion

The key works reviewed in this literature review are tabulated in Table 2 and Table 3. In summary, the number of microarray features is significantly large with a small sample size. The pre-processing step is essential prior to the feature selection and classification process. The pre-processing method will help eliminate noisy, nonessential features. The hybrid filter-wrapper methods are discussed using several machine learning approaches. Based on the results, only the fittest genes are selected to be classified from the thousands of differentially expressed genes.
Based on this literature review, GA and SVM are the most widely applied wrapper and classifier, respectively. Furthermore, both methods have demonstrated excellent performance by yielding a small number of selected genes when used for microarray classification problems.
Figure 3 shows the accuracy and number of selected genes obtained from the hybrid (filter-wrapper) methods on the BC data reviewed here. The hybrid methods are observed to be able to achieve good accuracy within the range of 80–100% and significantly reduce the number of features used for classification.
Figure 4 shows the metaheuristic algorithm used in the hybrid method reviewed. Based on this literature review, GA is the most widely applied wrapper method in this literature review, followed by both GSA and PSO. The works using GA, GSA, and PSO have reported accuracies of 100%, with a very small number of genes selected.
Moreover, SVM is the most popular and widely applied classifier, as shown in Figure 5. This is followed by NB and KNN. SVM is useful and works well in supervised classification problems [86], giving high accuracy when solving linear and nonlinear problems of large datasets.

7. Future Trends

In this section, we discuss the prospective trends of human genome analysis and its significance in machine learning research.

7.1. Understanding the Biological Associated Genes Using Intelligent Systems

To date, intelligent systems play an important role in assisting advanced applications of medical data diagnosis beyond patient stratification. For instance, the prediction of BC survival using biological-associated genes can aid in identifying gene mutations with better classification accuracy. The BC-related genes can be used for drug treatment and, indirectly, this will help to recover patients’ health and reduce the possibility of relapse.

7.2. Genome Data Will Exponentially Increase

Currently, the major challenge of intelligence systems in microarray classification is the small number of samples. On the other hand, the number of genes varies according to their traits and characteristics produced, and the number of genes is exponentially increasing and constantly evolving. However, it has been reported that by 2026, the genome database will generate and analyze up to two million genome sequences, including data from the clinical trials of hundreds of thousands of patients [90]. This brings enormous possibilities and advancements for both intelligent systems and machine learning approaches. Therefore, if handled properly, the problem with the framework and dealing with large datasets can be solved.

7.3. Comprehensive and Delicate Approaches for the Discovery of Potentially Clinically Relevant Genes

Genomic research is conducted to discover and develop new potential drugs and targeted therapies [91]. Intelligent systems are considerably useful, and these systems can be used to deal with large-scale databases because they will speed up the time they receive from knowledge or learning into human insight. Eventually, the progression of intelligent systems can be used to acknowledge the data used to gain knowledge or understanding of the disease. The advancement of intelligent systems and the wide range of applications in this area have proven that the human genome database can be analyzed to discover new genetic variants. Hence, intelligent methods can help us understand genetic variations to diagnose diseases (benign or malignant cancer) and their clinical significance. This indicates that there are always opportunities to search for new methods as well as combining the genome data produced from the genomic analysis, including differentially expressed genes of human or animal phenotypes to discover novel, potential target genes based on the findings of state-of-the-art methods.

7.4. Stratifying the Studies Related to the Transcription of Genetic Codes into Messenger RNA

Intelligent systems can be extended across various -omics studies, such as transcriptomics, genomics, and other biological terms that end with the suffix -omics. Transcriptomics, for instance, transfers gene codes into messenger RNA (mRNA) with a unique identifier and name that can be used to discover and map the gene network and its relationship for better prognosis and treatment.

7.5. RNA-Seq, Leading to Extensive and More Complex Bioinformatic Analysis

The latest approach to gauge microarray gene expression that is slowly replacing microarrays uses fast technology that results in highly intensive computational analysis with longer analysis times. However, RNA-Seq technology has its own limitations such as less standardized protocols, and the file sizes are larger than the microarray data. However, the drawbacks of RNA-Seq technology are being gradually being improved, especially for cancer research and gene expression profiling.
These five prospective areas can benefit from intelligent FS techniques. Therefore, studies pertaining to the enhancement of FS methods, including hybrid-based FS, are a relevant and important research domain.

8. Conclusions

There are numerous advantages to using microarray data for gene expression profile research. Cancer classification is one of the most important uses of microarray data analysis. The large dimensionality of gene expression data and, additionally, the datasets often being asymmetrical, where the number of samples from different classes are not balanced, make it difficult to perform analysis. A feature selection method is the best way to deal with these issues. Based on the literature review, many extensive experiments have been conducted over the years to automate the analysis of microarray data. In this paper, we have reviewed studies pertaining to the feature selection of microarray data, with an emphasis on metaheuristic-based hybrid methods. Hybrid methods combine two or more feature selection methods such as filter and wrapper methods to achieve better feature selection. In microarray data processing, many hybrid algorithms using metaheuristic methods as a wrapper methodology have been employed for gene selection and cancer classification [92]. We may conclude that the genetic algorithm GA is the most commonly used wrapper approach in the literature, whereas SVM is the most frequently used in this review.
The latest and highly cited WOA algorithm was used as the wrapper method in FS for microarray data classification. The emerging study trend on WOA is predicted to continue in the future. Therefore, in future work, we intend to apply a hybrid FS algorithm based on WOA and GA (most widely applied) as the wrapper method to identify the most significant genes in various high-dimensional BC microarray datasets.
The outcome of a robust FS method will benefit and help in screening and diagnosing human disease classification by providing accurate and high classification accuracy with a small number of selected genes. With this review, we hope that this will aid other researchers to identify suitable FS techniques for their work or to identify gaps in this field as well as areas for further improvement.

Author Contributions

Conceptualization, N.M.A., N.A.A.A. and R.B.; methodology, N.M.A.; formal analysis, N.M.A., N.A.A.A.; investigation, N.M.A., N.A.A.A. and R.B.; writing—original draft preparation, N.M.A.; writing—review and editing, N.M.A., N.A.A.A. and R.B. All authors have read and agreed to the published version of the manuscript.

Funding

Universiti Teknikal Malaysia Melaka, the Ministry of Education Malaysia, under Funding Number: KPT(BS)850320045568 through SLAB Sponsorship Awards, Fisabilillah Research & Development Grant, Tabung Amanah Zakat under Funding Number: MMUE/180060 and Page Charge Scheme Multimedia University, Malaysia.

Data Availability Statement

Not applicable.

Acknowledgments

This work is supported by Universiti Teknikal Malaysia Melaka, the Ministry of Education Malaysia, under Funding Number: KPT(BS)850320045568 through SLAB Sponsorship Awards, Fisabilillah Research & Development Grant, Tabung Amanah Zakat under Funding Number: MMUE/180060 and Page Charge Scheme Multimedia University, Malaysia. Also, thanks to the referred reviewers for their valuable comments and suggestions that made considerable improvement to our work.

Conflicts of Interest

The authors declare no conflict of interest.

References

  1. Bray, F.; Ferlay, J.; Soerjomataram, I.; Siegel, R.L.; Torre, L.A.; Jemal, A. Global cancer statistics 2018: GLOBOCAN estimates of incidence and mortality worldwide for 36 cancers in 185 countries. CA. Cancer J. Clin. 2018, 70, 313. [Google Scholar] [CrossRef] [PubMed]
  2. Kumar, R.; Sharma, A.; Tiwari, R.K. Application of microarray in breast cancer: An overview. J. Pharm. Bioallied Sci. 2012, 4, 21. [Google Scholar] [CrossRef] [PubMed]
  3. Hartmann, S.; Reimer, T.; Gerber, B. Management of early invasive breast cancer in very young women (<35 years). Clin. Breast Cancer 2011, 11, 196–203. [Google Scholar] [CrossRef] [PubMed]
  4. Breastcancer.org. U.S. Breast Cancer Statistics. 2019. Available online: https://www.breastcancer.org/facts-statistics (accessed on 6 December 2021).
  5. Brekelmans, C.T.M.; Seynaeve, C.; Menke-Pluymers, M.; Brüggenwirth, H.T.; Tilanus-Linthorst, M.M.A.; Bartels, C.C.M.; Kriege, M.; van Geel, A.N.; Crepin, C.M.G.; Blom, J.C. Survival and prognostic factors in BRCA1-associated breast cancer. Ann. Oncol. 2006, 17, 391–400. [Google Scholar] [CrossRef]
  6. Hisham, A.N.; Yip, C.-H. Overview of breast cancer in Malaysian women: A problem with late diagnosis. Asian J. Surg. 2004, 27, 130–133. [Google Scholar] [CrossRef]
  7. IARC CancerBase. Section of Cancer Surveillance. In GLOBOCAN 2012: Estimated Cancer Incidence, Mortality and Prevalence Worldwide in 2012; IARC: Lyon, France, 2012; pp. 1–7. [Google Scholar]
  8. Lipscombe, L.L.; Goodwin, P.J.; Zinman, B.; McLaughlin, J.R.; Hux, J.E. The impact of diabetes on survival following breast cancer. Breast Cancer Res. Treat. 2008, 109, 389–395. [Google Scholar] [CrossRef]
  9. Yang, L.; Parkin, D.M.; Ferlay, J.; Li, L.; Chen, Y. Estimates of cancer incidence in China for 2000 and projections for 2005. Cancer Epidemiol. Biomark. Prev. 2005, 14, 243–250. [Google Scholar] [CrossRef]
  10. Sotiriou, C.; Neo, S.-Y.; McShane, L.M.; Korn, E.L.; Long, P.M.; Jazaeri, A.; Martiat, P.; Fox, S.B.; Harris, A.L.; Liu, E.T. Breast cancer classification and prognosis based on gene expression profiles from a population-based study. Proc. Natl. Acad. Sci. USA 2003, 100, 10393–10398. [Google Scholar] [CrossRef]
  11. Mount, D.W.; Putnam, C.W.; Centouri, S.M.; Manziello, A.M.; Pandey, R.; Garland, L.L.; Martinez, J.D. Using logistic regression to improve the prognostic value of microarray gene expression data sets: Application to early-stage squamous cell carcinoma of the lung and triple negative breast carcinoma. BMC Med. Genom. 2014, 7, 33. [Google Scholar] [CrossRef]
  12. Alexe, G.; Alexe, S.; Axelrod, D.E.; Bonates, T.O.; Lozina, I.I.; Reiss, M.; Hammer, P.L. Breast cancer prognosis by combinatorial analysis of gene expression data. Breast Cancer Res. 2006, 8, R41. [Google Scholar] [CrossRef] [Green Version]
  13. Narendra, P.M.; Fukunaga, K. A branch and bound algorithm for feature subset selection. IEEE Comput. Archit. Lett. 1977, 26, 917–922. [Google Scholar] [CrossRef]
  14. Abd-Elnaby, M.; Alfonse, M.; Roushdy, M. Classification of breast cancer using microarray gene expression data: A survey. J. Biomed. Inform. 2021, 117, 103764. [Google Scholar] [CrossRef]
  15. Schena, M. DNA Microarrays: A Practical Approach; No. 205; Practical approach series; Oxford University Press: Oxford, UK, 1999. [Google Scholar]
  16. Rew, D.A. DNA microarray technology in cancer research. Eur. J. Surg. Oncol. 2001, 27, 504–508. [Google Scholar] [CrossRef]
  17. Govindarajan, R.; Duraiyan, J.; Kaliyappan, K.; Palanisamy, M. Microarray and its applications. J. Pharm. Bioallied Sci. 2012, 4 (Suppl. S2), S310. [Google Scholar]
  18. Zhang, J.-G.; Deng, H.-W. Gene selection for classification of microarray data based on the Bayes error. BMC Bioinform. 2007, 8, 1–9. [Google Scholar] [CrossRef]
  19. Dawany, N.B.; Tozeren, A. Asymmetric microarray data produces gene lists highly predictive of research literature on multiple cancer types. BMC Bioinform. 2010, 11, 1–14. [Google Scholar] [CrossRef]
  20. Guyon, I.; Gunn, S.; Nikravesh, M.; Zadeh, L.A. Feature Extraction: Foundations and Applications; Springer: New York, NY, USA, 2008; Volume 207. [Google Scholar]
  21. Cai, J.; Luo, J.; Wang, S.; Yang, S. Feature selection in machine learning: A new perspective. Neurocomputing 2018, 300, 70–79. [Google Scholar] [CrossRef]
  22. Li, J.; Cheng, K.; Wang, S.; Morstatter, F.; Trevino, R.P.; Tang, J.; Liu, H. Feature selection: A data perspective. ACM Comput. Surv. 2018, 50, 94. [Google Scholar] [CrossRef]
  23. Miao, J.; Niu, L. A survey on feature selection. Procedia Comput. Sci. 2016, 91, 919–926. [Google Scholar] [CrossRef]
  24. Saeys, Y.; Inza, I.; Larrañaga, P. A review of feature selection techniques in bioinformatics. Bioinformatics 2007, 23, 2507–2517. [Google Scholar] [CrossRef]
  25. Shukla, A.K.; Singh, P.; Vardhan, M. A hybrid gene selection method for microarray recognition. Biocybern. Biomed. Eng. 2018, 38, 975–991. [Google Scholar] [CrossRef]
  26. Dashtban, M.; Balafar, M. Gene selection for microarray cancer classification using a new evolutionary method employing artificial intelligence concepts. Genomics 2017, 109, 91–107. [Google Scholar] [CrossRef]
  27. Lu, H.; Chen, J.; Yan, K.; Jin, Q.; Xue, Y.; Gao, Z. A hybrid feature selection algorithm for gene expression data classification. Neurocomputing 2017, 256, 56–62. [Google Scholar] [CrossRef]
  28. McCall, J. Genetic algorithms for modelling and optimisation. J. Comput. Appl. Math. 2005, 184, 205–222. [Google Scholar] [CrossRef]
  29. Kennedy, J.; Eberhart, R. Particle swarm optimization. In Proceedings of the ICNN’95-International Conference on Neural Networks, Perth, WA, Australia, 27 November–1 December 1995; Volume 4, pp. 1942–1948. [Google Scholar]
  30. Geem, Z.W.; Kim, J.H.; Loganathan, G.V. A new heuristic optimization algorithm: Harmony search. Simulation 2001, 76, 60–68. [Google Scholar] [CrossRef]
  31. Dorigo, M.; Maniezzo, V.; Colorni, A. Ant system: Optimization by a colony of cooperating agents. IEEE Trans. Syst. Man Cybern. Part B 1996, 26, 29–41. [Google Scholar] [CrossRef]
  32. Karaboga, D. An Idea Based on Honey Bee Swarm for Numerical Optimization; Technical Report-tr06; Erciyes University, Engineering Faculty, Computer Engineering Department: Kayseri, Turkey, 2005. [Google Scholar]
  33. Yang, X.-S. Firefly algorithms for multimodal optimization. In International Symposium on Stochastic Algorithms; Springer: Berlin/Heidelberg, Germany, 2009; pp. 169–178. [Google Scholar]
  34. Gandomi, A.H.; Yang, X.-S.; Alavi, A.H. Cuckoo search algorithm: A metaheuristic approach to solve structural optimization problems. Eng. Comput. 2013, 29, 17–35. [Google Scholar] [CrossRef]
  35. Rashedi, E.; Nezamabadi-Pour, H.; Saryazdi, S. GSA: A gravitational search algorithm. Inf. Sci. 2009, 179, 2232–2248. [Google Scholar] [CrossRef]
  36. Mirjalili, S.; Mirjalili, S.M.; Lewis, A. Grey wolf optimizer. Adv. Eng. Softw. 2014, 69, 46–61. [Google Scholar] [CrossRef]
  37. Mirjalili, S.; Lewis, A. The whale optimization algorithm. Adv. Eng. Softw. 2016, 95, 51–67. [Google Scholar] [CrossRef]
  38. Rana, N.; Latiff, M.S.A.; Abdulhamid, S.M.; Chiroma, H. Whale optimization algorithm: A systematic review of contemporary applications, modifications and developments. Neural Comput. Appl. 2020, 32, 16245–16277. [Google Scholar] [CrossRef]
  39. Cortes, C.; Vapnik, V. Support-vector networks. Mach. Learn. 1995, 20, 273–297. [Google Scholar] [CrossRef]
  40. Liaw, A.; Wiener, M. Classification and regression by randomForest. R News 2002, 2, 18–22. [Google Scholar]
  41. Cover, T.; Hart, P. Nearest neighbor pattern classification. IEEE Trans. Inf. Theory 1967, 13, 21–27. [Google Scholar] [CrossRef]
  42. Taheri, S.; Mammadov, M. Learning the naive Bayes classifier with optimization models. Int. J. Appl. Math. Comput. Sci. 2013, 23, 787–795. [Google Scholar] [CrossRef]
  43. Kleinbaum, D.G.; Dietz, K.; Gail, M.; Klein, M.; Klein, M. Logistic Regression; Springer: New York, NY, USA, 2002. [Google Scholar]
  44. Ross, T.J. Fuzzy Logic with Engineering Applications; John Wiley & Sons: Hoboken, NJ, USA, 2005. [Google Scholar]
  45. O’Neill, M.C.; Song, L. Neural network analysis of lymphoma microarray data: Prognosis and diagnosis near-perfect. BMC Bioinform. 2003, 4, 13. [Google Scholar]
  46. Kundu, R.; Chattopadhyay, S.; Cuevas, E.; Sarkar, R. AltWOA: Altruistic Whale Optimization Algorithm for feature selection on microarray datasets. Comput. Biol. Med. 2022, 144, 105349. [Google Scholar] [CrossRef]
  47. Tahmouresi, A.; Rashedi, E.; Yaghoobi, M.M.; Rezaei, M. Gene selection using pyramid gravitational search algorithm. PLoS ONE 2022, 17, e0265351. [Google Scholar] [CrossRef]
  48. Hamim, M.; el Moudden, I.; Pant, M.D.; Moutachaouik, H.; Hain, M. A hybrid gene selection strategy based on fisher and ant colony optimization algorithm for breast cancer classification. Int. J. Online Biomed. Eng. (iJOE) 2021, 17, 148–163. [Google Scholar] [CrossRef]
  49. Afif, G.G.; Astuti, W. Cancer Detection based on Microarray Data Classification Using FLNN and Hybrid Feature Selection. J. RESTI (Rekayasa Sist. Dan Teknol. Inf.) 2021, 5, 794–801. [Google Scholar] [CrossRef]
  50. Loey, M.; Jasim, M.W.; El-Bakry, H.M.; Taha, M.H.N.; Khalifa, N.E.M. Breast and colon cancer classification from gene expression profiles using data mining techniques. Symmetry 2020, 12, 408. [Google Scholar]
  51. Han, X.H.; Li, D.A.; Wang, L. A Hybrid Cancer Classification Model Based Recursive Binary Gravitational Search Algorithm in Microarray Data. Procedia Comput. Sci. 2019, 154, 274–282. [Google Scholar] [CrossRef]
  52. Jain, I.; Jain, V.K.; Jain, R. Correlation feature selection based improved-binary particle swarm optimization for gene selection and cancer classification. Appl. Soft Comput. 2018, 62, 203–215. [Google Scholar] [CrossRef]
  53. Shukla, A.K.; Singh, P.; Vardhan, M. A two-stage gene selection method for biomarker discovery from microarray data for cancer classification. Chemom. Intell. Lab. Syst. 2018, 183, 47–58. [Google Scholar] [CrossRef]
  54. Mohapatra, P.; Chakravarty, S.; Dash, P.K. Microarray medical data classification using kernel ridge regression and modified cat swarm optimization based gene selection system. Swarm Evol. Comput. 2016, 28, 144–160. [Google Scholar] [CrossRef]
  55. Shreem, S.S.; Abdullah, S.; Nazri, M.Z.A. Hybrid feature selection algorithm using symmetrical uncertainty and a harmony search algorithm. Int. J. Syst. Sci. 2016, 47, 1312–1329. [Google Scholar] [CrossRef]
  56. Lee, C.-P.; Leu, Y. A novel hybrid feature selection method for microarray data analysis. Appl. Soft Comput. 2011, 11, 208–213. [Google Scholar] [CrossRef]
  57. Alba, E.; Garcia-Nieto, J.; Jourdan, L.; Talbi, E.-G. Gene Selection in Cancer Classification Using PSO/SVM and GA/SVM Hybrid Algorithms. In Proceedings of the 2007 IEEE Congress on Evolutionary Computation, Singapore, 25–28 September 2007; pp. 284–290. [Google Scholar]
  58. Sørlie, T.; Perou, C.M.; Tibshirani, R.; Aas, T.; Geisler, S.; Johnsen, H.; Hastie, T.; Eisen, M.B.; van de Rijn, M.; Jeffrey, S.S.; et al. Gene expression patterns of breast carcinomas distinguish tumor subclasses with clinical implications. Proc. Natl. Acad. Sci. USA 2001, 98, 10869–10874. [Google Scholar] [CrossRef] [PubMed]
  59. Gravier, E.; Pierron, G.; Vincent-Salomon, A.; Gruel, N.; Raynal, V.; Savignoni, A.; De Rycke, Y.; Pierga, J.-Y.; Lucchesi, C.; Reyal, F.; et al. A prognostic DNA signature for T1T2 node-negative breast cancer patients. Genes Chromosom. Cancer 2010, 49, 1125–1134. [Google Scholar] [CrossRef] [PubMed]
  60. Kao, K.-J.; Chang, K.-M.; Hsu, H.-C.; Huang, A.T. Correlation of microarray-based breast cancer molecular subtypes and clinical outcomes: Implications for treatment optimization. BMC Cancer 2011, 11, 143. [Google Scholar] [CrossRef] [PubMed]
  61. Van’T Veer, L.J.; Dai, H.; Van De Vijver, M.J.; He, Y.D.; Hart, A.A.M.; Mao, M.; Peterse, H.L.; Van Der Kooy, K.; Marton, M.J.; Witteveen, A.T.; et al. Gene expression profiling predicts clinical outcome of breast cancer. Nature 2002, 415, 530. [Google Scholar] [CrossRef]
  62. Jinyan, L.; Huiqing, L. Kent Ridge Bio-Medical Data Set Repository; School of Computer Engineering Nanyang Technological University: Nanyang, China, 2002. [Google Scholar]
  63. Alonso-González, C.J.; Moro-Sancho, Q.I.; Simon-Hurtado, A.; Varela-Arrabal, R. Microarray gene expression classification with few genes: Criteria to combine attribute selection and classification methods. Expert Syst. Appl. 2012, 39, 7270–7280. [Google Scholar] [CrossRef]
  64. Zhu, Z.; Ong, Y.-S.; Dash, M. Markov blanket-embedded genetic algorithm for gene selection. Pattern Recognit. 2007, 40, 3236–3248. [Google Scholar] [CrossRef]
  65. Zhu, Z.; Ong, Y.S.; Dash, M. Microarray Datasets in Weka ARFF Format. Pattern Recognit. 2007, 49, 3236–3248. Available online: http://csse.szu.edu.cn/staff/zhuzx/Datasets.html (accessed on 4 May 2021). [CrossRef]
  66. Hedenfalk, I.; Duggan, D.; Chen, Y.; Radmacher, M.; Bittner, M.; Simon, R.; Meltzer, P.; Gusterson, B.; Esteller, M.; Raffeld, M.; et al. Gene-expression profiles in hereditary breast cancer. N. Engl. J. Med. 2001, 344, 539–548. [Google Scholar] [CrossRef]
  67. Chen, A.H.; Yang, C. The improvement of breast cancer prognosis accuracy from integrated gene expression and clinical data. Expert Syst. Appl. 2012, 39, 4785–4795. [Google Scholar] [CrossRef]
  68. Cano, A.; Masegosa, A.; Moral, S. Kent Ridge Bio-Medical Data Repository. 2005. Available online: http://datam.i2r.a-star.edu.sg/datasets/krbd/ (accessed on 24 August 2022).
  69. Abasabadi, S.; Nematzadeh, H.; Motameni, H.; Akbari, E. Hybrid feature selection based on SLI and genetic algorithm for microarray datasets. J. Supercomput. 2022, 1–29. [Google Scholar] [CrossRef]
  70. Kowsari, Y.; Nakhodchi, S.; Gholamiangonabadi, D. Gene selection from microarray expression data: A Multi-objective PSO with adaptive K-nearest neighborhood. arXiv Prepr. 2022, arXiv:2205.15020. [Google Scholar]
  71. Sazzed, S. ANOVA-SRC-BPSO: A Hybrid Filter and Swarm Optimization-Based Method for Gene Selection and Cancer Classification Using Gene Expression Profiles. In Proceedings of the Canadian Conference on AI, Vancouver, BC, Canada, 25–28 May 2021. [Google Scholar]
  72. Zhang, G.; Hou, J.; Wang, J.; Yan, C.; Luo, J. Feature selection for microarray data classification using hybrid information gain and a modified binary krill herd algorithm. Interdiscip. Sci. Comput. Life Sci. 2020, 12, 288–301. [Google Scholar] [CrossRef]
  73. Pragadeesh, C.; Jeyaraj, R.; Siranjeevi, K.; Abishek, R.; Jeyakumar, G. Hybrid feature selection using micro genetic algorithm on microarray gene expression data. J. Intell. Fuzzy Syst. 2019, 36, 2241–2246. [Google Scholar] [CrossRef]
  74. Almugren, N.; Alshamlan, H.M. New Bio-Marker Gene Discovery Algorithms for Cancer Gene Expression Profile. IEEE Access 2019, 7, 136907–136913. [Google Scholar] [CrossRef]
  75. Baliarsingh, S.K.; Vipsita, S.; Muhammad, K.; Dash, B.; Bakshi, S. Analysis of high-dimensional genomic data employing a novel bio-inspired algorithm. Appl. Soft Comput. 2019, 77, 520–532. [Google Scholar] [CrossRef]
  76. Musheer, R.A.; Verma, C.K.; Srivastava, N. Novel machine learning approach for classification of high-dimensional microarray data. Soft Comput. 2019, 23, 13409–13421. [Google Scholar] [CrossRef]
  77. Baliarsingh, S.K.; Vipsita, S.; Dash, B. A new optimal gene selection approach for cancer classification using enhanced Jaya-based forest optimization algorithm. Neural Comput. Appl. 2019, 32, 8599–8616. [Google Scholar] [CrossRef]
  78. Baliarsingh, S.K.; Ding, W.; Vipsita, S.; Bakshi, S. A memetic algorithm using emperor penguin and social engineering optimization for medical data classification. Appl. Soft Comput. 2019, 85, 105773. [Google Scholar] [CrossRef]
  79. Vijay, S.A.A.; GaneshKumar, P. Fuzzy expert system based on a novel hybrid stem cell (HSC) algorithm for classification of micro array data. J. Med. Syst. 2018, 42, 61. [Google Scholar] [CrossRef]
  80. Alshamlan, H.M. Co-ABC: Correlation artificial bee colony algorithm for biomarker gene discovery using gene expression profile. Saudi J. Biol. Sci. 2018, 25, 895–903. [Google Scholar] [CrossRef]
  81. Motieghader, H.; Najafi, A.; Sadeghi, B.; Masoudi-Nejad, A. A hybrid gene selection algorithm for microarray cancer classification using genetic algorithm and learning automata. Inform. Med. Unlocked 2017, 9, 246–254. [Google Scholar] [CrossRef]
  82. Aziz, R.; Verma, C.K.; Srivastava, N. A novel approach for dimension reduction of microarray. Comput. Biol. Chem. 2017, 71, 161–169. [Google Scholar] [CrossRef] [PubMed]
  83. Mohamed, N.S.; Zainudin, S.; Othman, Z.A. Metaheuristic approach for an enhanced mRMR filter method for classification using drug response microarray data. Expert Syst. Appl. 2017, 90, 224–231. [Google Scholar] [CrossRef]
  84. Salem, H.; Attiya, G.; El-Fishawy, N. Classification of human cancer diseases by gene expression profiles. Appl. Soft Comput. 2017, 50, 124–134. [Google Scholar] [CrossRef]
  85. Alshamlan, H.M.; Badr, G.H.; Alohali, Y.A. Genetic Bee Colony (GBC) algorithm: A new gene selection method for microarray cancer classification. Comput. Biol. Chem. 2015, 56, 49–60. [Google Scholar] [CrossRef]
  86. Alshamlan, H.; Badr, G.; Alohali, Y. A Comparative Study of Cancer Classification Methods Using Microarray Gene Expression Profile. In Proceedings of the First International Conference on Advanced Data and Information Engineering (DaEng-2013); Springer: New York, NY, USA, 2014; pp. 389–398. [Google Scholar]
  87. Alshamlan, H.; Badr, G.; Alohali, Y. mRMR-ABC: A hybrid gene selection algorithm for cancer classification using microarray gene expression profiling. Biomed Res. Int. 2015, 2015, 604910. [Google Scholar] [CrossRef]
  88. Chuang, L.-Y.; Yang, C.-H.; Wu, K.-C.; Yang, C.-H. A hybrid feature selection method for DNA microarray data. Comput. Biol. Med. 2011, 41, 228–237. [Google Scholar] [CrossRef]
  89. Sharbaf, F.V.; Mosafer, S.; Moattar, M.H. A hybrid gene selection approach for microarray data classification using cellular learning automata and ant colony optimization. Genomics 2016, 107, 231–238. [Google Scholar] [CrossRef]
  90. Bendtsen, C.; Petrovski, S. How data and AI are helping unlock the secrets of disease. AstraZeneca Blog. 2019. [Google Scholar]
  91. Dong, L.; Hu, S.; Gao, J. Discovering drugs to treat coronavirus disease 2019 (COVID-19). Drug Discov. Ther. 2020, 14, 58–60. [Google Scholar] [CrossRef]
  92. Almugren, N.; Alshamlan, H. A survey on hybrid feature selection methods in microarray gene expression data for cancer classification. IEEE Access 2019, 7, 78533–78548. [Google Scholar] [CrossRef]
Figure 1. Representation of hybrid FS microarray BC classification.
Symmetry 14 01955 g001
Figure 2. Categories of FS methods.
Symmetry 14 01955 g002
Figure 3. Performance of hybrid (filter-wrapper) methods for BC classification.
Symmetry 14 01955 g003
Figure 4. Frequency of use of wrapper-based metaheuristic methods.
Symmetry 14 01955 g004
Figure 5. Frequently used classifiers in BC classification.
Symmetry 14 01955 g005
Table 1. Comparison of FS methods.
Type/
Studies
BenefitsLimitationsStandard SearchExamplePerformance
(1) Filter(a) Independent
(b) Low computational cost
(c) Faster than wrapper
(d) Ignores classifier
(e) Fast computational
time
(a) No interaction with classifier
(b) Computational complexity
(c) Redundant
(d) Ignores useful features
(a) Univariate
(b) Multivariate
Stat test: t-test
IG
Fisher Score
ReliefF
(a) Faster than other FS methods
(b) Degrades feature relevancy
(2) Wrapper(a) Cooperates with classifier
(b) Feature-dependent
(c) Computationally intensive
(d) Has contact with FS and classifier
(a) Risk of overfitting
(b) Classifier-dependent
(c) High computation time
(d) Complex exponential time
(a) Deterministic
(b) Stochastic
AC
Fuzzy Inference
GA
(a) Better than filter approach
(b) High performance
(3) Embedded(a) Combines optimal FS method with classifier
(b) Has contact with classifier
(c) Low risk of overfitting
(a) Classifier dependent on selection method
(b) Predisposed to overfitting
(1) Model classifier preference
(2) Built-in model
(3) Simplified model
SVM-RFE
Lasso
(a) Computational cost less than wrapper
(4) Hybrid or Ensemble(a) Combines more than one FS method.(a) High processing time and complicated(a) Exhaustive search
(b) Optimum FS
LR-RF(a) Complex
(b) Less error
Publisher’s Note: MDPI stays neutral with regard to jurisdictional claims in published maps and institutional affiliations.

