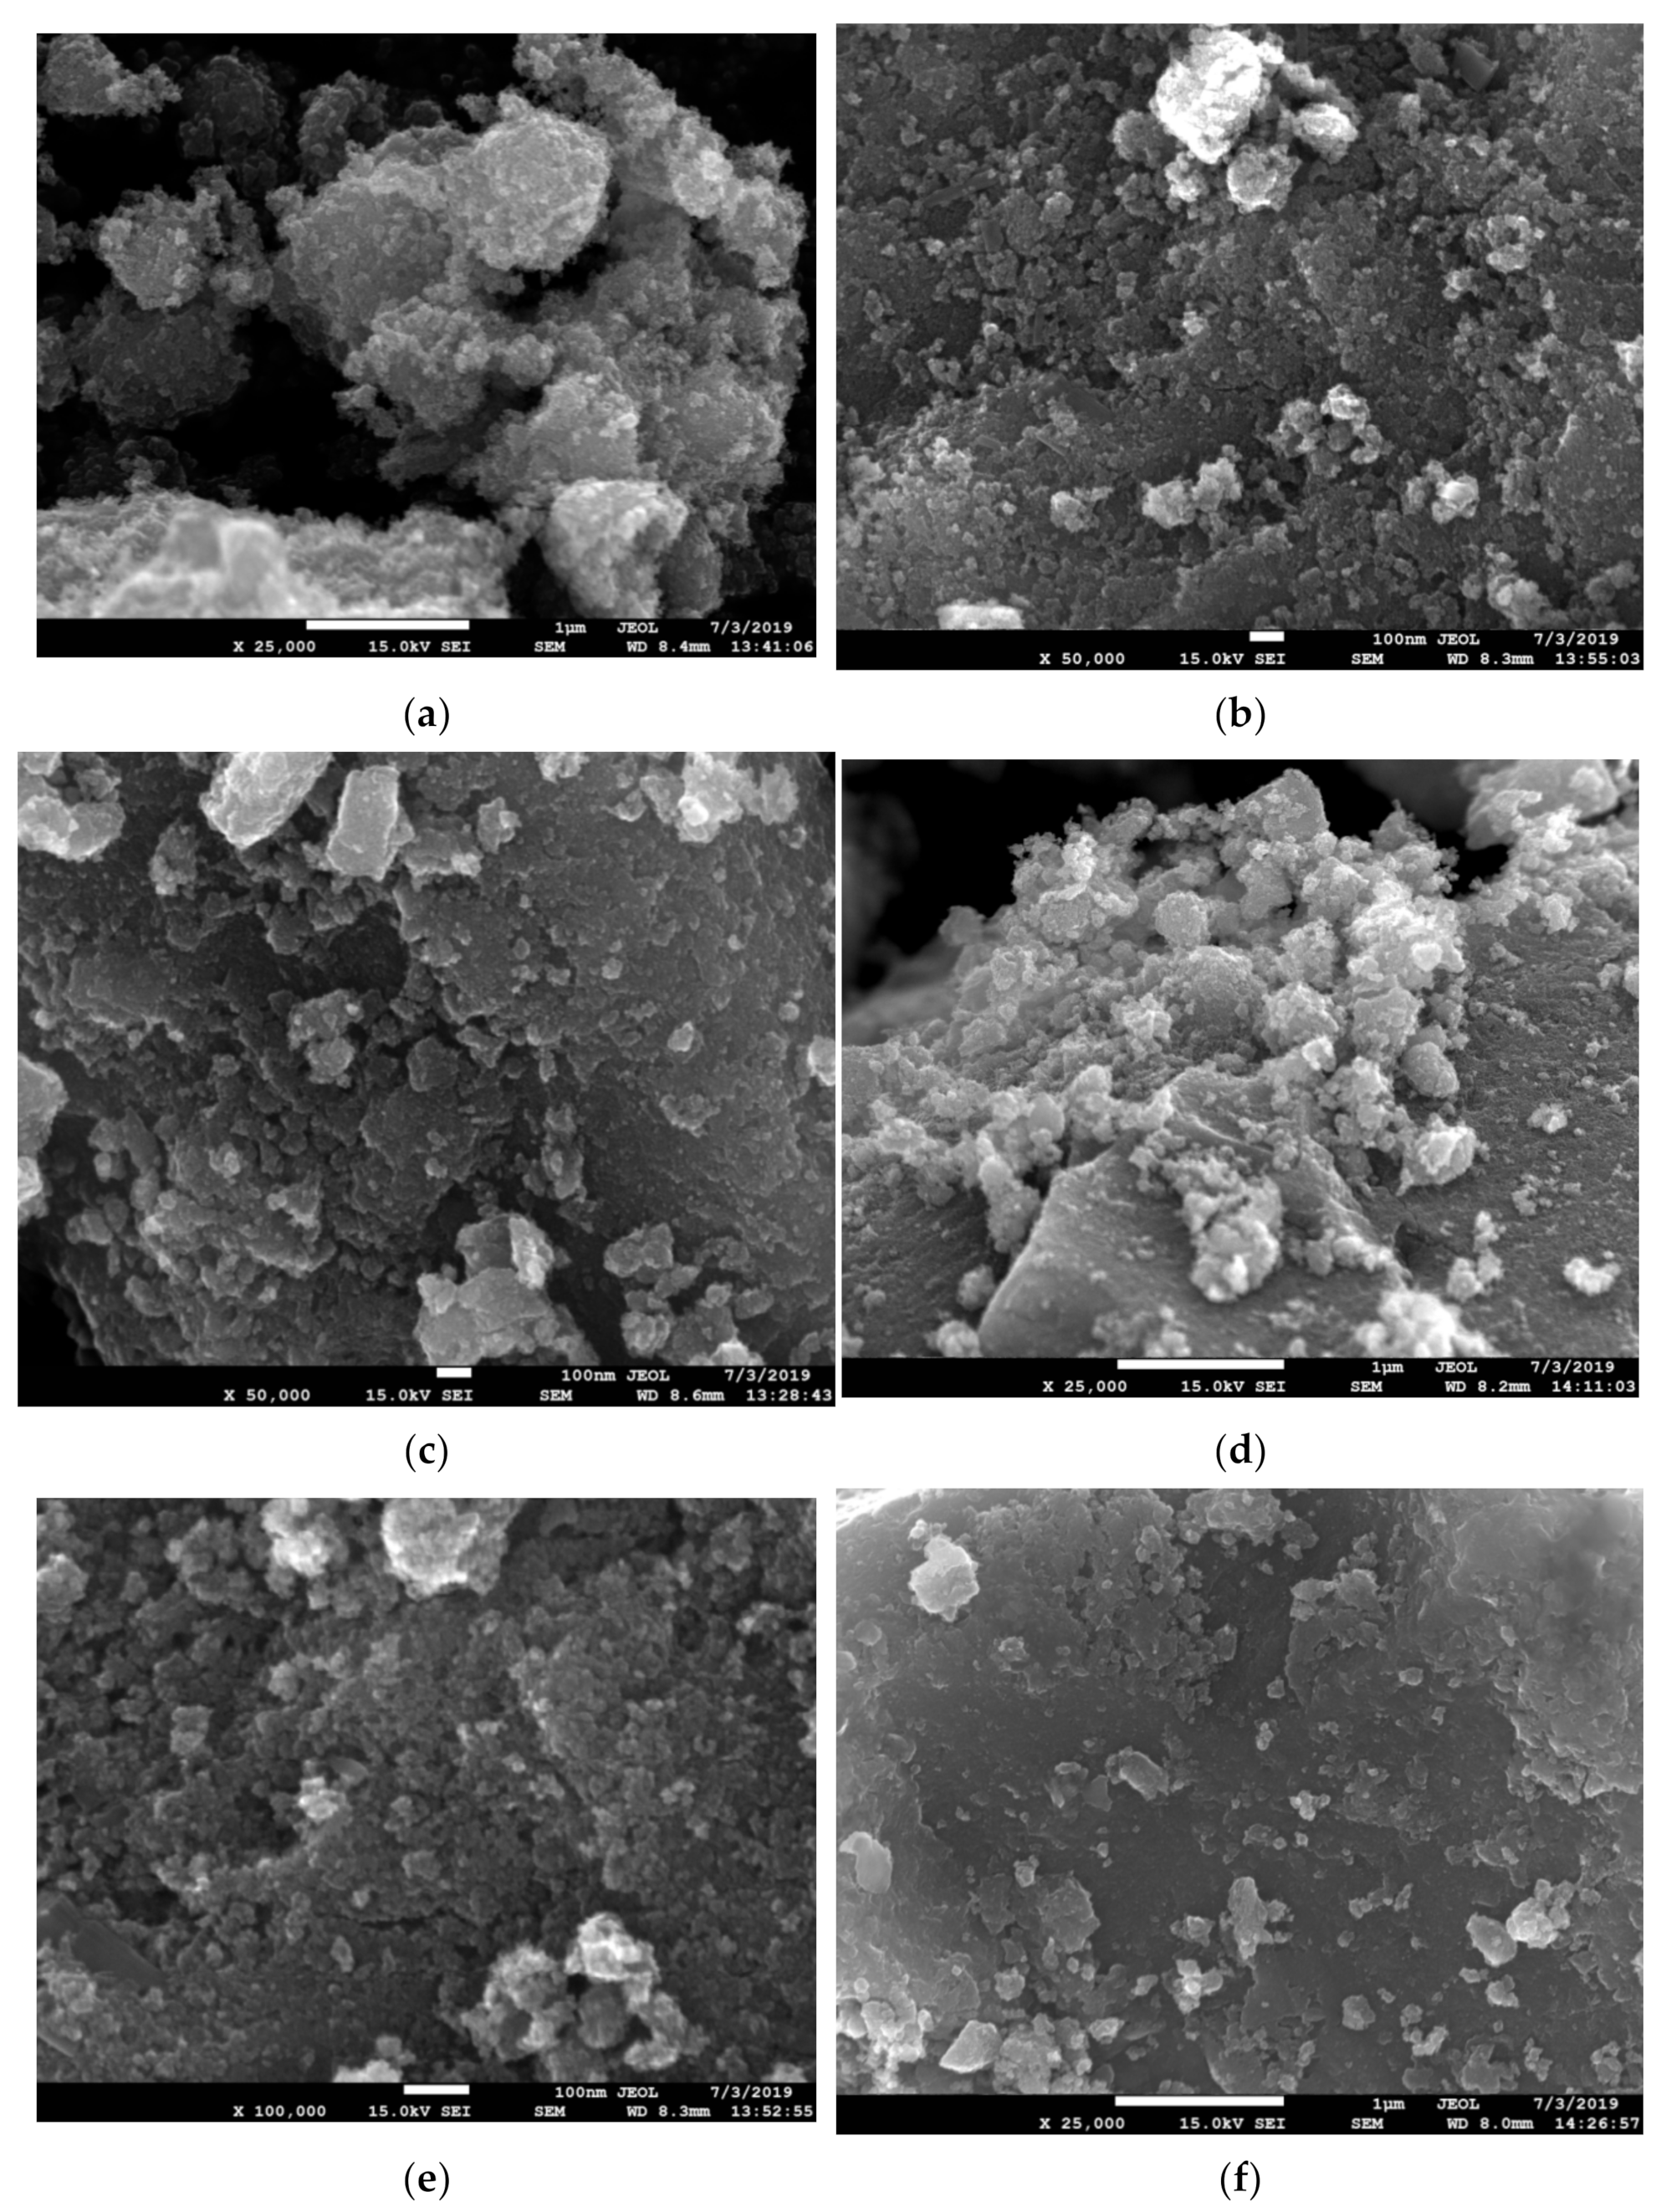
Article

Comparative Study: Catalytic Activity and Rhodamine Dye Luminescence at the Surface of TiO2-Based Nanoheterostructures

by
Elizaveta Konstantinova
1,2,
Vladimir Zaitsev
1,
Artem Marikutsa
3 and
Alexander Ilin
1,*
1
Physics Department, Lomonosov Moscow State University, 119991 Moscow, Russia
2
Faculty of Nano-Bio-Information and Cognitive Technologies, Moscow Institute of Physics and Technology, 141700 Dolgoprudny, Moscow Region, Russia
3
Chemistry Department, Lomonosov Moscow State University, 119991 Moscow, Russia
*
Author to whom correspondence should be addressed.
Symmetry 2021, 13(9), 1758; https://doi.org/10.3390/sym13091758
Submission received: 12 August 2021 / Revised: 12 September 2021 / Accepted: 17 September 2021 / Published: 21 September 2021
(This article belongs to the Special Issue Heterogeneous Catalysis for More Sustainable Symmetry Development)

Abstract

:
Nanoheterostructures based on titanium, molybdenum, tungsten, and vanadium nanooxides with symmetric crystal structures, morphologies and high photocatalytic activity in under illumination by visible light, have been synthesized and studied. Microscopy, optical spectroscopy, and electron-spin resonance techniques were used. The asymmetric separation of photo-generated holes and electrons between different nanooxides in their nanoheterostructures suppresses their recombination. Using the method developed by the authors and based on ESR spectroscopy, the energy levels of the active centers inside the band gaps of the studied samples were found. We have shown, for the first time, that under illumination of nanoheterostructures under asymmetric conditions with adsorbed rhodamine dye at the dye-absorption wavelength (500 nm), photocatalytic reactions are mainly determined by light absorption by the nanostructures themselves, and not by energy transfer from the dye. This important result shows that high photocatalytic activity of materials with symmetric crystal structures is the primary criterion for creating energy-efficient photocatalysts. The results will be useful for the development of energy-efficient catalytic devices based on various combinations of metal nanooxides.

Graphical Abstract

1. Introduction

In the few last decades many researchers have been focused on titanium dioxide, which exhibits unique properties [1,2,3,4,5,6] for gas sensorics [7], solar cells [1], and (most importantly) in the photo catalysis–photo-chemical decomposition of organic impurities (including toxic ones) on the TiO2 surface [8,9,10]. Nanocrystalline titanium dioxide has a very developed, open-to-ambient-molecules surface with an area that varies, depending on the synthesis method, from tens to hundreds of square meters per gram of substance, and the highest photoactivity among all known metal oxides [11,12]. The driving force of photo catalysis (i.e., reduction/oxidation reactions) are radicals efficiently generated by light in TiO2 due to adsorbed water and oxygen molecules’ interaction at the surface with photoexcited charge carriers. The functional characteristics of TiO2 are determined by its physicochemical properties. Titanium dioxide is a wide-gap semiconductor with a band gap from 3.2 to 3.4 eV, and continuous illumination by UV radiation must be used for the generation of reactive electrons and holes [7]. Numerous studies have shown that the doping with ions of metals or nonmetals (e.g., carbon and nitrogen) increases the light absorption coefficient in the visible spectral range, thus affecting the photocatalytic properties of TiO2 [13,14,15,16,17]. Another way to improve photocatalytic efficiency is to increase the lifetime of photoexcited carriers (holes and electrons) by their asymmetric spatial separation inside catalyst heterostructures, thus hampering recombination. In this case, continuous illumination is no longer necessary. To provide these conditions, TiO2 is combined with symmetric semiconductor oxides of vanadium (V2O5), molybdenum (MoO3), and tungsten (WO3) [18,19,20].
In [20] we investigated the morphologies of nitrogen-doped TiO2–based nanoheterostructures and the types of radicals within them, and found a correlation between the rate of photocatalysis and the concentration of radicals in the samples. In the present paper we have obtained nitrogen-doped TiO2–based nanoheterostructures that symmetrically absorb visible light and accumulate photoexcited charge carriers, providing continuation of the catalytic activity of the produced structures for a rather long time after illumination is ceasedm, and, at the same time, we have thoroughly examined the behavior of the prepared nanoheterostructures after the adsorbtion of organic dye molecules on their surface. Organic dye molecules’ adsorption is involved in the standard method for photocatalytic activity measurement. We have shown in the present work that the procedure of photocatalytic activity investigation involving rhodamine dye molecules is reliable and trustworthy. Additionally, we have measured the position of the energy levels of the active centers inside the band gaps of the TiO2–based nanoheterostructures, using ESR spectroscopy to reveal the centers that can absorb light in the visible spectrum.

2. Materials and Methods

Nitrogen-doped nanostructured titanium dioxide and TiO2−MoO3, TiO2−V2O5, TiO2−WO3, TiO2−MoO3−WO3, and TiO2−MoO3−V2O5 nanoheterostructures were prepared by the sol-gel technique. Nanocrystalline nitrogen-doped titanium dioxide with symmetric structure was prepared by controlled hydrolysis through the dropwise addition of 12.5% NH4OH to 2.5-M TiCl4 aqueous solution + 0.65-M HCl cooled to 0 °C with rigorous stirring until pH = 4 was reached. The obtained precipitate was washed with distilled water and dispersed with ultrasound. Next, the gel precipitate was annealed in a furnace at 400 °C for 30 min and at 450 °C for 60 min. To prepare the molybdenum, vanadium, and tungsten nanooxides, the precursors (NH4) 6Mo7O24 (ammonium paramolybdate), NH4VO3 (ammonium metavanadate), and (NH4) 10W12O41 4.5 H2O (ammonium paratungstate) were used. To obtain TiO2−MoO3, TiO2−V2O5, TiO2−WO3, TiO2−MoO3−WO3, and TiO2−MoO3−V2O5 nanoheterostructures, (NH4) 6Mo7O24, NH4VO3, or (NH4)10W12O41 4.5 H2O were dissolved in a mixture of hydrochloric acid and hydrogen peroxide, blended with a doped TiO2 precipitate, and then dried and annealed at 400 °C for 60 min.
Scanning electron microscope JSM7600F (JEOL, Japan) and DRON-4 diffractometer (Burevestnik, Russia) (CuKα radiation) were used to study the structure of the samples. The Scherrer formula was used to determine coherent-scattering-domain sizes (particle sizes) from the full width, at half-maximum of the peaks, and at an instrumental broadening of 0.09°. The BET methodof low-temperature nitrogen adsorption was used to determine the specific surface area, (Chemisorb 2750 instrument, Micromeritics). Diffuse reflection and fluorescence spectra were recorded using an LS-55 Perkin Elmer spectrometer (with spectral range 200–900 nm). The oxidizing power (photocatalytic activity) of the samples was investigated with the reaction of rhodamine dye photodegradation. The dye was applied to the sample surface from aqueous and ethanol solutions. The solvent was dried off carefully. A YG-16 glass filter was used to obtain the illumination in the visible spectral range (from 450 to 750 nm) for the photocatalysis study. Changes in the surface concentration of the dye were monitored according to the diffuse reflectance R value, at a wavelength of the maximum light absorption by the adsorbed dye. The diffuse reflectance was recalculated to the dye molecules surface concentration using Kubelka–Munk approach [21]. The electron spin resonance (ESR) spectrometer (ELEXSYS-E500, Bruker, Germany) was used for the study of radical properties in the prepared samples.

3. Results

Micrographs of TiO2-based nanoheterostructures are shown at Figure 1. The figure shows that, in general, the micrographs of different samples have a certain similarity: all the studied structures are nanoparticles grouped into agglomerates of an asymmetric form.
The size of the nanoparticles and their specific surface area were determined from X-ray diffraction (XRD) and low-temperature nitrogen adsorption (BET) data, respectively. The results of these measurements for TiO2 nanoparticles are presented as an example in Table 1.
We have carefully investigated, in another work [20], photocatalysis on the structures prepared by the same method as that used in the present work. The highest rate of photocatalysis in the visible spectral region was observed in the TiO2−MoO3−V2O5 and TiO2−MoO3−WO3 nanoheterostructures. As it was revealed in [
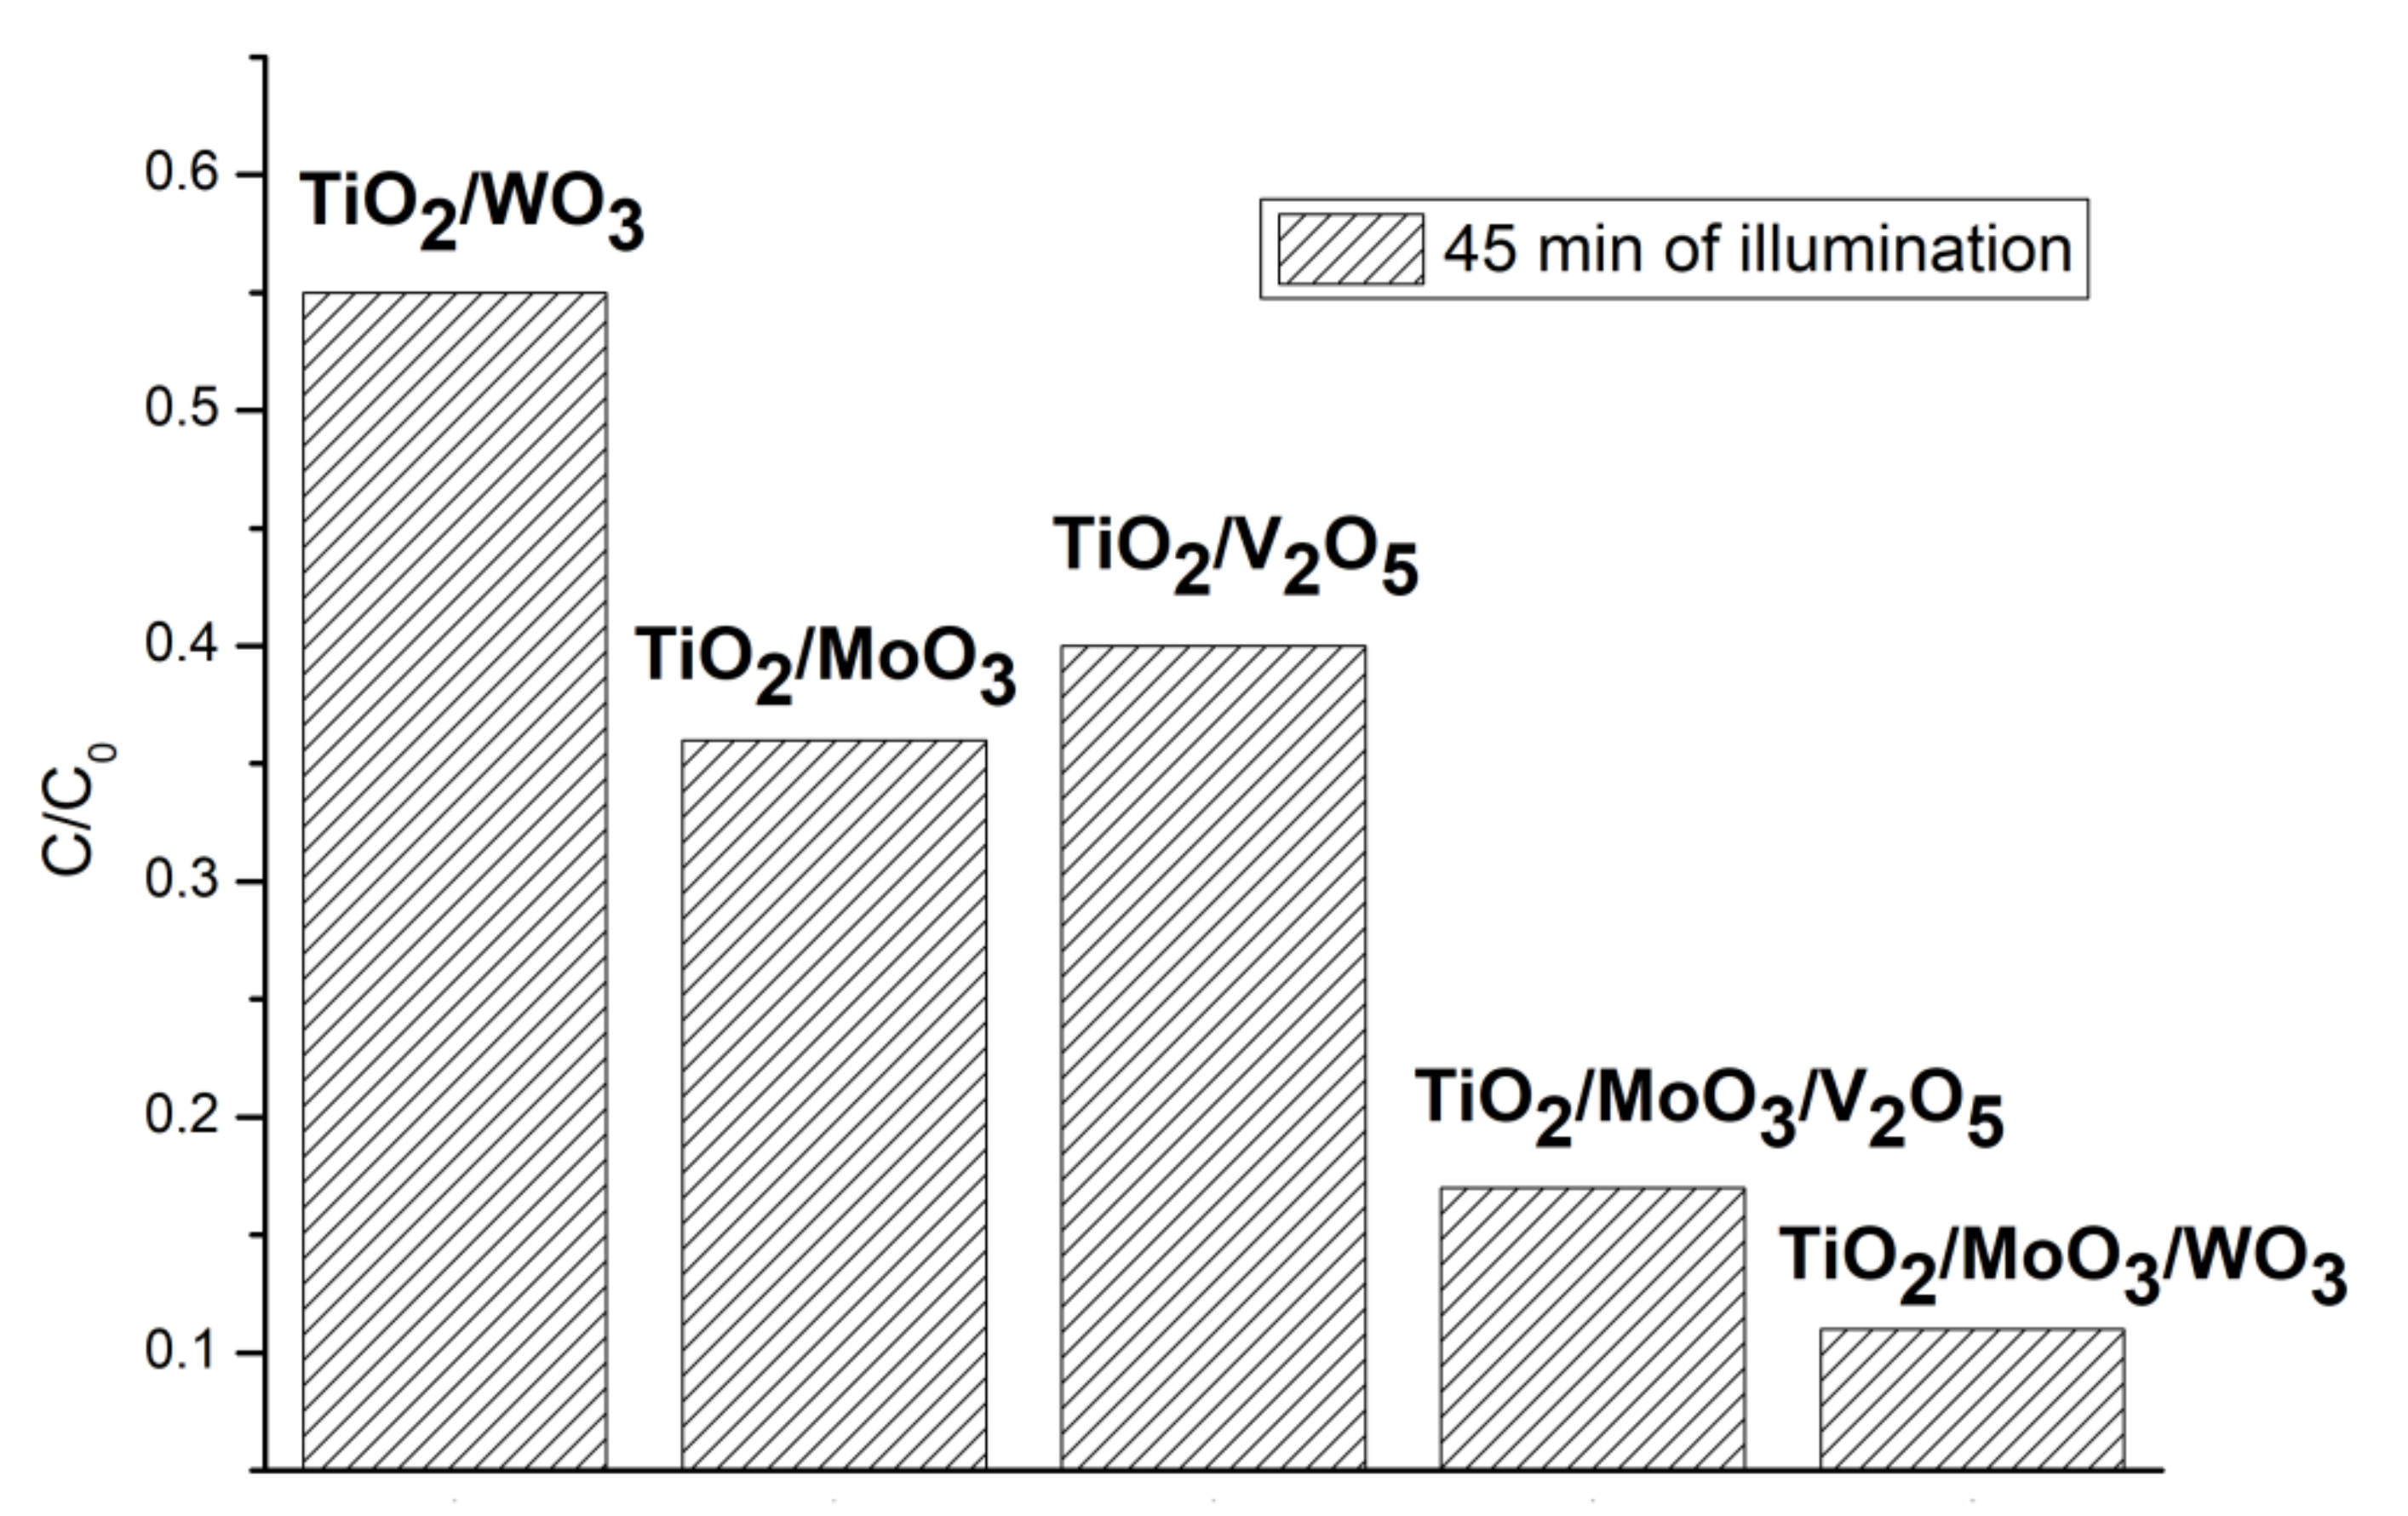
20], this is due to the higher concentrations of radicals in these structures. After the morphology and structure studies, we repeated part of the photocatalysis measurements with a new batch of samples in the current study. The brief results of the photocatalytic activity of the new samples are presented at Figure 2. The lower is the residual dye concentration C/C0 after the sample exposition to the visible light – the higher is the sample photocatalytic activity. Our new results are very consistent with our previous findings, which allows us to declare a good replicability of the synthesis method and material properties.
Kinetic curves of photocatalysis for MoO3 and TiO2 nanooxides, as well as for nanoheterostructures TiO2−WO3, TiO2−MoO3, TiO2−MoO3−V2O5, and TiO2−MoO3−WO3 under photoexcitation in the visible spectral region (450–750 nm) are shown in Figure S2 of our Supplementary Materials. We have found that, because of asymmetric charge separation in nanoheterostructures, catalysis lasts on their surface long after light is extinguished.
Since defects at the semiconductors’ surface actively interacts with photoexcited charge carriers, we studied the prepared samples by the ESR method. ESR spectra of the previous batch of nanoheterostructures, TiO2−MoO3−V2O5, TiO2−MoO3−WO3, TiO2−WO3, TiO2−V2O5, TiO2−MoO3, and their analyses can be found in Figure S1 of our Supplementary Material.
In the investigated samples, an anticorrelation was found between the residual concentration (after photocatalysis) of the test dye and the concentration of radicals in the nanoheterostructures. Another correlation was found between light absorption in the visible region, the concentration of radicals and the photocatalytic activity [20].
To determine the position of the radicals’ energy levels in the band gaps of the used samples, we have applied our original method, developed earlier, which is based on ESR spectroscopy [12]. The dependence of the ESR signal intensity on the photon energy () was measured when the samples were illuminated directly in the cavity of the spectrometer. A BRUKER ELEXSYS ER 202 UV high-pressure mercury lamp (∆λ = 270 − 1000 nm, 50 W power), equipped with the diffraction monochromator, was used for this purpose. The light intensity was approximately 40 mW cm−2.
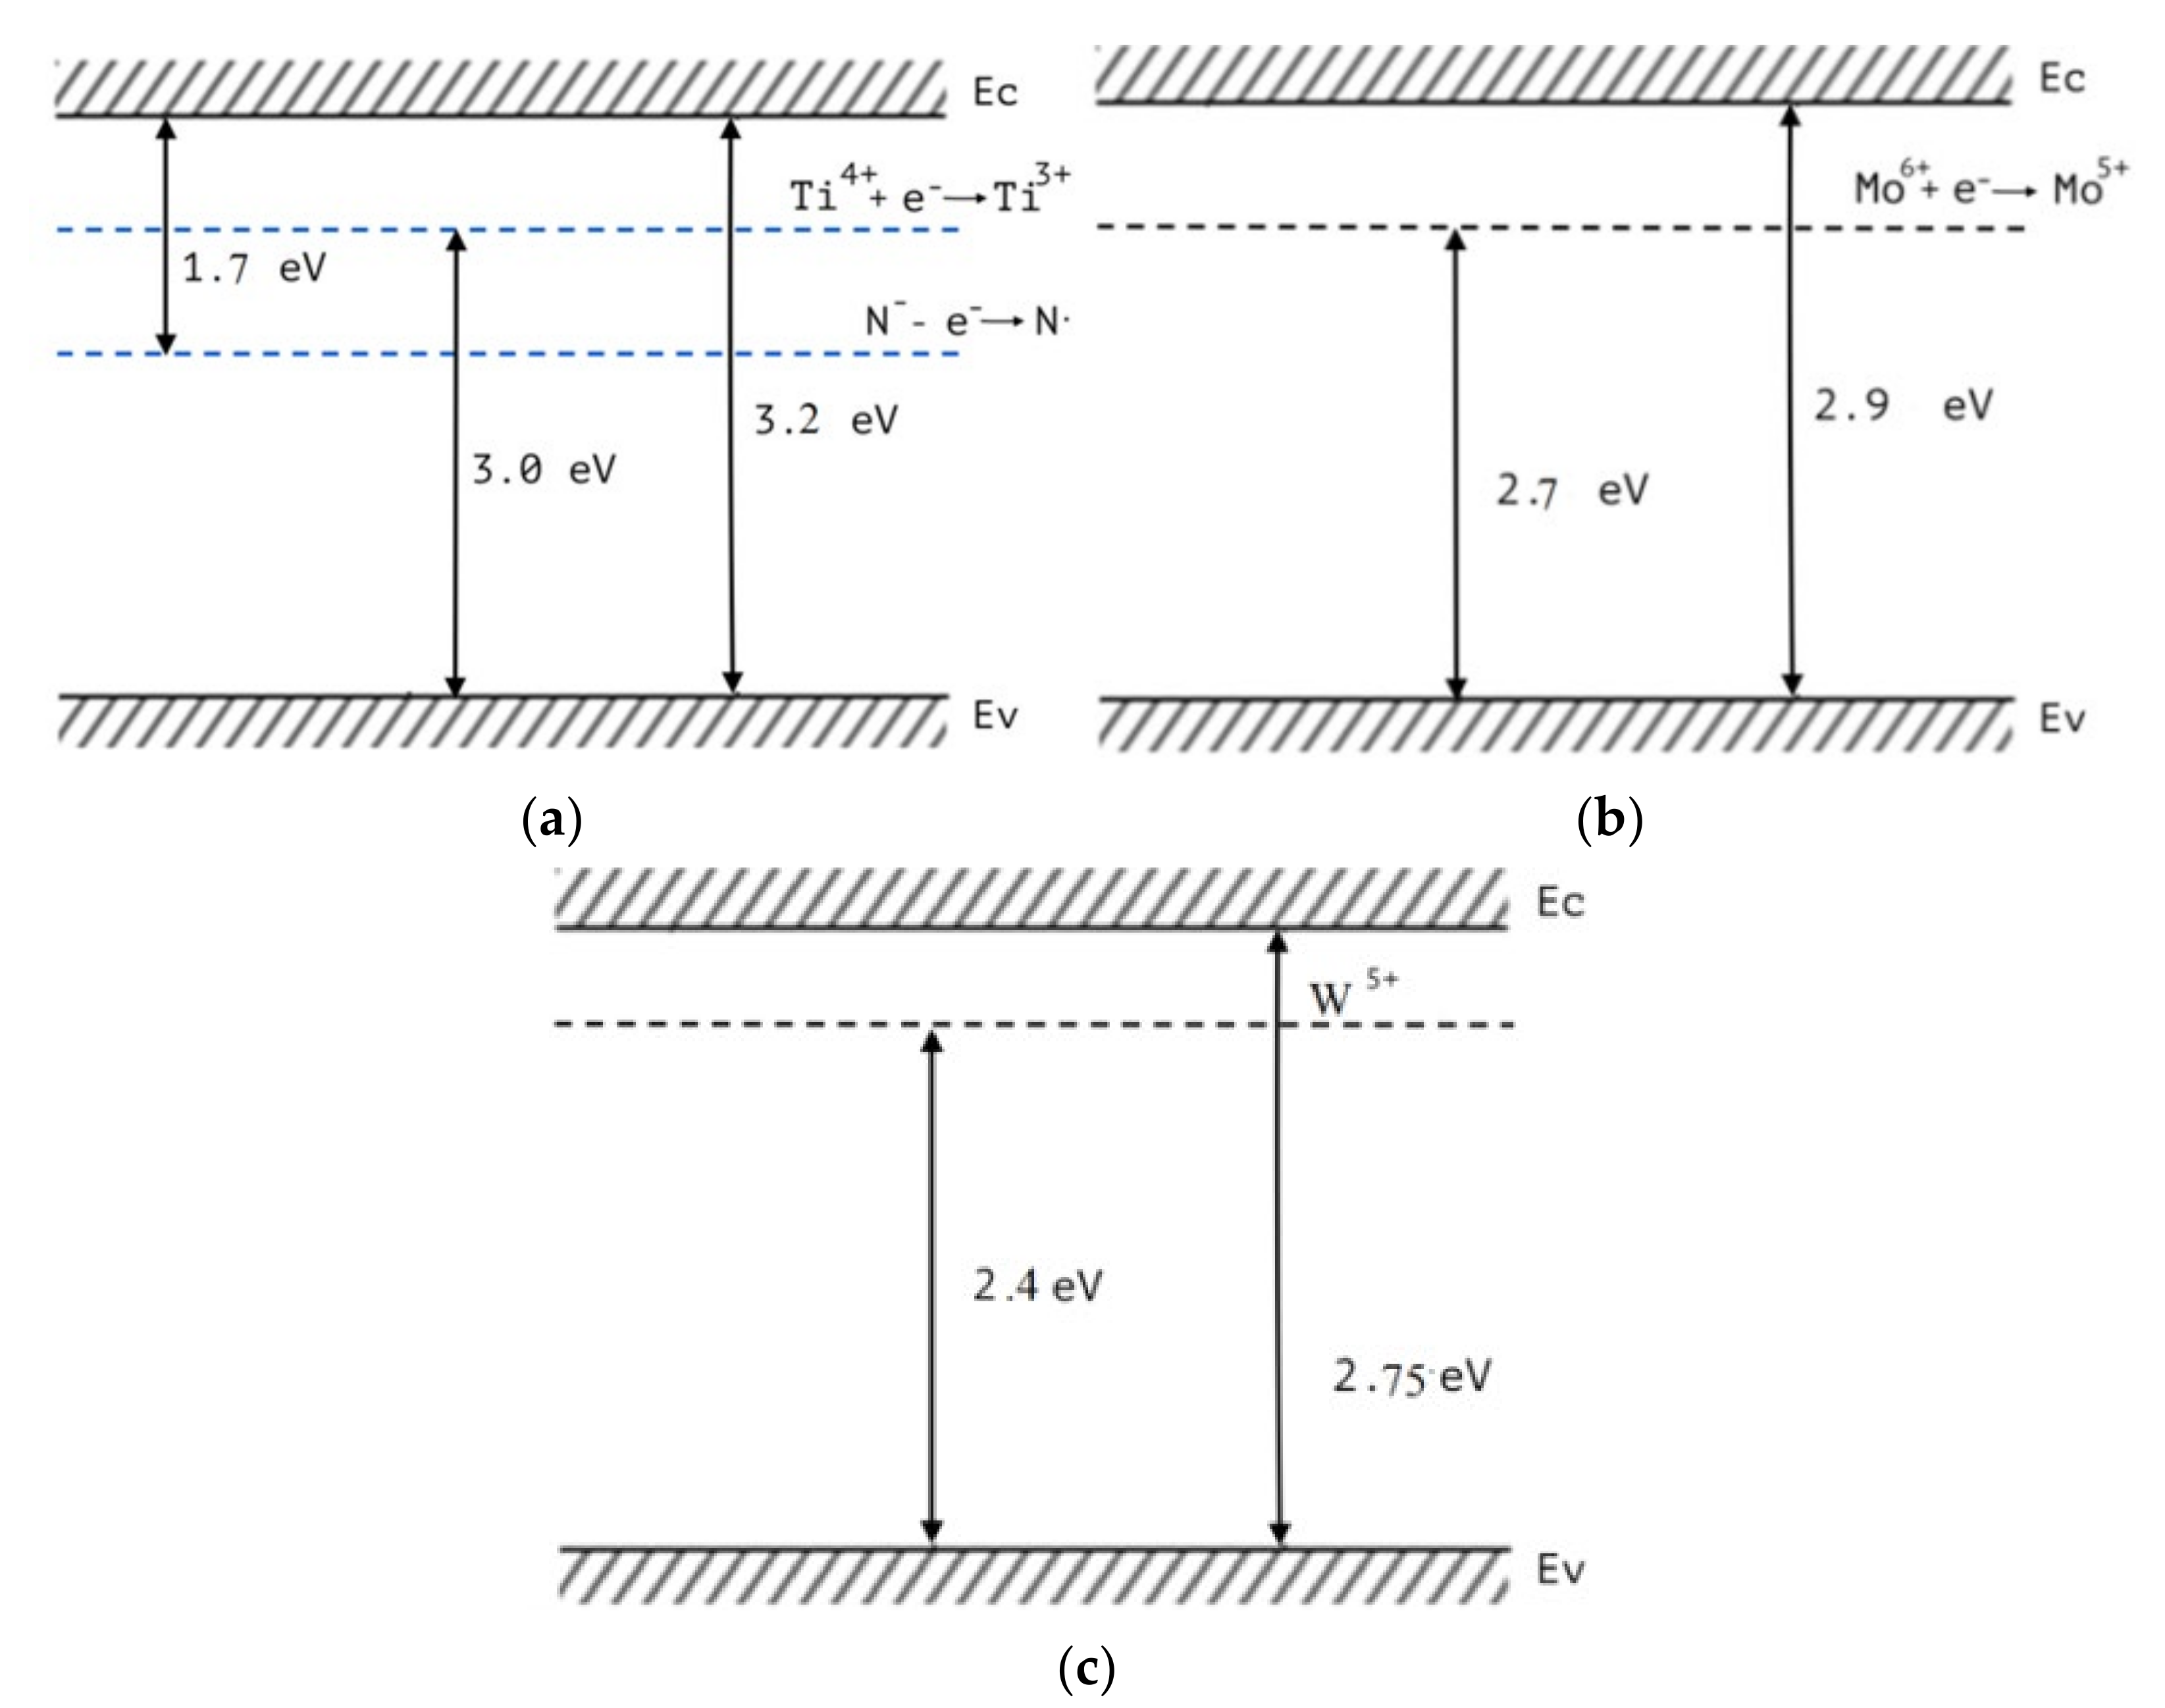
The study was performed for the nanoheterostructures TiO2−MoO3, TiO2−WO3, TiO2−V2O5, TiO2−MoO3−WO3, TiO2−MoO3−V2O5. The change in the magnitude of the ESR signal of their radicals occurs when a certain energy of the incident photons is reached (specific for each type of radical). It is a very important observation, meaning that, under illumination, defects absorb light and defect recharging occurs. We have found that the increase of the ESR signal in TiO2, for nitrogen radicals, occurs at the photon energy ℎν ≥ 1.5 eV, i.e., starting from this energy, the electron moves from the radical level to the TiO2 conduction band as a result of light absorption by the dopant. This allows us to estimate the position of this defect level in the band gap of TiO2, as separated from the bottom of the conduction band by a value of 1.5 eV. When illumination was used with the quanta energy ℎν ≥ 3.0 eV an increase in the ESR signal was observed for Ti3+ centers that can be explained by the transition of an electron from the valence band to the initially nonparamagnetic centers of the Ti4+/oxygen vacancy, which form electron states in the band gap near the bottom of the TiO2 conduction band and are known from literature as «Urbach tails».
In the same way, the observed increase in the ESR signal intensity for the Mo5+ centers in MoO3 under ℎν ≥ 2.6 eV illumination can be attributed to the transition of electrons from the valence band of molybdenum oxide to the originally nonparamagnetic Mo6+ centers, which also form electron states near the bottom of the conduction band of MoO3. The ESR signal, increasing for V4+ centers in V2O5 under illumination by ℎν ≥ 2.1 eV, in turn can be explained by electrons’ transition from the valence band of V2O5 to the initially nonparamagnetic electron states V5+, localized near the V2O5 conduction band’s bottom. Thus, it is possible to construct band diagrams for the nanooxides that make up the studied nanoheterostructures (Figure 3).
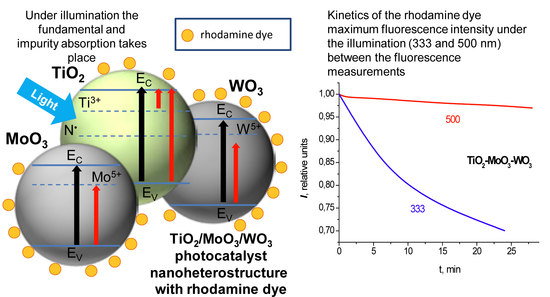
In this study, as in previous studies, the photocatalytic activity (oxidative capacity) of the nanocatalyst samples was investigated using the photodegradation reaction of the rhodamine dye (as it is described in the Materials and Methods section). To do this, the dye was applied to the surface of the samples from the solution. Measurements were conducted after the samples’ drying. The symmetric possibility of transferring the photoexcitation energy from the adsorbed dye molecules to the semiconductor was not taken into account during our previous studies. We have carefully studied the possibility of energy transfer in the other structures, and it is also known from the literature ([22,23] for example). This energy transfer can lead to the formation of additional free charge carriers. These additional charge carriers may in turn increase photocatalytic efficiency and affect the rhodamine dye’s degradation rate. In this way, the photosensitization of semiconductor oxides by dye molecules would promote these dye molecules’ faster degradation.
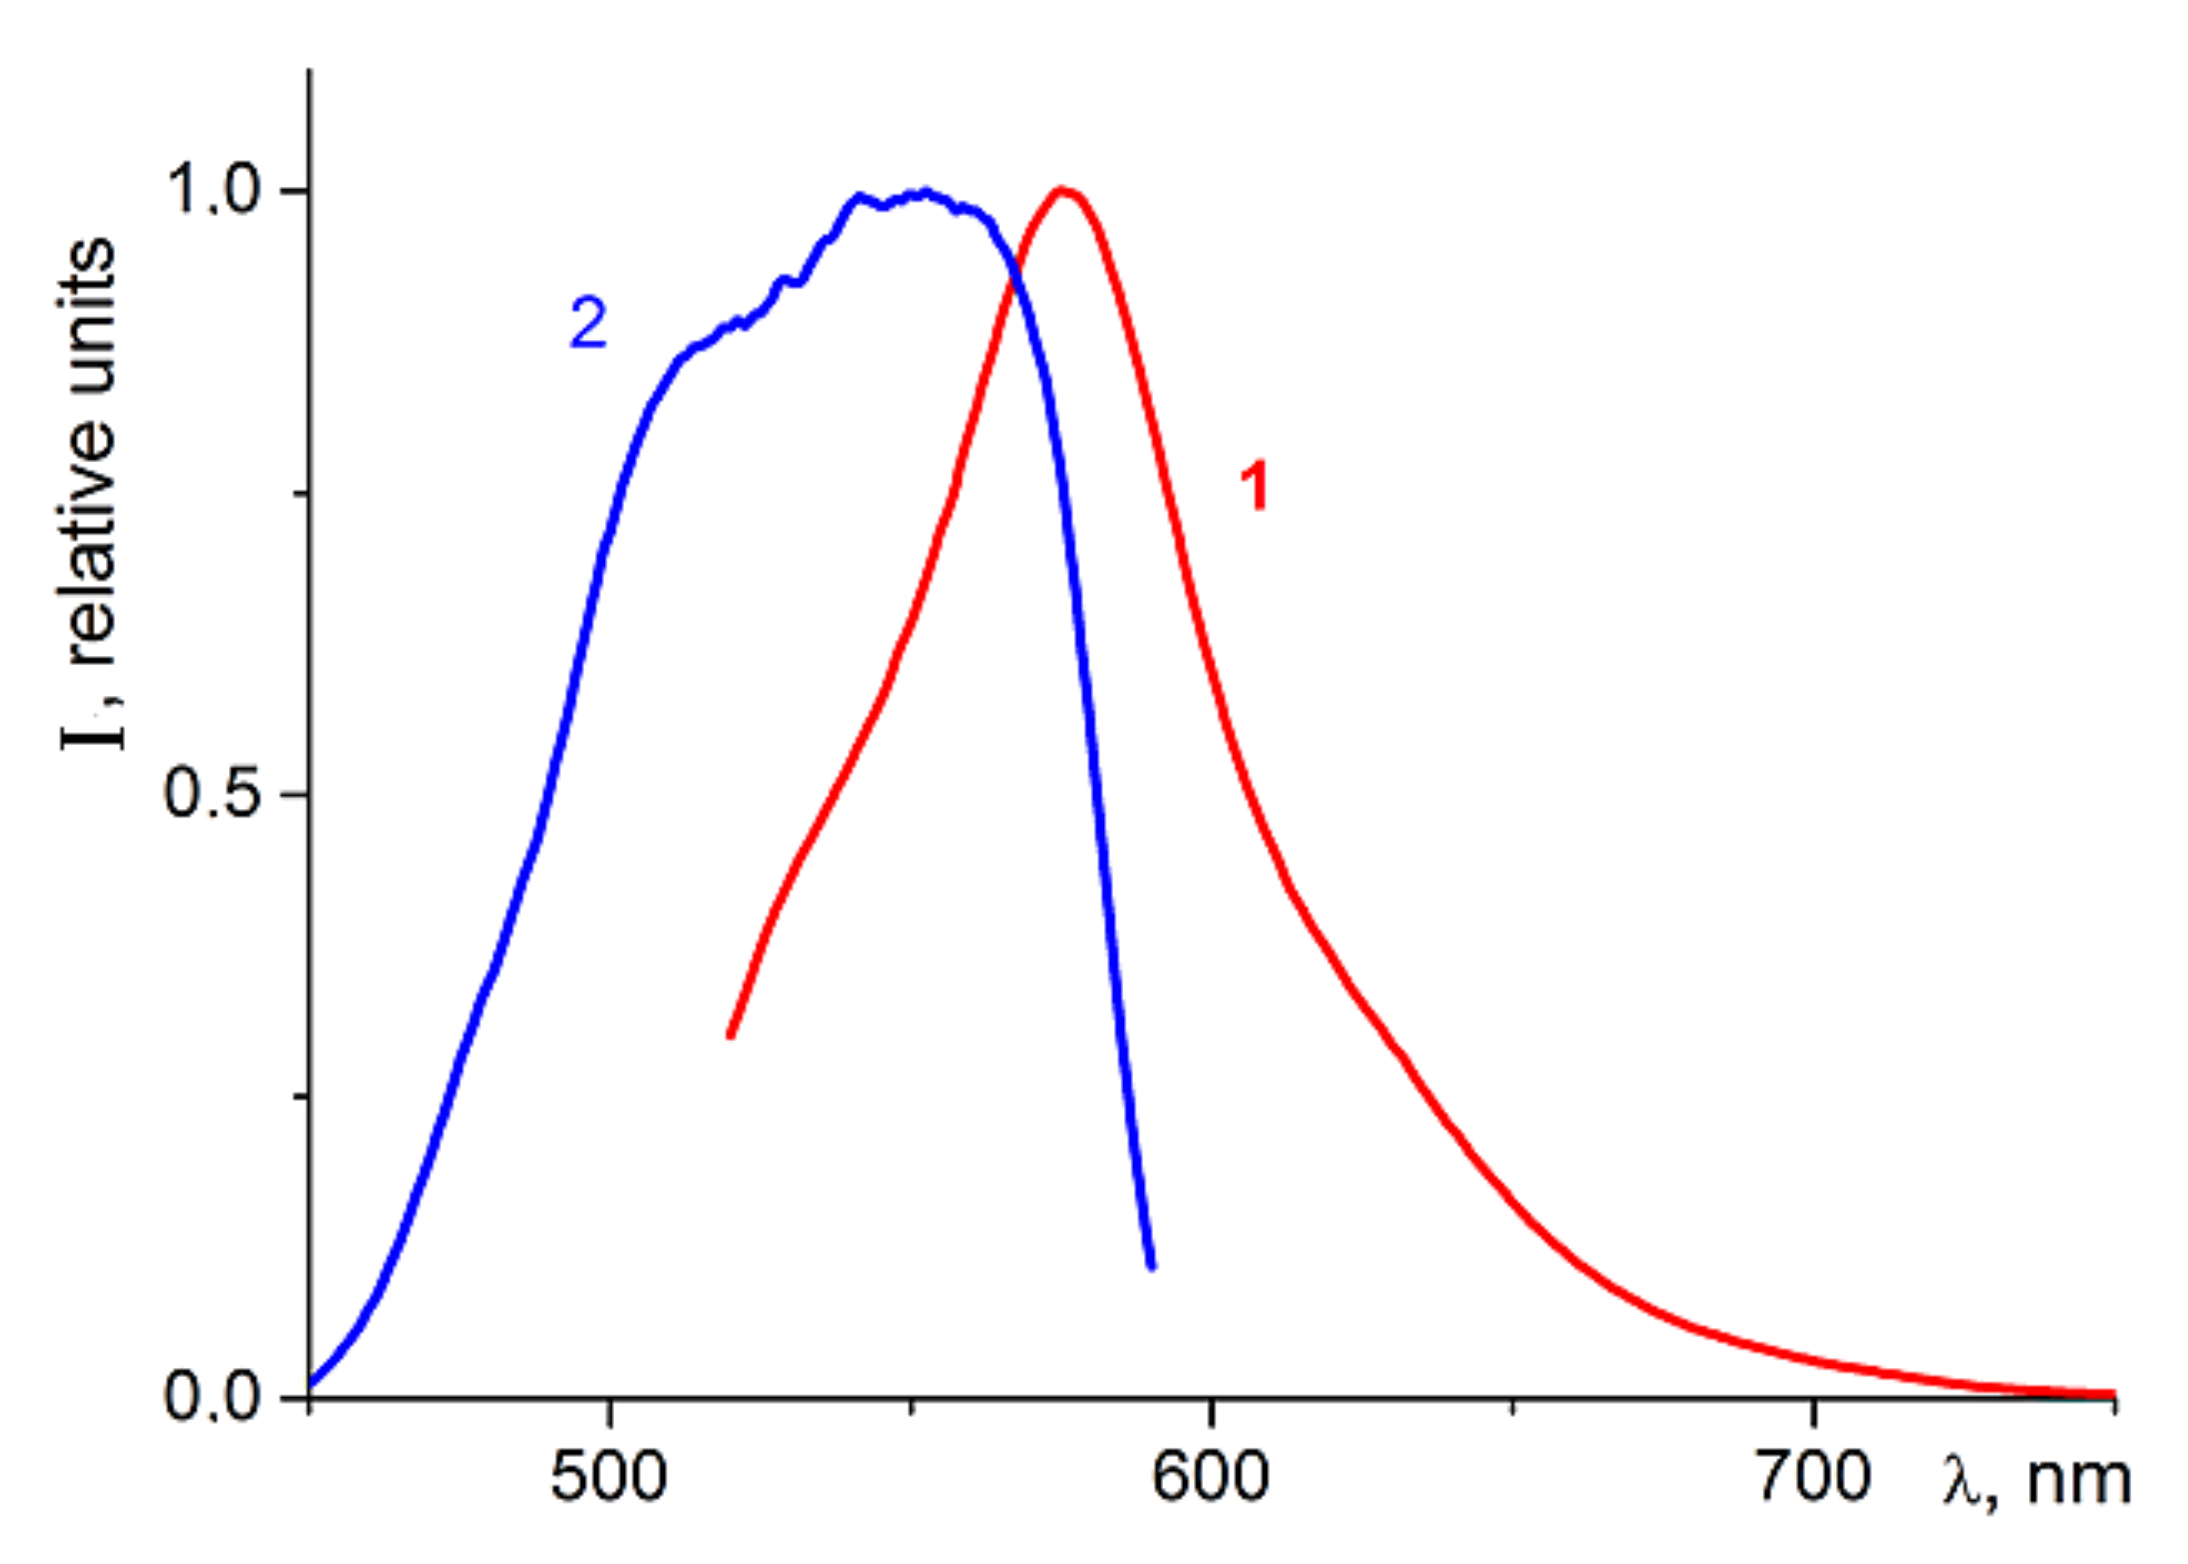
Therefore, in the present work we conducted a special study of the energy transfer efficiency from adsorbed rhodamine-type dye molecules to charge carriers trapped in semiconductor nanoheterostructures possessing photocatalytic activity. For this study, rhodamine dye was adsorbed onto the surface of the photocatalysts’ surface at a concentration providing maximal fluorescence intensity. The fluorescence spectra of the rhodamine dye adsorbed on the TO2 surface are shown at Figure 4.
It can be seen from the fluorescence excitation spectrum that the effective excitation of rhodamine molecules does not occur when illuminated at wavelengths shorter than 450 nm.
The remaining research cycle was carried out as follows. For each type of the samples, two series of measurements of the time-intensity dependence I(t) at the fluorescence maximum were performed. The first series of measurements was carried out when the sample was illuminated (between the registrations of the spectra) by radiation at a 333-nm wavelength, outside the effective absorption band of the dye, but in the absorption band of the photocatalysts. The second series was carried out with constant illumination inside the dye absorption band at a 500-nm wavelength. The fluorescence spectra of the dye were always recorded with excitation at a 500-nm wavelength.
Let us first compare the efficiency of photocatalysis, obtained in symmetric conditions, by measuring the quenching of the dye’s fluorescence on different nanoheterostructures when illuminated at the same 333-nm wavelength.
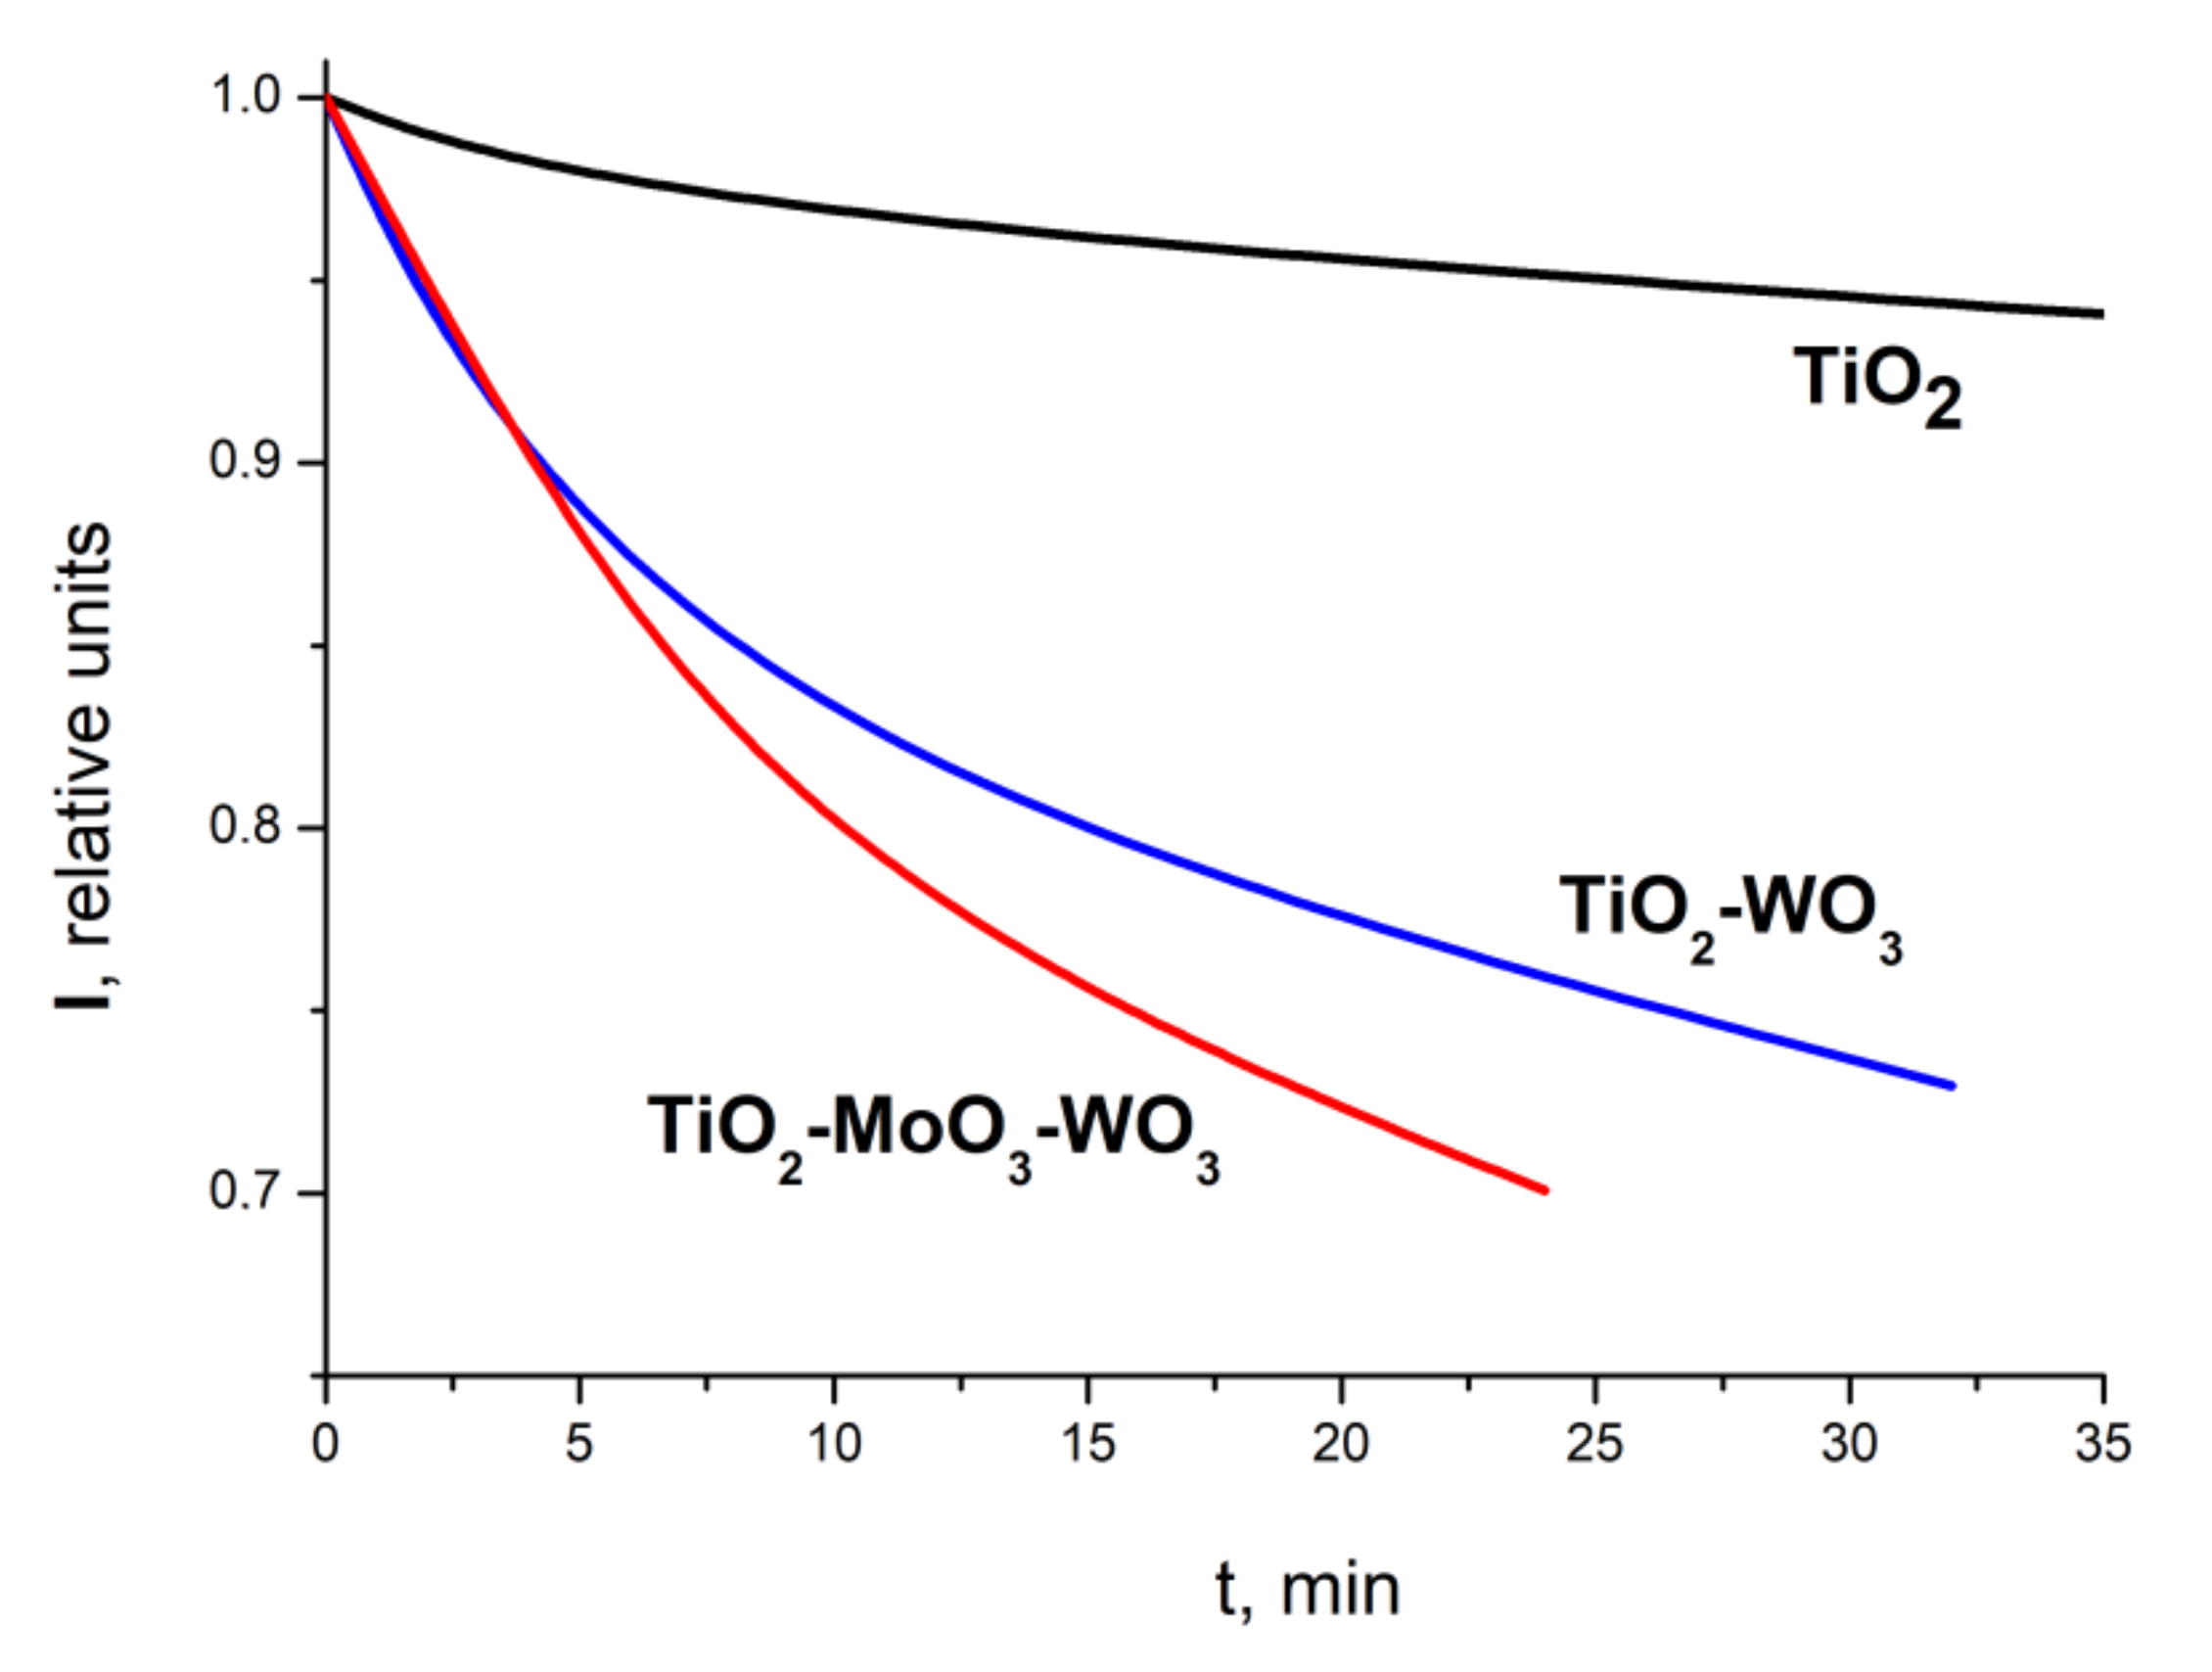
The time dependencies of the maximum fluorescence intensity of rhodamine dye molecules adsorbed at the photocatalysts surface are shown at Figure 5. The curves reflect the time dependence of the fluorescence intensity of the adsorbed dye when the structures were illuminated at a 333-nm wavelength between short runs of fluorescence measurements. The graphs show that the luminescence-quenching rate of TiO2–MoO3–WO3 exceeds the result for TiO2–WO3 and very significantly exceeds the quenching rate obtained for TiO2. This corresponds to our data (obtained by an independent method) on the rate of photocatalysis on these structures. Thus, it becomes clear that both methods are symmetric and it is possible to estimate the rate of photocatalysis by quenching the luminescence of adsorbed organic dyes.
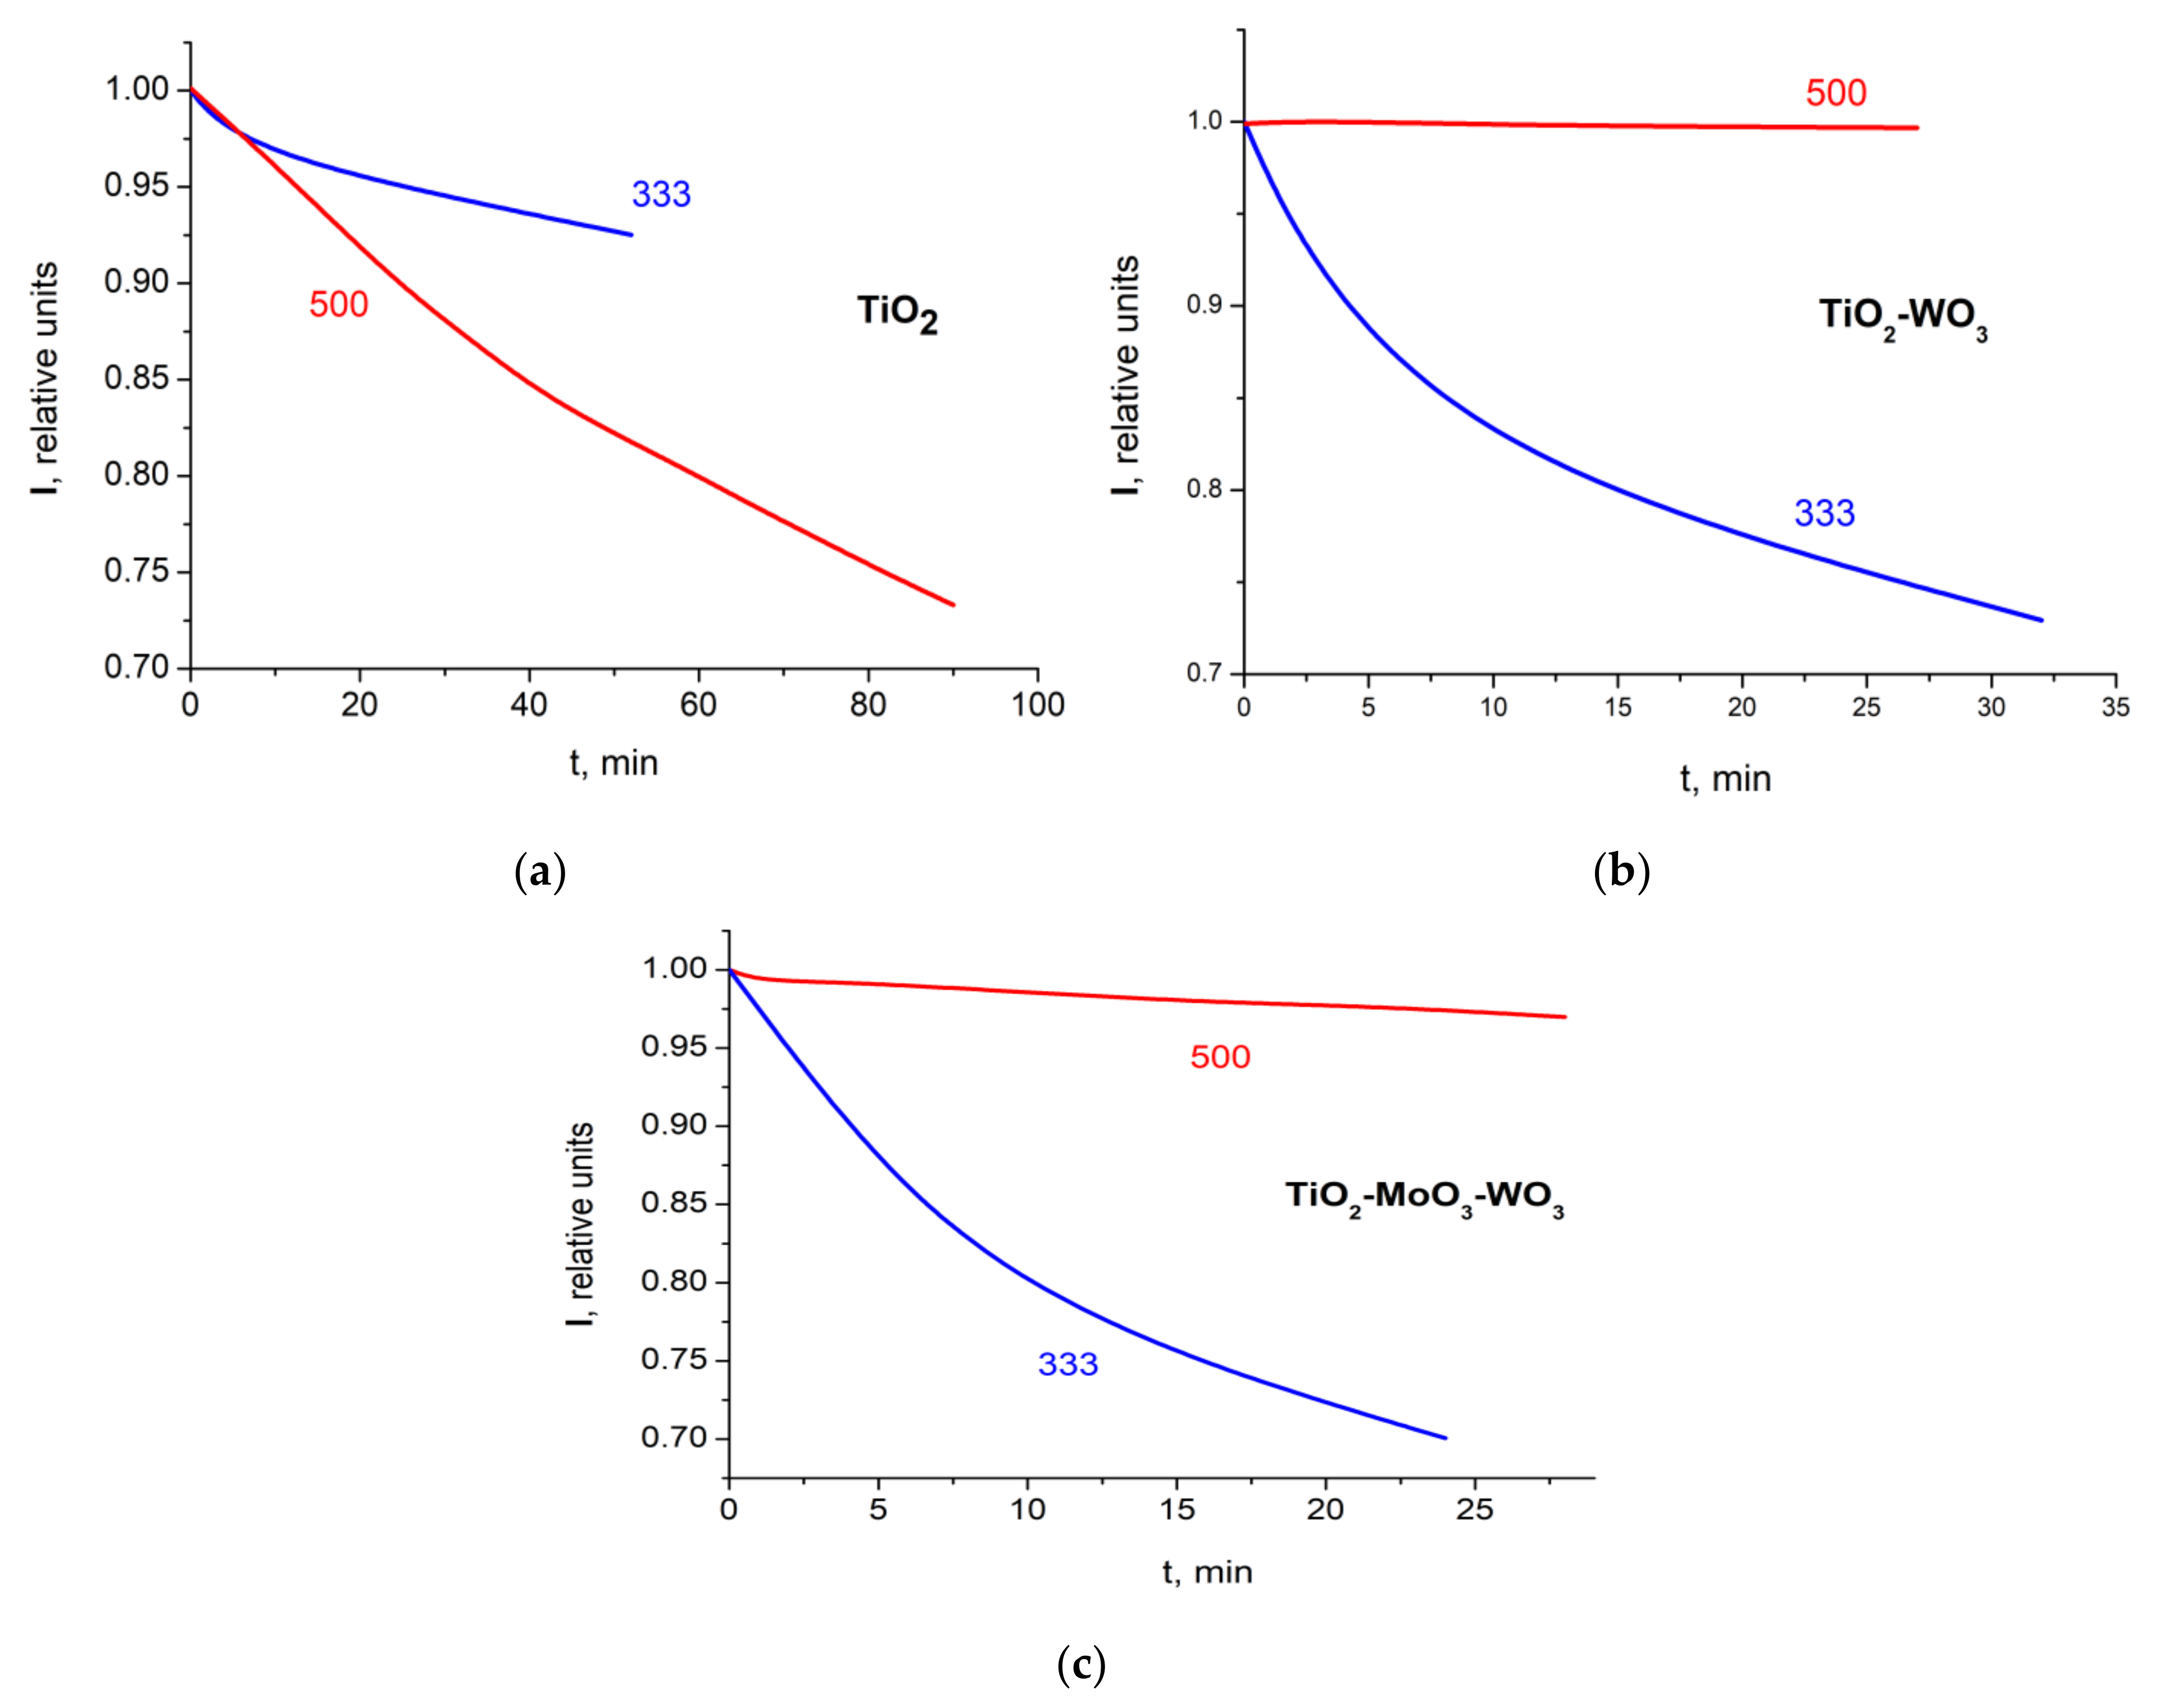
Let us now compare the symmetric photocatalysis results obtained by illumination at two different wavelengths. The results for TiO2 are shown in Figure 6a. As it is known, rhodamine dye is able to transfer photoexcitation energy to a semiconductor, leading to the release of charge carriers from the traps to the conduction band [22,23]. Probably, this process is very effective in the TiO2–rhodamine system.
As a result, despite the relatively low illumination intensity, the photocatalytic destruction of the dye molecules leads to a noticeable quenching of the fluorescence over time. The efficiency of the process for TiO2 is asymmetric; under illumination in the dye absorption band it is significantly higher than that under ultraviolet illumination.
The Figure 6b shows that green light illumination (500 nm) in the dye-absorption band practically does not lead to degradation of rhodamine molecules adsorbed on nanoheterostructures TiO2–WO3, while ultraviolet illumination leads to a fairly rapid degradation of the dye. It should be noted that the initial fluorescence intensity of rhodamine on the surface of TiO2–WO3 structures was 5–7 times lower than on TiO2, despite their same dye concentrations. Such a significant quenching (right after the dye deposition) of luminescence most likely indicates a noticeable energy transfer from the dye to the semiconductor. However, this does not lead to additional degradation of the dye over time when the structure is illuminated at the wavelength of 500 nm.
The time dependencies of the fluorescence intensity of rhodamine dye on the TiO2–MoO3–WO3 surface, under illumination at 500-nm and 333-nm wavelengths, are shown in Figure 6c. The initial fluorescence intensity of rhodamine dye on the surface of these structures was 5–7 times lower than that on the TiO2 surface, the same as in the previous case. When the structure was illuminated at a 500-nm wavelength, the degradation of the dye fluorescence was observed to be approximately twice slower than on the TiO2 surface—and, when illuminated at the wavelength of 333 nm, the rate of the dye degradation was quite high.
The initial fluorescence intensity of rhodamine at the surface of TiO2–MoO3 samples was approximately 20 times lower than that for the TiO2 surface, and it practically did not change during irradiation at the wavelengths of 500 and 333 nm. At the same time, the dye fluorescence maximum was shifted by 10 nm to the short-wave region, as compared with the rest of the samples. This may indicate a strong bonding between the dye molecules and the substrate for TiO2–MoO3 structures. The similar significant shift in the emission spectrum of rhodamine molecules is usually observed in the presence of strong local electric fields of negatively charged particles near the adsorbed molecules [24]. It is possible that the observed luminescence of the dye is associated with those of its molecules that were adsorbed far from the active centers on the surface of the catalyst, and that those dye molecules that were located close to the active centers experienced the action of the latter and did not contribute to the luminescence.
At the surfaces of the TiO2–V2O5 and TiO2–MoO3–V2O5 samples, the initial fluorescence intensity of rhodamine dye was lower than the equipment noise level, which indicates an exceptionally strong quenching (similar to what we have previously observed for vanadium oxides [25]).
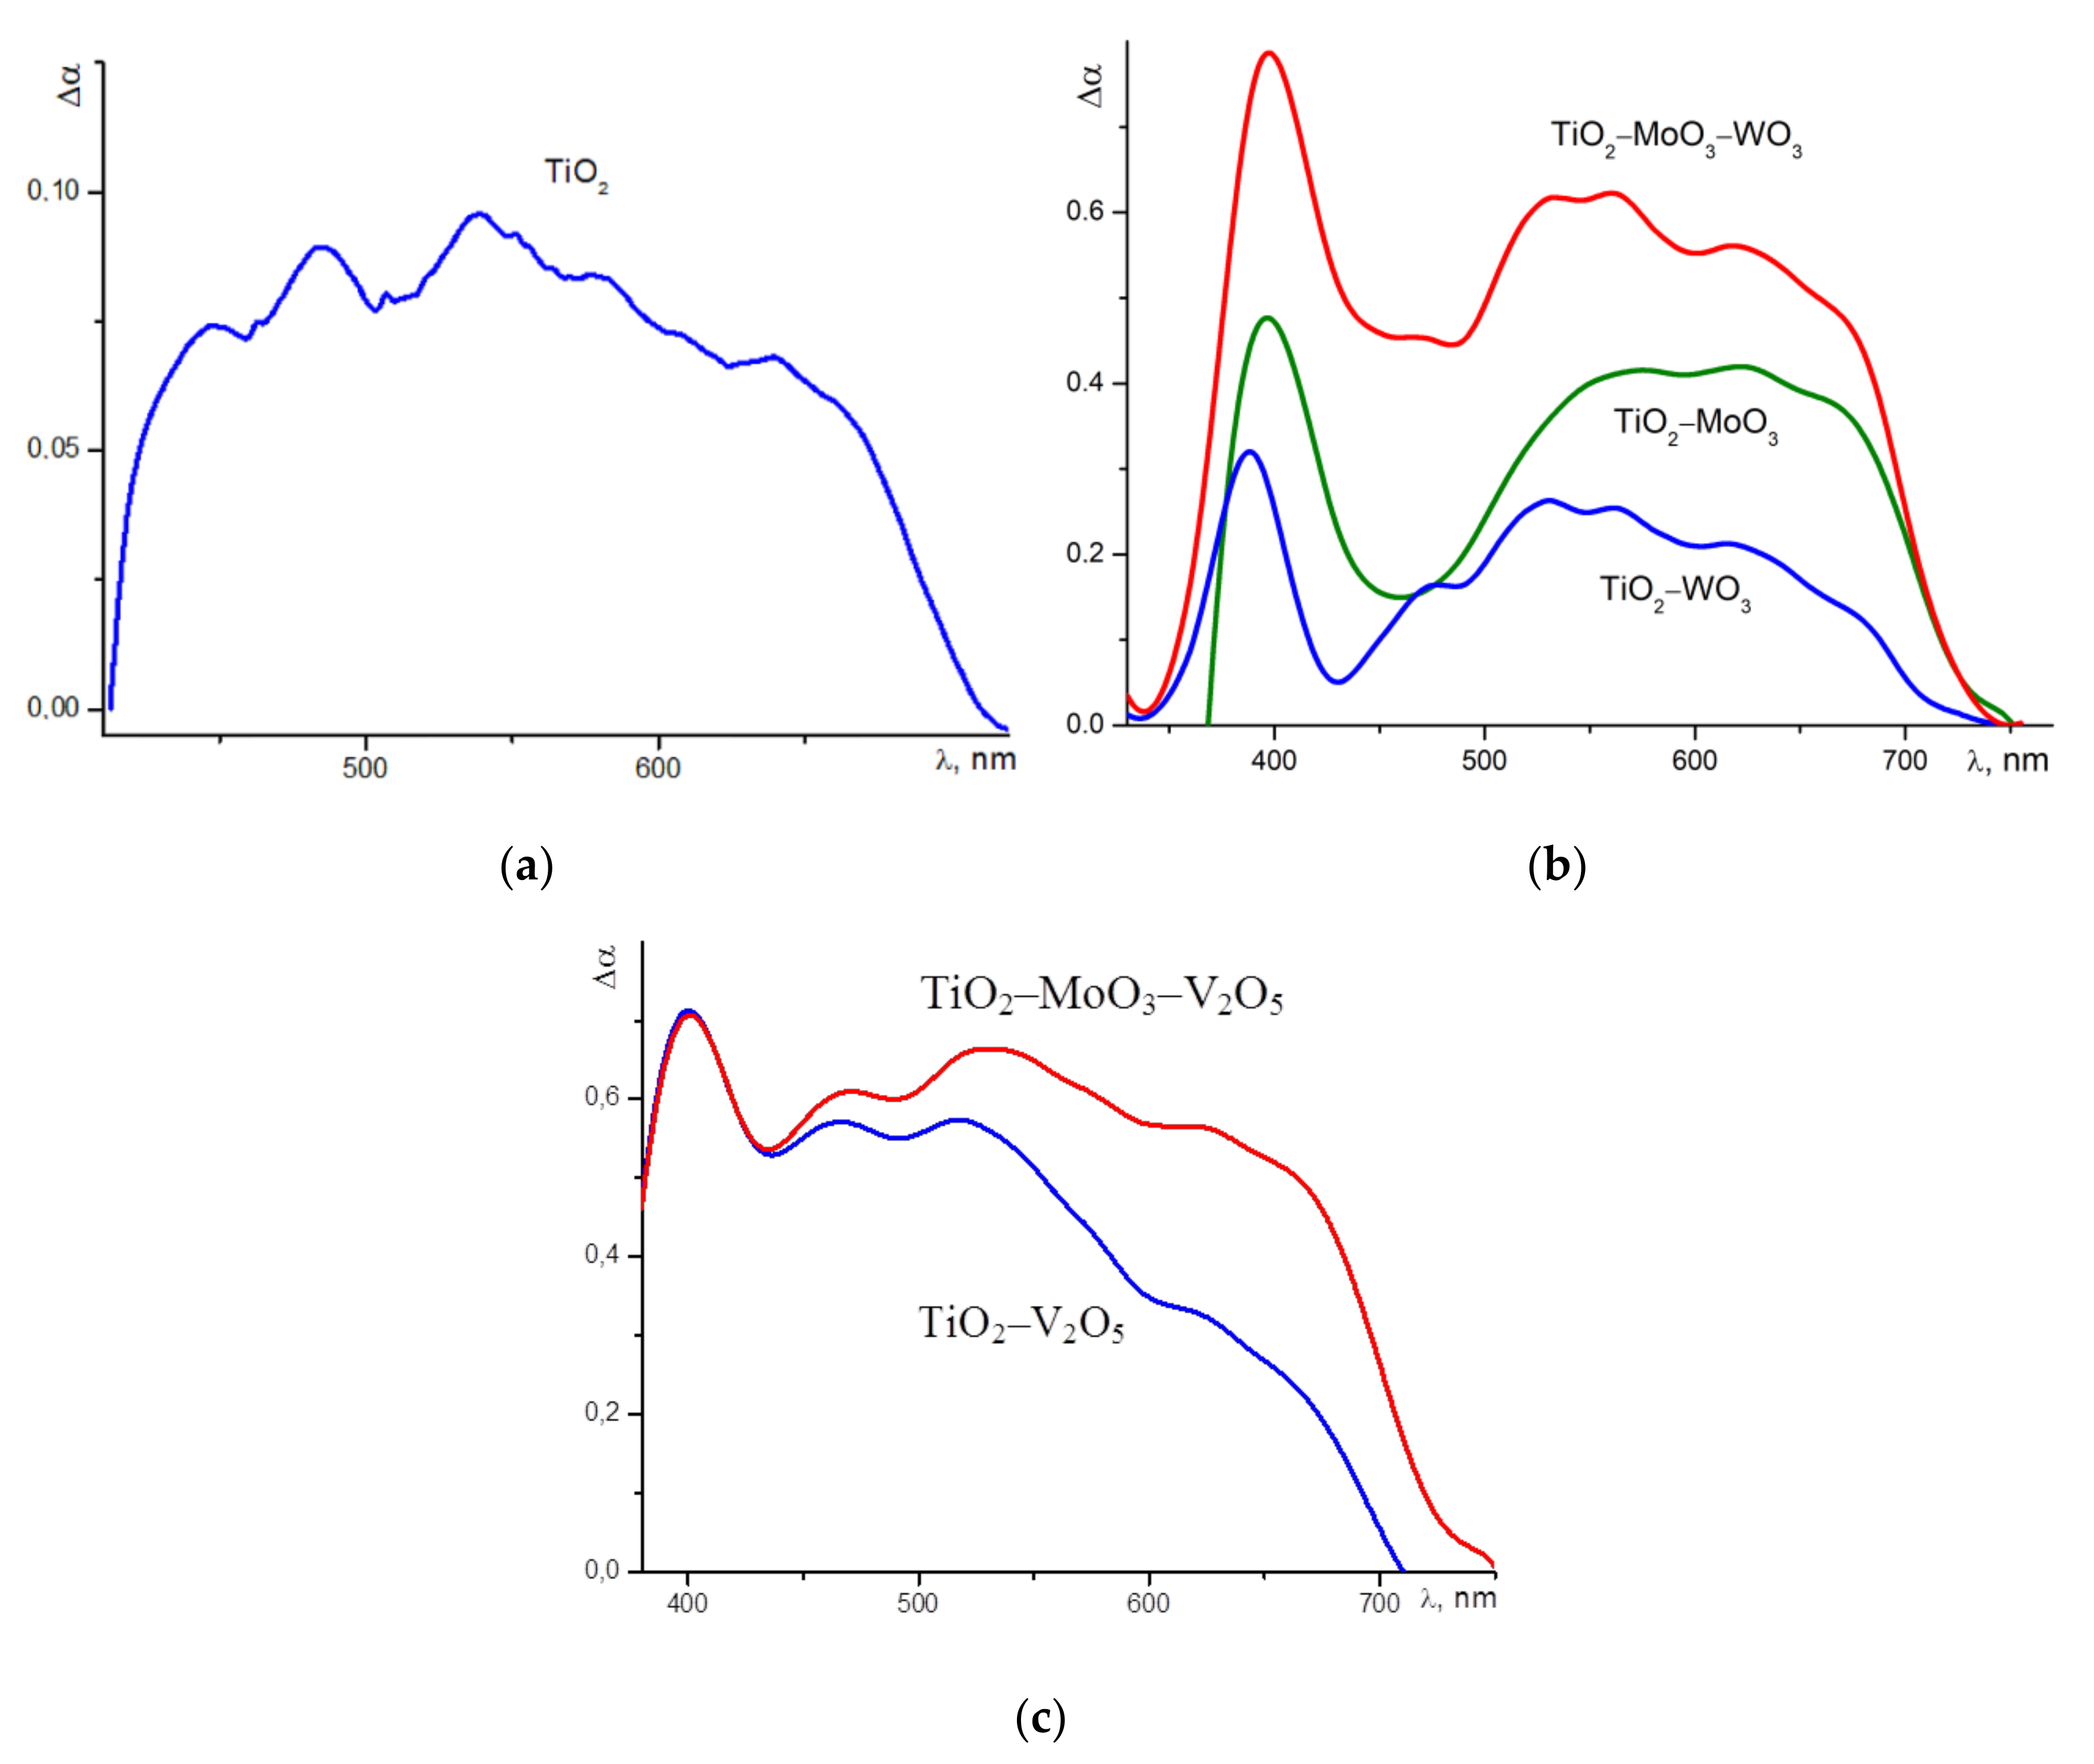
The explanation of the catalysis results obtained by illumination at the 500-nm wavelength can be obtained by comparing them with the absorption spectra of the studied nanoheterostructures in the visible region. To do this, we considered the difference of absorption spectra in the visible region between the studied nanoheterostructures and pure nanocrystalline TiO2. The heterostructures used in this study were produced on the basis of N-doped TiO2. The difference absorption spectrum for N-doped TiO2 is represented at Figure 7a. Such doping creates an additional wide, structureless absorption band for titanium dioxide nanocrystals, from about 420 to 720 nm. This may correspond to a fairly uniform spectrum of electronic states in the band gap of TiO2. Therefore, the adsorbed molecules of the rhodamine dye (when illuminated at 500 nm) can efficiently transfer the photoexcitation energy on the order of 2.16 eV (≈575 nm, see Figure 4) to the semiconductor via the induction-resonance symmetric dipole–dipole mechanism. Using this energy, the electrons are effectively ejected from the local states in the band gap to the conduction band of TiO2. This can lead to the accelerated photodegradation of the dye on the surface of nitrogen-doped titanium dioxide when illuminated at a 500-nm wavelength. In addition, the doped material of the photocatalyst itself absorbs radiation at the wavelength of 500 nm (used for the measurement), which can also lead to the observed effect.
Samples of TiO2–WO3, TiO2–MoO3 and TiO2–MoO3–WO3 more effectively absorb light in the visible region than N-doped TiO2. The difference between the absorption spectra of these nanoheterostructures and pure titanium dioxide in the visible region is shown at Figure 7b, but there is a clear dip in their absorption spectra in the range of 420 to 540 nm. Therefore, the illumination of such samples at a 500-nm wavelength should not lead to a significant photocatalytic effect. Although all three of these structures can effectively absorb radiation with the wavelength of ~575 nm, this means that in their electronic spectrum there are states that could be acceptors for non-radiative energy transfer from the dye molecules. Moreover, the TiO2–MoO3–WO3 nanoheterostructures have symmetric behaviour regarding their absorption coefficients and photocatalysis. These samples have a higher absorption coefficient at the 500-nm wavelength than the other two structures (Figure 7b), and their photocatalysis is more effective under such illumination (Figure 2).
Thus, we were able to show that under the illumination of nanoheterostructures with adsorbed rhodamine dye, at the dye-absorption wavelength (500 nm), photocatalytic reactions are mainly determined by the absorption of light by the nanostructures themselves, and not by the transfer of energy from the dye. Since a strong quenching of the initial fluorescence is observed on the surface of all studied nanoheterostructures, it can be stated that the nonradiative energy transfer from the dye molecules associated with such quenching occurs, but does not lead to a significant additional acceleration of photocatalysis. This means that the determination of the photocatalytic efficiency under illumination in the visible range, using adsorbed rhodamine-type dyes, is a valid procedure.
As for photocatalysis with the use of TiO2–V2O5 and TiO2–MoO3–V2O5 nanoheterostructures, their absorption in the visible region is very intense and does not have a noticeable dip (Figure 7c). In addition, the quenching of the dye luminescence on the surfaces of these structures was so strong that it was not possible to measure the kinetics.

4. Conclusions

The photocatalysts TiO2−MoO3, TiO2−V2O5, TiO2−WO3, TiO2−MoO3−WO3, and TiO2−MoO3−V2O5, with high activity in visible range, were synthesized and studied using microscopy, XRD, ESR and optical techniques. Using the ESR method, the energy position of the different radicals in the band gap of nanooxides was determined and their ability to absorb visible light by radicals has been demonstrated. We have performed, for the first time, a symmetric study of the luminescence of dye molecules adsorbed by nanoheterostructures’ surfaces and these structures’ catalytic activity. We have shown that, under the illumination of nanoheterostructures with adsorbed rhodamine dye at the dye absorption wavelength (500 nm), photocatalytic reactions are mainly determined by light absorption by the nanostructures themselves, and not by energy transfer from the dye. This important result shows that the high photocatalytic activity of photocatalysts with symmetric crystal structures is the primary criterion for the creation of energy-efficient photocatalysts. We have also proved that the method of catalytic activity measurement, using adsorbed dye, is valid. The prepared nanoheterostructures, based on titanium, molybdenum, tungsten, and vanadium nanooxides with high radical concentrations and high rates of photocatalysis, can be used to create energy-efficient photocatalytic devices operating under periodic illumination in the visible range of the spectrum.

Supplementary Materials

The following are available online at https://www.mdpi.com/article/10.3390/sym13091758/s1, Figure S1: ESR spectra of nanoheterostructures TiO2−WO3 (1), TiO2−V2O5 (2), TiO2−MoO3 (3), TiO2−MoO3−V2O5 (4), TiO2−MoO3−WO3 (5), Figure S2: Kinetic curves of photocatalysis for MoO3 (1a) and TiO2 (1b) nanooxides, and nanoheterostructures TiO2−WO3 (2), TiO2−MoO3 (3), TiO2−MoO3−V2O5 (4), and TiO2−MoO3−WO3 (5) under photoexcitation in the visible spectral region (450–750 nm). Arrows show the moments of switching illumination on (t = 0) and off (t = 20 min). C0 is the initial dye concentration at the moment t = 0 and C is the dye concentration at the moment t. TiO2 doped with nitrogen was used.

Author Contributions

Conceptualization, E.K. and V.Z.; methodology, investigation E.K., V.Z., A.M. and A.I.; writing—original draft preparation, E.K., V.Z. and A.M.; writing—review and editing, E.K., V.Z. and A.I. All authors have read and agreed to the published version of the manuscript.

Funding

The research was carried out with financial support of the Russian Foundation for Basic Research within the framework of research project no. 18-29-23051.

Institutional Review Board Statement

Not applicable.

Informed Consent Statement

Not applicable.

Data Availability Statement

The datasets obtained and analysed during the current study are available from the corresponding author on reasonable request.

Acknowledgments

ESR, luminescent and scattering spectroscopy measurements were carried out using equipment of the shared facilities of Moscow State University.

Conflicts of Interest

The authors declare no conflict of interest. The funders had no role in the design of the study; in the collection, analyses, or interpretation of data; in the writing of the manuscript, or in the decision to publish the results.

References

  1. O’Regan, B.; Gratzel, M. A low-cost, high-efficiency solar cell based on dye-sensitized colloidal TiO2 films. Nature 1991, 353, 737–740. [Google Scholar] [CrossRef]
  2. Mills, A.; Le Hunte, S. An overview of semiconductor photocatalysis. J. Photochem. Photobiol. A 1997, 108, 1–35. [Google Scholar] [CrossRef]
  3. Schneider, J.; Matsuoka, M. Understanding TiO2 photocatalysis: Mechanisms and materials. Chem. Rev. 2014, 114, 9919–9986. [Google Scholar] [CrossRef]
  4. Sasan, K.; Zuo, F. Self-doped Ti3+-TiO2 as a photocatalyst for the reduction of CO2 into a hydrocarbon fuel under visible light irradiation. Nanoscale 2015, 7, 13369–13372. [Google Scholar] [CrossRef]
  5. Ola, O.; Maroto-Valer, M. Review of material design and reactor engineering on TiO2 photocatalysis for CO2 reduction. J. Photochem. Photobiol. 2015, 24, 16–42. [Google Scholar] [CrossRef] [Green Version]
  6. Liu, D.; Zi, W.; Sajjad, S.D. Reversible Electron Storage in an All-Vanadium Photoelectrochemical Storage Cell: Synergy between Vanadium Redox and Hybrid Photocatalyst. ACS Catal. 2015, 5, 2632–2639. [Google Scholar] [CrossRef]
  7. Chen, X.; Mao, S. Titanium dioxide nanomaterials: Synthesis, properties, modifications and applications. Chem. Rev. 2007, 107, 2891–2959. [Google Scholar] [CrossRef]
  8. Hoffmann, M.R.; Martin, S.T.; Choi, W. Environmental Applications of Semiconductor Photocatalysis. Chem. Rev. 1995, 95, 69–96. [Google Scholar] [CrossRef]
  9. Fujishima, A.; Rao, T.N.; Tryk, D.A. Titanium dioxide photocatalysis. J. Photochem. Photobiol. C 2000, 1, 1–21. [Google Scholar] [CrossRef]
  10. Serpone, N.; Pelizzetti, E. Photocatalysis: Fundamentals and Applications; Wiley: New York, NY, USA, 1989. [Google Scholar]
  11. Sviridova, T.V.; Sadovskaya, L.Y.; Shchukina, E.M. Nanoengineered thin-film TiO2/h-MoO3 photocatalysts capable to accumulate photoinduced charge. J. Photochem. Photobiol. A 2016, 327, 44–50. [Google Scholar] [CrossRef] [Green Version]
  12. Konstantinova, E.A.; Minnekhanov, A.A.; Kokorin, A.I.; Sviridova, T.V.; Sviridov, D.V. Determination of the Energy Levels of Paramagnetic Centers in the Band Gap of Nanostructured Oxide Semiconductors Using EPR Spectroscopy. J. Phys. Chem. C 2018, 122, 10248–10254. [Google Scholar] [CrossRef]
  13. Asahi, R.; Morikawa, T.; Ohwaki, T.; Aoki, K.; Taga, Y. Visible-light photocatalysis in nitrogen-doped titanium oxides. Science 2001, 293, 269–271. [Google Scholar] [CrossRef]
  14. Rupa, A.V.; Divakar, D.; Sivakumar, T. Titania and noble metals deposited titania catalysts in the photodegradation of tartazine. Catal. Lett. 2009, 132, 259–267. [Google Scholar] [CrossRef]
  15. Barbieriková, Z.; Pližingrová, E.; Motlochová, M.; Bezdička, P.; Boháček, J.; Dvoranová, D.; Mazúr, M.; Kupčík, J.; Jirkovský, J.; Šubrt, J.; et al. N-Doped titanium dioxide nanosheets: Preparation, characterization and UV/visible-light activity. Appl. Catal. B Environ. 2018, 232, 397–408. [Google Scholar] [CrossRef]
  16. Miyamoto, N.S.; Miyamoto, R.; Giamello, E.; Kurisaki, T. Characterization and photocatalytic properties of lutetium ion-doped titanium dioxide photocatalyst. Res. Chem. Intermed. 2018, 44, 4577–4594. [Google Scholar] [CrossRef]
  17. Minnekhanov, A.A.; Le, N.T.; Konstantinova, E.A.; Kashkarov, P.K. Influence of Defects on Photoconductivity and Photocatalytic Activity of Nitrogen-Doped Titania. Appl. Magn. Reson. 2017, 48, 335–345. [Google Scholar] [CrossRef] [Green Version]
  18. Yan, M.; Li, G.; Guo, C.; Guo, W.; Ding, D.; Zhanga, S.; Liu, S. WO3-x sensitized TiO2 spheres with full-spectrum-driven photocatalytic activities from UV to near infrared. Nanoscale 2018, 8, 17828–17835. [Google Scholar] [CrossRef]
  19. Skorb, E.V.; Ustinovich, E.A.; Kulak, A.I.; Sviridov, D.V. Photocatalytic activity of TiO2:In2O3 nanocomposite films towards the degradation of arylmethane and azo dyes. J. Photochem. Photobiol. A 2008, 193, 97–102. [Google Scholar] [CrossRef]
  20. Konstantinova, E.A.; Zaitsev, V.B.; Kytina, E.V.; Marikutsa, A.V. Photoaccumulating Nanoheterostructures Based on Titanium Dioxide. Semiconductors 2021, 55, 219–227. [Google Scholar] [CrossRef]
  21. Kortüm, G.; Braun, W.; Herzog, G. Principles and Techniques of Diffuse-Reflectance Spectroscopy. Angew. Chem. Int. Ed. Engl. 1963, 2, 333–341. [Google Scholar]
  22. Zaitsev, V.; Rosty, R.; Kebbekus, B. The testing of a semiconductor-based adsorption modified photosensitive sensor for its response to a volatile organic compound, oxygen, humidity and temperature. Sens. Act. B 2005, 107, 347–352. [Google Scholar] [CrossRef]
  23. Li, H.; Devaux, A.; Ruiz, A.Z.; Calzaferri, G. Electronic excitation energy transfer from dye-loaded zeolite L monolayers to a semiconductor. SPIE Proc. 2006, 6195, 61951G. [Google Scholar] [CrossRef]
  24. Gygax, H.; Rebane, A.; Wild, U.P. Stark effect in dye-doped polymers studied by photochemically accumulated photon echo. J. Opt. Soc. Am. B 1993, 10, 1149–1158. [Google Scholar] [CrossRef]
  25. Zaitsev, V.B.; Kiselev, V.F.; Levshin, N.L.; Plotnikov, G.S. Effect of adsorbed photo-excited dye molecules on the semiconductor metal phase-transition. Doklady Akad. Nauk. SSSR 1989, 304, 649–652. [Google Scholar]
Figure 1. Micrographs of the N-doped TiO2 (a), TiO2−V2O5 (b), TiO2−MoO3 (c), TiO2−WO3 (d), TiO2−MoO3−V2O5 (e), and TiO2−MoO3−WO3 (f) nanoheterostructures. The scale bar’s length is 100 nm.
Symmetry 13 01758 g001
Figure 2. Relative rhodamine dye concentration C/C0 at the surface of the studied nanoheterostructures after 45 min of illumination by visible light (in the range 450–750 nm). C0 is initial dye concentration.
Symmetry 13 01758 g002
Figure 3. Band diagrams of the nanooxides of titanium (a), molybdenum (b), and tungsten (c), combined into TiO2-MoO3-WO3 samples.
Symmetry 13 01758 g003
Figure 4. The fluorescence spectrum (1) and the fluorescence excitation spectrum (2) of the rhodamine dye adsorbed on the TO2 surface.
Symmetry 13 01758 g004
Figure 5. Time dependencies of the maximum fluorescence intensity of rhodamine dye molecules adsorbed at photocatalysts’ surface (333-nm excitation between the fluorescence measurements).
Symmetry 13 01758 g005
Figure 6. Time dependencies of the maximum fluorescence intensity of rhodamine dye molecules adsorbed at the surface of photocatalysts TiO2 (a), TiO2–WO3 (b) and TiO2–MoO3–WO3 (c) under the conditions of 333-nm and 500-nm illumination between the fluorescence measurements.
Symmetry 13 01758 g006
Figure 7. The difference of the absorption spectra in the visible region of nanocrystalline N-doped TiO2 (a); TiO2–WO3, TiO2–MoO3, TiO2–MoO3–WO3 (b) and TiO2–V2O5, TiO2–MoO3–V2O5 (c) and the absorption of pure titanium dioxide.
Symmetry 13 01758 g007
Table 1. TiO2 nanoparticles’ average diameter d in the nanoheterostructures, calculated using the Scherrer formula from the corresponding reflections broadening and the specific surface area S.
Sampled, nmS, m2/g
TiO21490
TiO2/WO3998
TiO2/MoO3/WO34100
TiO2/MoO34110
TiO2/MoO3/V2O5995
Publisher’s Note: MDPI stays neutral with regard to jurisdictional claims in published maps and institutional affiliations.

