Abstract
The phase transitions between paraelectric (PE) and ferroelectric (FE) isomorph phases of LiNbO have been investigated quantum mechanically by using a Gaussian-type basis set, the B3LYP hybrid functional and the CRYSTAL17 code. The structural, electronic and vibrational properties of the two phases are analyzed. The vibrational frequencies evaluated at the point indicate that the paraelectric phase is unstable, with a complex saddle point with four negative eigenvalues. The energy scan of the A mode at −215 cm (i215) shows a dumbbell potential with two symmetric minima. The isotopic substitution, performed on the Li and Nb atoms, allows interpretation of the nontrivial mechanism of the phase transition. The ferroelectric phase is more stable than the paraelectric one by 0.32 eV.
1. Introduction
In recent years much attention has been devoted to the ABO perovskite family, where A is usually a metal belonging to the first or second group of the periodic table (A = Li, Na, K, Rb, Mg, Ca, Sr, Ba are the most common) and B is a transition metal. These structures present a wide range of physical properties of technological interest, including non-linear optics, piezoelectricity and photo elasticity, also because they are very stable chemically in a wide range of temperatures.
In the perovskite family, lithium niobate (LiNbO), a ferroelectric material with trigonal (hexagonal) symmetry and a layered structure, is of particular interest [1]; for example, optoelectronic components designed from LiNbO single crystals are very promising. Different synthesis techniques and preparation methods are explored for the optimal exploitation of the crystalline properties of this material, the aim being to improve the performance of integrated optical components such as modulators, switches, lasers and optical detectors [2,3,4,5,6,7].
In parallel to experimental studies, a limited number of theoretical investigations of the electronic and elastic properties of LiNbO are present in the literature. Simulations performed in the last decade were mostly based on periodic density functional theory (DFT), using a plane-wave (PW) basis set, pseudopotentials (PP) and the gradient corrected GGA functional [8,9,10,11,12,13].
In this paper the electronic and spectroscopic features of the non-centrosymmetric ferroelectric (R3c) and centrosymmetric paraelectric (Rc) phases of LiNbO are investigated, by using a Gaussian-type basis set, the B3LYP hybrid functional, which contains a fraction of the exact exchange (20% of Hartree Fock exchange), as implemented in the CRYSTAL17 code [14,15].
The ferroelectric R3c structure of the niobate has six point symmetry operators, while the paraelectric Rc is more symmetric, with 12 symmetry operators including the inversion center. The latter centrosymmetric structure is stable in a range of temperatures over about 1500 K. Below such temperature the structure transforms to the more stable ferroelectric phase R3c. At 0 K the atomic positions of the Rc group define a saddle point on the potential energy surface (PES). The vibration spectrum of the paraelectric phase is characterized by four imaginary eigenvalues. The geometry modifications with the relative atomic displacements involved in the transition are evaluated through the Hessian calculation. The analysis of the PES of the paraelectric crystallographic phase is derived from the scan of the A imaginary mode. This one can be described by a dumbbell potential with a low energy barrier in the transition.
The isotopic substitutions together with the analysis of the symmetry of each mode permit to identify unambiguously the atoms contributing to the IR spectrum in each phase.
The paper is structured as follows. Section 2 reports information on the adopted computational setup; this is a standard section similar to those in previous papers by some of the present authors. Section 3 is organized in four parts. The first Section 3.1 provides information on the geometry of the two structures and their charge distributions and bond population analysis. The second Section 3.2 is devoted to the analysis of the infrared (IR) spectra of the two phases and their transition. The third Section 3.3 is dedicated to imaginary wavenumber modes. The last Section 3.4 analyzes the vibrational modes and the effect of the isotopic substitution in order to identify the atomic contribution to each mode. Finally, in Section 4 some conclusions are drawn.
2. Computational Methods
Calculations were achieved using the B3LYP hybrid functional [16,17] as formulated in the CRYSTAL program [14,15,18]. A triple all electron basis set of Gaussian-type orbitals (GTO) was adopted [19] for lithium, oxygen and niobium atomic species.
As shown by a previous paper, the combined use of the B3LYP functional and the triple basis set [20,21,22,23,24,25,26] provides very accurate results for the vibrational spectra, in terms of both wavenumbers and intensities [25,27,28,29,30,31]. The exchange and Coulomb infinite lattice series can be modified through five parameters, T, which were set to 8 (T–T) and 16 (T). The self-consistent-field (SCF) convergence threshold on energy was set to 10 Hartree for the geometrical optimizations and for frequency calculations.
The exchange-correlation contribution of DFT and the relative gradient are calculated by numerical integration over the unit cell volume. The integration grid points in CRYSTAL are generated following an atomic partition method, developed originally by Becke [32] for molecules and afterwards extended to periodic systems. In this scheme the unit cell is partitioned into atomic volumes with the center placed in the nuclei, where every point is associated with a specific weight. Through Gauss–Legendre radial quadrature and Lebedev two-dimensional angular point distributions, the radial and the angular points for the integration grid are generated. The integration grid is a very important parameter for the numerical accuracy of the electronic density.
In this work an XXL integration grid [18], consisting of a pruned grid with 1454 angular and 99 radial points, was used. The extreme accuracy can be evaluated by comparing the integrated charge density of = 80.000004 with the overall number of 80 electrons in the unit cell. A -centered Pack–Monkhorst grid [33] for sampling the reciprocal space has been used; it consists of 64 k-points (4 × 4 × 4) in the first Brillouin Zone and for the most symmetric case, they reduce to 13.
Harmonic phonon frequencies (i.e., wavenumbers), , evaluated in reciprocal space at the point (i.e., at the center of the first Brillouin zone, the only one that gives a contribution to the IR spectrum), were achieved from the mass-weighted Hessian matrix diagonalization of the second derivatives of the energy with respect to atomic displacements u [34]:
where the a and b atoms (with relative atomic masses and ) in the reference cell, 0, are moved, respectively, along the i-th and j-th Cartesian directions. First-order derivatives are evaluated analytically, whereas second-order derivatives are numerical, adopting a two-point formula (as the difference of the gradient between the equilibrium position and after a displacement of 0.003 Bohr along the three Cartesian coordinates; it is necessary to underline that the optimization of the structure is a numerical process and the gradient at equilibrium is not exactly null but simply lower than the threshold of the optimizer).
A computational scheme [35] implemented on the Berry Phase theory [36] is adopted in order to compute the integrated intensities for IR absorption for each mode p. The dipole moment derivatives with respect to the Cartesian coordinates of the unit cell atoms are numerically evaluated, through a scheme analogous to the one adopted for the numerical derivative of the gradient for achieving the Hessian matrix. The IR spectra are then generated by considering the transverse-optical (TO) modes and by interpolating them with Lorentzian curves with full-width-at-half-maximum of 8 cm.
Once the Hessian matrix, , is obtained, the frequency shifts due to the effect of the isotopic substitutions can be calculated easily, without any computational cost, by changing the masses in Equation (1).
3. Results
3.1. Geometrical and Electronic Properties of the Two Phases
Starting from .cif file data provided by the literature cited in Table 1, a full relaxation (fractional atomic coordinates and cell parameters) was performed in order to find the stationary points along the PES. In the case of the R3c system, the optimized cell parameters are very close to the experimental ones, with errors of 0.35% (a = b lattice parameters) and 2.75% (c); the differences are even smaller (1.10% and 0.65%) for the Rc unit cell. These underestimations are in line with the ones obtained for similar systems when the same hybrid functional is used. Atom–atom distances, net charges and bond population data, as resulting from a Mulliken Population Analysis (MPA), are shown in Table 2. In the R3c system, the octahedra are very deformed: the Nb-O distances split into two sets (three and three) at 1.889 Å and 2.141 Å, and the Li-O at 2.094 to 2.260 Å (see also Figure 1, where the longest are depicted).

Table 1.
Experimental and DFT calculated cell parameters and cell volume. Plane-wave GGA results are also reported, and compared with our Gaussian-type B3LYP results.
Table 2.
R distances (in Å) of the first neighbors in the unit cell. The MPA net charges q and the bond overlap population OV are also shown. q and OV in .
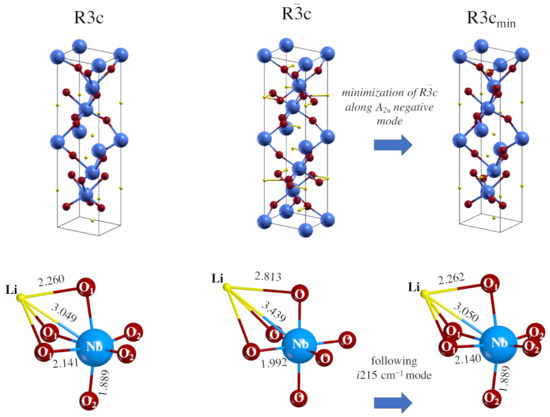
Figure 1.
Equilibrium geometry of LiNbO perovskite in the R3c (left) and Rc (center) space groups. The structure to the right is obtained by following the mode with imaginary wavenumber (i215.4 cm) at the point in the Rc group down to the minimum energy. The symmetry of the mode is A, so that the point symmetry of the system is consequently (and automatically, by the code) reduced to R3c. The geometry (and the total energy) of this structure coincide with the one to the left, obtained by imposing directly the R3c symmetry.
For the more symmetric Rc system all the Li-O distances are 1.998 Å long, and the Nb-O ones 1.992 Å long. The difference between the two systems is then mostly in the octahedron distortion occurring in the low symmetric ferroelectric structure, where the six oxygens are no longer equivalent as in the paraelectric form.
The atomic charges q and the overlap bond populations OV are reported in Table 2. The Li net charge is q = +0.51 for R3c (q = +0.56 for Rc). The Nb net charge is q = +2.68 (+2.70 for Rc). Oxygen is quite negative: q = −1.065 (−1.09 for Rc).
Differences in the bond populations are larger; OV is small, 0.062 and 0.051 for the two sets in R3c, indicating an essentially ionic bond; for Rc it is slightly larger, 0.073 . The Nb-O bond population is larger, 0.158 and 0.072 (quite different for the short and long distances) and 0.119 for the symmetric structure. In this case the bond has a mixed ionic–covalent character. This analysis shows that Li atoms are not tightly linked to oxygen atoms and, as shown in the following sections, they can move in a relatively flat PES.
3.2. Infrared Spectra
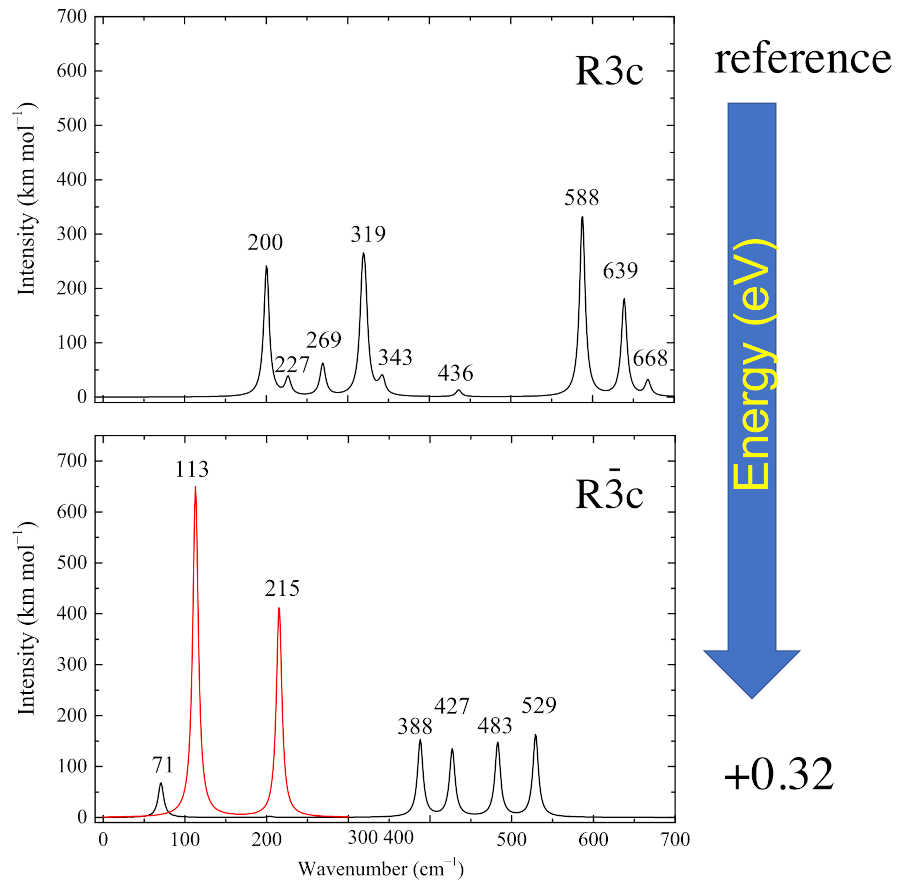
The infrared spectra of the two systems are characterized by a narrow range of wavenumbers: from 50 to 700 cm. For convenience, the spectra can be divided into a low wavenumber region (0–350 cm) and a high wavenumber region (351–700 cm). The absolute value and red color are used for representing the imaginary wavenumber peaks (see Figure 2). In the low wavenumber region, the R3c phase is characterized by two intense peaks at 200 and 319 cm with an intensity of about 240–260 km/mol, six times larger than the other peaks (at 227, 269 and 343 cm) appearing in this part of the spectrum. The high wavenumber region is dominated by the most intense peak at 588 cm (about 300 km/mol) and by a second peak at 639 cm (about 180 km/mol). Two very small peaks appear at 436 and 668 cm.
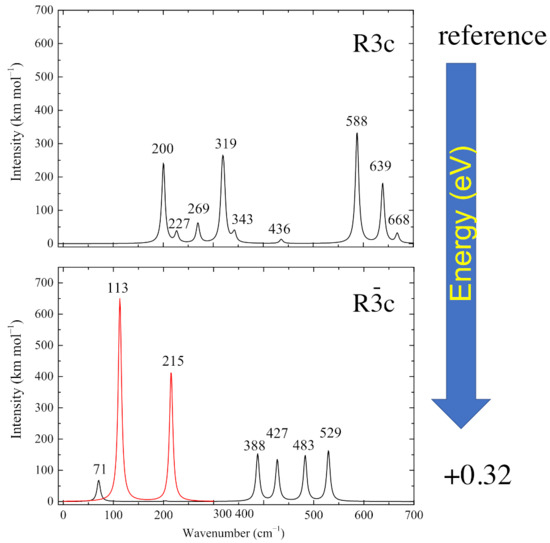
Figure 2.
IR spectra of the two structures shown in Figure 1. In the bottom panel, the red peaks represent the modes with imaginary wavenumbers. The A mode, with imaginary wavenumber, does not appear, as it is symmetry forbidden.
The spectrum of the paraelectric Rc phase is completely different. In the high-wavenumber region there are four peaks at 388, 427, 483 and 529 cm with intensities spanning from 135 to 163 km/mol. In the low-wavenumber region there are four imaginary eigenvalues. Two of them, at i215 cm (A symmetry) and i113 cm (double degenerate E symmetry), are IR active. The fourth imaginary eigenvalue at i87 cm (A) is not detectable because it is IR-inactive. These two active peaks are the most intense (see red curves in Figure 2) with intensities equal to 650 and 410 km/mol. The high intensity is due to a strong variation in the dipole moment and is responsible for the intriguing photoelastic properties of this material. The low-wavenumber region is completed by a single peak at 71 cm with low intensity (about 71 km/mol).
Therefore, the spectra of the two phases are very different and reflect the large geometry difference, and the symmetry reduction from PE to FE.
3.3. The Modes with Imaginary Wavenumber
The character of the phase transition between the PE and the FE phases is still a matter of debate [38,39,42,43,44,45,46,47]. In most of the cases the discussion is based on comparison of the coordinates of the atoms of the unit cell in the PE and FE optimized structures. In the present LiNbO case, all atoms move, and then the classification of the phase transition can be different if a different threshold is used for these displacements: are all the three kinds of atoms moving by roughly the same amount, or can we define a hierarchy in the moving atoms (the dominant displacement)?
We followed a different strategy, using three tools available in the CRYSTAL code [18]:
- (i)
- the SCANMODE option, which allows us to follow the PES along a particular vibrational eigenvalue;
- (ii)
- the isotopic substitution;
- (iii)
- the graphical animation of the modes of interest.
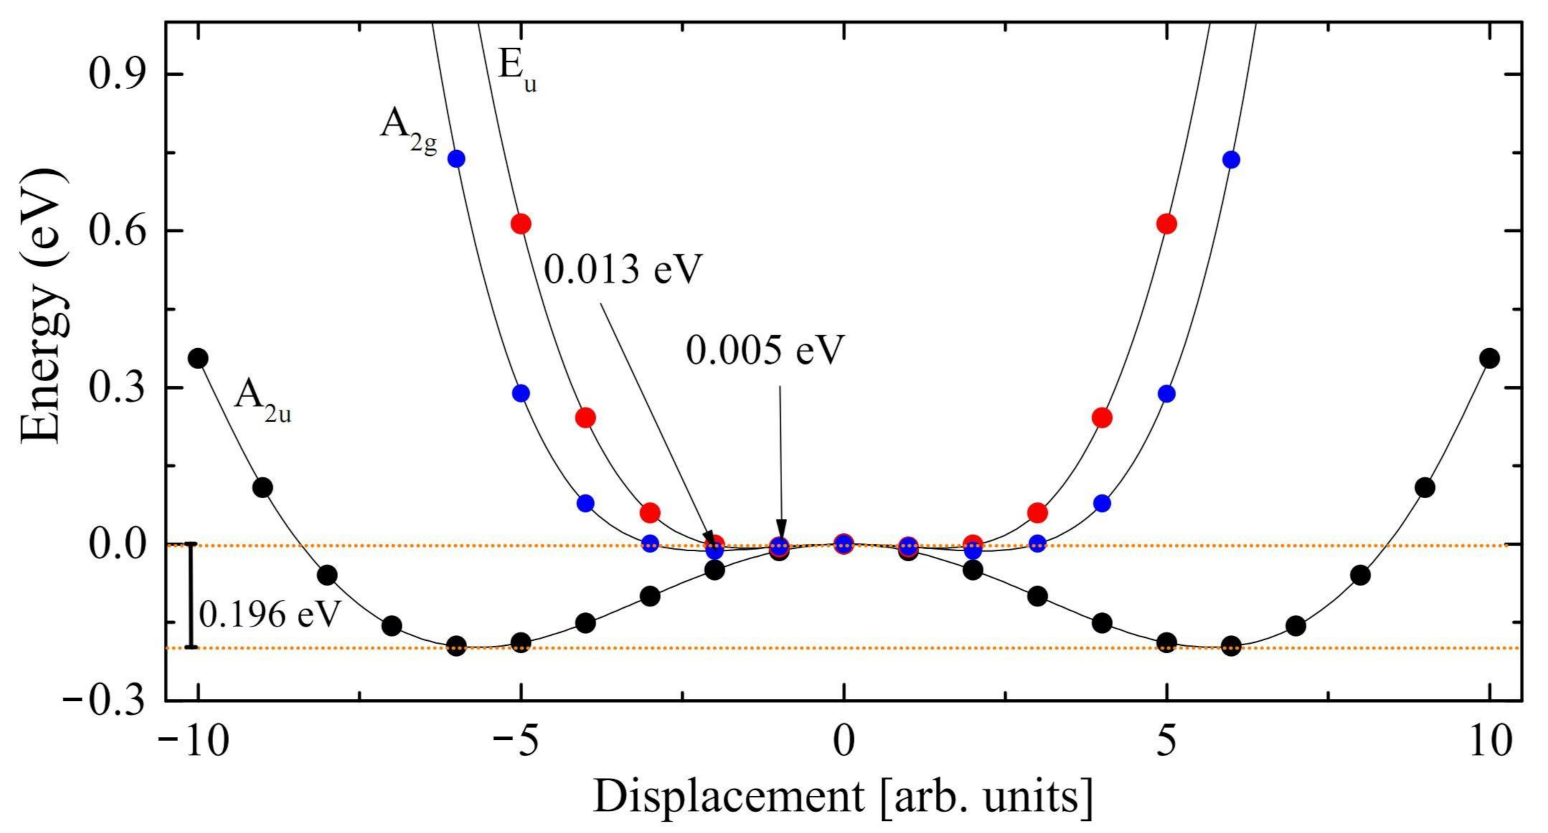
The scans of three of the four modes with imaginary eigenvalues (only one of the degenerate E couples is scanned) are reported in Figure 3. The general structure of the three curves is the same (a double minimum on the two sides, with a maximum at the center). However the depth of the three minima with respect to the common maximum is quite different in the three cases: 0.005 eV for the A mode, 0.013 eV for the E mode, and 0.196 eV for the A mode. The latter, at i215 cm, presents by far the deepest local minimum. Displacing the atoms along this mode, symmetry reduces from 12 to 6 operators, and the system becomes ferroelectric. The energy difference between the maximum and the two symmetric minima is ∼0.2 eV (see the two horizontal orange dotted lines in Figure 3). Once we have determined the minimum along the mode with A symmetry, a full geometry optimization produces a further energy decrease of 0.12 eV. The final geometry obtained from this procedure essentially coincides with the one obtained by directly optimizing the R3c structure (see left panel of Figure 1). In addition, the two energies are extremely close to each other, the difference being 2 × 10 E. The residual, negligible differences must be attributed to the graininess of the numerical optimization process.
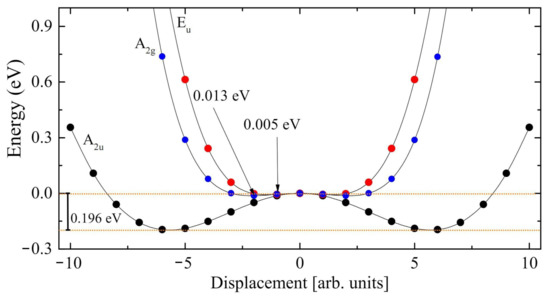
Figure 3.
Exploration of the three normal modes of trigonal LiNbO characterized by an imaginary wavenumber, at i215.4 cm (A symmetry, black circles), i113.0 cm (E symmetry, red circels) and i86.9 cm (A symmetry, blue circles). The minimum along the A mode is the deepest, at about 0.2 eV below the stationary point. The other two minima are indicated by the arrow.
In summary, the energy difference between the two phases is ∼0.32 (0.20 + 0.12) eV. The first energy gain, 0.20 eV (63% of the total), is obtained by relaxing the system along a single coordinate, the normal mode at i215 cm; the remaining 37% (0.12 eV) is, conversely, due to a global optimization. We can then say that the movement along the A mode is the driving force for the PE to FE transition. In the next section we try to understand, using the isotopic substitution, which atoms are involved in each normal mode.
3.4. Isotopic Substitutions
Figure 4 shows the effect of the Li →Li and Nb →Nb isotopic substitutions. The aim is to identify to which modes each atom contributes. In the extreme model of independent particles, one should be able to identify 3 modes belonging to each Li atom, and 3 modes for each Nb atom. In the harmonic oscillator model, the frequency depends on the mass (or better, on the square root of the inverse of the mass). One can hope to be able to identify the Li and Nb modes, as the masses of the two atoms are very different from each other, and from the oxygen one. As in the unit cell there are 10 atoms; overall we must classify 3 × 10 − 3 = 27 normal modes. When the mass of lithium is changed, six shifts are larger than the others (obviously all modes are somehow altered, but in some cases the effect is negligible). In the simulation, the mass can be modified arbitrarily. In the Li case, the mass has been reduced from 7 to 6 Dalton (mass variation ∼−14%). The Nb mass has been changed from 93 to 96 Dalton (∼ +3%). It is important to classify the modes by symmetry: during the isotopic substitution, the modes shift by a different amount, and the relative position of the eigenvalues may be altered. Symmetry can help to identify which is which. The isotopic shifts (in cm) in Figure 4 are calculated according to the following equation:
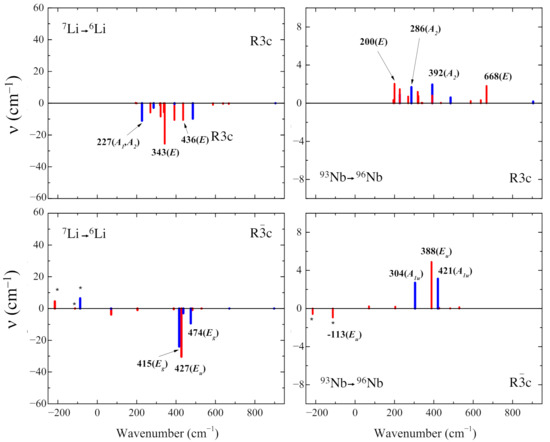
Figure 4.
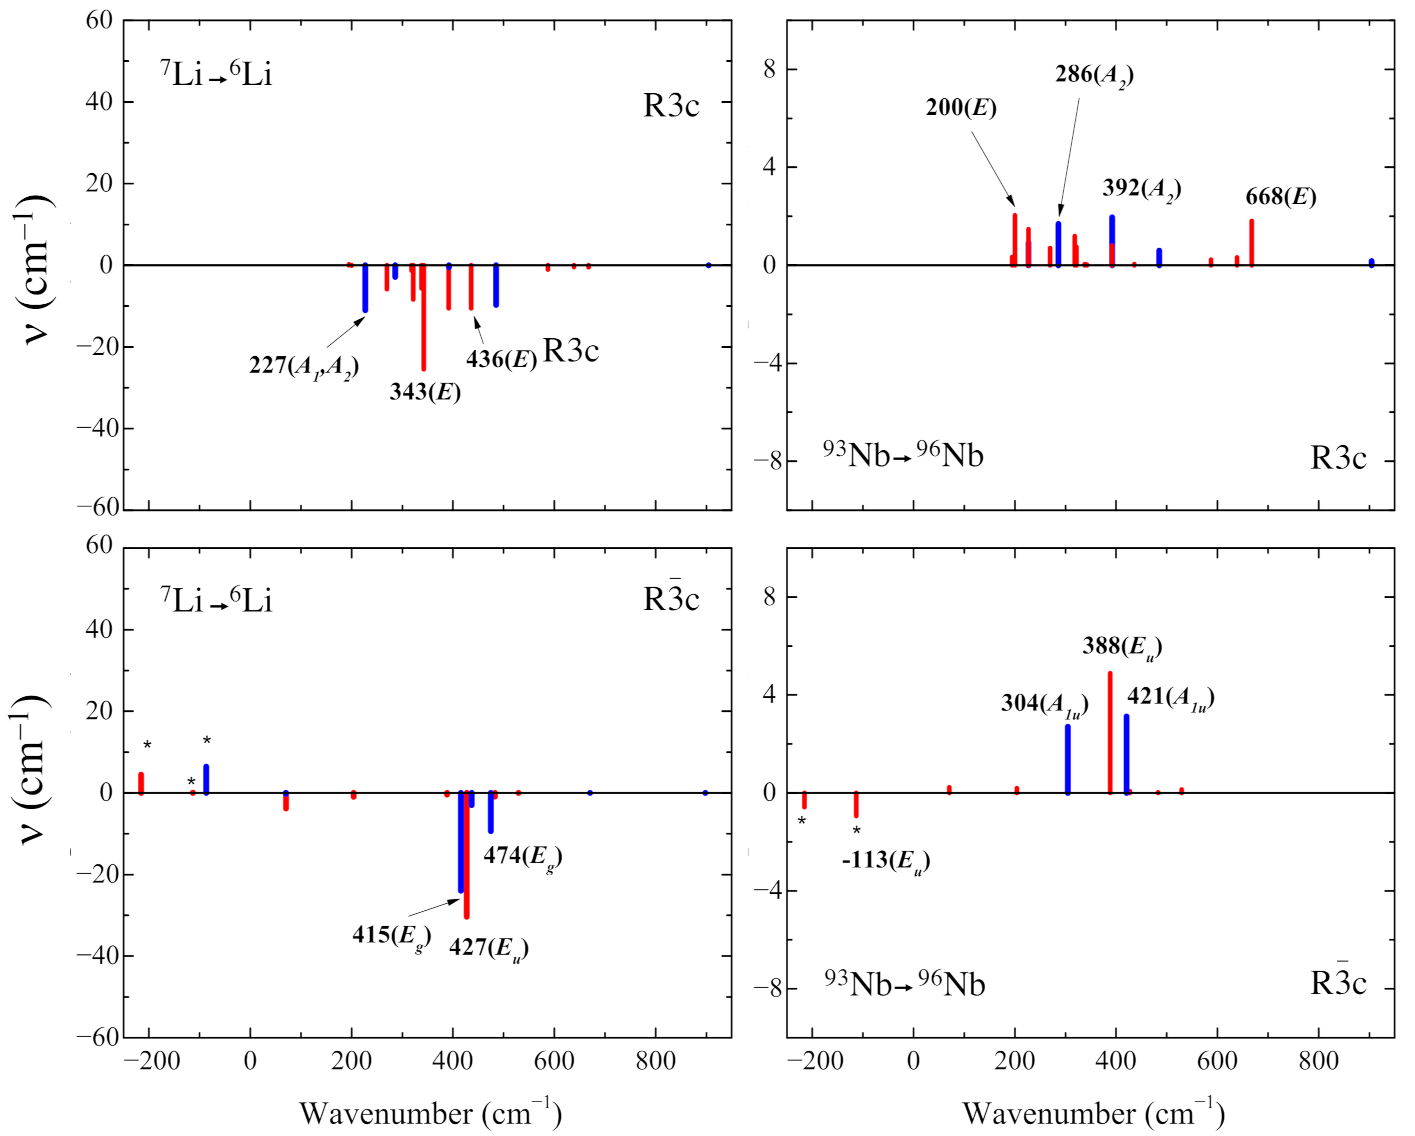
Effect of the isotopic substitutions Li →Li (left panels) and Nb→Nb (right panels) for the stable ferroelectric phase (top panels) and not stable paraelectric phase (bottom panels). The horizontal axis reports the wavenumbers obtained with the standard isotopes as in Figure 2; the vertical axis is the shift due to the isotopic substitution. Asterisks indicate imaginary wavenumbers. Blue bars represent modes not detectable in the spectra because they are IR-forbidden for symmetry. The symmetry of the modes is given in brackets.
In the R3c polymorph, the following six modes are the ones with the largest shift as a consequence of the Li →Li substitution: two modes at 227 cm (the two eigenvalues have a few decimals of difference) with symmetry A and A (the latter is IR-inactive for symmetry and not detectable in the vibrational spectrum). The two couples of doubly degenerate E modes are at 343 cm and 436 cm. These shifts are well depicted in the top-left panel of Figure 4 and Figure 5 and they are negative according to Equation (2). In the same polymorph the Nb →Nb change produces a minor shift with respect to the lithium case. The six Nb modes are the double degenerate E modes at 200 and 668 cm and the IR-inactive A modes at 286 and 392 cm. Note that in this case the mass is increasing, and then the shift has the opposite sign with respect to the Li case.
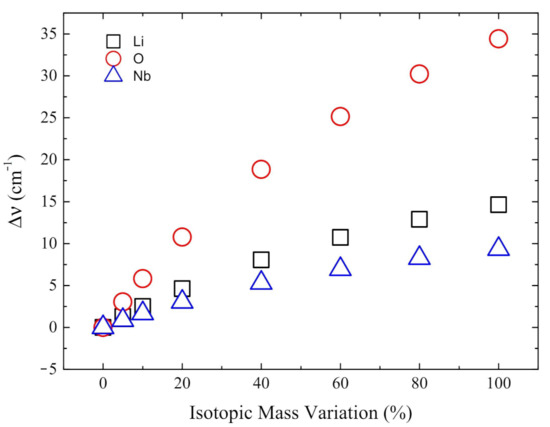
Figure 5.
Analysis of the mode with imaginary wavenumber i215 cm of the paraelectric phase. In the horizontal axis the percentage increase of the mass of lithium (black square), oxygen (red circle) and niobium (blue triangle) is reported. On the y-axis the resulting wavenumbers difference are shown.
In the case of the Rc polymorph, the largest shifts are the two double degenerate modes E at 415 and 474 cm and one double degenerate E mode at 427 cm when the Li →Li substitution is performed. When the Nb mass is increased (Nb →Nb) the modes with the largest shifts are the two double degenerate E modes at −113 and 388 cm, and the two modes of A symmetry at 304 and 421 cm.
The previous lines show that the mode at i215 cm is not one of the six with the largest Li and Nb isotopic shift. We investigated then specifically the effect of increasing the mass (up to 100%) of oxygen, as well as lithium and niobium, on the wavenumber of this mode. Figure 5 shows that the largest shift in the wavenumber is obtained when the oxygen mass is altered.
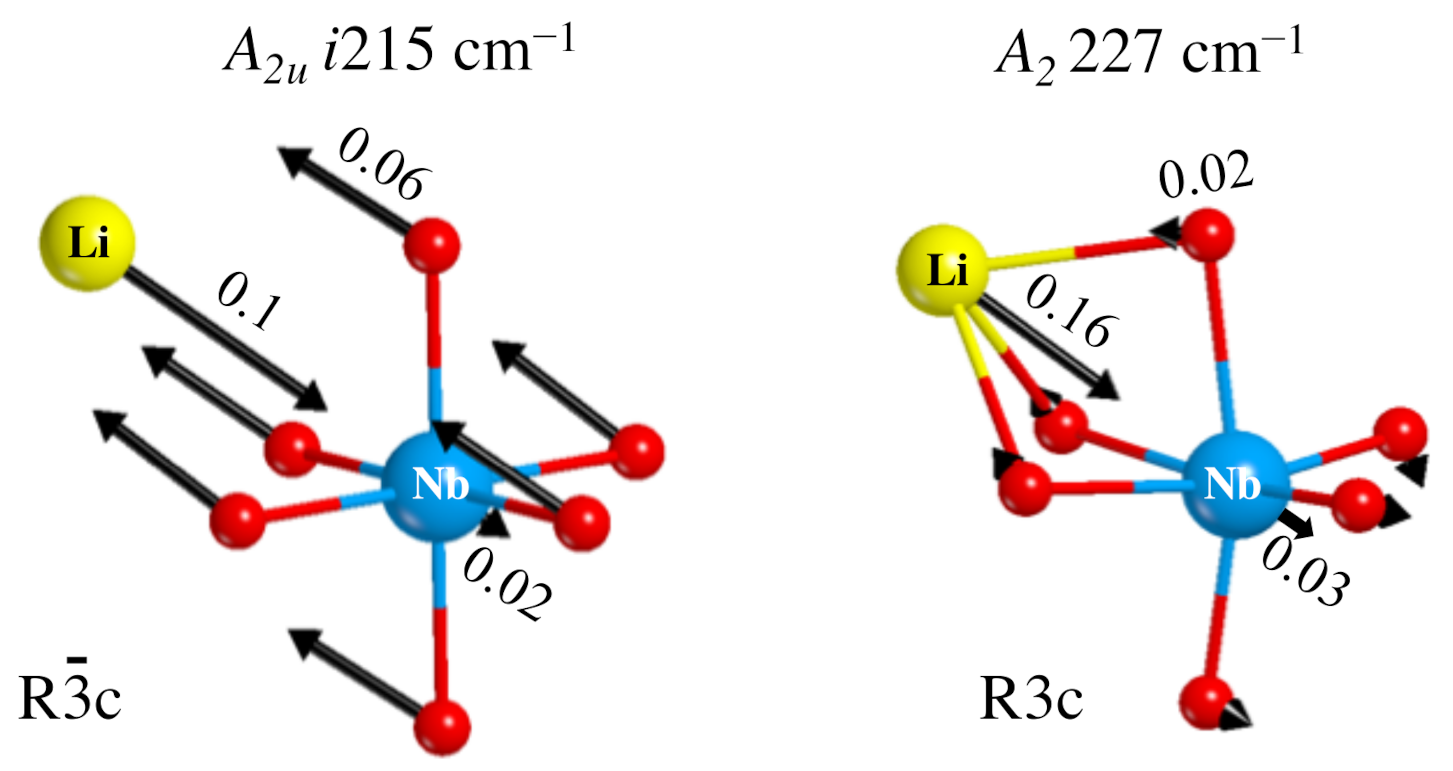
Figure 6, to the left, shows the components of the A eigenvector, with a large displacement of the oxygen atoms, and a consequent deformation of the octahedron. The Li movement in the opposite direction maintains the center of mass invariant.

Figure 6.
Representation of the i215 cm mode in the paraelectric phase (left) and the corresponding mode at 227 cm of the ferroelectric phase (right). The numbers on the arrows are the atomic displacements (in Bohr) at the classical amplitude.
A final question can be asked, concerning the transformation of the i215 cm mode in going from the PE to the FE phase. When symmetry reduces, the A irreducible representation becomes A. Following the transformation step by step, it has been possible to connect the mode at i215 cm to the one at +227 cm, shown to the right of Figure 6. In this case only the Li atom is moving, and the dipole variation is much smaller than for the imaginary mode, so that the intensity of this mode in the FE structure is much smaller than the one of the i215 cm mode.
4. Conclusions
Two polymorphs of LiNbO have been investigated, and their structural, electronic and vibrational properties analyzed. The principal results of this investigation can be summarized as follows:
- The global hybrid B3LYP calculations reproduce accurately the crystallographic data proposed in the literature, with a small underestimation of the cell parameters and the vibrational features [48]. The R3c system is a non-centro-symmetric structure with a large octahedral distortion due to the Jahn–Teller effect. The Rc centro-symmetric form has a perfect octahedral structure, in which the niobium atoms coordinate six equivalent oxygen atoms.
- The R3c polymorph is more stable than Rc by about 0.32 eV.
- The infrared spectra characterizing the two systems are quite different. The R3c one is dominated by four main peaks at 200, 319, 588 and 639 cm. The mode at 904 cm is not visible in the spectrum because it is IR-inactive for symmetry reasons (A symmetry).In addition, the R spectrum presents four main peaks, spanning from 388 and 529 cm, with other minor features. As for the R3c system, the highest vibration at 898 cm is not visible in the IR spectrum (A symmetry).When comparing the set of vibrational modes of the two structures, the only clearly common mode is the highest one, at 904 cm for Rc and just 6 cm redshifted in Rc.
- The Rc spectrum is characterized by four imaginary eigenvalues, indicating a geometrical instability. At 0 K this structure is then unstable with respect to many Cartesian coordinates. Scanning the PES along the vibrational modes with imaginary wavenumbers it turns out that all of them present a double minimum around the common maximum of the PE structure. However, the minima of the mode with the i215 cm wavenumber are much deeper than the minima of the three other modes. This A mode is the channel for the PE to FE transition.
- The isotopic substitution shows that the i215 cm is mainly contributed by oxygen, as the graphical animation of the mode confirms.
In summary, the paraelectric to ferroelectric transition involves all the atoms in the cell. However, a single coordinate, the A mode with the i215 cm wavenumber, can describe most of the displacements occurring in the phase transition.
Author Contributions
Conceptualization, R.D. (Roberto Dovesi) and F.S.G.; methodology, R.D. (Roberto Dovesi); software, F.P. and R.D. (Roberto Dovesi); validation, R.D. (Roberto Dovesi), F.S.G.; formal analysis, R.D. (Roberto Dovesi) F.S.G. and A.P.; investigation, F.S.G.; resources, R.D. (Rosita Diana); data curation, F.S.G.; writing—original draft preparation, R.D. (Roberto Dovesi) and F.S.G.; writing—review and editing, R.D. (Rosita Diana), B.P. and U.C.; visualization, A.P. and F.P.; supervision, R.D. (Roberto Dovesi); project administration, R.D. (Rosita Diana), B.P. and U.C. All authors have read and agreed to the published version of the manuscript.
Funding
This research received no external funding.
Acknowledgments
FSG acknowledges the CINECA award under the ISCRA initiative (HP10BJO47B) for the availability of high-performance computing resources and support.
Conflicts of Interest
The authors declare no conflict of interest.
References
- Belik, A.A.; Furubayashi, T.; Yusa, H.; Takayama-Muromachi, E. Perovskite, LiNbO3, Corundum, and Hexagonal Polymorphs of (In1–x M x) MO3. J. Am. Chem. Soc. 2011, 133, 9405–9412. [Google Scholar] [CrossRef] [PubMed]
- Xue, D.; He, X. Dopant Occupancy and Structural Stability of Doped Lithium Niobate Crystals. Phys. Rev. B 2006, 73, 064113. [Google Scholar] [CrossRef]
- Choubey, R.; Sen, P.; Sen, P.; Bhatt, R.; Kar, S.; Shukla, V.; Bartwal, K. Optical Properties of MgO Doped LiNbO3 Single Crystals. Opt. Mater. 2006, 28, 467–472. [Google Scholar] [CrossRef]
- Beyer, O.; Breunig, I.; Kalkum, F.; Buse, K. Photorefractive Effect in Iron-Doped Lithium Niobate Crystals Induced by Femtosecond Pulses of 1.5 μm Wavelength. Appl. Phys. Lett. 2006, 88, 051120. [Google Scholar] [CrossRef]
- Yang, G.; Kong, Y.; Hou, W.; Yan, Q. Heating Behavior and Crystal Growth Mechanism in Microwave Field. J. Phys. Chem. B 2005, 109, 1371–1379. [Google Scholar] [CrossRef]
- Yu, B.; Cao, B.; Cao, H.; Zhang, X.; Chen, D.; Qu, J.; Niu, H. Synthesis and Nonlinear Optical Properties of Single-Crystalline KNb3O8 Nanowires. Nanotechnology 2013, 24, 085704. [Google Scholar] [CrossRef]
- Oikawa, S.; Kawanishi, T.; Higuma, K.; Matsuo, Y.; Izutsu, M. Double-Stub Structure for Resonant-Type Optical Modulators Using 20-μm-Thick Electrode. IEEE Photonics Technol. Lett. 2003, 15, 221–223. [Google Scholar] [CrossRef]
- Ali, R.F.; Gates, B.D. Synthesis of Lithium Niobate Nanocrystals with Size Focusing Through an Ostwald Ripening Process. Chem. Mater. 2018, 30, 2028–2035. [Google Scholar] [CrossRef] [Green Version]
- Hernández-Molina, R.; Hernández-Márquez, J.; Enríquez-Carrejo, J.; Farias-Mancilla, J.; Mani-González, P.; Vigueras Santiago, E.; Rodríguez-Aranda, M.; Vargas-Ortíz, A.; Yáñez-Limón, J. Synthesis by Wet Chemistry and Characterization of LiNbO3 Nanoparticles. Superficies y Vacío 2015, 28, 115–118. [Google Scholar]
- Dutto, F.; Raillon, C.; Schenk, K.; Radenovic, A. Nonlinear Optical Response in Single Alkaline Niobate Nanowires. Nano Lett. 2011, 11, 2517–2521. [Google Scholar] [CrossRef] [Green Version]
- Araujo, R.M.; Valerio, M.E.; Jackson, R.A. Computer Modelling of Hafnium Doping in Lithium Niobate. Crystals 2018, 8, 123. [Google Scholar] [CrossRef] [Green Version]
- Mamoun, S.; Merad, A.; Guilbert, L. Energy Band Gap and Optical Properties of Lithium Niobate from Ab Initio Calculations. Comput. Mater. Sci. 2013, 79, 125–131. [Google Scholar] [CrossRef]
- Young, S.M.; Zheng, F.; Rappe, A.M. First-Principles Materials Design of High-Performing Bulk Photovoltaics with the LiNbO3 Structure. Phys. Rev. Appl. 2015, 4, 054004. [Google Scholar] [CrossRef] [Green Version]
- Dovesi, R.; Erba, A.; Orlando, R.; Zicovich-Wilson, C.M.; Civalleri, B.; Maschio, L.; Re´rat, M.; Casassa, S.; Baima, J.; Salustro, S.; et al. Quantum-Mechanical Condensed Matter Simulations with CRYSTAL. Wires 2018, 8, e1360. [Google Scholar] [CrossRef]
- Dovesi, R.; Pascale, F.; Civalleri, B.; Doll, K.; Harrison, N.M.; Bush, I.; D’arco, P.; Noël, Y.; Rérat, M.; Carbonniere, P.; et al. The CRYSTAL Code, 1976–2020 and Beyond, a Long Story. J. Chem. Phys. 2020, 152, 204111. [Google Scholar] [CrossRef]
- Becke, A.D. Density-Functional Thermochemistry. III. The Role of Exact Exchange. J. Chem. Phys. 1993, 98, 5648–5652. [Google Scholar] [CrossRef] [Green Version]
- Lee, C.; Yang, W.; Parr, R. Development of the Colle-Salvetti Correlation-Energy Formula Into a Functional of the Electron Density. Phys. Rev. B 1988, 37, 785–789. [Google Scholar] [CrossRef] [Green Version]
- Dovesi, R.; Saunders, V.; Roetti, C.; Orlando, R.; Zicovich-Wilson, C.; Pascale, F.; Civalleri, B.; Doll, K.; Harrison, N.; Bush, I.; et al. CRYSTAL17 User’s Manual. Manuals/crystal17.pdf. 2017. Available online: http://www.crystal.unito.it (accessed on 1 August 2021).
- Vilela Oliveira, D.; Laun, J.; Peintinger, M.F.; Bredow, T. BSSE-Correction Scheme for Consistent Gaussian Basis Sets of Double-and Triple-Zeta Valence with Polarization Quality for Solid-State Calculations. J. Comput. Chem. 2019, 40, 2364–2376. [Google Scholar] [CrossRef]
- Gentile, F.S.; Pannico, M.; Causà, M.; Mensitieri, G.; Di Palma, G.; Scherillo, G.; Musto, P. Metal Defects in HKUST-1 MOF Revealed by Vibrational Spectroscopy: A Combined Quantum Mechanical and Experimental Study. J. Mater. Chem. A 2020, 8, 10796–10812. [Google Scholar] [CrossRef]
- Gage, S.H.; Ngo, C.; Molinari, V.; Causa, M.; Richards, R.M.; Gentile, F.S.; Pylypenko, S.; Esposito, D. Strong Metal–Support Interactions of TiN–and TiO2–Nickel Nanocomposite Catalysts. J. Phys. Chem. C 2018, 122, 339–348. [Google Scholar] [CrossRef]
- Gentile, F.S.; Mackrodt, W.C.; Allan, N.L.; Dovesi, R. Predicted Strong Spin-Phonon Interactions in Li-Doped Diamond. Phys. Chem. Chem. Phys. 2020, 22, 20612–20617. [Google Scholar] [CrossRef]
- Mackrodt, W.C.; Rérat, M.; Gentile, F.S.; Dovesi, R. An All-Electron Study of the Low-Lying Excited States and Optical Constants of Al2O3 in the Range 5–80 eV. J. Phys. Condens. Matter 2019, 32, 085901. [Google Scholar] [CrossRef] [PubMed]
- Gentile, F.S.; Salustro, S.; Desmarais, J.K.; Ferrari, A.M.; D’Arco, P.; Dovesi, R. Vibrational Spectroscopy of Hydrogens in Diamond: A Quantum Mechanical Treatment. Phys. Chem. Chem. Phys. 2018, 20, 11930–11940. [Google Scholar] [CrossRef] [PubMed] [Green Version]
- Di Palma, G.; Kirtman, B.; Gentile, F.S.; Platonenko, A.; Ferrari, A.M.; Dovesi, R. The VN2 Negatively Charged Defect in Diamond. A Quantum Mechanical Investigation of the EPR Response. Carbon 2020, 159, 443–450. [Google Scholar] [CrossRef]
- Causa, M.; D’Amore, M.; Garzillo, C.; Gentile, F.; Savin, A. The Bond Analysis Techniques (ELF and Maximum Probability Domains) Application to a Family of Models Relevant to Bio-Inorganic Chemistry. Struct. Bond 2013, 150, 119–142. [Google Scholar]
- Salustro, S.; Gentile, F.S.; D’Arco, P.; Civalleri, B.; Rérat, M.; Dovesi, R. Hydrogen Atoms in the Diamond Vacancy Defect. A Quantum Mechanical Vibrational Analysis. Carbon 2018, 129, 349–356. [Google Scholar] [CrossRef]
- Salustro, S.; Gentile, F.S.; Erba, A.; Carbonniére, P.; El-Kelany, K.; Dovesi, R. The Characterization of the VNxHy Defects in Diamond through the Infrared Vibrational Spectrum. A Quantum Mechanical Investigation. Carbon 2018, 132, 210–219. [Google Scholar] [CrossRef]
- Ferrari, A.; Salustro, S.; Gentile, F.; Mackrodt, W.; Dovesi, R. Substitutional Nitrogen Atom in Diamond. A Quantum Mechanical Investigation of the Electronic and Spectroscopic Properties. Carbon 2018, 134, 354–365. [Google Scholar] [CrossRef] [Green Version]
- Gentile, F.; Salustro, S.; Di Palma, G.; Causá, M.; D’arco, P.; Dovesi, R. Hydrogen, Boron and Nitrogen Atoms in Diamond: A Quantum Mechanical Vibrational Analysis. Theor. Chem. Acc. 2018, 137, 154. [Google Scholar] [CrossRef] [Green Version]
- Di Palma, G.; Gentile, F.S.; Lacivita, V.; Mackrodt, W.; Dovesi, R. N 2 positively charged defects in diamond. A Quantum Mechanical investigation of the structural, electronic, EPR and vibrational properties. J. Mater. Chem. C 2020, 8, 5239–5247. [Google Scholar] [CrossRef]
- Becke, A.D. A Multicenter Numerical Integration Scheme for Polyatomic Molecules. J. Chem. Phys. 1988, 88, 2547–2553. [Google Scholar] [CrossRef]
- Monkhorst, H.J.; Pack, J.D. Special Points for Brillouin-Zone Integrations. Phys. Rev. B 1976, 13, 5188. [Google Scholar] [CrossRef]
- Pascale, F.; Zicovich-Wilson, C.M.; Gejo, F.L.; Civalleri, B.; Orlando, R.; Dovesi, R. The Calculation of the Vibrational Frequencies of the Crystalline Compounds and Its Implementation in the CRYSTAL Code. J. Comput. Chem. 2004, 25, 888–897. [Google Scholar] [CrossRef]
- Dall’Olio, S.; Dovesi, R.; Resta, R. Spontaneous Polarization as a Berry Phase of the Hartree-Fock Wavefunction: The Case of KNbO3. Phys. Rev. B 1997, 56, 10105–10114. [Google Scholar] [CrossRef]
- King-Smith, R.; Vanderbilt, D. First-Principles Investigation of Ferroelectricity in Perovskite Compounds. Phys. Rev. B 1994, 49, 5828. [Google Scholar] [CrossRef]
- Kumada, N.; Kinomura, N.; Muto, F. Crystal Structures of Ilmenite Type LiNbO3 and NaNbO3. J. Ceram. Soc. Jpn. 1990, 98, 384–388. [Google Scholar] [CrossRef] [Green Version]
- Boysen, H.; Altorfer, F. A Neutron Powder Investigation of the High-Temperature Structure and Phase Transition in LiNbO3. Acta Crystallogr. Sect. B Struct. Sci. 1994, 50, 405–414. [Google Scholar] [CrossRef]
- Lehnert, H.; Boysen, H.; Frey, F.; Hewat, A.; Radaelli, P. A Neutron Powder Investigation of the High-Temperature Structure and Phase Transition in Stoichiometric LiNbO3. Z.-Krist. Cryst. Mater. 1997, 212, 712–719. [Google Scholar] [CrossRef] [Green Version]
- Persson, K. Materials Data on LiNbO3 (SG:161) by Materials Project. 2014. Available online: https://materialsproject.org/materials/mp-3731/ (accessed on 7 September 2021). [CrossRef]
- Persson, K. Materials Data on LiNbO3 (SG:167) by Materials Project. 2014. Available online: https://materialsproject.org/materials/mp-552588/ (accessed on 7 September 2021). [CrossRef]
- Toyoura, K.; Ohta, M.; Nakamura, A.; Matsunaga, K. First-Principles Study on Phase Transition and Ferroelectricity in Lithium Niobate and Tantalate. J. Appl. Phys. 2015, 118, 064103. [Google Scholar] [CrossRef]
- Zhang, Z.G.; Abe, T.; Moriyoshi, C.; Tanaka, H.; Kuroiwa, Y. Study of Materials Structure Physics of Isomorphic LiNbO3 and LiTaO3 Ferroelectrics by Synchrotron Radiation X-Ray Diffraction. Jpn. J. Appl. Phys. 2018, 57, 11UB04. [Google Scholar] [CrossRef]
- Servoin, J.; Gervais, F. Soft Vibrational Mode in LiNbO3 and LiTaO3. Solid State Commun. 1979, 31, 387–391. [Google Scholar] [CrossRef]
- Inbar, I.; Cohen, R. Origin of Ferroelectricity in LiTaO3 and LiNbO3; LAPW Total energy Calculations. Ferroelectrics 1995, 164, 45–55. [Google Scholar] [CrossRef]
- Inbar, I.; Cohen, R. Comparison of the Electronic Structures and Energetics of Ferroelectric LiNbO3 and LiTaO3. Phys. Rev. B 1996, 53, 1193. [Google Scholar] [CrossRef] [PubMed] [Green Version]
- Caciuc, V.; Postnikov, A.; Borstel, G. Ab Initio Structure and Zone-Center Phonons in LiNbO3. Phys. Rev. B 2000, 61, 8806. [Google Scholar] [CrossRef]
- Nogueira, B.A.; Milani, A.; Castiglioni, C.; Fausto, R. The Correlation Between Experimental Polarized Raman Spectra and Their Density Functional Theory Prediction in the LCAO Framework: The R3c LiNbO3 Crystal as a Test Case. J. Raman Spectrosc. 2021, 52, 995–1010. [Google Scholar] [CrossRef]


Publisher’s Note: MDPI stays neutral with regard to jurisdictional claims in published maps and institutional affiliations. |
© 2021 by the authors. Licensee MDPI, Basel, Switzerland. This article is an open access article distributed under the terms and conditions of the Creative Commons Attribution (CC BY) license (https://creativecommons.org/licenses/by/4.0/).