
Model Test Study on Bearing Capacity and Deformation Characteristics of Symmetric Pile–Bucket Foundation Subjected to Cyclic Horizontal Load


Abstract
:1. Introduction
2. Model Test Setup
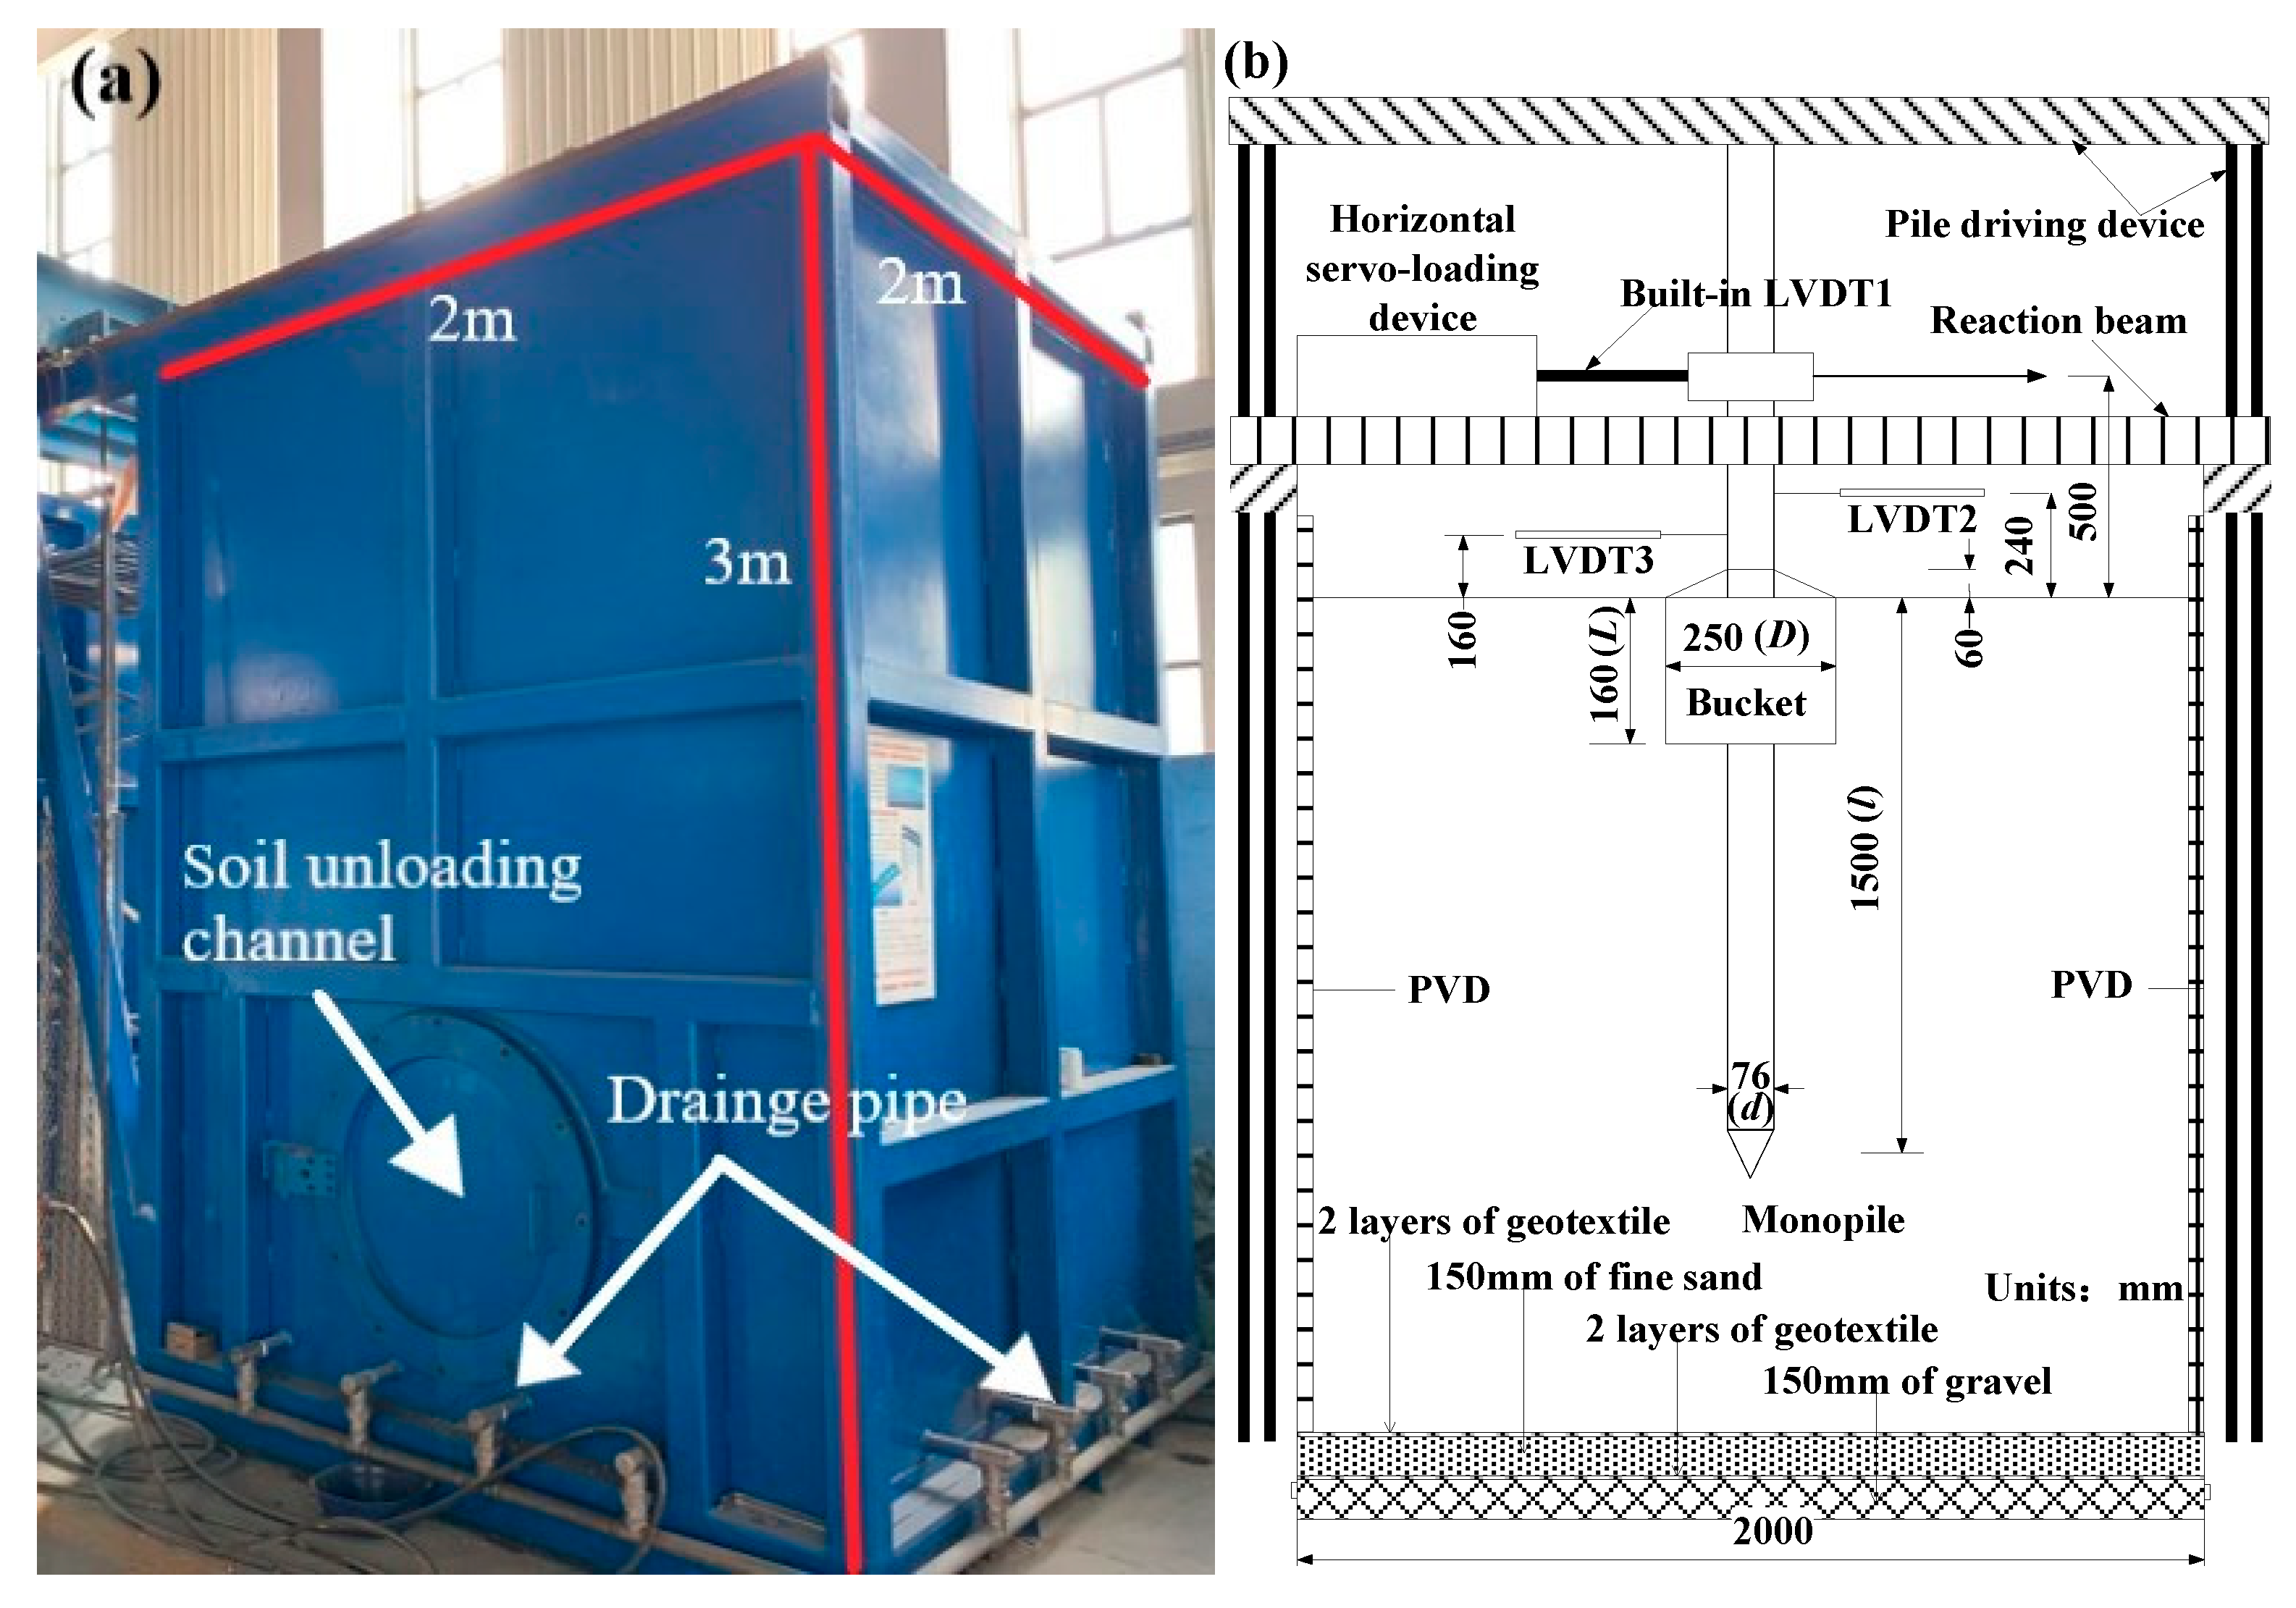
2.1. Model Box
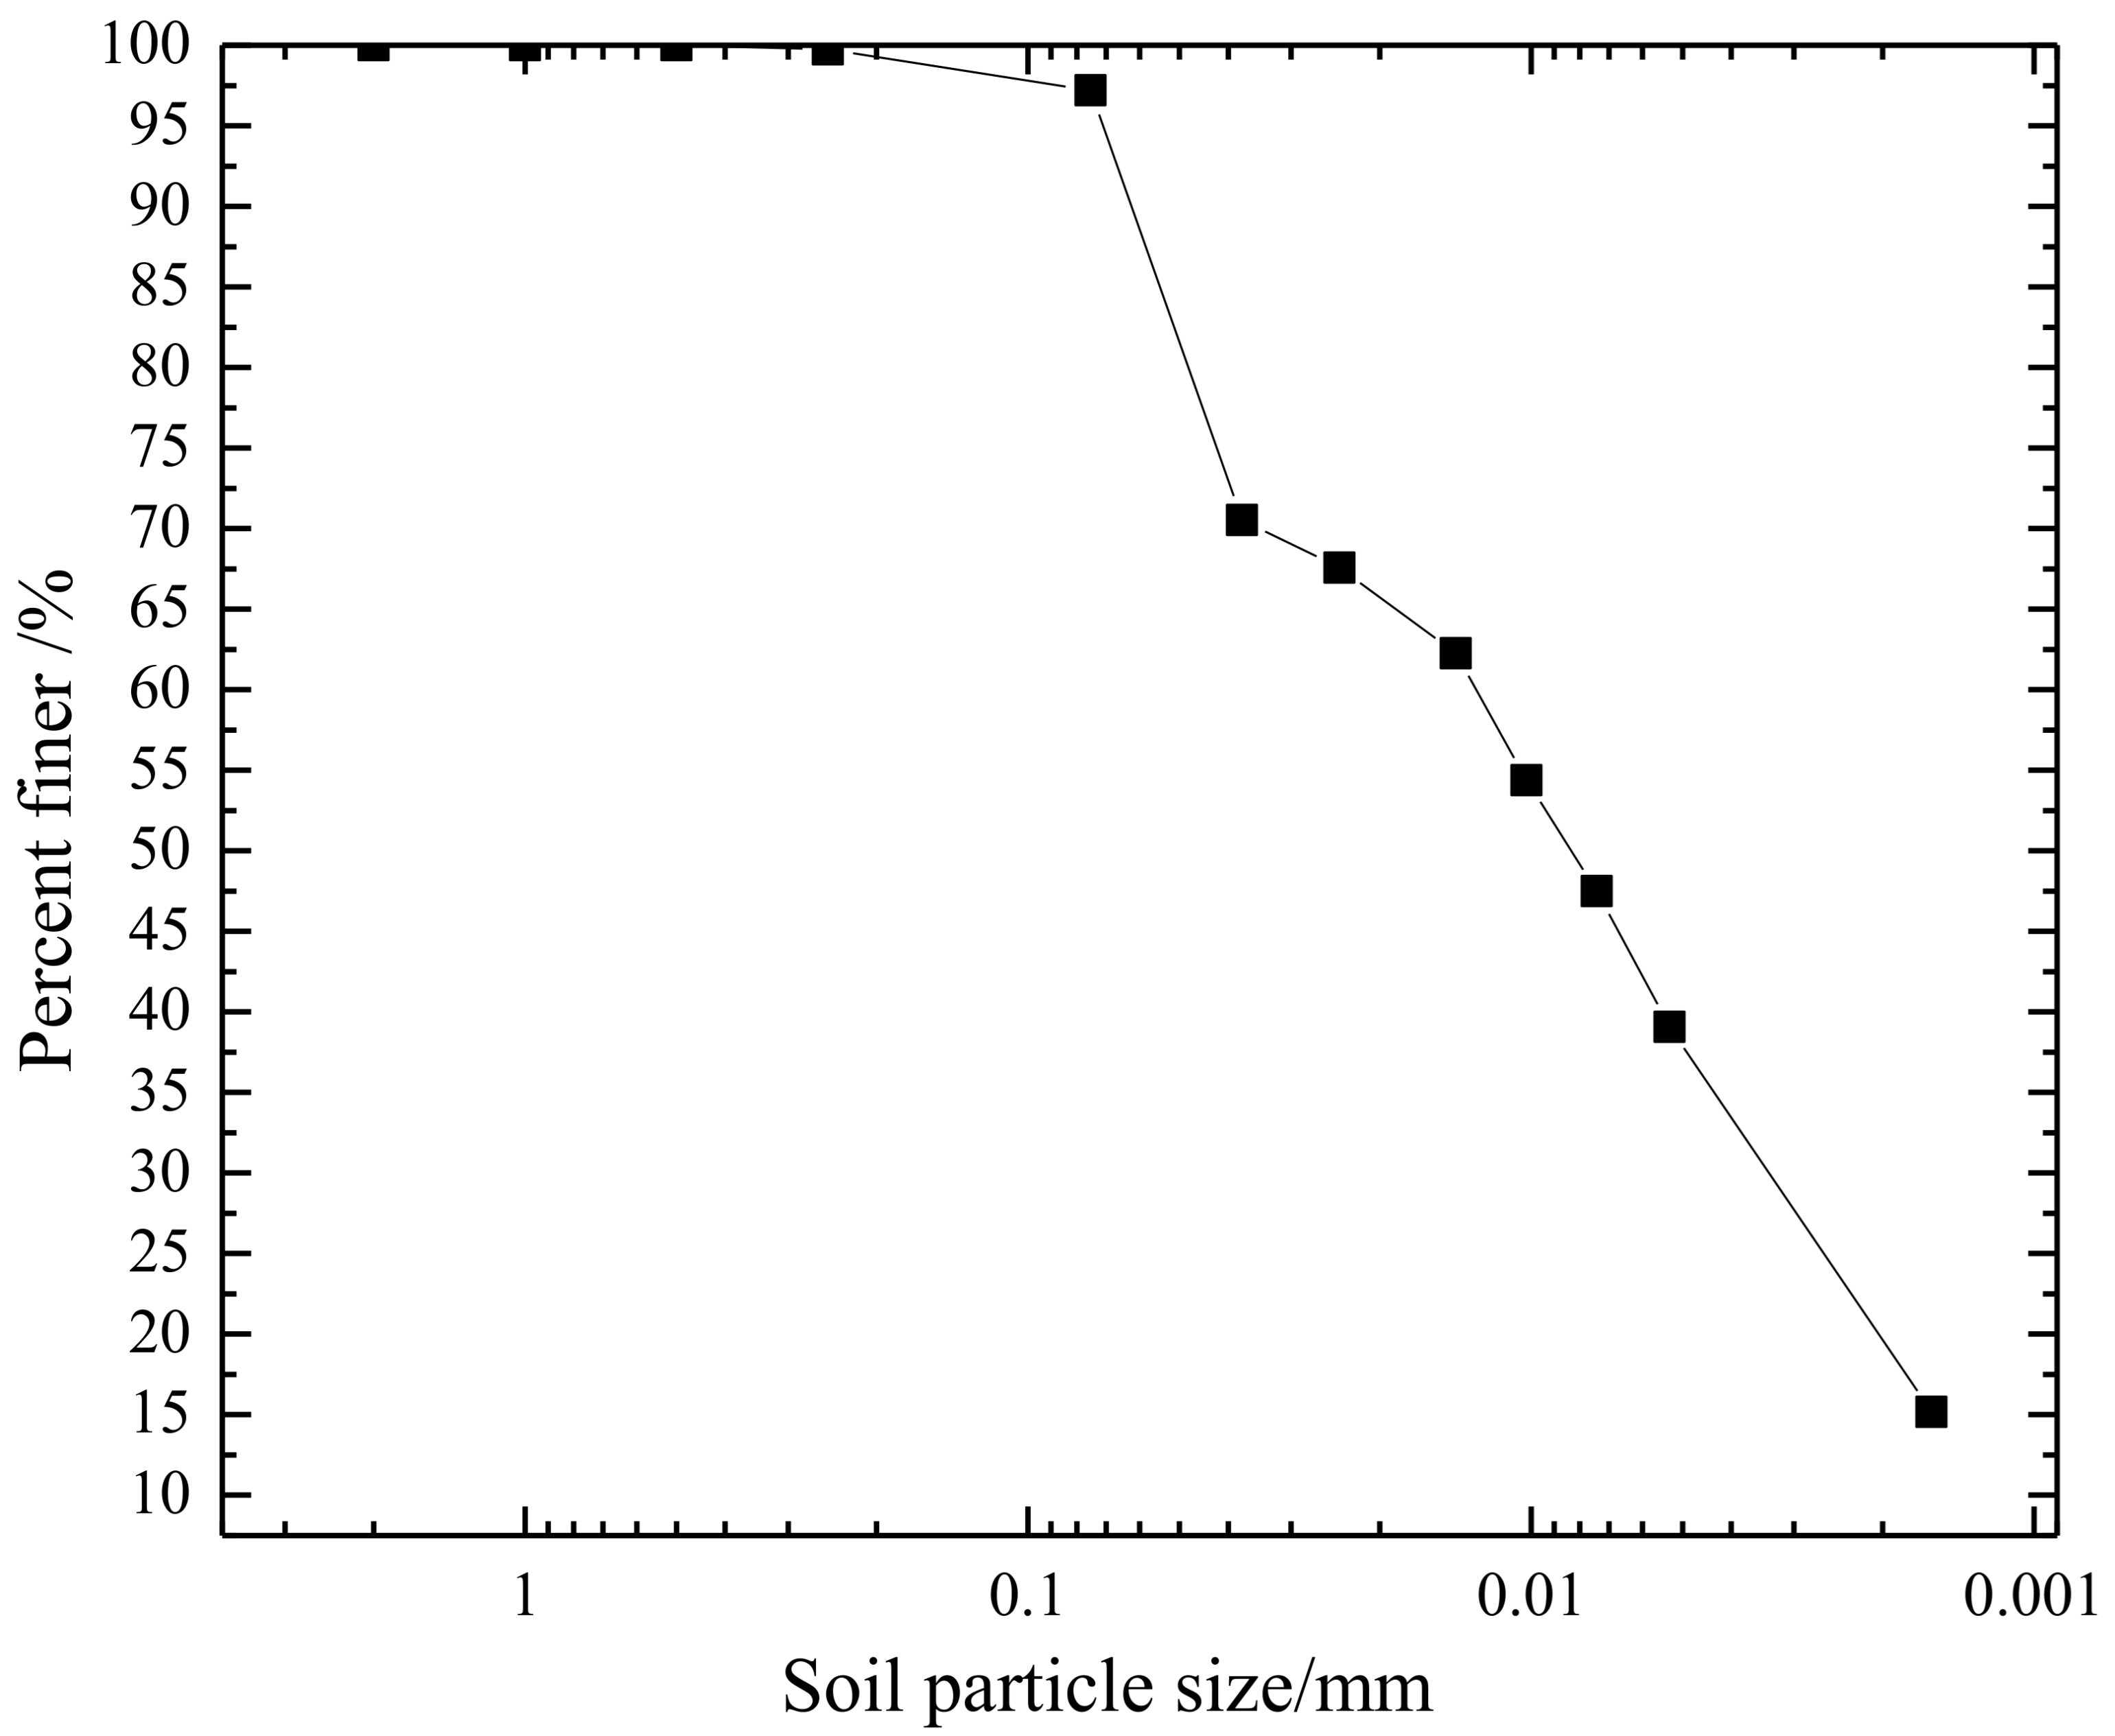
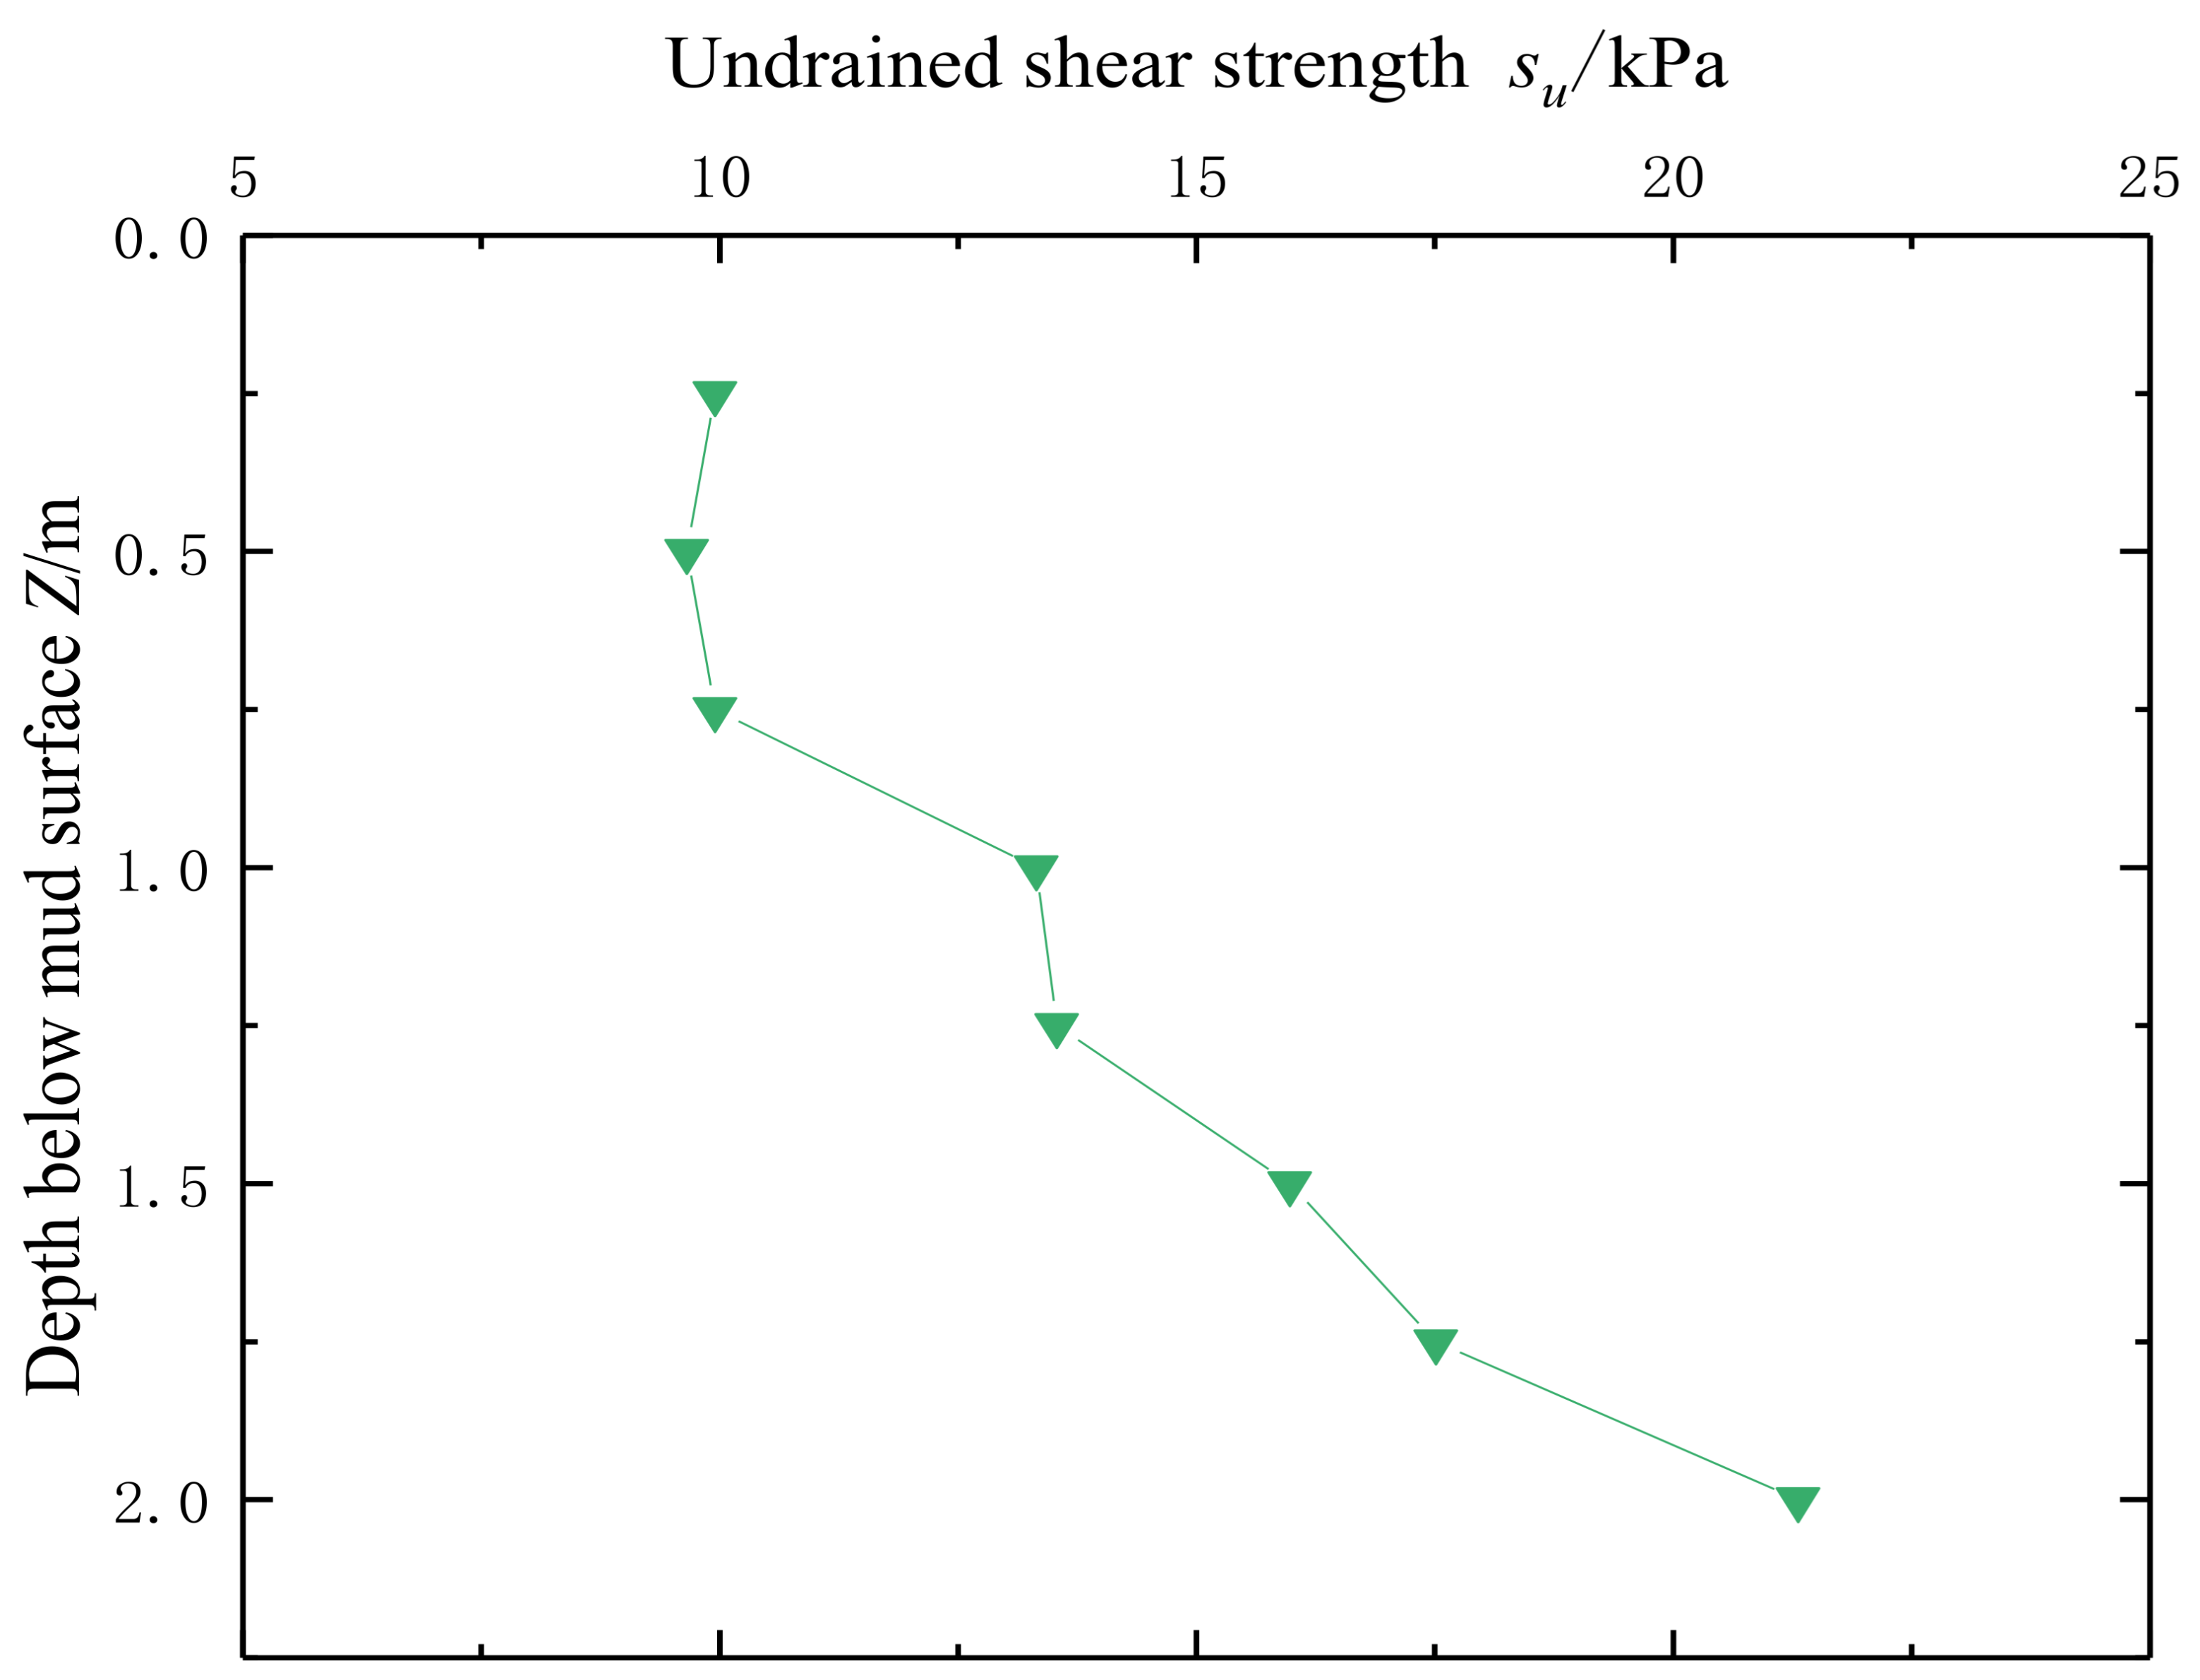
2.2. Test Soil
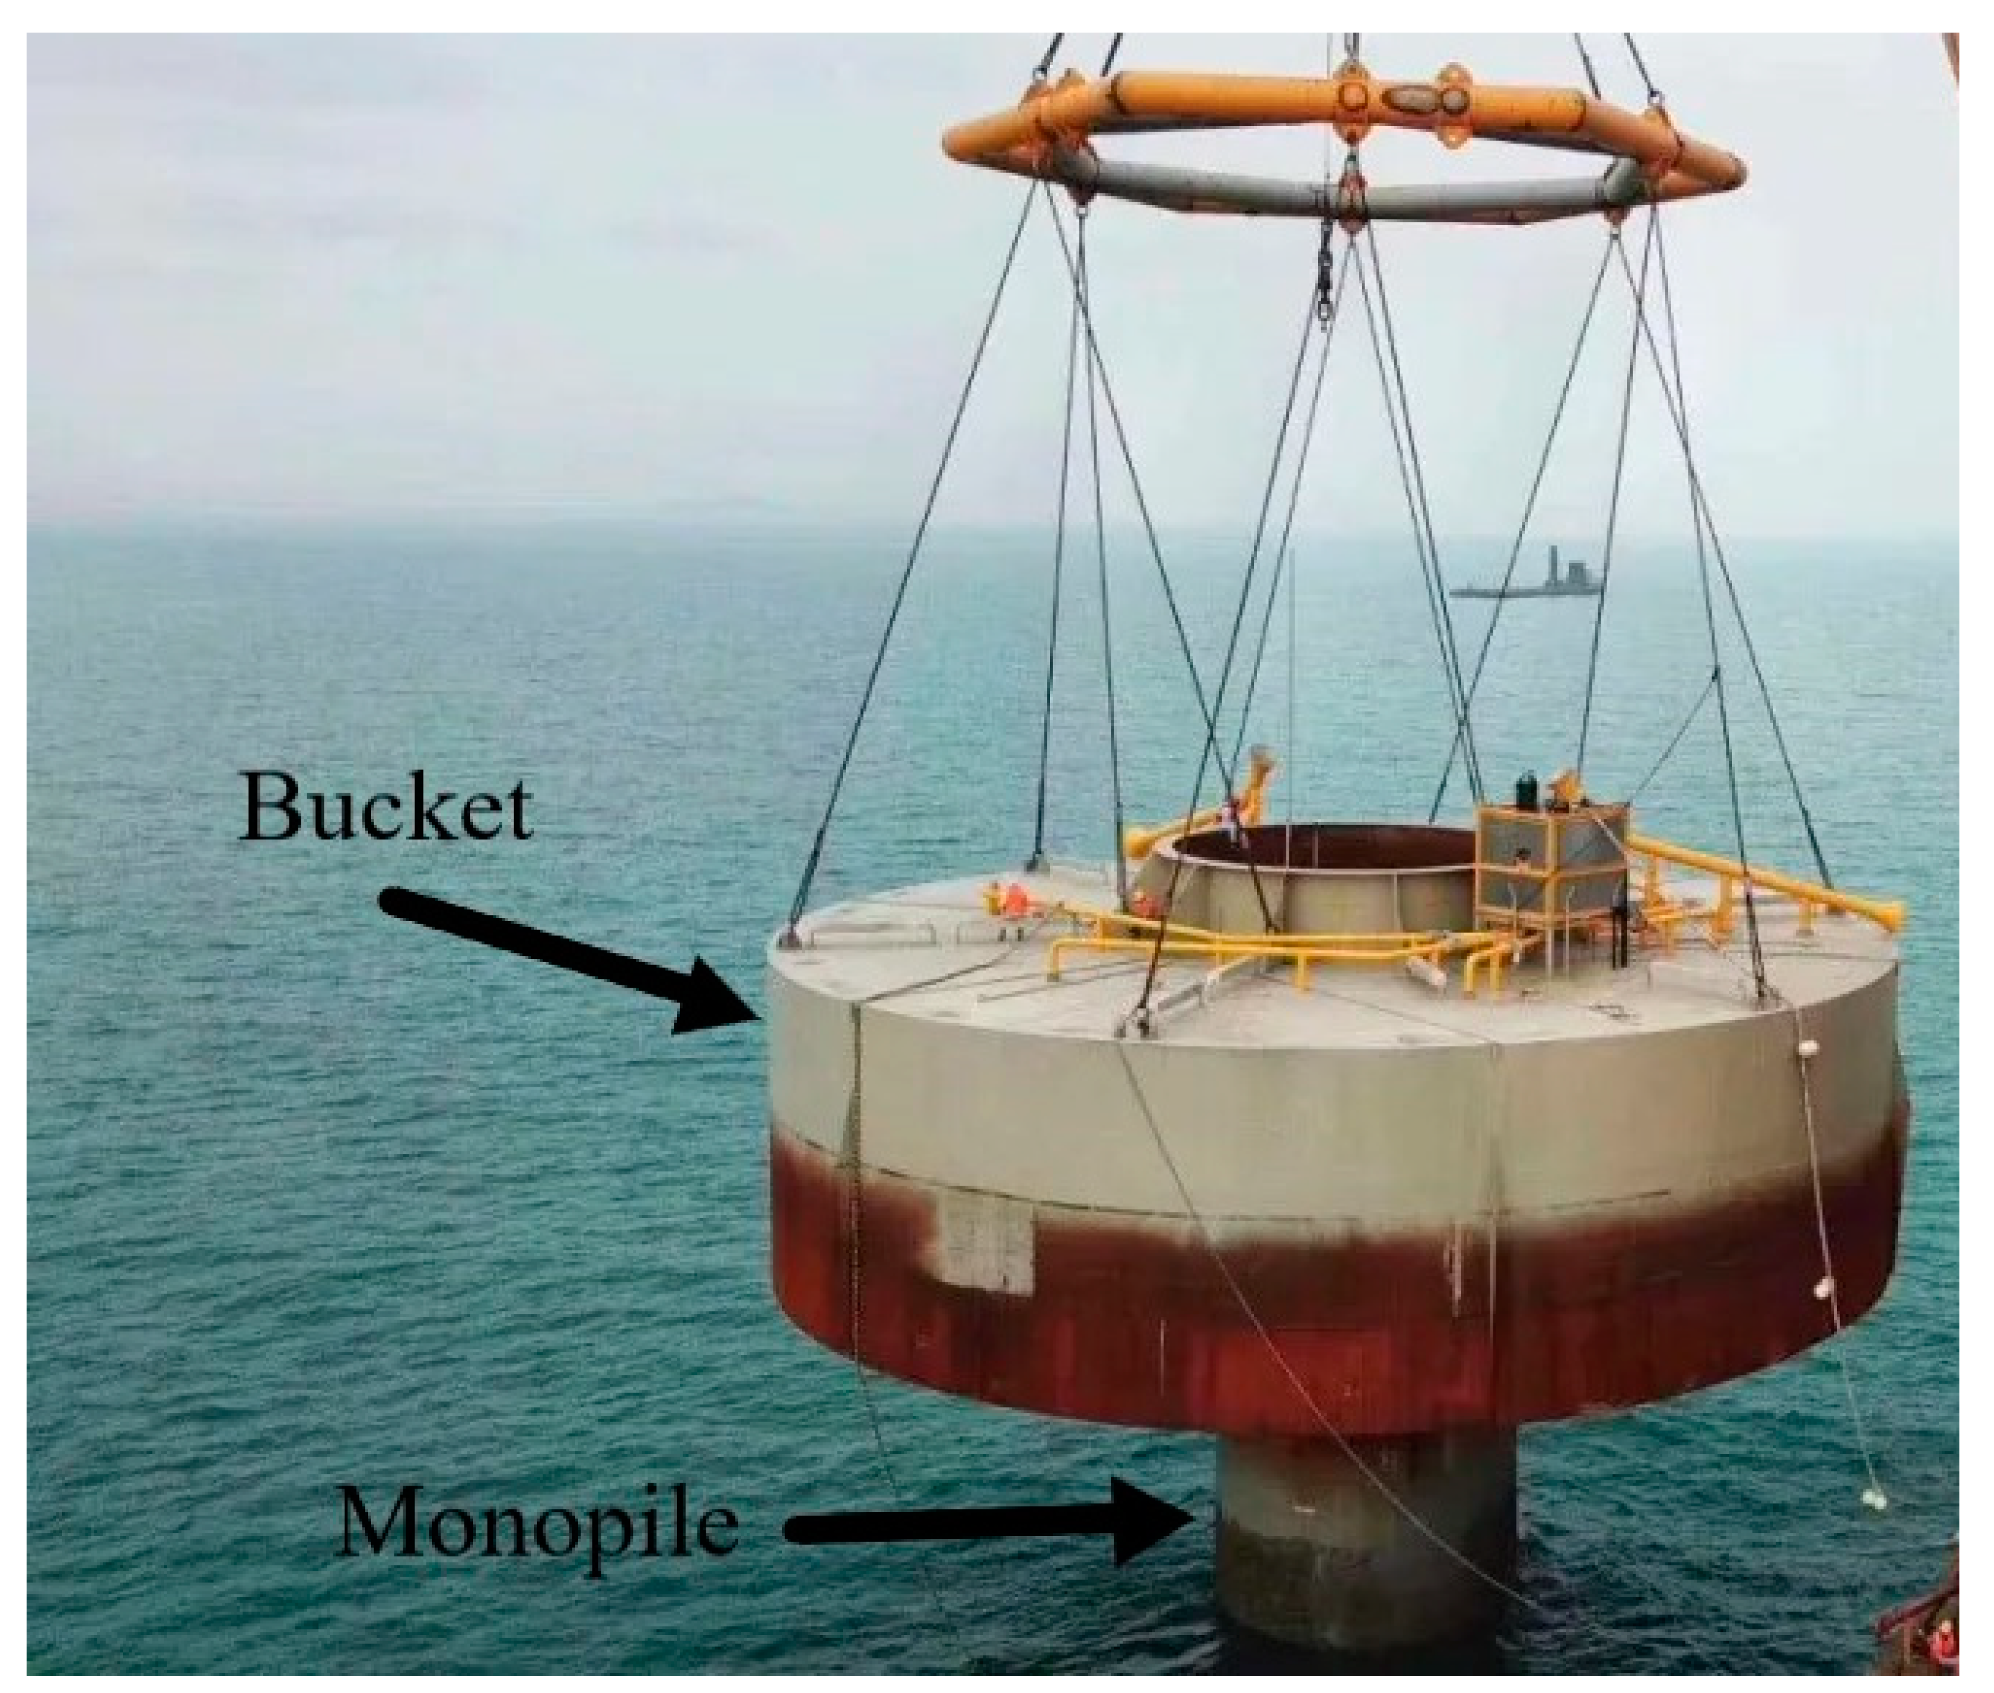
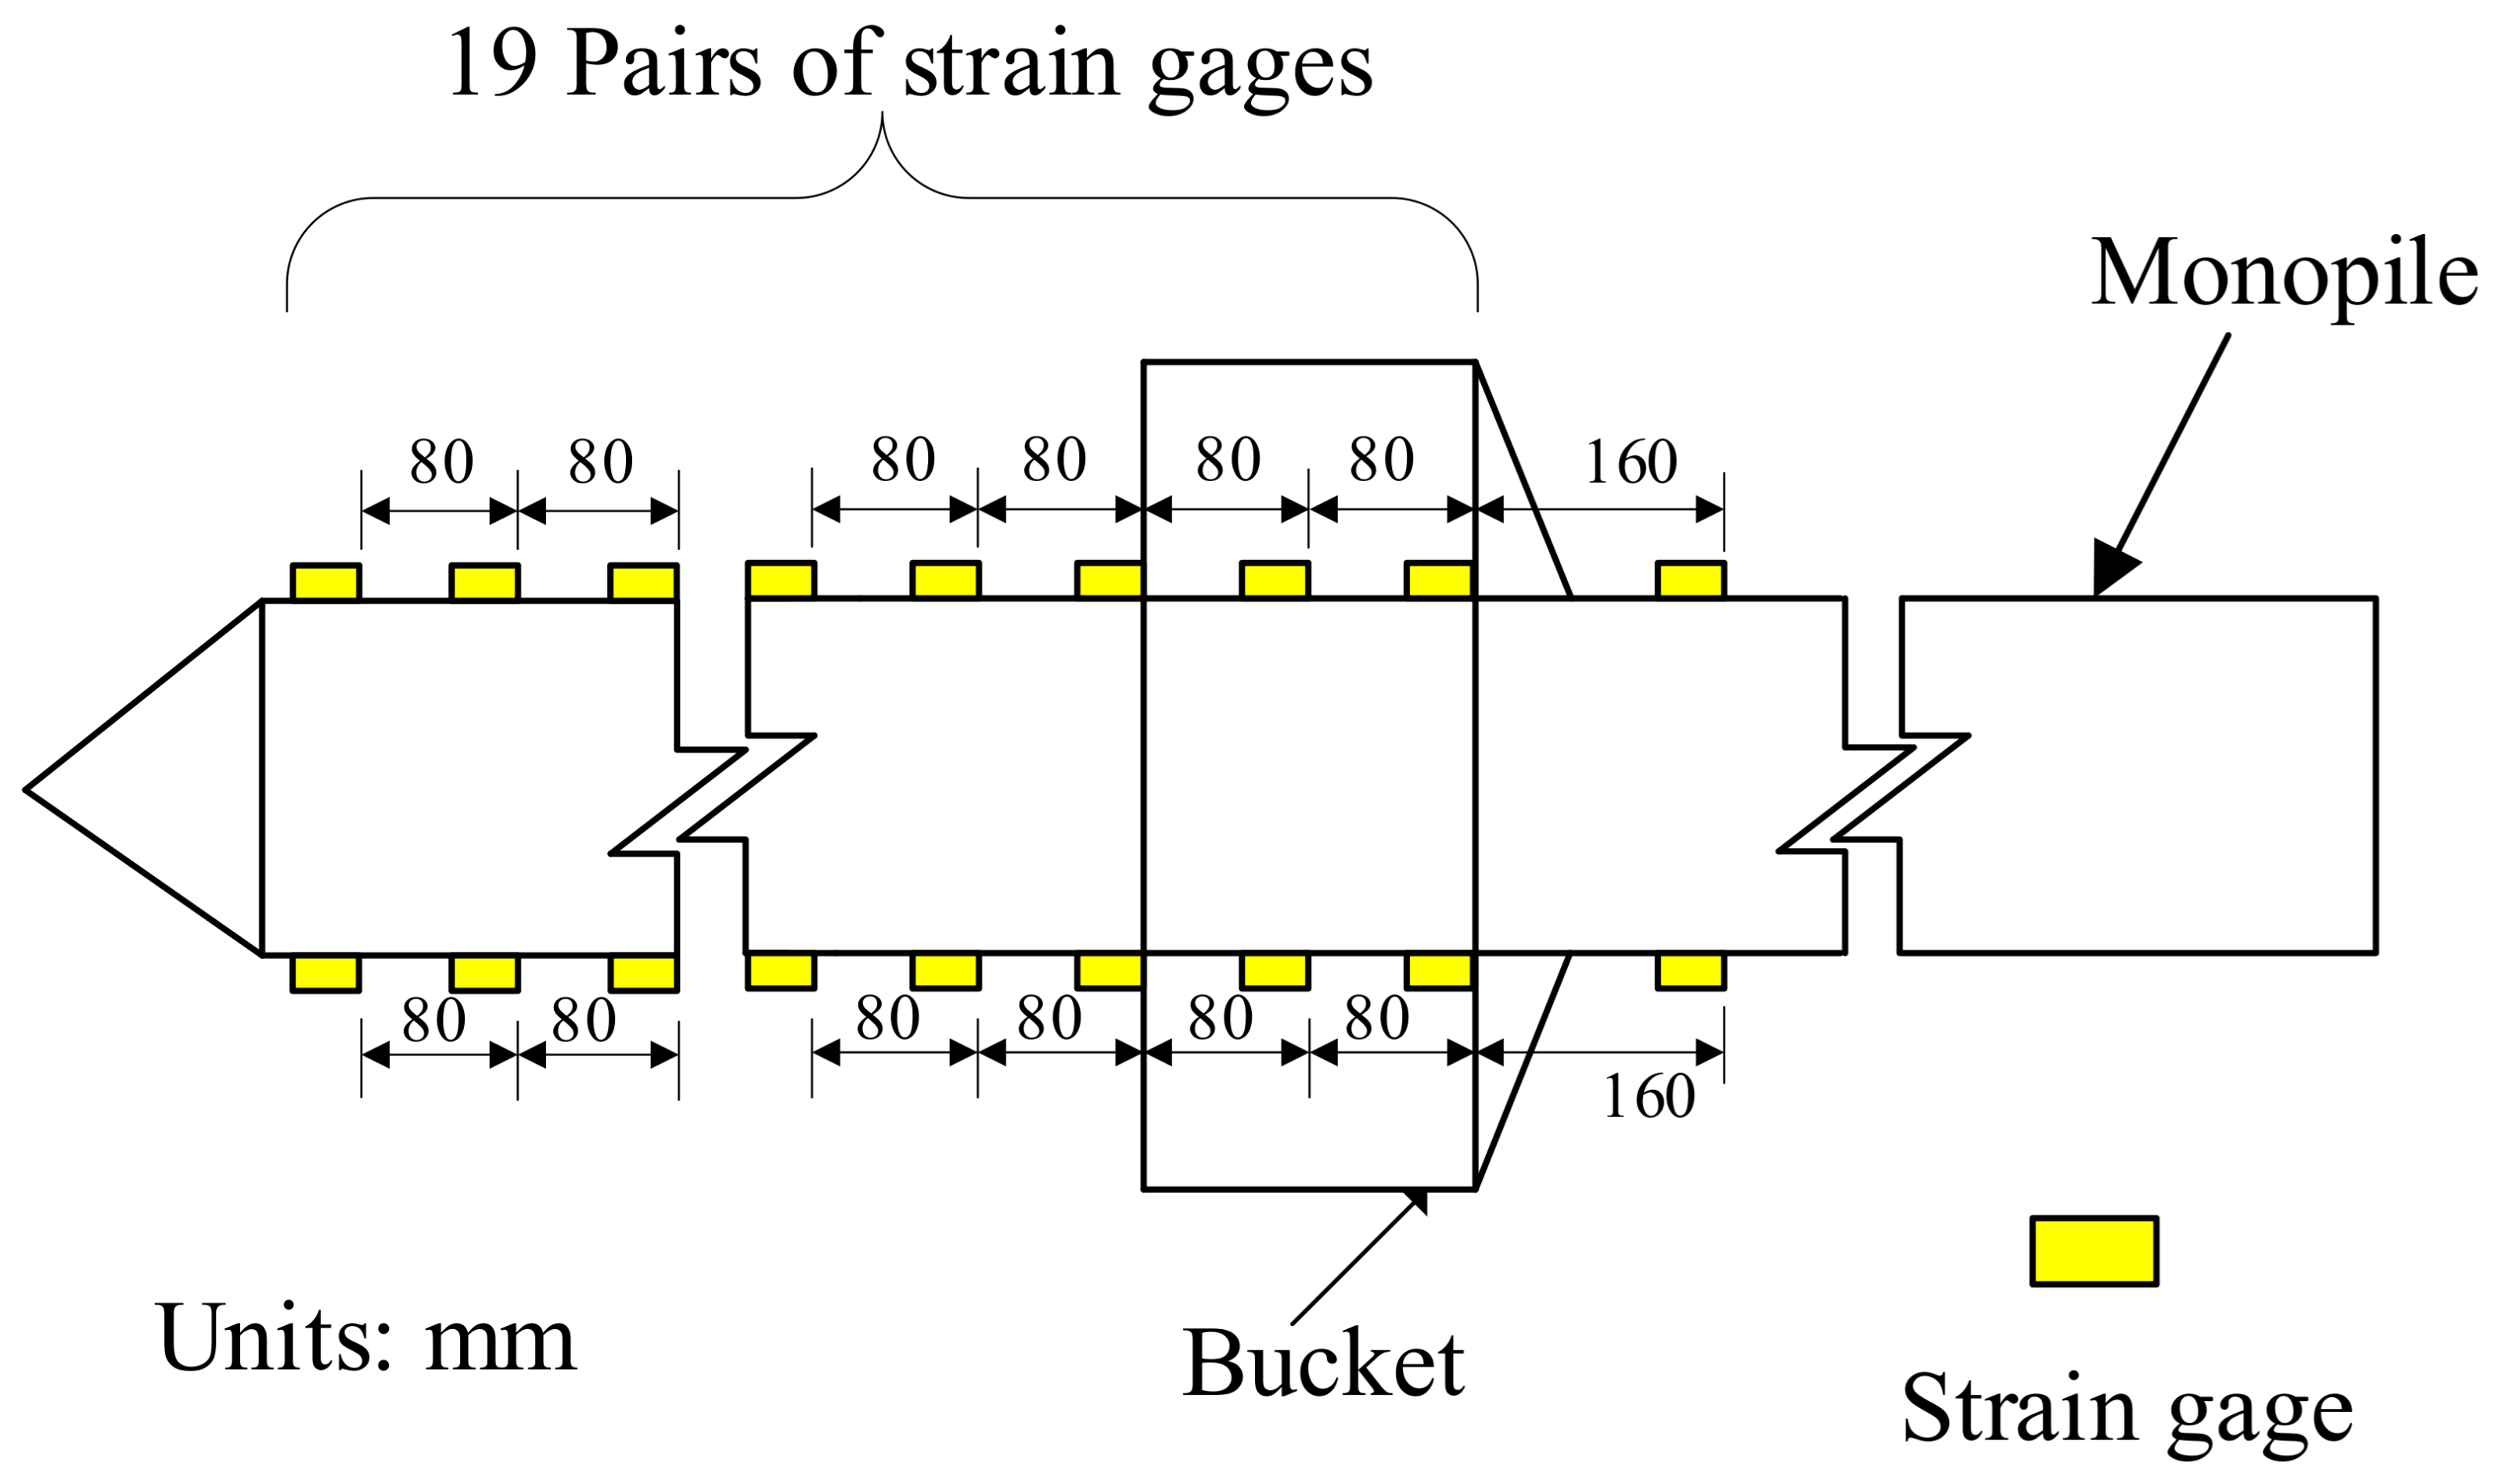
2.3. Model Pile and Bucket
2.4. Test Operation Procedure
- (1)
- Cover the mud surface with a thin layer of water to ensure saturation of the soil during the test;
- (2)
- Arrange the strain gages along the model pile and lead the gage wires into the hollow cylinder of the pile though the punched holes on the pile shaft. Slip the model bucket onto the model pile and then connect them by the bolts such that the cover plate of the bucket is 1000 mm below the pile top;
- (3)
- Locate the model pile–bucket foundation near the center of the model box. Since the ratio between the box width (2 m) and the bucket diameter (250 mm) is 8 and is sufficiently larger than the immediate influence area of the foundation, the adverse influence of the model boundary can be avoided;
- (4)
- Start the installation by using the pile driving device. The driving rate is controlled to 100 mm/min to minimize the soil disturbance. The verticality of the pile during the driving process is ensured with the aid of a level meter. The driving is stopped when the cover plate of the bucket is at the mud surface.
- (5)
- Install the LVDTs and connect all the wires to the data logger connecting to a computer. Initialize the horizontal servo-loading device and set the loading height to 500 mm above the mud surface;
- (6)
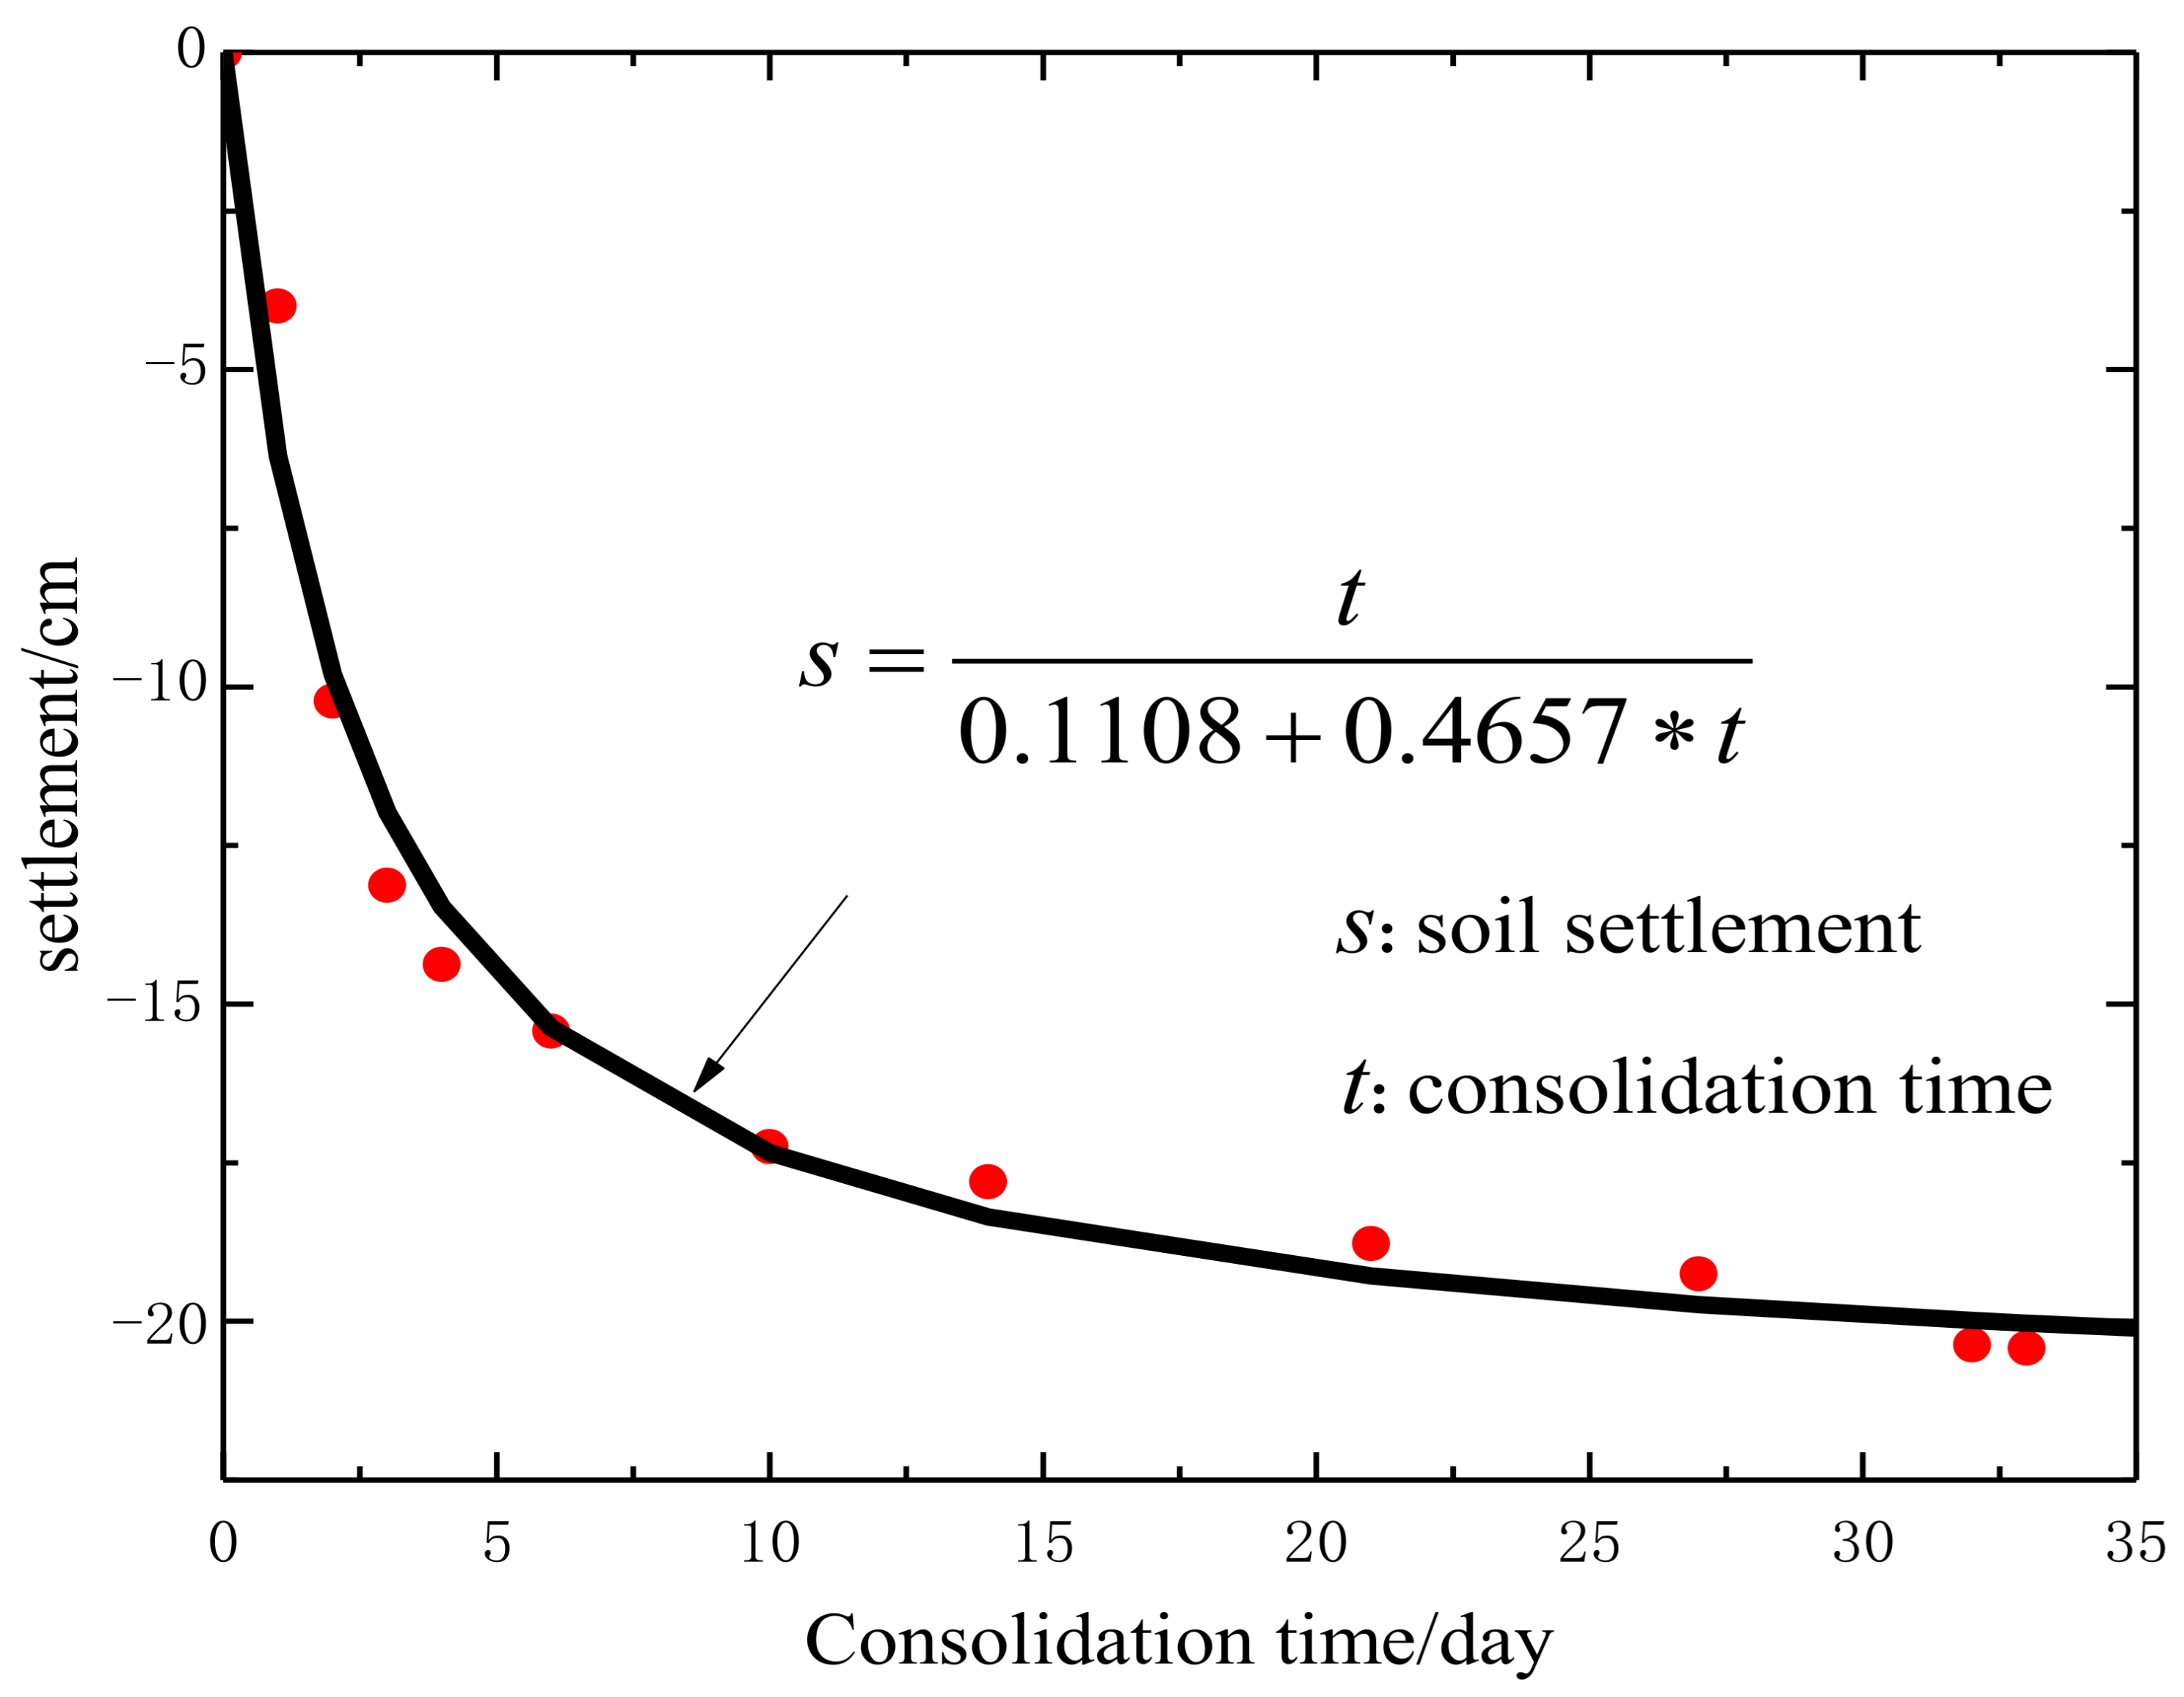
- Let the model setup rest for 30 days to allow for regaining of soil strength that was disturbed during the pile driving. Then start the horizontal loading in a displacement-controlled manner.
- (7)
- The above steps are repeated for each test case that are detailed in the next section.
3. Test Cases
4. Test Results of Model Pile–Bucket Foundation
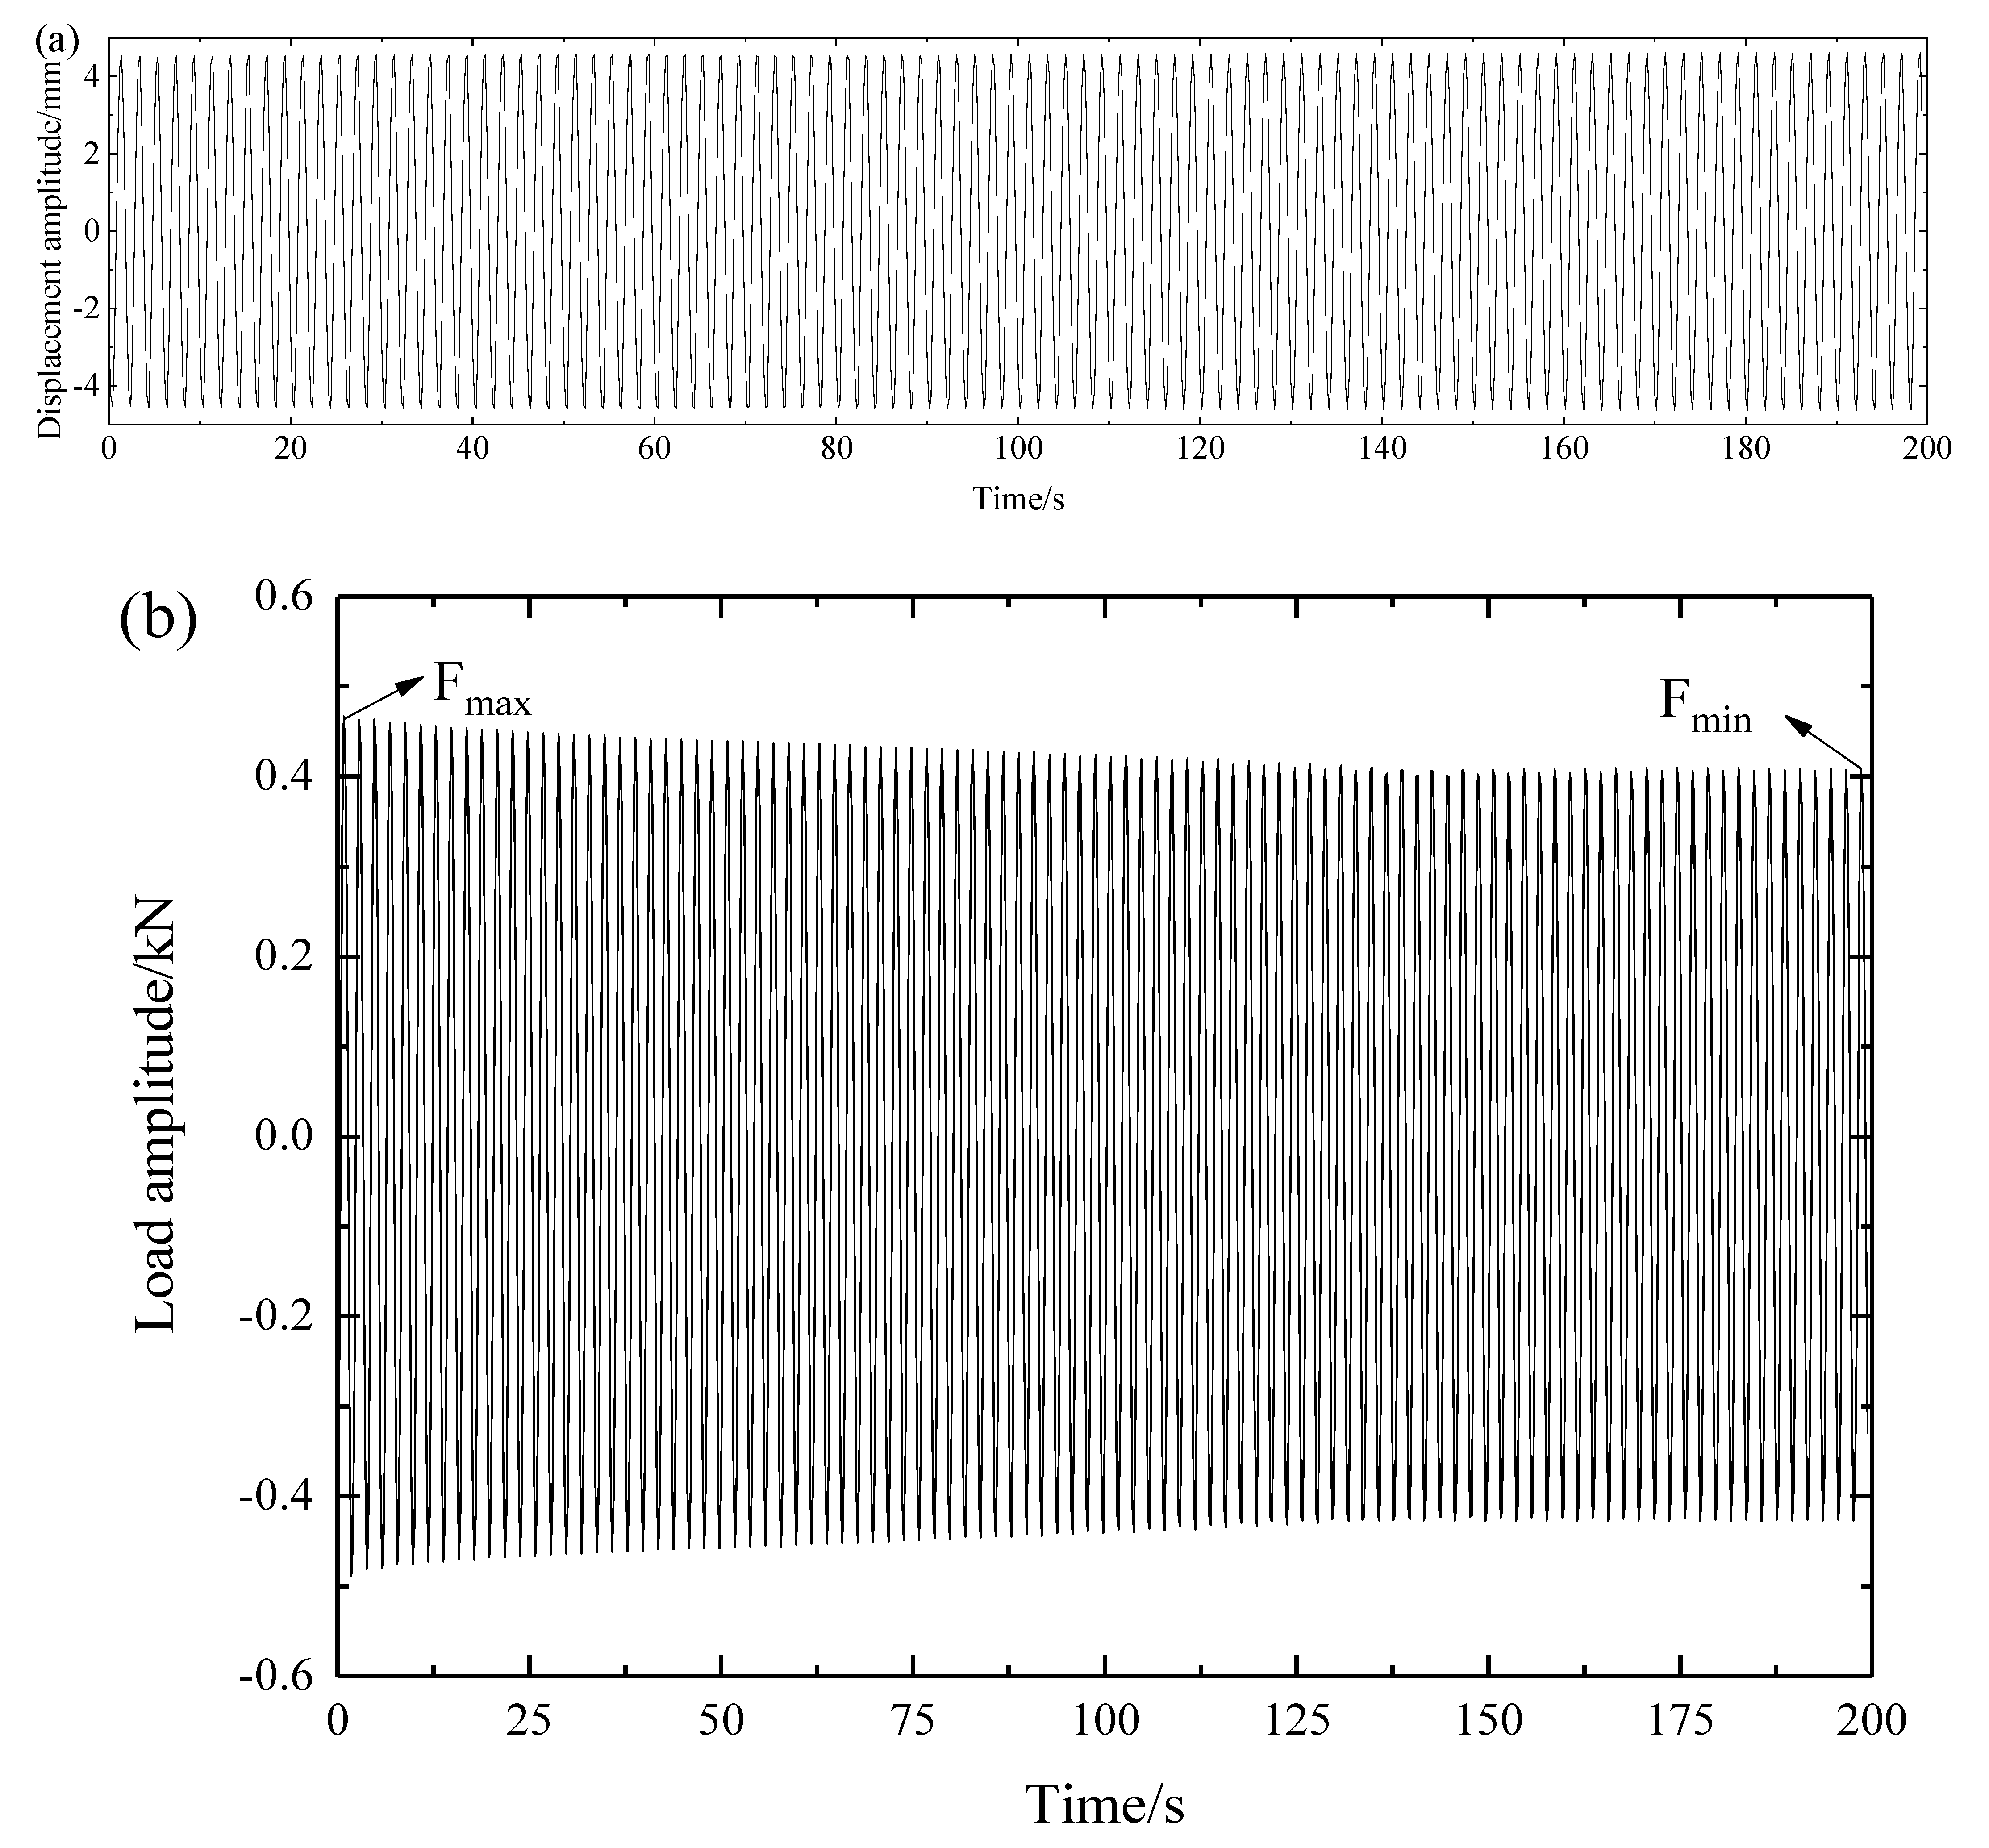
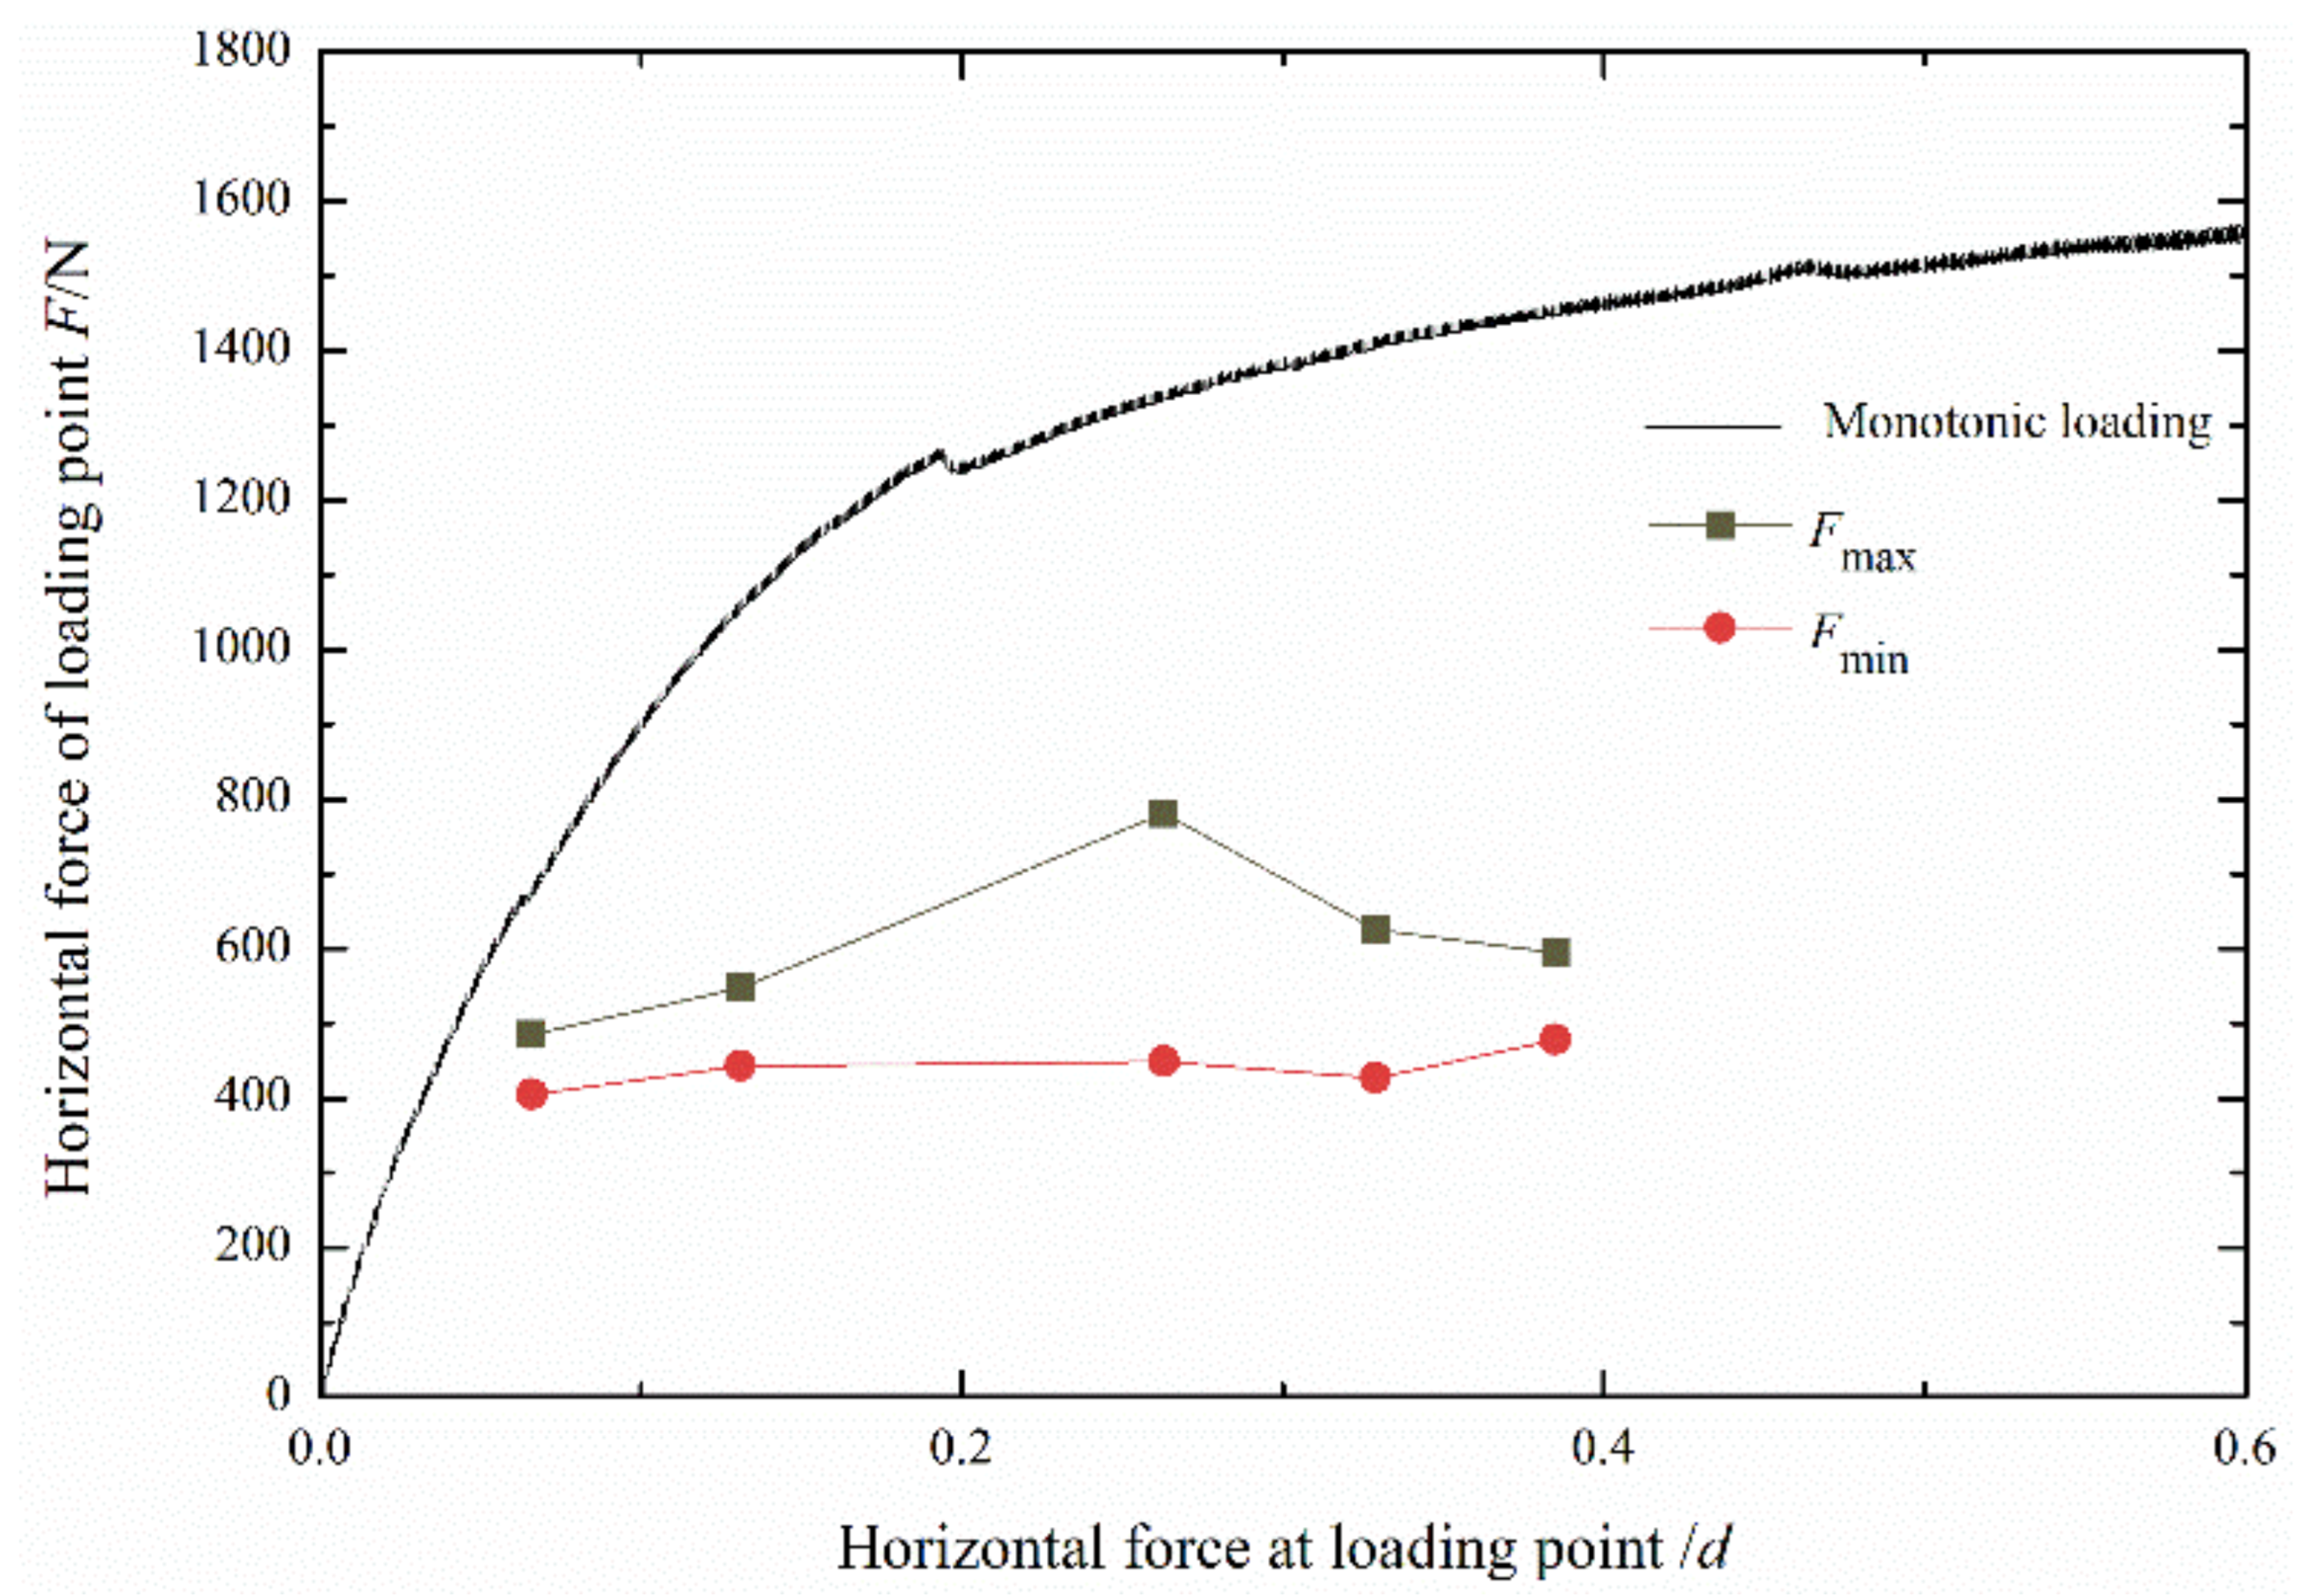
4.1. Case One: Monotonic Loading
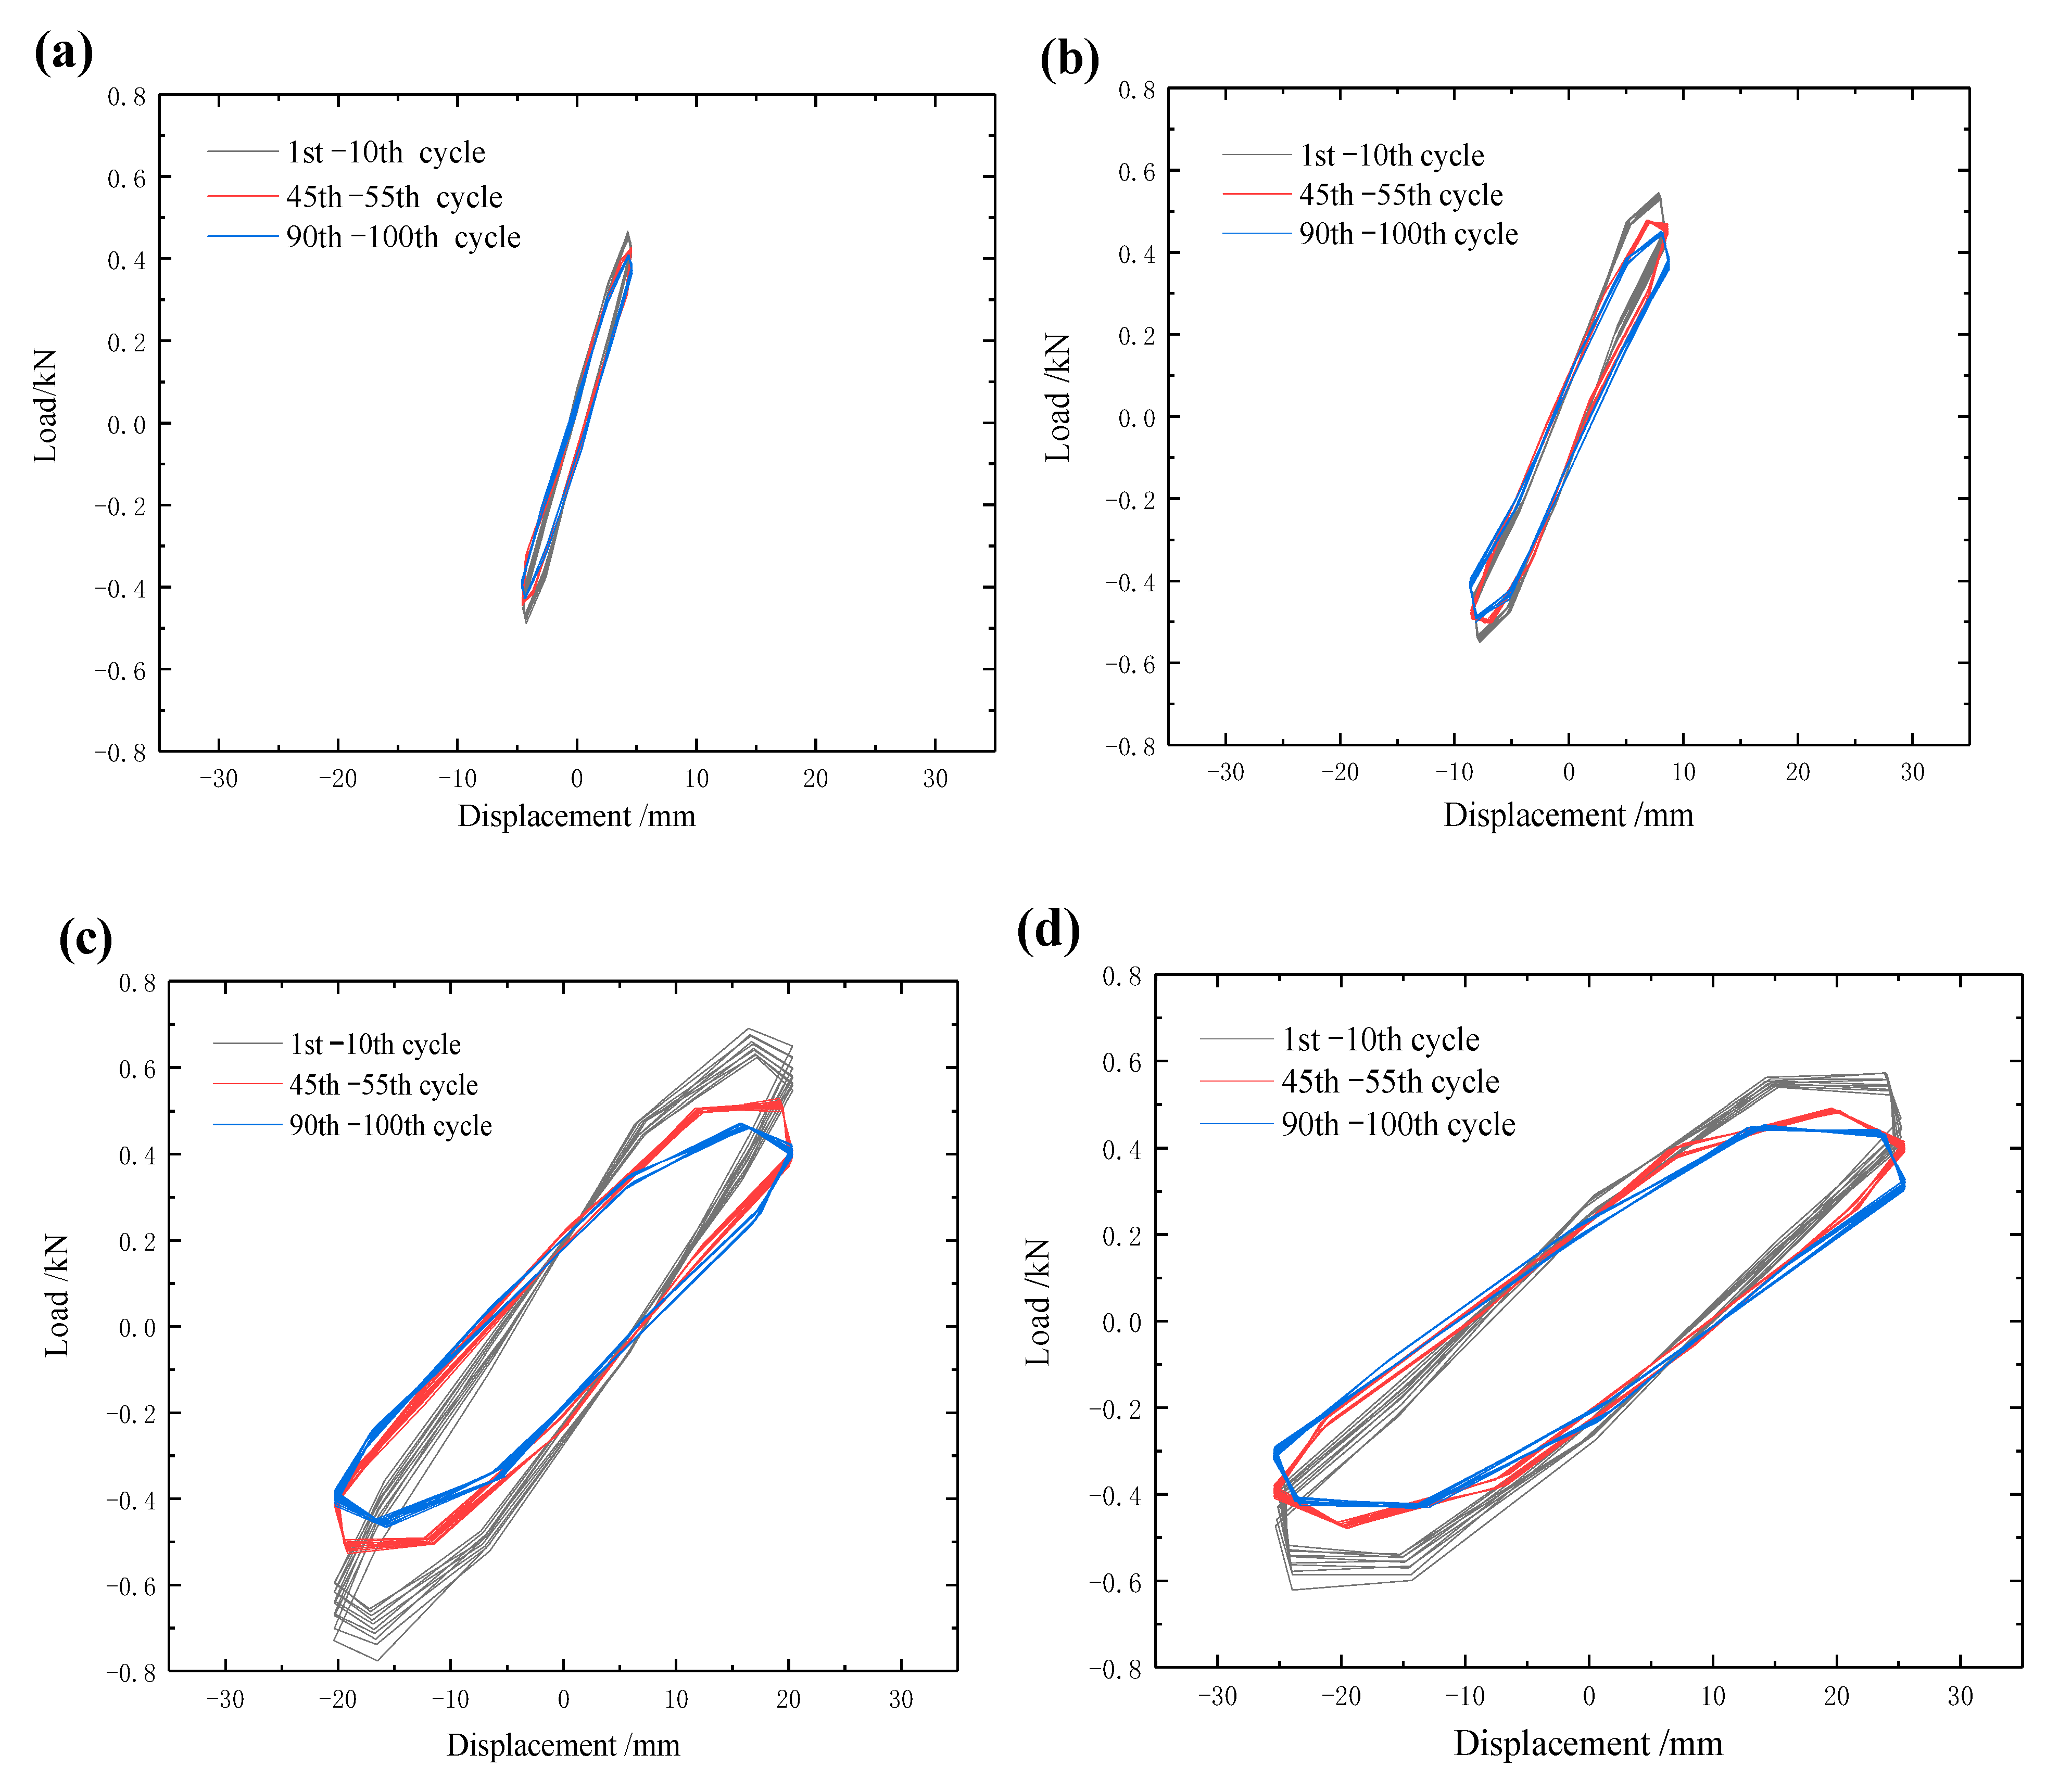
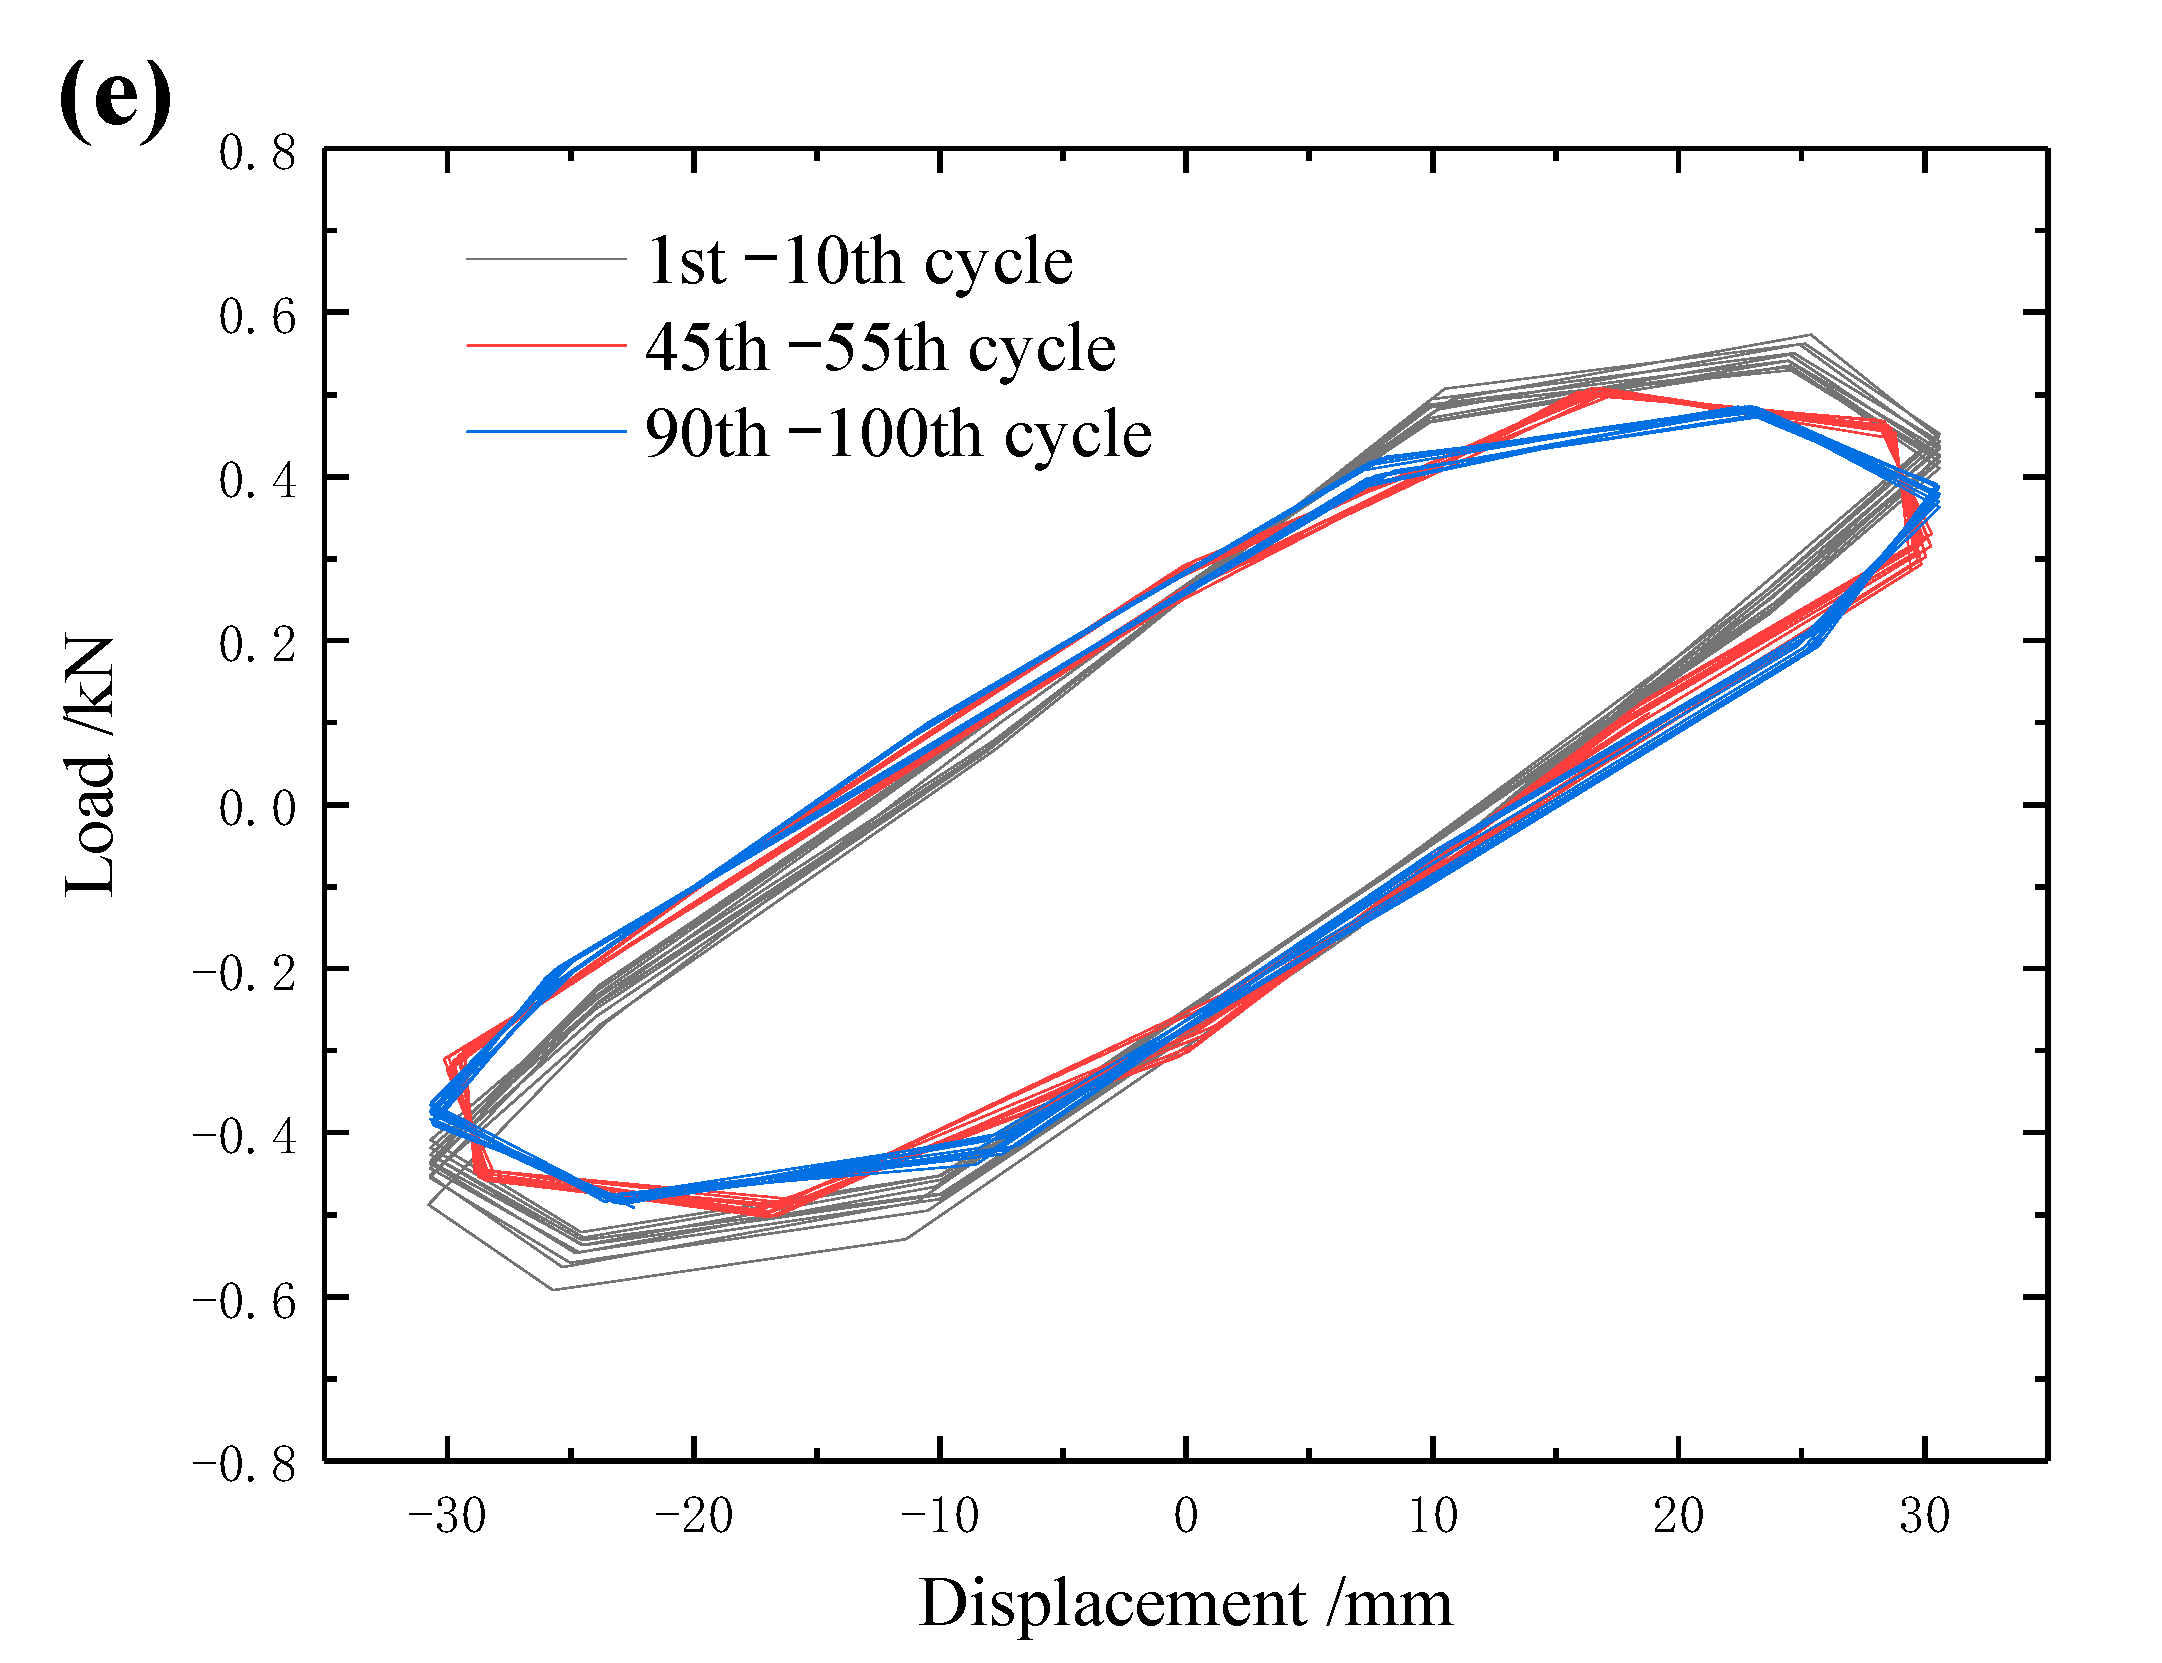
4.2. Case Two: Cyclic Loading with Stepped Increasing Amplitudes
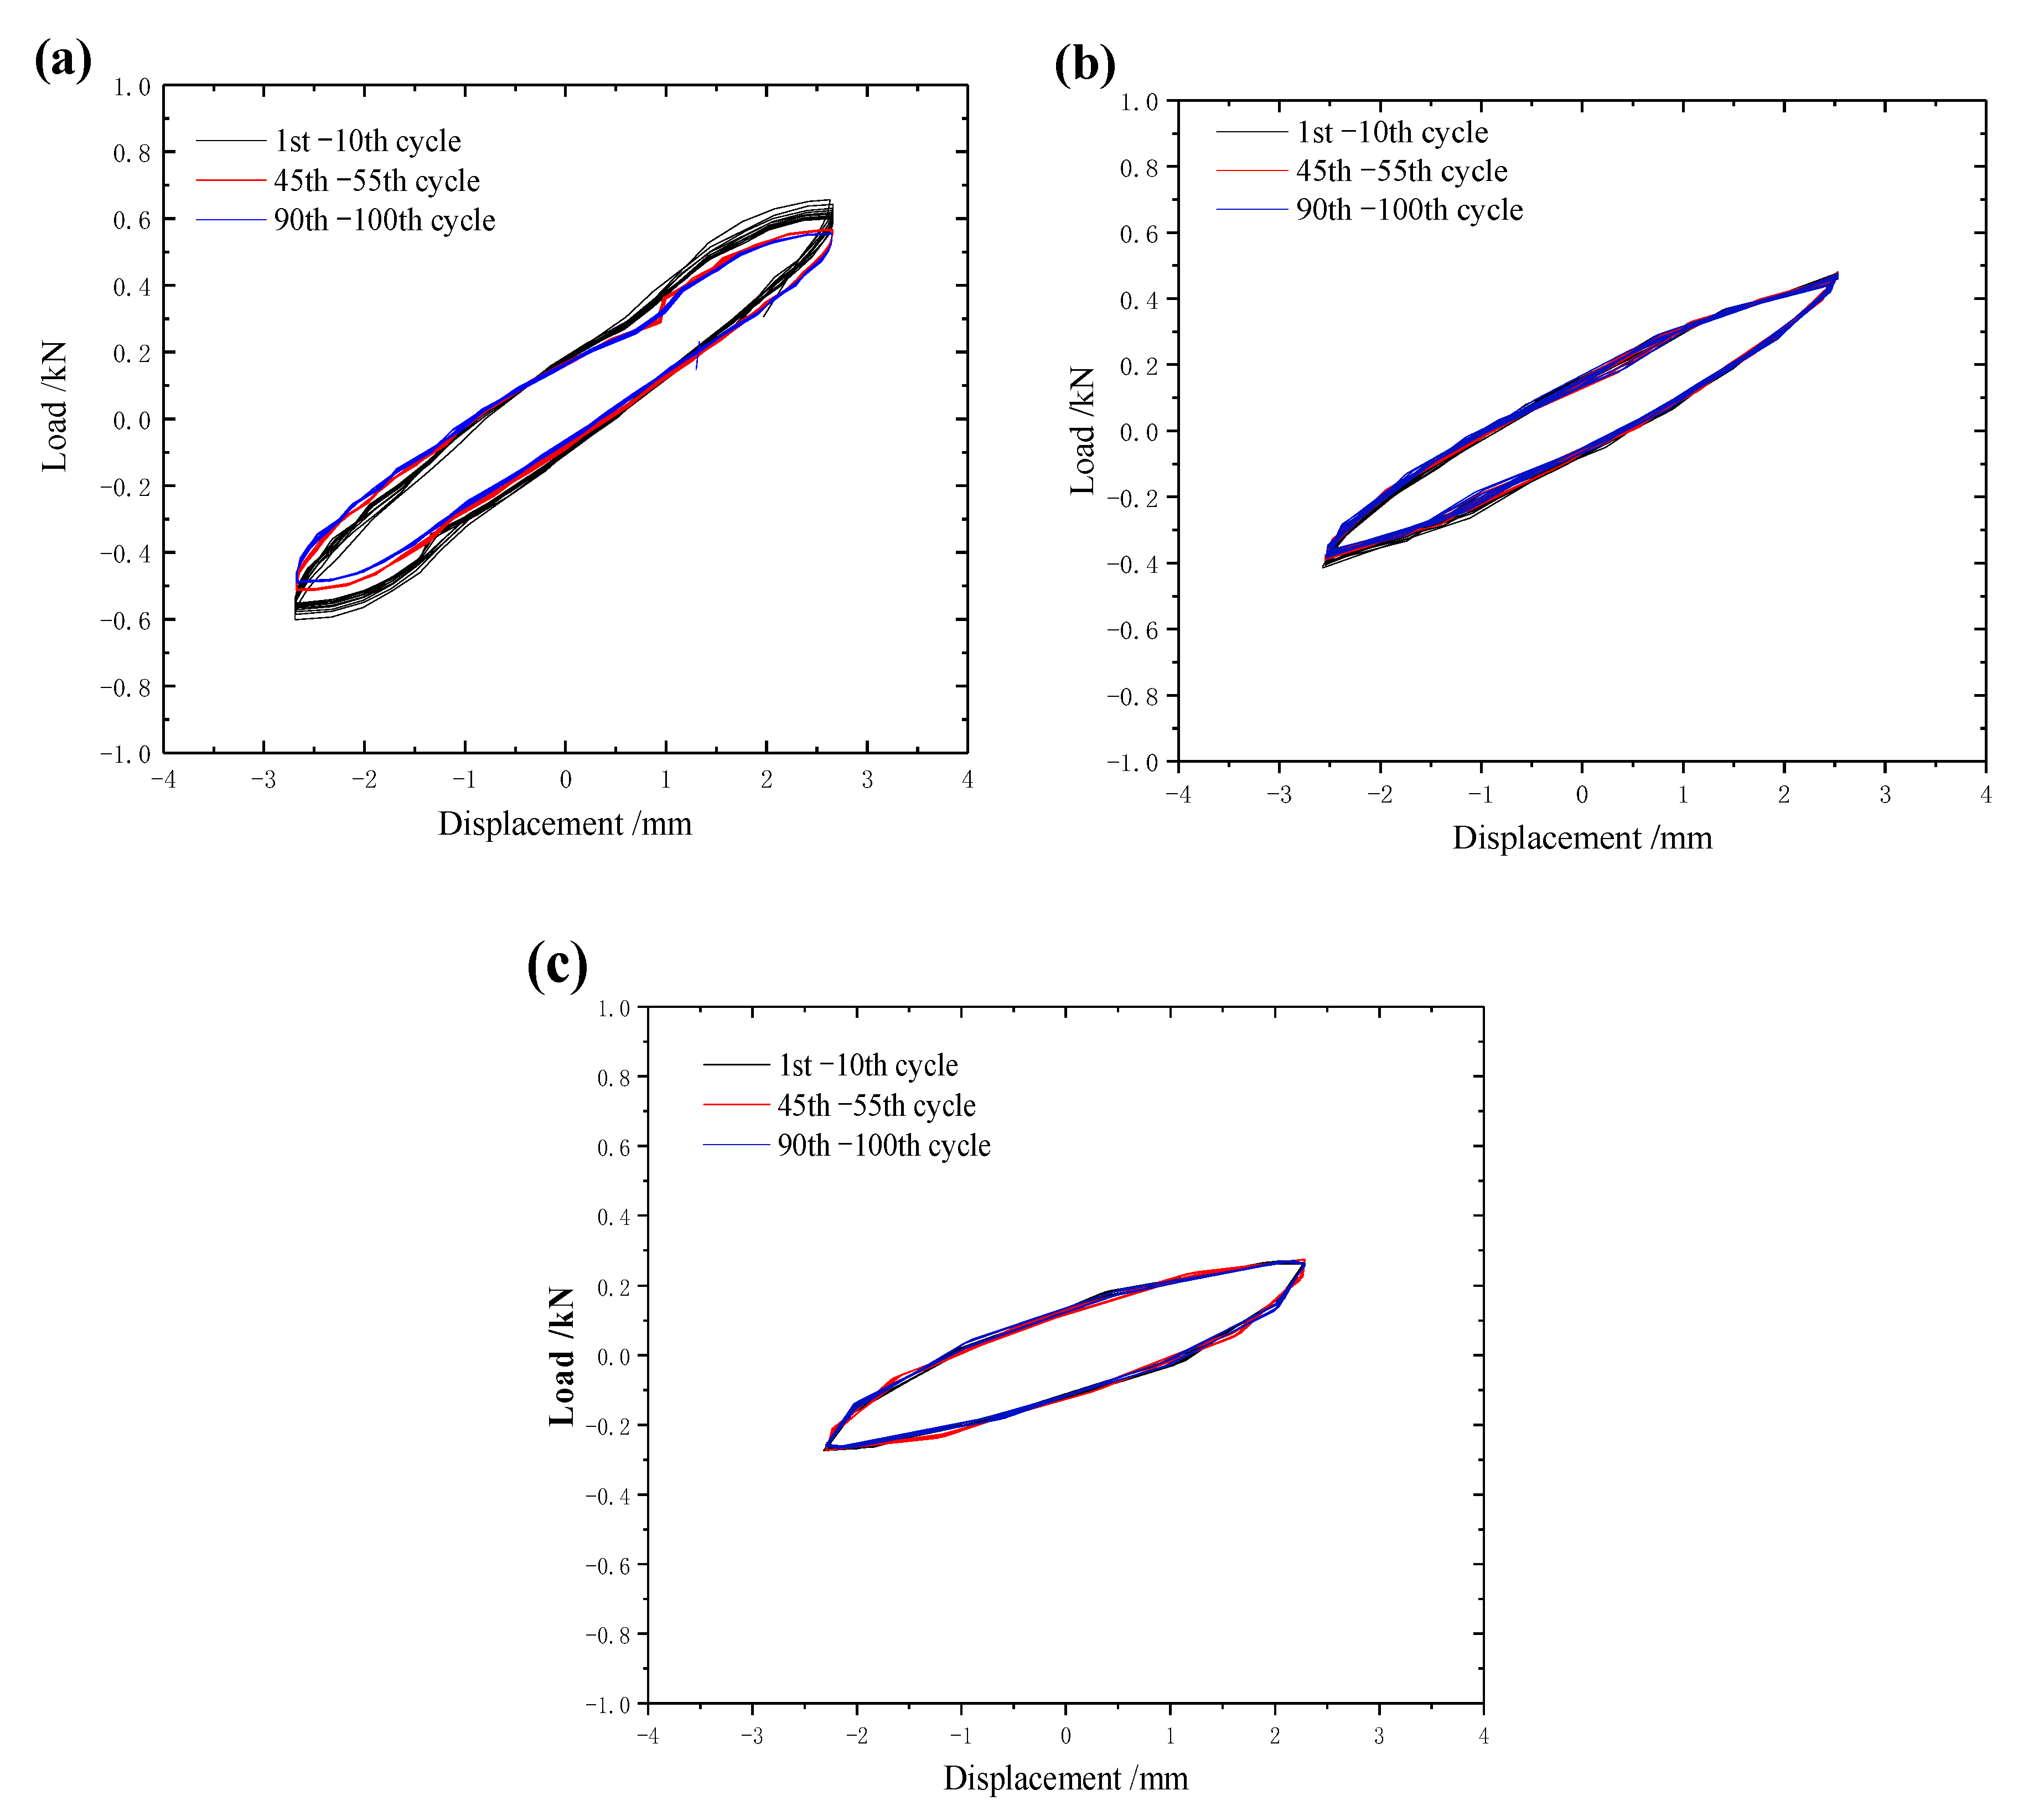
4.3. Case Three: Cyclic Loading with Stepped Increasing Frequency
5. Discussion
6. Conclusions
- (1)
- Under the displacement-controlled monotonic loading, the force–displacement curve of the pile–bucket foundation embedded in soft clay presents three distinct sections, i.e., the initial quasi-linear section, the following yielding section and the final strain-hardening section.
- (2)
- The stiffness degradation of the pile–bucket foundation will be most significant when the cyclic displacement amplitude is within the yielding range that is determined from the monotonic loading case. Furthermore, the damping of the foundation increases with the stepped-increasing amplitudes of the loading displacements, which indicates more soils surrounding the foundation have been mobilized.
- (3)
- Once the pile–bucket foundation has been subjected to cyclic displacement loadings with a low frequency, its stiffness and damping will basically not be affected by only increasing the loading frequency in the following loading cycles.
- (4)
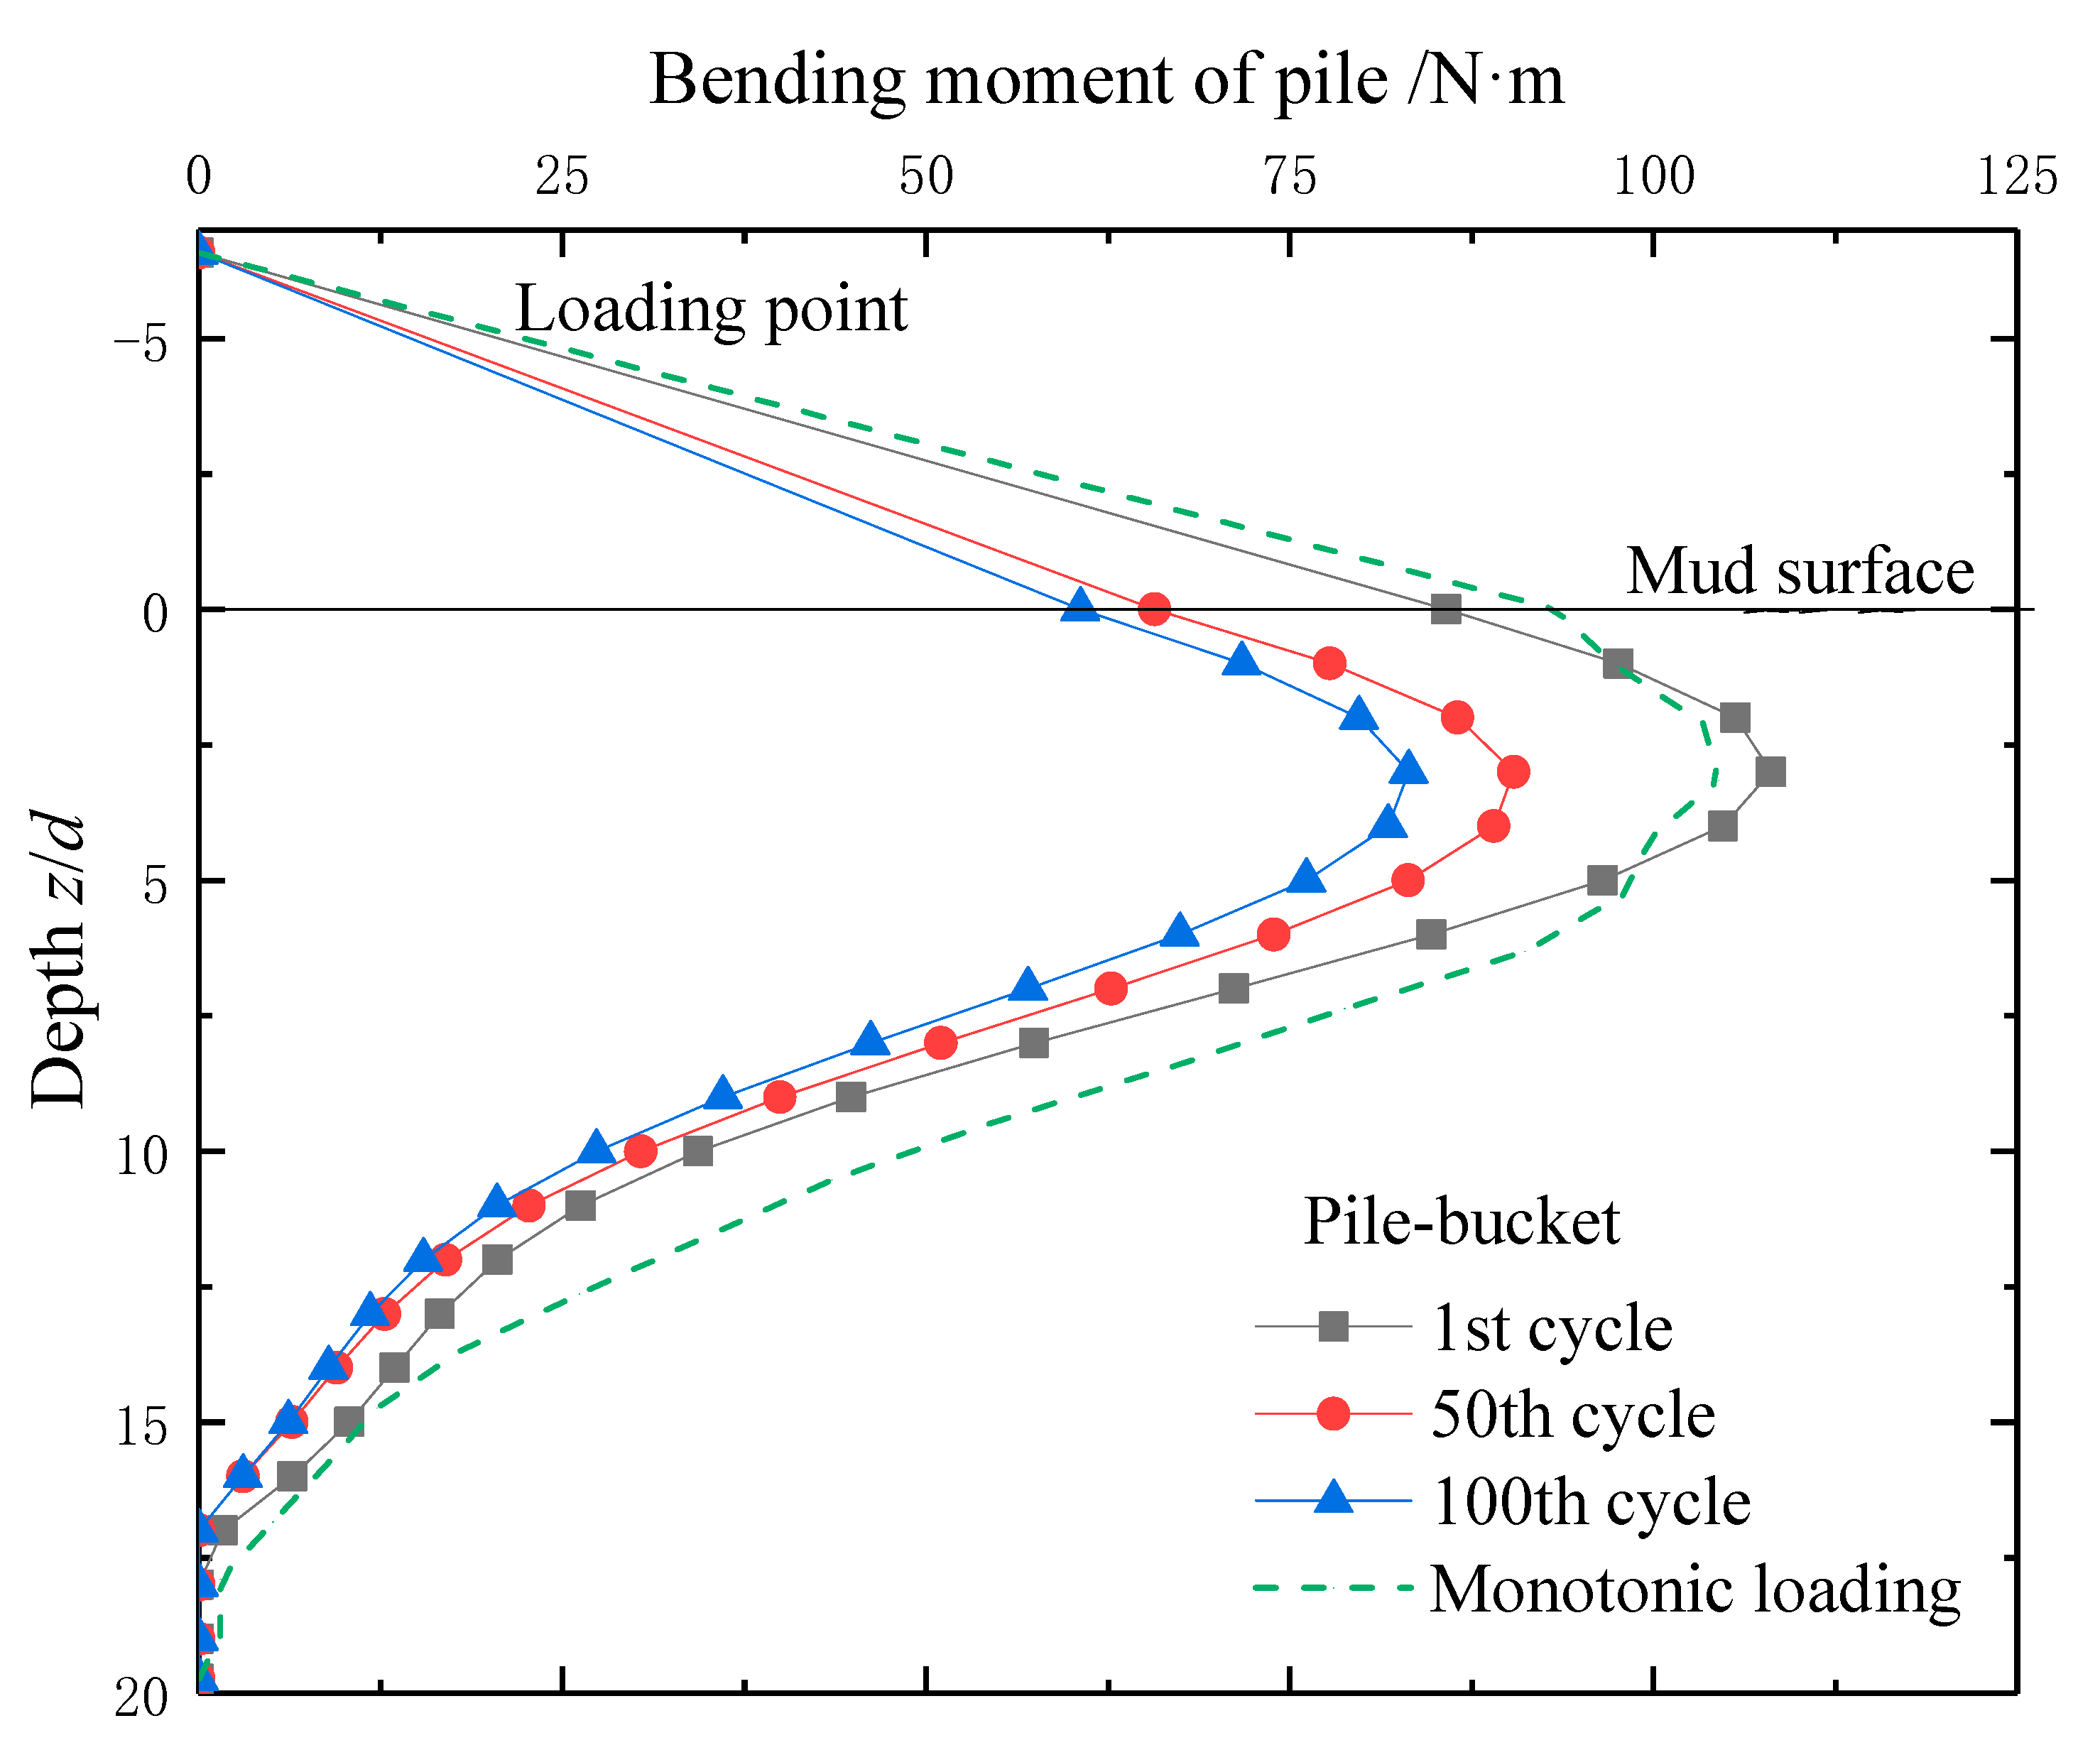
- The stiffness degradation under the cyclic loadings will not affect the depth-distribution pattern of the pile bending moment. Additionally, the reductions of peak bending moment and soil resistance are more pronounced during the first few loading cycles.
- (5)
- To obtain the cyclic p–y curve from the monotonic case, significant reductions both in the slope (up to 50%) and the ultimate soil resistance (up to 67%) should be considered for the ascending and the flat sections of the monotonic p–y curve, respectivley.
Author Contributions
Funding
Institutional Review Board Statement
Informed Consent Statement
Data Availability Statement
Conflicts of Interest
References
- Wang, X.F.; Zeng, X.W.; Li, J.L.; Yang, X.; Wang, H.J. A review on recent advancements of substructures for offshore wind turbines. Energy Convers. Manag. 2018, 158, 103–119. [Google Scholar] [CrossRef]
- Suleiman, M.T.; Ni, L.; Raich, A.; Helm, J.; Ghazanfari, E. Measured soil-structure interaction for concrete piles subjected to lateral loading. Can. Geotech. J. 2015, 52, 1168–1179. [Google Scholar] [CrossRef]
- Li, W.; Zhu, B.T.; Yang, M. Static response of monopile to lateral load in overconsolidated dense sand. J. Geotech. Geoenviron. Eng. 2017, 143, 04017026. [Google Scholar] [CrossRef]
- Yu, J.; Huang, M.S.; Leung, C.F.; Li, S. Upper bound solution of a laterally loaded rigid monopile in normally consolidated clay. Comput. Geotech. 2017, 91, 131–145. [Google Scholar] [CrossRef]
- Zou, X.J.; Cao, X.; Zhou, C.L.; Zhou, M.; Mi, Z.; Zhang, X.H. Experimental study on the bearing capacity of large-diameter monopile in sand under water flow condition. Ocean Eng. 2021, 224, 108708. [Google Scholar] [CrossRef]
- Leblanc, C.; Houlsby, G.T.; Byrne, B.W. Response of stiff piles in sand to long-term cyclic lateral loading. Geotecnique 2010, 60, 79–90. [Google Scholar] [CrossRef]
- Zhang, C.; White, D.; Randolph, M. Centrifuge modeling of the cyclic lateral response of a rigid pile in soft clay. J. Geotech. Geoenviron. Eng. 2011, 137, 717–729. [Google Scholar] [CrossRef]
- Lombardi, D.; Bhattacharya, S.; Dmw, C. Dynamic soil–structure interaction of monopile supported wind turbines in cohesive soil. Soil Dyn. Earthq. Eng. 2013, 49, 165–180. [Google Scholar] [CrossRef]
- Yu, H.; Zeng, X.W.; Li, B.; Lian, J.J. Centrifuge modeling of offshore wind foundations under earthquake loading. Soil Dyn. Earthq. Eng. 2015, 77, 402–415. [Google Scholar] [CrossRef]
- Hong, Y.; He, B.; Wang, L.Z.; Wang, Z.; Ng, C.W.W.; Masin, D. Cyclic lateral response and failure mechanisms of semi-rigid pile in soft clay: Centrifuge tests and numerical modelling. Can. Geotech. J. 2016, 54, 806–824. [Google Scholar] [CrossRef]
- Liao, W.M.; Zhang, J.J.; Wu, J.B.; Yan, K.M. Response of flexible monopile in marine clay under cyclic lateral load. Ocean Eng. 2018, 147, 89–106. [Google Scholar] [CrossRef]
- Lai, Y.Q.; Wang, L.Z.; Hong, Y.; He, B. Centrifuge modeling of the cyclic lateral behavior of large-diameter monopiles in soft clay: Effects of episodic cycling and reconsolidation. Ocean Eng. 2020, 200, 107048. [Google Scholar] [CrossRef]
- Jawad, S.; Han, J.; Abdulrasool, G.; Al-Naddaf, M. Responses of single and group piles within mse walls under static and cyclic lateral loads. Geotext. Geomembr. 2021, 49, 1019–1035. [Google Scholar] [CrossRef]
- Wang, X.F.; Yang, X.; Zeng, X.W. Centrifuge modeling of lateral bearing behavior of offshore wind turbine with suction bucket foundation in sand. Ocean Eng. 2017, 139, 140–151. [Google Scholar] [CrossRef]
- Zhu, B.; Kong, D.Q.; Chen, R.P.; Kong, L.G.; Chen, Y.M. Installation and lateral loading tests of suction caissons in silt. Can. Geotech. J. 2011, 48, 1070–1084. [Google Scholar] [CrossRef]
- Zhu, B.; Zhang, W.L.; Ying, P.P.; Chen, Y.M. Deflection-Based Bearing Capacity of Suction Caisson Foundations of Offshore Wind Turbines. J. Geotech. Geoenviron. Eng. 2014, 140, 04014013. [Google Scholar] [CrossRef]
- Ma, P.C.; Liu, R.; Lian, J.J.; Zhu, B. An investigation into the lateral loading response of shallow bucket foundations for offshore wind turbines through centrifuge modeling in sand. Appl. Ocean Res. 2019, 87, 192–203. [Google Scholar] [CrossRef]
- Cox, J.A.; O’Loughlin, C.D.; Cassidy, M.; Bhattacharya, S.; Gaudin, C.; Bienen, B. Centrifuge study on the cyclic performance of caissons in sand. Int. J. Phys. Model. Geotech. 2014, 14, 99–115. [Google Scholar] [CrossRef] [Green Version]
- Foglia, A.; Ibsen, L.B. Monopod bucket foundation under cyclic lateral loading. Int. J. Offshore Polar Eng. 2016, 26, 109–115. [Google Scholar] [CrossRef] [Green Version]
- Wang, L.Z.; Wang, H.; Hong, Y. Comparison of monotonic and cyclic lateral response between monopod and tripod bucket foundations in medium dense sand. Ocean Eng. 2018, 155, 88–105. [Google Scholar] [CrossRef]
- Ueda, K.; Uzuoka, R.; Iai, S.; Okamura, T. Centrifuge model tests and effective stress analyses of offshore wind turbine systems with a suction bucket foundation subject to seismic load. Soils Found. 2020, 70, 1546–1569. [Google Scholar] [CrossRef]
- Zhu, F.Y.; O’Loughlin, C.D.; Bienen, B.; Cassidy, M.J.; Morgan, N. The response of suction caissons to long-term lateral cyclic loading in single-layer and layered seabeds. Géotechnique 2018, 68, 729–741. [Google Scholar] [CrossRef]
- Zhu, F.Y.; Bienen, B.; O’Loughlin, C.; Cassidy, M.J.; Morgan, N. Suction caisson foundations for offshore wind energy: Cyclic response in sand and sand over clay. Géotechnique 2019, 69, 924–931. [Google Scholar] [CrossRef]
- Zhu, F.Y.; Bienen, B.; O’Loughlin, C.; Morgan, N.; Cassidy, M.J. The response of suction caissons to multidirectional lateral cyclic loading in sand over clay. Ocean Eng. 2018, 170, 43–54. [Google Scholar] [CrossRef]
- Chen, D.; Gao, P.; Huang, S.S.; Li, C.S.; Yu, X.G. Static and dynamic loading behavior of a hybrid foundation for offshore wind turbines. Mar. Struct. 2020, 71, 102727. [Google Scholar] [CrossRef]
- Head, K.H. Manual of Soil Laboratory Testing: Soil Classification and Compaction Tests, 2nd ed.; Pentech Press: London, UK, 1992. [Google Scholar]
- Poulos, H.G.; Hull, T.S. The role of analytical geomechanics in foundation engineering. Presented at 1989 Foundation Engineering Conference, Evanston, IL, USA, 25–29 June 1989. [Google Scholar]
- Zhang, Q.B.; Zhai, H.L.; Wang, P.D.; Wang, S.H.; Duan, L.L.; Chen, L.Y.; Liu, Y.F.; Jeng, D.S. Experimental study on irregular wave-induced pore-water pressures in a porous seabed around a mono-pile. Appl. Ocean Res. 2020, 95, 102041. [Google Scholar] [CrossRef]
- Liu, R.; Li, B.R.; Lian, J.J.; Ding, H.Y. Bearing characteristics of pile-bucket composite foundation for offshore wind turbine. J. Tianjin Univ. (Sci. Technol.) 2016, 48, 429–437. [Google Scholar]
- Arany, L.; Bhattacharya, S.; Macdonald, J.H.G.; Hogan, S.J. Closed form solution of Eigen frequency of monopile supported offshore wind turbines in deeper waters incorporating stiffness of substructure and SSI. Soil Dyn. Earthq. Eng. 2016, 83, 18–32. [Google Scholar] [CrossRef] [Green Version]
- API. Recommended Practice for Planning, Designing and Constructing Fixed Offshore Platforms—Working Stress Design. Available online: https://www.apiwebstore.org/publications/item.cgi?58bf26e5-8e94-4eb0-97f3-152abb4c1f37 (accessed on 1 June 2021).


| Reference | Model Scale | Test Type | Loading Type | Soil Type |
|---|---|---|---|---|
| Leblanc et al. (2010) | 1:50 | 1 g 1 | Cyclic | Sand |
| Zhang et al. (2011) | 1:50 | N g 2 | Cyclic | Kaolin Clay |
| Lombardi et al. (2013) | 1:56 | 1 g | Cyclic | London Clay |
| Suleiman et al. (2015) | 1:1 | 1 g | Monotonic | Sand |
| Yu et al. (2015) | 1:50 | N g | Cyclic | Toyoura sand |
| Hong et al. (2016) | 1:40 | N g | Cyclic | Soft Clay |
| Li et al. (2017) | 1:18 | 1 g | Monotonic | Dense sand |
| Yu et al. (2017) | 1:50 | N g | Monotonic | Kaolin Clay |
| Liao et al. (2018) | 1:100 | 1 g | Cyclic | Marine clay |
| Lai et al. (2020) | 1:100 | N g | Cyclic | Soft Clay |
| Jawad et al. (2021) | 1:6 | 1 g | Both cyclic and monotonic | Kansas River Sand |
| Zou et al. (2021) | 1:100 | 1 g | Monotonic | Medium silica sand |
| Physical Quantity | Scaling Factor (Model/Prototype) |
|---|---|
| Bending stiffness | 1:N4 |
| Length | 1:N |
| Force | 1:N3 |
| Gravitational acceleration | 1:1 |
| Case No. | Case Description | Frequency f/Hz | Amplitude A/mm | Cycle Number |
|---|---|---|---|---|
| 1 | Monotonic loading | monotonic | ||
| 2 | Cyclic loading with stepped increasing amplitudes | 0.5 | ±5 | 100 |
| ±10 | ||||
| ±20 | ||||
| ±25 | ||||
| ±30 | ||||
| 3 | Cyclic loading with stepped increasing frequency | 0.1 | ±2.5 | 100 |
| 0.3 | ||||
| 0.5 | ||||
| Displacement Amplitude (mm) | Dimensionless Amplitude | Maximum Horizontal Force Fmax (N) | Minimum Horizontal Force Fmin (N) | ζb = Fmax/Fu | ζc = Fmin/Fmax |
|---|---|---|---|---|---|
| ±5 | 0.066d | 485 | 405 | 0.31 | 0.83 |
| ±10 | 0.132d | 547 | 443 | 0.35 | 0.81 |
| ±20 | 0.263d | 781 | 449 | 0.50 | 0.57 |
| ±25 | 0.329d | 625 | 427 | 0.40 | 0.68 |
| ±30 | 0.394d | 594 | 478 | 0.38 | 0.80 |
| Loading Frequency (Hz) | Maximum Horizontal Force Fmax (N) | Minimum Horizontal Force Fmin (N) | ζb = Fmax/Fu | ζc = Fmin/Fmax |
|---|---|---|---|---|
| 0.1 | 656 | 487 | 0.42 | 0.74 |
| 0.3 | 481 | 385 | 0.31 | 0.80 |
| 0.5 | 275 | 262 | 0.18 | 0.95 |
Publisher’s Note: MDPI stays neutral with regard to jurisdictional claims in published maps and institutional affiliations. |
© 2021 by the authors. Licensee MDPI, Basel, Switzerland. This article is an open access article distributed under the terms and conditions of the Creative Commons Attribution (CC BY) license (https://creativecommons.org/licenses/by/4.0/).
Share and Cite
Fu, Z.; Wang, G.; Yu, Y.; Shi, L. Model Test Study on Bearing Capacity and Deformation Characteristics of Symmetric Pile–Bucket Foundation Subjected to Cyclic Horizontal Load. Symmetry 2021, 13, 1647. https://doi.org/10.3390/sym13091647
Fu Z, Wang G, Yu Y, Shi L. Model Test Study on Bearing Capacity and Deformation Characteristics of Symmetric Pile–Bucket Foundation Subjected to Cyclic Horizontal Load. Symmetry. 2021; 13(9):1647. https://doi.org/10.3390/sym13091647
Chicago/Turabian StyleFu, Zunan, Guoshuai Wang, Yanming Yu, and Li Shi. 2021. "Model Test Study on Bearing Capacity and Deformation Characteristics of Symmetric Pile–Bucket Foundation Subjected to Cyclic Horizontal Load" Symmetry 13, no. 9: 1647. https://doi.org/10.3390/sym13091647
APA StyleFu, Z., Wang, G., Yu, Y., & Shi, L. (2021). Model Test Study on Bearing Capacity and Deformation Characteristics of Symmetric Pile–Bucket Foundation Subjected to Cyclic Horizontal Load. Symmetry, 13(9), 1647. https://doi.org/10.3390/sym13091647