
A New Integrated Tool to Calculate and Map Bilateral Asymmetry on Three-Dimensional Digital Models

 , , , ,
Abstract
:1. Introduction
2. Materials and Methods
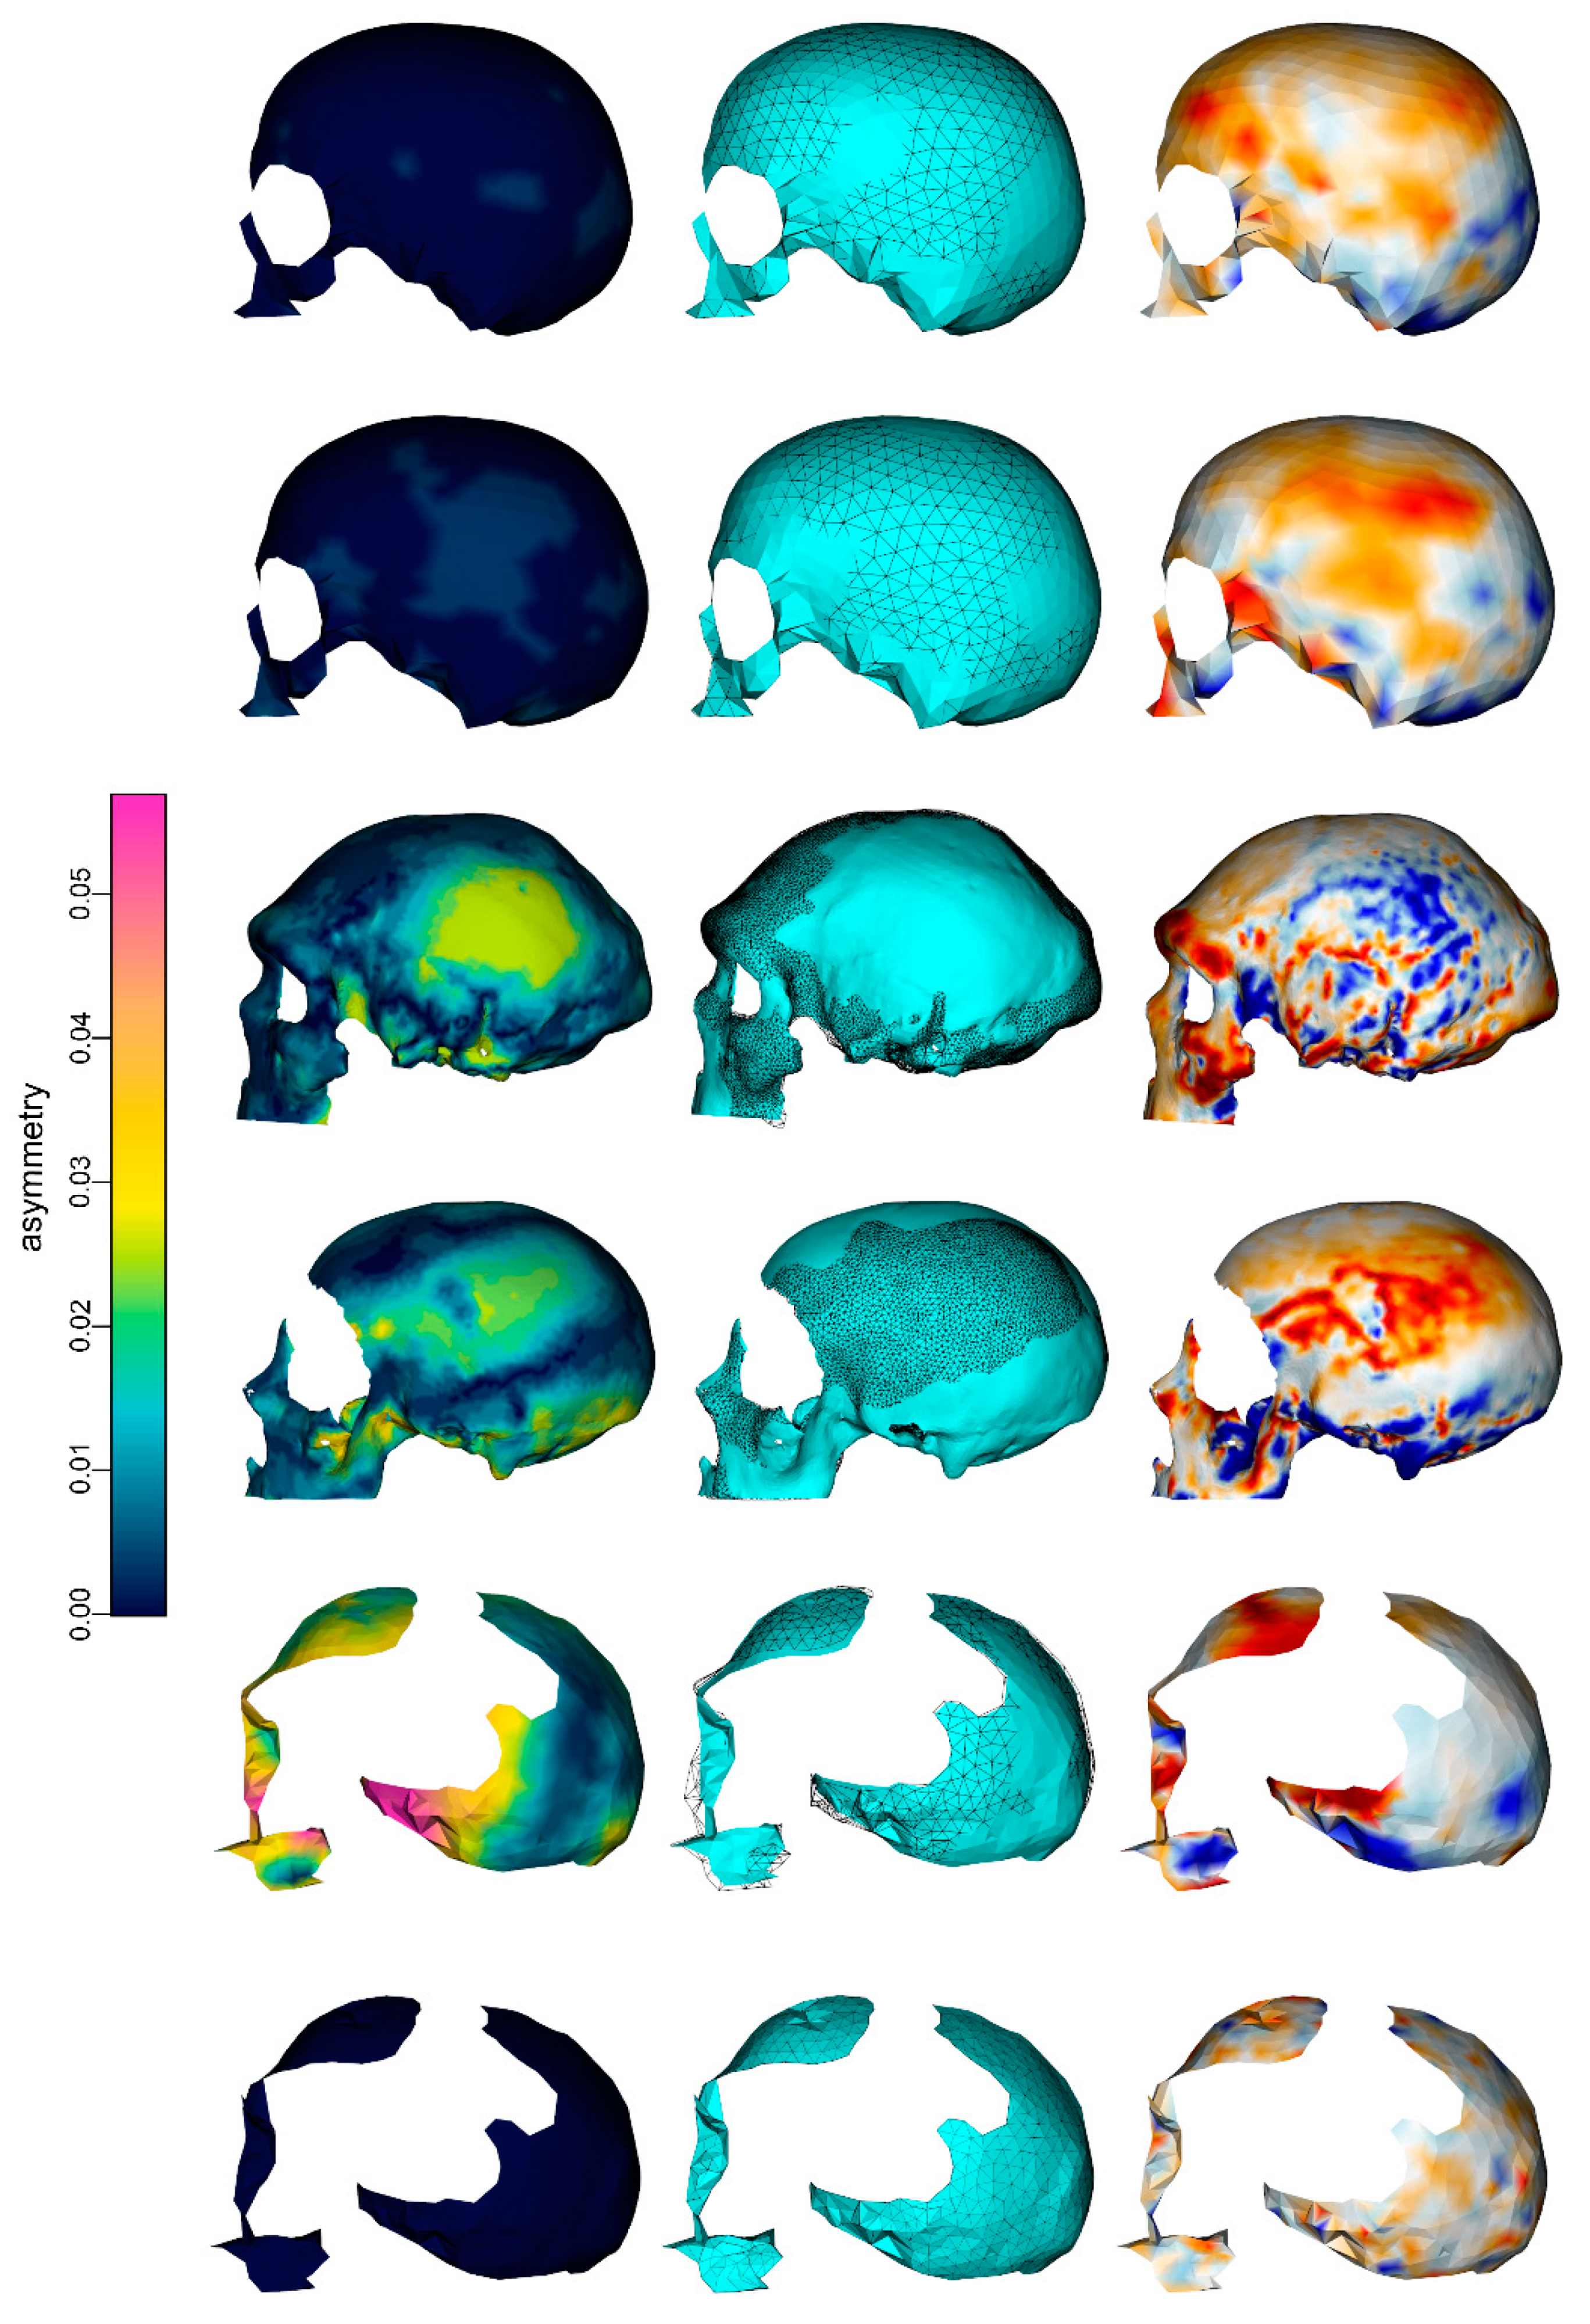
2.1. show.asymmetry
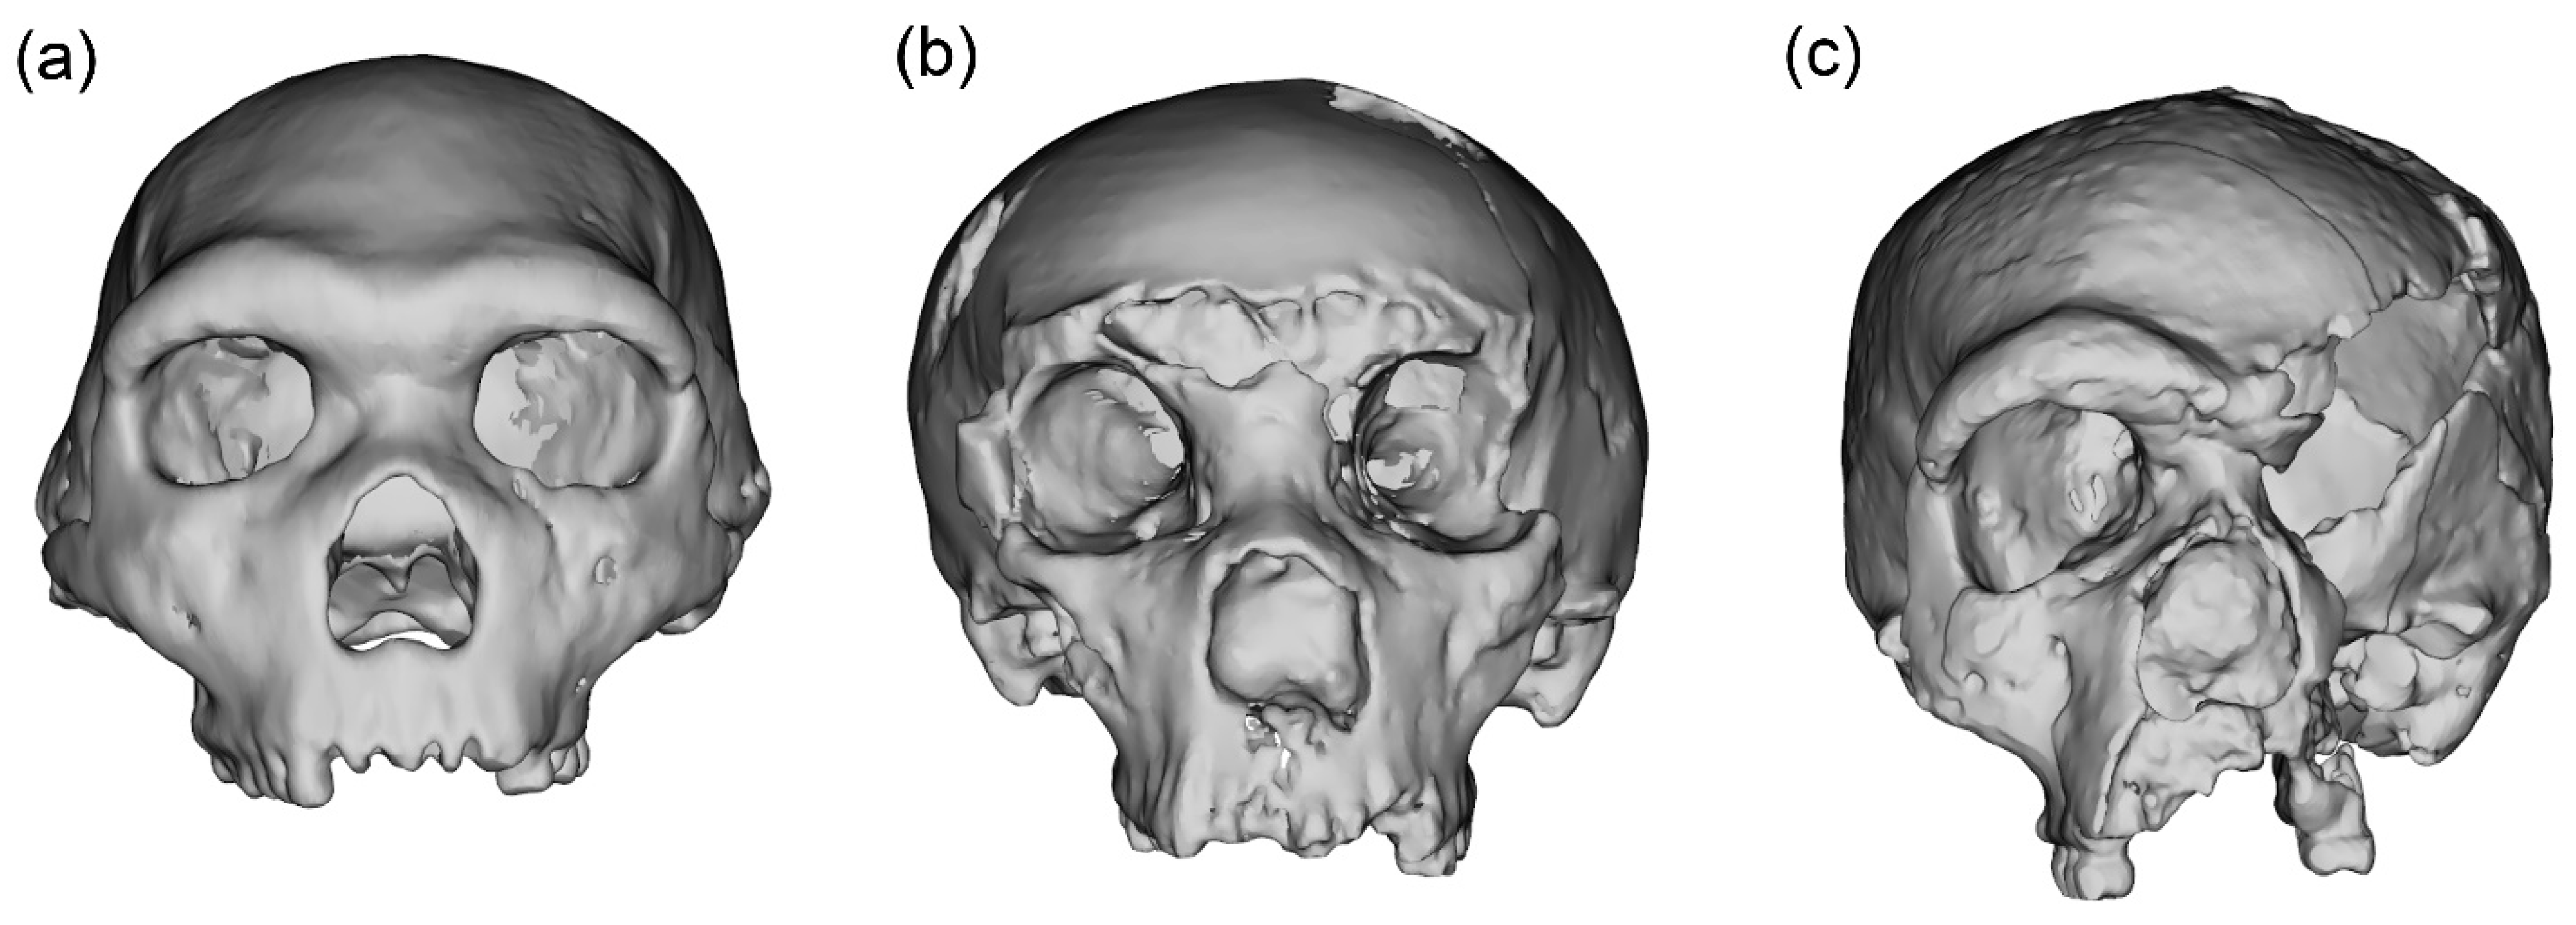
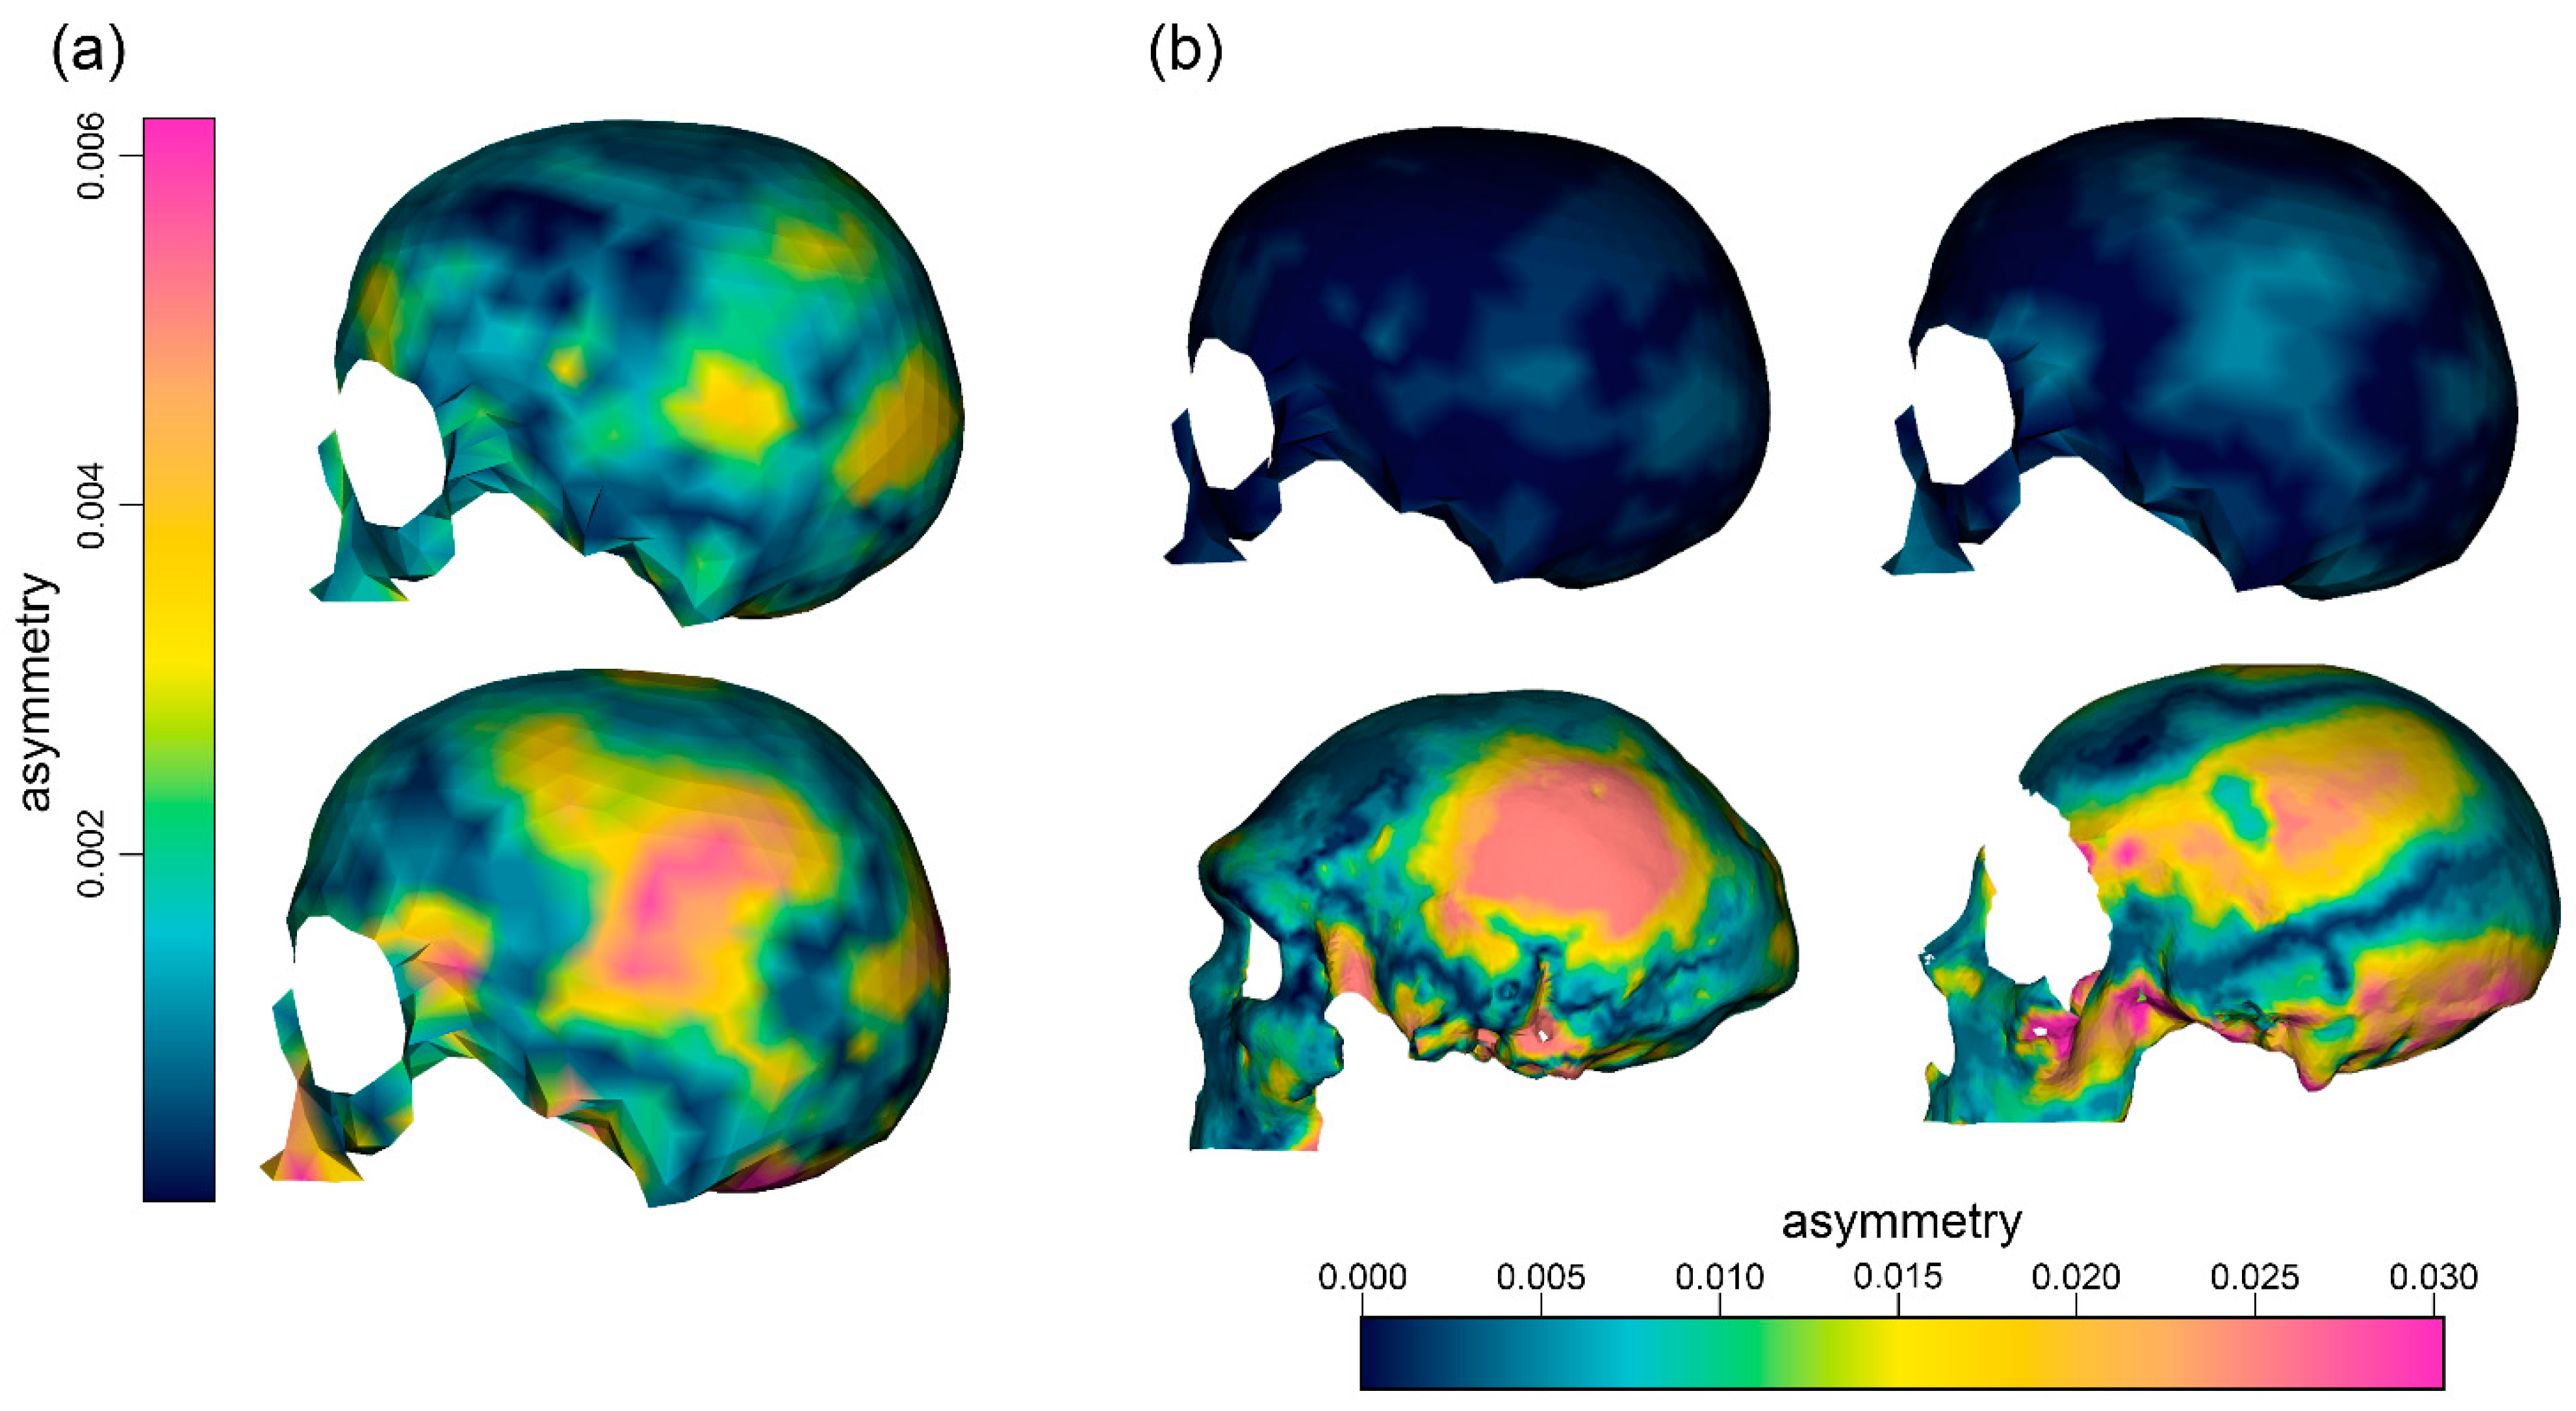
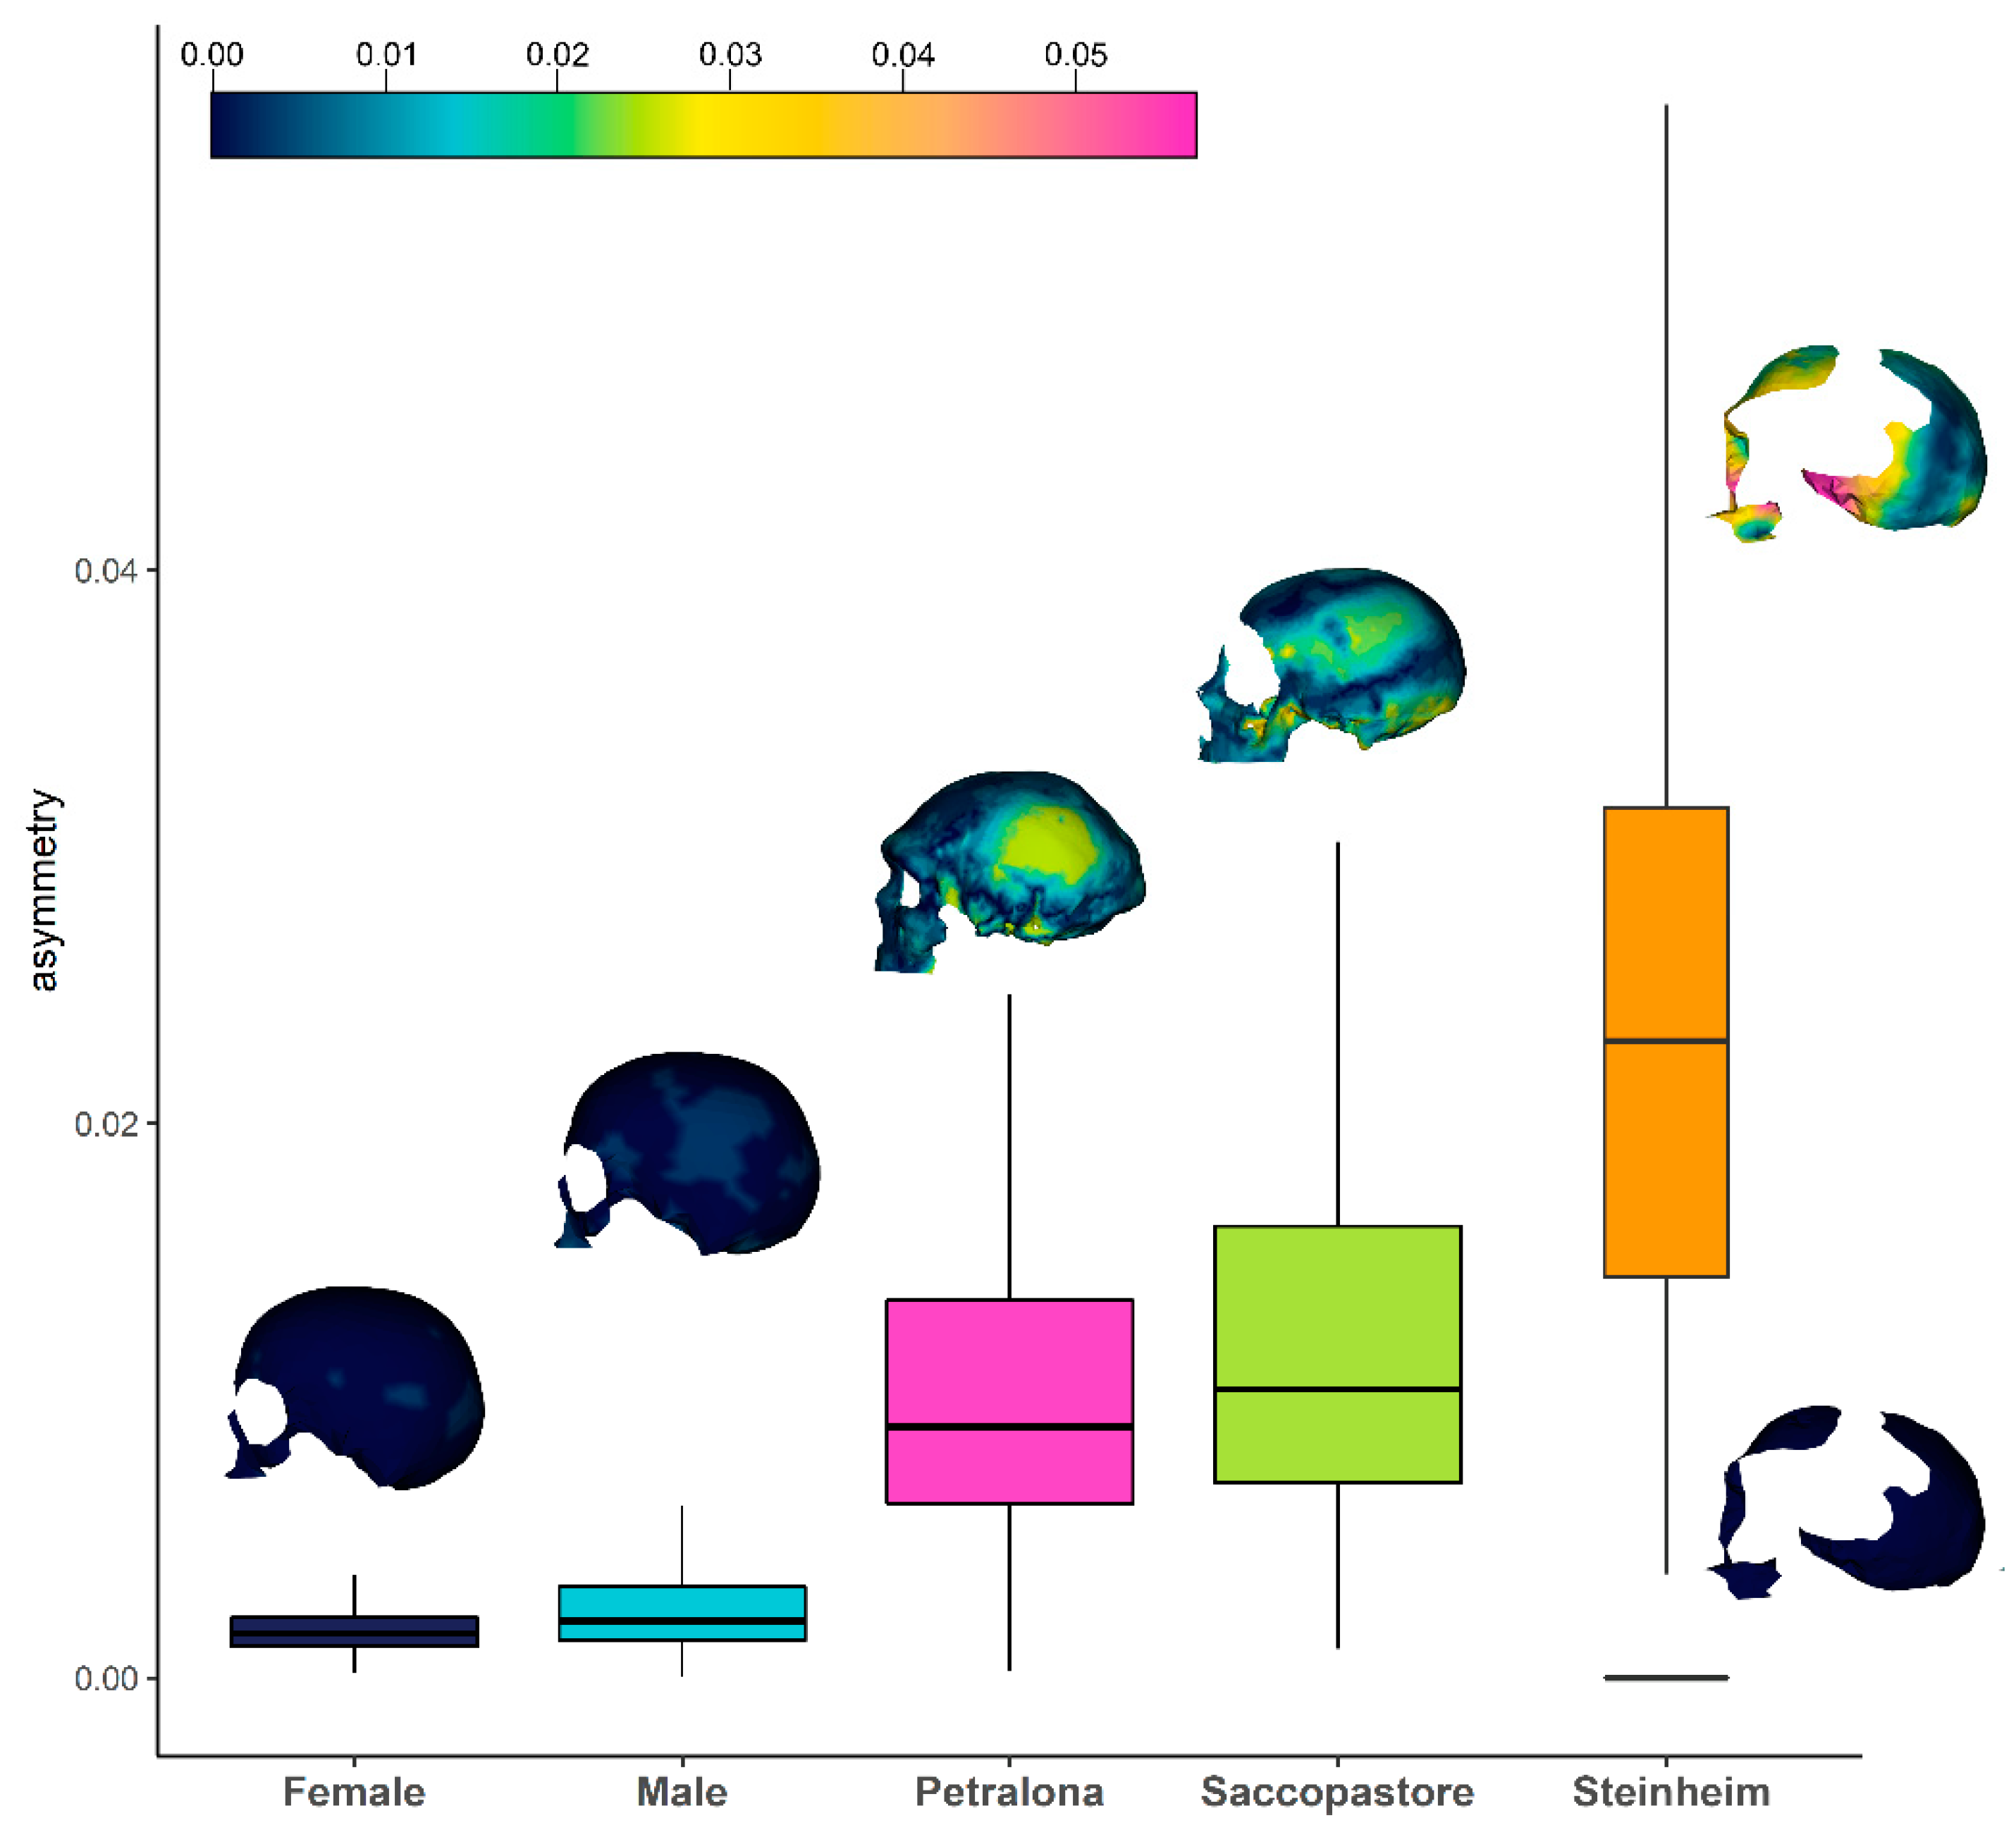
2.2. Case Studies
2.3. Data Preparation
3. Results
4. Discussion
5. Conclusions
Supplementary Materials
Author Contributions
Funding
Institutional Review Board Statement
Informed Consent Statement
Data Availability Statement
Acknowledgments
Conflicts of Interest
References
- Klingenberg, C.P. A developmental perspective on developmental instability: Theory, models and mechanisms. In Developmental Instability: Causes and Consequences, 1st ed.; Polak, M., Ed.; Oxford University Press: Oxford, UK, 2003; Volume 1, pp. 14–34. [Google Scholar]
- Marchand, H.; Paillat, G.; Montuire, S.; Butet, A. Fluctuating asymmetry in bank vole populations (Rodentia, Arvicolinae) reflects stress caused by landscape fragmentation in the Mont-Saint-Michel Bay. Biol. J. Linn. Soc. 2003, 80, 37–44. [Google Scholar] [CrossRef]
- Oleksyk, T.K.; Novak, J.M.; Purdue, J.R.; Gashchak, S.P.; Smith, M.H. High levels of fluctuating asymmetry in populations of Apodemus flavicollis from the most contaminated areas in Chornobyl. J. Environ. Radioact. 2004, 73, 1–20. [Google Scholar] [CrossRef] [Green Version]
- Lazić, M.M.; Carretero, M.A.; Crnobrnja-Isailović, J.; Kaliontzopoulou, A. Effects of environmental disturbance on phenotypic variation: An integrated assessment of canalization, developmental stability, modularity, and allometry in lizard head shape. Am. Nat. 2015, 185, 44–58. [Google Scholar] [CrossRef] [Green Version]
- Lezcano, A.H.; Rojas Quiroga, M.L.; Liberoff, A.L.; Van der Molen, S. Marine pollution effects on the southern surf crab Ovalipes trimaculatus (Crustacea: Brachyura: Polybiidae) in Patagonia Argentina. Mar. Pollut. Bull. 2015, 91, 524–529. [Google Scholar] [CrossRef]
- Chirichella, R.; Rocca, M.; Brugnoli, A.; Mustoni, A.; Apollonio, M. Fluctuating asymmetry in Alpine chamois horns: An indicator of environmental stress. Evol. Ecol. 2020, 34, 573–587. [Google Scholar] [CrossRef]
- Van Dongen, S.; Gangestad, S.W. Human fluctuating asymmetry in relation to health and quality: A meta-analysis. Evol. Hum. Behav. 2011, 32, 380–398. [Google Scholar] [CrossRef]
- Weisensee, K.E. Assessing the relationship between fluctuating asymmetry and cause of death in skeletal remains: A test of the developmental origins of health and disease hypothesis. Am. J. Hum. Biol. 2013, 25, 411–417. [Google Scholar] [CrossRef] [PubMed]
- Schaefer, K.; Fink, B.; Grammer, K.; Mitteroecker, P.; Gunz, P.; Bookstein, F.L. Female appearance: Facial and bodily attractiveness as shape. Psychol. Sci. 2006, 48, 187–204. [Google Scholar]
- Pflüger, L.S.; Oberzaucher, E.; Katina, S.; Holzleitner, I.J.; Grammer, K. Cues to fertility: Perceived attractiveness and facial shape predict reproductive success. Evol. Hum. Behav. 2012, 33, 708–714. [Google Scholar] [CrossRef]
- Muñoz-Reyes, J.A.; Pita, M.; Arjona, M.; Sanchez-Pages, S.; Turiegano, E. Who is the fairest of them all? The independent effect of attractive features and self-perceived attractiveness on cooperation among women. Evol. Hum. Behav. 2014, 35, 118–125. [Google Scholar] [CrossRef] [Green Version]
- Foo, Y.Z.; Simmons, L.W.; Rhodes, G. Predictors of facial attractiveness and health in humans. Sci. Rep. 2017, 7, 39731. [Google Scholar] [CrossRef] [PubMed] [Green Version]
- Komori, M.; Kawamura, S.; Ishihara, S. Averageness or symmetry: Which is more important for facial attractiveness? Acta Psychol. 2009, 131, 136–142. [Google Scholar] [CrossRef]
- Graham, J.H.; Özener, B. Fluctuating asymmetry of human populations: A review. Symmetry 2016, 8, 154. [Google Scholar] [CrossRef] [Green Version]
- Bigoni, L.; Krajíček, V.; Sládek, V.; Velemínský, P.; Velemínská, J. Skull shape asymmetry and the socioeconomic structure of an early medieval central european society. Am. J. Phys. Anthropol. 2013, 150, 349–364. [Google Scholar] [CrossRef]
- Palmer, A.R. Symmetry breaking and the evolution of development. Science 2004, 306, 828–833. [Google Scholar] [CrossRef] [PubMed] [Green Version]
- Cantalupo, C.; Hopkins, W.D. Asymmetric Broca’s area in great apes. Nature 2001, 414, 505. [Google Scholar] [CrossRef] [Green Version]
- Claes, P.; Walters, M.; Shriver, M.D.; Puts, D.; Gibson, G.; Clement, J.; Baynam, G.; Verbeke, G.; Vandermeulen, D.; Suetens, P. Sexual dimorphism in multiple aspects of 3D facial symmetry and asymmetry defined by spatially dense geometric morphometrics. J. Anat. 2012, 221, 97–114. [Google Scholar] [CrossRef] [PubMed]
- Ekrami, O.; Claes, P.; White, J.D.; Weinberg, S.M.; Marazita, M.L.; Walsh, S.; Shriver, M.D.; Van Dongen, S. A multivariate approach to determine the dimensionality of human facial asymmetry. Symmetry 2020, 12, 348. [Google Scholar] [CrossRef] [Green Version]
- Palmer, A.R. Antisymmetry. In Variation; Elsevier: Amsterdam, The Netherlands, 2005; p. 359-XXIV. [Google Scholar]
- Vingerhoets, G.; Gerrits, R.; Verhelst, H. Atypical brain asymmetry in human situs inversus: Gut feeling or real evidence? Symmetry 2021, 13, 695. [Google Scholar] [CrossRef]
- Sansom, R.S.; Wills, M.A. Fossilization causes organisms to appear erroneously primitive by distorting evolutionary trees. Sci. Rep. 2013, 3, 2545. [Google Scholar] [CrossRef] [Green Version]
- Lautenschlager, S. Reconstructing the past: Methods and techniques for the digital restoration of fossils. R. Soc. Open Sci. 2016, 3, 160342. [Google Scholar] [CrossRef] [Green Version]
- Gunz, P.; Mitteroecker, P.; Neubauer, S.; Weber, G.W.; Bookstein, F.L. Principles for the virtual reconstruction of hominin crania. J. Hum. Evol. 2009, 57, 48–62. [Google Scholar] [CrossRef]
- Benazzi, S.; Bookstein, F.L.; Strait, D.S.; Weber, G.W. A new OH5 reconstruction with an assessment of its uncertainty. J. Hum. Evol. 2011, 61, 75–88. [Google Scholar] [CrossRef]
- Benazzi, S.; Gruppioni, G.; Strait, D.S.; Hublin, J.J. Technical Note: Virtual reconstruction of KNM-ER 1813 Homo habilis cranium. Am. J. Phys. Anthropol. 2014, 153, 154–160. [Google Scholar] [CrossRef]
- Zollikofer, C.P.E.; Ponce de León, M.S.; Lieberman, D.E.; Guy, F.; Pilbeam, D.; Likius, A.; Mackaye, H.T.; Vignaud, P.; Brunet, M. Virtual cranial reconstruction of Sahelanthropus tchadensis. Nature 2005, 434, 755–759. [Google Scholar] [CrossRef] [PubMed]
- Tallman, M.; Amenta, N.; Delson, E.; Frost, S.R.; Ghosh, D.; Klukkert, Z.S.; Morrow, A.; Sawyer, G.J. Evaluation of a new method of fossil retrodeformation by algorithmic symmetrization: Crania of papionins (primates, cercopithecidae) as a test case. PLoS ONE 2014, 9, e100833. [Google Scholar] [CrossRef] [PubMed] [Green Version]
- Schlager, S.; Profico, A.; Di Vincenzo, F.; Manzi, G. Retrodeformation of fossil specimens based on 3D bilateral semi-landmarks: Implementation in the R package “Morpho”. PLoS ONE 2018, 13, e0194073. [Google Scholar] [CrossRef]
- Cirilli, O.; Melchionna, M.; Serio, C.; Bernor, R.L.; Bukhsianidze, M.; Lordkipanidze, D.; Rook, L.; Profico, A.; Raia, P. Target Deformation of the Equus stenonis Holotype Skull: A Virtual Reconstruction. Front. Earth Sci. 2020, 8, 247. [Google Scholar] [CrossRef]
- Mardia, K.V.; Bookstein, F.L.; Moreton, I.J. Statistical assessment of bilateral symmetry of shapes. Biometrika 2000, 87, 285–300. [Google Scholar] [CrossRef]
- Schlager, S. Morpho and Rvcg—Shape Analysis in R: R-Packages for Geometric Morphometrics, Shape Analysis and Surface Manipulations. In Statistical Shape and Deformation Analysis: Methods, Implementation and Applications; Zheng, G., Li, S., Székely, G., Eds.; Academic Press: Cambridge, MA, USA, 2017; pp. 217–256. ISBN 9780128104941. [Google Scholar]
- Klingenberg, C.P. Analyzing fluctuating asymmetry with geometric morphometrics: Concepts, methods, and applications. Symmetry 2015, 7, 843–934. [Google Scholar] [CrossRef] [Green Version]
- Neubauer, S.; Gunz, P.; Scott, N.A.; Hublin, J.J.; Mitteroecker, P. Evolution of brain lateralization: A shared hominid pattern of endocranial asymmetry is much more variable in humans than in great apes. Sci. Adv. 2020, 6, eaax9935. [Google Scholar] [CrossRef] [Green Version]
- Profico, A.; Buzi, C.; Castiglione, S.; Melchionna, M.; Piras, P.; Veneziano, A.; Raia, P. Arothron: An R package for geometric morphometric methods and virtual anthropology applications. Am. J. Phys. Anthropol. 2021, 176, 144–151. [Google Scholar] [CrossRef]
- Profico, A.; Zeppilli, C.; Micarelli, I.; Mondanaro, A.; Raia, P.; Marchi, D.; Manzi, G.; O’Higgins, P. Morphometric maps of bilateral asymmetry in the human humerus: An implementation in the R package morphomap. Symmetry. under review.
- Seidler, H.; Falk, D.; Stringer, C.; Wilfing, H.; Müller, G.B.; Zur Nedden, D.; Weber, G.W.; Reicheis, W.; Arsuaga, J.L. A comparative study of stereolithographically modelled skulls of Petralona and Broken Hill: Implications for future studies of middle Pleistocene hominid evolution. J. Hum. Evol. 1997, 33, 691–703. [Google Scholar] [CrossRef] [PubMed]
- Rightmire, G.P. Middle Pleistocene Homo Crania from Broken Hill and Petralona: Morphology, metric comparisons, and evolutionary relationships. In Human Paleontology and Prehistory; Springer: Berlin/Heidelberg, Germany, 2017; pp. 145–159. [Google Scholar]
- Cuff, A.R.; Rayfield, E.J. Retrodeformation andmuscular reconstruction of ornithomimosaurian dinosaur crania. PeerJ 2015, 3, e1093. [Google Scholar] [CrossRef]
- Buzi, C.; Profico, A.; Di Vincenzo, F.; Harvati, K.; Melchionna, M.; Raia, P.; Manzi, G. Retrodeformation of the Steinheim cranium: Insights into the evolution of Neanderthals. Symmetry 2021, 34, 1611. [Google Scholar] [CrossRef]
- Hublin, J.J. The origin of Neandertals. Proc. Natl. Acad. Sci. USA 2009, 106, 16022–16027. [Google Scholar] [CrossRef] [PubMed] [Green Version]
- Mounier, A.; Caparros, M. The phylogenetic status of Homo heidelbergensis—A cladistic study of Middle Pleistocene hominins. Bull. Mem. Soc. Anthropol. Paris 2015, 27, 110–134. [Google Scholar] [CrossRef]
- Stalling, D.; Westerhoff, M.; Hege, H.C. Amira: A highly interactive system for visual data analysis. Vis. Handb. 2005, 1, 749–767. [Google Scholar] [CrossRef]
- Prossinger, H.; Seidler, H.; Wicke, L.; Weaver, D.; Recheis, W.; Stringer, C.; Müller, G.B. Electronic removal of encrustations inside the steinheim cranium reveals paranasal sinus features and deformations, and provides a revised endocranial volume estimate. Anat. Rec. Part B New Anat. 2003, 273, 132–142. [Google Scholar] [CrossRef] [PubMed]
- Adams, D.; Collyer, M.; Kaliontzopoulou, A.; Baken, E. Geomorph: Software for Geometric Morphometric Analyses. R Package Version 4.0. Available online: https://cran.r-project.org/package=geomorph (accessed on 21 July 2021).
- Schwartz, J.H.; Tattersall, I. The Human Fossil Record; John Wiley & Sons: New York, NY, USA, 2005; Volume 2, ISBN 0471319287. [Google Scholar]
- Bruner, E.; Manzi, G. CT-based description and phyletic evaluation of the archaic human calvarium from Ceprano, Italy. Anat. Rec. Part A Discov. Mol. Cell. Evol. Biol. 2005, 285, 643–657. [Google Scholar] [CrossRef]


| Argument Name | Explanation |
|---|---|
| set | A single matrix k × m or a k × m × n array, where k is the number of points, m is the number of dimensions, and n is the sample size. |
| x | character: the species/specimens to be analyzed; names specified in the x argument must be included and coincide with the dimnames of the array. |
| pairs | A two-column data frame containing the indices (row numbers) of the bilateral landmarks. |
| scale.size | logical: if TRUE, the asymmetry will be corrected with the maximum interlandmark distance. |
| uniform.range | logical: if TRUE, the color range for the asymmetry visualization will be uniform among all specimens analyzed. |
| scale.sides | logical: if TRUE, the left and the right side will be scaled during the Procrustes superimposition process. |
| scale.ranges | logical: if TRUE, the vector of asymmetry values will be scaled from 0 to 1. |
| PCA | logical: if TRUE, a Principal Component Analysis is performed. |
| pcx | numeric: first PC axis to be visualized. |
| pcy | numeric: second PC axis to be visualized. |
| ref.sur | Reference surfaces to be used for the visualization; if ref.sur is NULL, the surfaces will be automatically reconstructed starting from the landmarks by using the vcgBallPivoting algorithm from Morpho R package (Schlager, 2017). |
| .from | numeric: minimum distance for the asymmetry to be colorized. |
| .to | numeric: maximum distance for the asymmetry to be colorized. |
| plot | logical: if TRUE, visualize result for asymmetry as 3D plot. |
| pal.dist | logical: if TRUE, the mesh area differences are displayed in a second 3D plot. |
| pal.areas | logical: if TRUE, the names of the species and/or the number of the node are displayed in the 3D plot. |
| Value | Explanation |
|---|---|
| asym | Vector of asymmetry values. |
| area.differences | Vector of area differences values. |
| asymmetry.surfaces | List of objects of mesh3d colorized according to the asymmetry values. |
| area.diff.surfaces | List of objects of mesh3d colorized according to the area differences values. |
| PCA | List object containing the mean shape, PC scores, PCs, and the variance table according to the output from Morpho::procSym. |
| asymmetric.component | The percentage of shape variance explained by asymmetry. |
| DA | The percentage of directional asymmetry. |
| FA | The percentage of the fluctuating asymmetry. |
Publisher’s Note: MDPI stays neutral with regard to jurisdictional claims in published maps and institutional affiliations. |
© 2021 by the authors. Licensee MDPI, Basel, Switzerland. This article is an open access article distributed under the terms and conditions of the Creative Commons Attribution (CC BY) license (https://creativecommons.org/licenses/by/4.0/).
Share and Cite
Melchionna, M.; Profico, A.; Buzi, C.; Castiglione, S.; Mondanaro, A.; Del Bove, A.; Sansalone, G.; Piras, P.; Raia, P. A New Integrated Tool to Calculate and Map Bilateral Asymmetry on Three-Dimensional Digital Models. Symmetry 2021, 13, 1644. https://doi.org/10.3390/sym13091644
Melchionna M, Profico A, Buzi C, Castiglione S, Mondanaro A, Del Bove A, Sansalone G, Piras P, Raia P. A New Integrated Tool to Calculate and Map Bilateral Asymmetry on Three-Dimensional Digital Models. Symmetry. 2021; 13(9):1644. https://doi.org/10.3390/sym13091644
Chicago/Turabian StyleMelchionna, Marina, Antonio Profico, Costantino Buzi, Silvia Castiglione, Alessandro Mondanaro, Antonietta Del Bove, Gabriele Sansalone, Paolo Piras, and Pasquale Raia. 2021. "A New Integrated Tool to Calculate and Map Bilateral Asymmetry on Three-Dimensional Digital Models" Symmetry 13, no. 9: 1644. https://doi.org/10.3390/sym13091644
APA StyleMelchionna, M., Profico, A., Buzi, C., Castiglione, S., Mondanaro, A., Del Bove, A., Sansalone, G., Piras, P., & Raia, P. (2021). A New Integrated Tool to Calculate and Map Bilateral Asymmetry on Three-Dimensional Digital Models. Symmetry, 13(9), 1644. https://doi.org/10.3390/sym13091644