Article

Fish Classification Using DNA Barcode Sequences through Deep Learning Method

1
School of Information Science and Engineering, Xinjiang University, Urumqi 830046, China
2
School of Life Science and Technology, Xinjiang University, Urumqi 830046, China
*
Authors to whom correspondence should be addressed.
Symmetry 2021, 13(9), 1599; https://doi.org/10.3390/sym13091599
Submission received: 31 July 2021 / Revised: 23 August 2021 / Accepted: 29 August 2021 / Published: 31 August 2021
(This article belongs to the Section Computer)

Abstract

:
Fish is one of the most extensive distributed organisms in the world. Fish taxonomy is an important component of biodiversity and the basis of fishery resources management. The DNA barcode based on a short sequence fragment is a valuable molecular tool for fish classification. However, the high dimensionality of DNA barcode sequences and the limitation of the number of fish species make it difficult to reasonably analyze the DNA sequences and correctly classify fish from different families. In this paper, we propose a novel deep learning method that fuses Elastic Net-Stacked Autoencoder (EN-SAE) with Kernel Density Estimation (KDE), named ESK model. In stage one, the ESK preprocesses original data from DNA barcode sequences. In stage two, EN-SAE is used to learn the deep features and obtain the outgroup score of each fish. In stage three, KDE is used to select a threshold based on the outgroup scores and classify fish from different families. The effectiveness and superiority of ESK have been validated by experiments on three datasets, with the accuracy, recall, F1-Score reaching 97.57%, 97.43%, and 98.96% on average. Those findings confirm that ESK can accurately classify fish from different families based on DNA barcode sequences.

1. Introduction

Fish is one of the most widely studied aquatic organisms. As an international, peer-reviewed, open access journal, Symmetry contains articles from many different fields that are of great help to our research. There are about 27,683 species of fish in the world, divided into 6 classes, 62 orders, and 540 families [1,2]. Fish taxonomy and rapid species identification are basic prerequisites for fishery biodiversity and fishery resources management, as well as an important part of biodiversity. As a traditional approach, morphology-based methods have successfully described nearly one million species on the earth, providing a good basis for fish taxonomic identification [3,4]. However, traditional methods face challenges for fish classification owing to four limitations: First, due to individual, gender, and geographical differences, both phenotypic plasticity and genetic variability used for fish discrimination can result in misclassification [5]. Second, with the deterioration of the ecological environment and the disturbance of human activities, many fishery resources have been seriously damaged, making it more difficult to collect fish specimens, especially those with fewer natural resources [6,7]. Third, some fish show subtle differences in body shape, color pattern, scale size, and other external visible morphological features, causing confusion of the same species. Finally, fish classification demands professional taxonomic knowledge as well as a wealth of experience, and misdiagnosis is common [8]. The limitations of morphology-based methods, a new technique to fish classification is needed.
Genomic approach is a new taxonomic technique that combines molecular biology with bioinformatics, using DNA sequences as ‘barcodes’ to differentiate organisms [5]. The DNA barcode-based methods are attainable to non-specialists. Many studies have shown the effectiveness of DNA barcoding technology; it has been extensive used in various fields, such as species identification [9], discovery of new or cryptic species [10,11], phylogeny and molecular evolution [12], biodiversity survey and assessment [13,14], customs inspection and quarantine [15], and conservation biology [16]. In the field of animal classification, DNA barcoding is based on about 658 base pair fragments of the cytochrome c oxidase subunit I(COI). It is increasingly used to build global standard dataset platforms, universal technical rules, and animal taxonomy identification systems [1]. The COI gene has the characteristics of high evolution rate, obvious interspecific variation, relatively conservative within species, good universality of primers and easy amplification [17]. Therefore, the COI gene has been widely employed as an effective DNA barcode for the classification of various animals, including birds [18,19], mosquitoes [20,21], marine fish [4,22,23], freshwater fish [17,24,25]. DNA barcode based on the COI gene can be used to identify marine fish up to 98%, freshwater fish can be identified with 93% accuracy [26]. The approaches base on DNA barcode have proven to be a valuable molecular tool for fish classification.
Methods based on DAN barcode can be categorized into four types: tree-based methods [18], similarity-based methods [27], character-based methods [28], and machine learning-based methods [29,30,31]. In biology, DNA barcode-based methods typically analyze DNA sequences, then calculate genetic distances and construct phylogenetic trees to classify organisms [32]. For machine learning-based methods, several classifiers have been proposed, including support vector machine (SVM) [33], k-nearest neighbor (KNN) [34], and random forest (RF) [35]. However, the high dimensionality of DAN barcode sequences, lack of interspecific sequence variation and the numerical limitation of fish species, analyzing these sequences reasonably and obtaining available information that humans can classify fish correctly is a major challenge.
Deep learning, a method for learning and extracting useful representations from raw data, training model, and then using the model to make predictions, has made great progress in recent years [36]. Therefore, in this paper, we propose a novel method using DNA barcode sequences through deep learning model to classify fish from different families and determine which fish are regarded as outgroups, called ESK model. First, the method aligns DNA sequences to obtain the sequences with the same length, then, converts them into numerical data by using one-hot encoding. Second, the model uses Elastic Net-Stacked Autoencoder (EN-SAE) to learn data features and obtains an outgroup score of each object. Finally, Kernel Density Estimation (KDE) is used to generate a threshold and predict which fish are outgroups base on the threshold. To verify the effectiveness of ESK model, three families with a large number of species and obvious interspecific variation are selected as datasets, and the best results were obtained, with the accuracy, recall, F1-Score reaching 97.57%, 97.43%, and 98.96% on average. The main contributions of our paper are as follows:
  • To solve the problem of high dimensionality of DNA barcode sequences, we introduce a deep learning model to extract useful features and classify fish from different families, which is effective and robust.
  • To address the problem of overfitting caused by small dataset due to the limited number of species in the family, the Elastic Net is introduced for the proposed method to improve the generalization ability.
  • We employ EN-SAE model to receive the outgroup scores. The decision threshold is automatically learned by the KDE technique. A novel predictor is proposed based on the outgroup scores, while other classification studies often omit the importance of automatic learning threshold.
  • We quantitatively evaluate the performance of our method, and the results show that the ESK model outperforms four commonly used machine learning methods. The effectiveness and feasibility of using the proposed model for fish classification is demonstrated.

2. Materials and Methods

2.1. Datasets

The DAN barcode sequences of three major families in this study were obtained from GenBank (www.ncbi.nlm.nih.gov, accessed on 18 October 2020), including Sciaenidae, Barbinae, and Mugilidae. Among them, Sciaenidae and Mugilidae belong to marine fish, Barbinae belong to freshwater fish. The genetic relationship and molecular divergence were considered in the selection of outgroups. The relevant information concerning dimension, sample size and outgroup ratio of three datasets is summarized in Table 1.
  • Sciaenidae. The COI fragments contained 307 individuals of 21 species, 13 genera in Sciaenidae family. 18 homologous sequences in Nemipterus virgatus, Epinephelus awoara, Leiognathus equulus and Leiognathus ruconius were selected from different families, which were under the same order as Sciaenidae. After processing, the length of sequence was 596 bp. Species of experimental samples on Sciaenidae is shown in Table S1 (Supplementary Materials).
  • Barbinae. A total of 998 individuals were selected from 103 species pertaining to 9 genera of Barbinae, and their DNA barcode sequences were 544 bp in length. In addition, 24 homologous sequences from 6 genera including Foa brachygramma and Cheilodipterus macrodon belonging to Apogonidae were used as outgroups. Species of experimental samples on Barbinae is shown in Table S2.
  • Mugilidae. In this dataset, 776 Mugilidae sequences from 23 species belong to 7 genera were collected, and their DNA barcode sequences were 565 bp in length. 20 homologous sequences in Sphyraena pinguis and Sphyraena jello from Mugiliformes were designated as outgroups. Species of experimental samples on Mugilidae are shown in Table S3.

2.2. Method Introduction

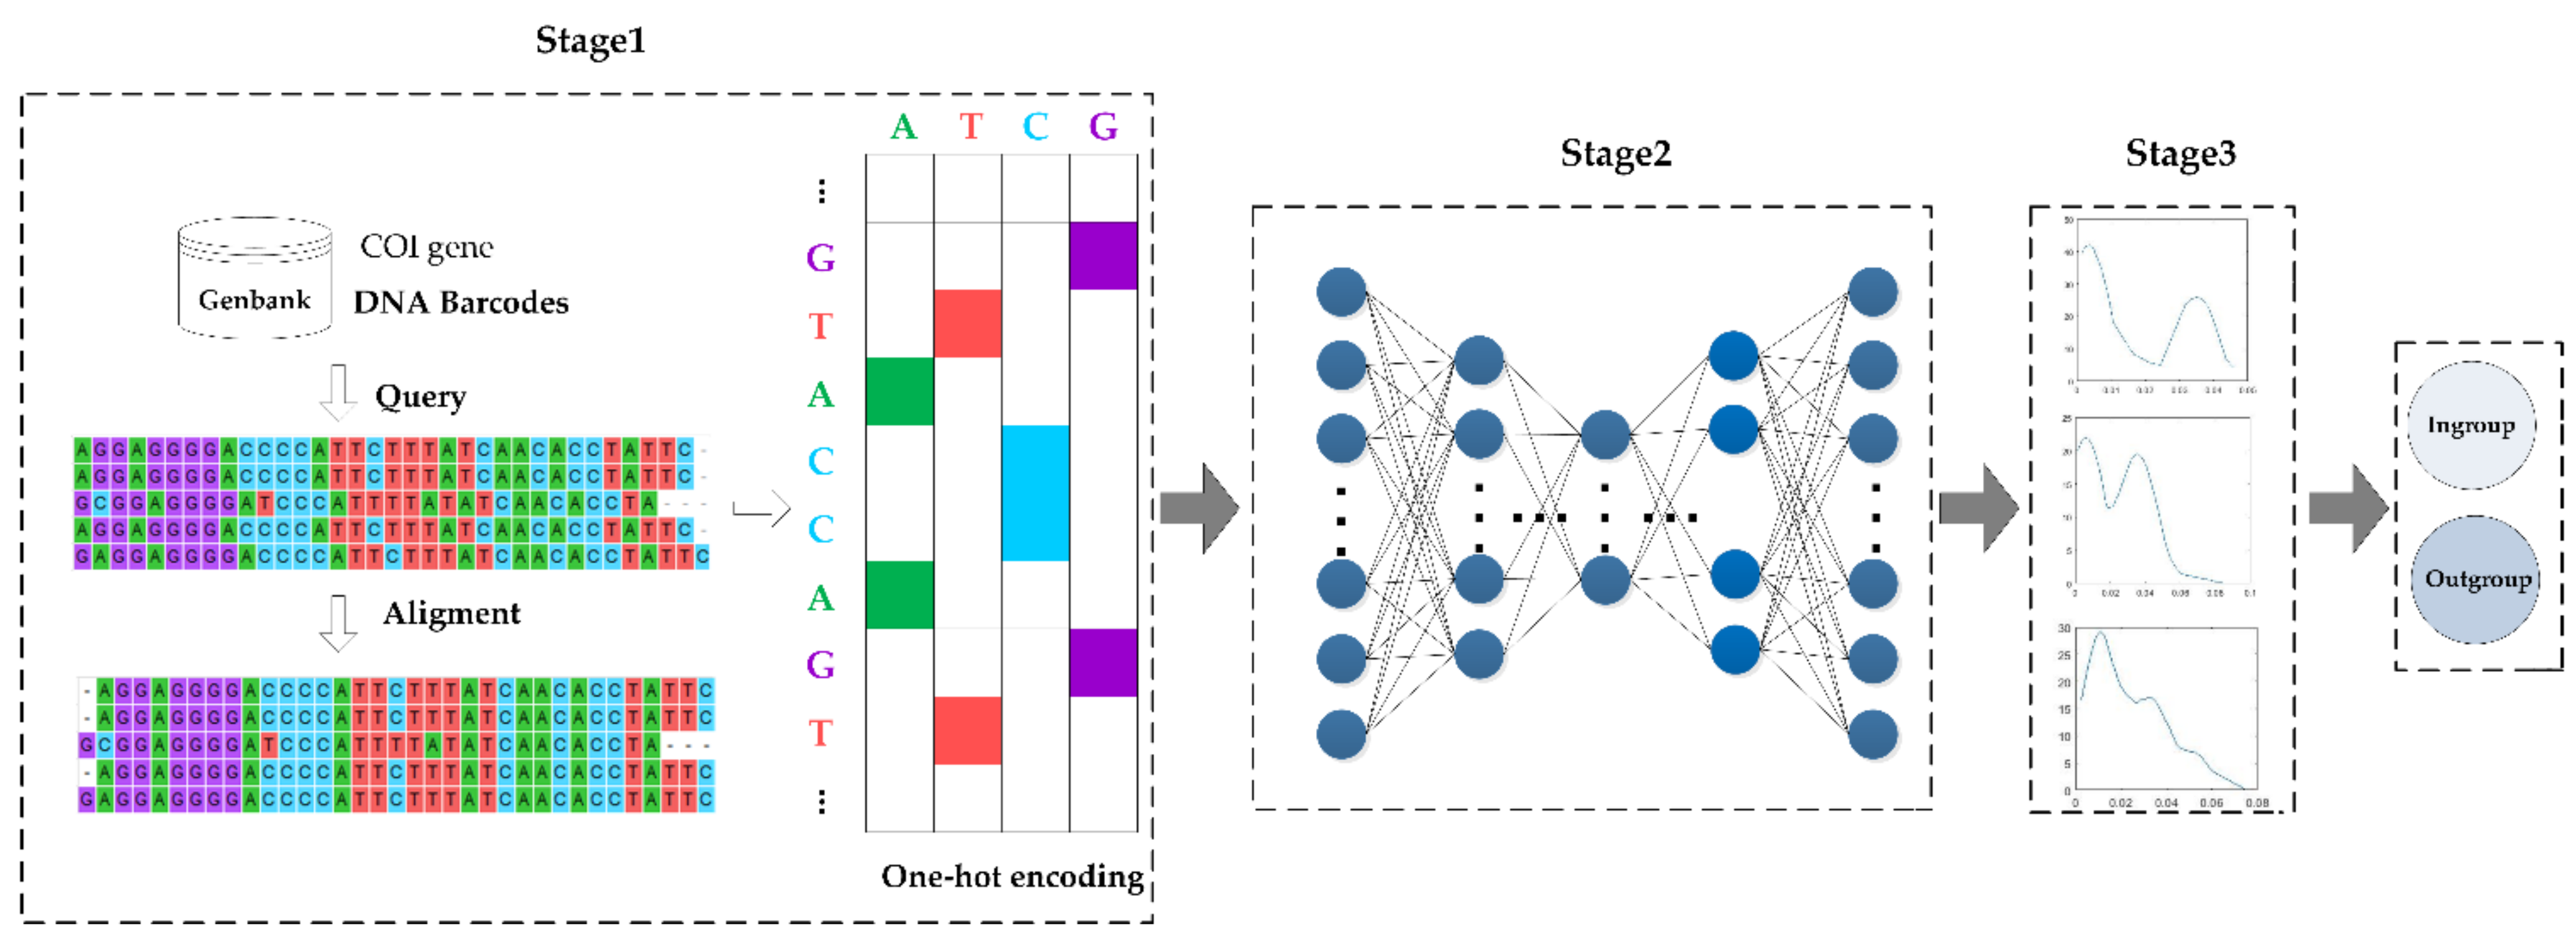
2.2.1. An Overview of ESK

An overview of the proposed model is shown in Figure 1, ESK model, which consists of three stages: (1) data preprocessing stage, (2) learning deep features and computing each sample outgroup score stage, and (3) deciding a threshold base on the outgroup scores and classifying fish from different families.
In stage one, there are three main tasks: (1) aligning DNA barcode sequences to obtain the sequences with the same length. (2) representing DNA barcode sequences in a matrix and (3) one-hot encoding is performed on the matrix because the features of each species need to be transformed into numerical form. Finally, the preprocessed data is used as an input for stage two.
In stage two, a deep learning network, EN-SAE, is used to learn deep features from the data preprocessed in stage one. The method utilizes EN-SAE to compress the digitalized data into a representation of the potential data to reconstruct input, then, calculates the difference between input and output, and obtains an outgroup score for each sample. Finally, the outgroup scores are used as input for stage three.
In stage three, KDE technique is used to learn the relationship between each score from stage two, and then, fits the data distribution according to properties of the outgroup scores. After that, KDE determines which objects are ingroups and which objects are outgroups based on the threshold.

2.2.2. Data Preprocessing

Since the sequences are obtained according to different association numbers in GenBank, the length of each sequence is different. The sequence alignment tool MEGA [37] software is used for sequence comparison analysis to obtain sequences of the same length. For subsequent processing, the DNA sequences can be represented as a matrix. The COI sequences for each dataset are formulated as follows:
X = x 11 x 12 x 1 m x 21 x 22 x 2 m x n 1 x n 2 x n m
where n denotes the size of dataset, and m denotes the number of features in each sample.
The model encodes matrix into a numeric type data by using one-hot encoding. One-hot encoding is used to convert categorical variables into a form that is easy to use by machine learning algorithms. The encoding is a combination of 0 and 1 [38]. A DNA barcode sequence consists of four bases, namely A, T, C and G. Each coded base is a 1 × 4 vector [0, 0, ai, 0], where ai = 1. Therefore, four bases are represented as follows:
A T C G = 1 0 0 0 0 1 0 0 0 0 1 0 0 0 0 1

2.2.3. Learning Deep Features and Computing the Outgroup Scores by EN-SAE

The traditional Autoencoder (AE) is a three-layer neural network, including an input layer, an output layer, and a hidden layer. The structure of AE is symmetric, that is, input and output layers have the same number of nodes and the dimension of each node is also the same [39]. The purpose of AE is to compress input data, save useful information to reconstruct input, and use the back propagation algorithm to update the weights so that the output is as similar to the input as possible [40]. However, the relatively long base pair segments of DNA barcode lead to high dimensionality in each dataset, the output is not sufficient to yield a valuable representation of input. The reconstruction criterion with three-layer structure is unable to guarantee the extraction of useful features as it can lead to the obvious solution “simply copy the input” [
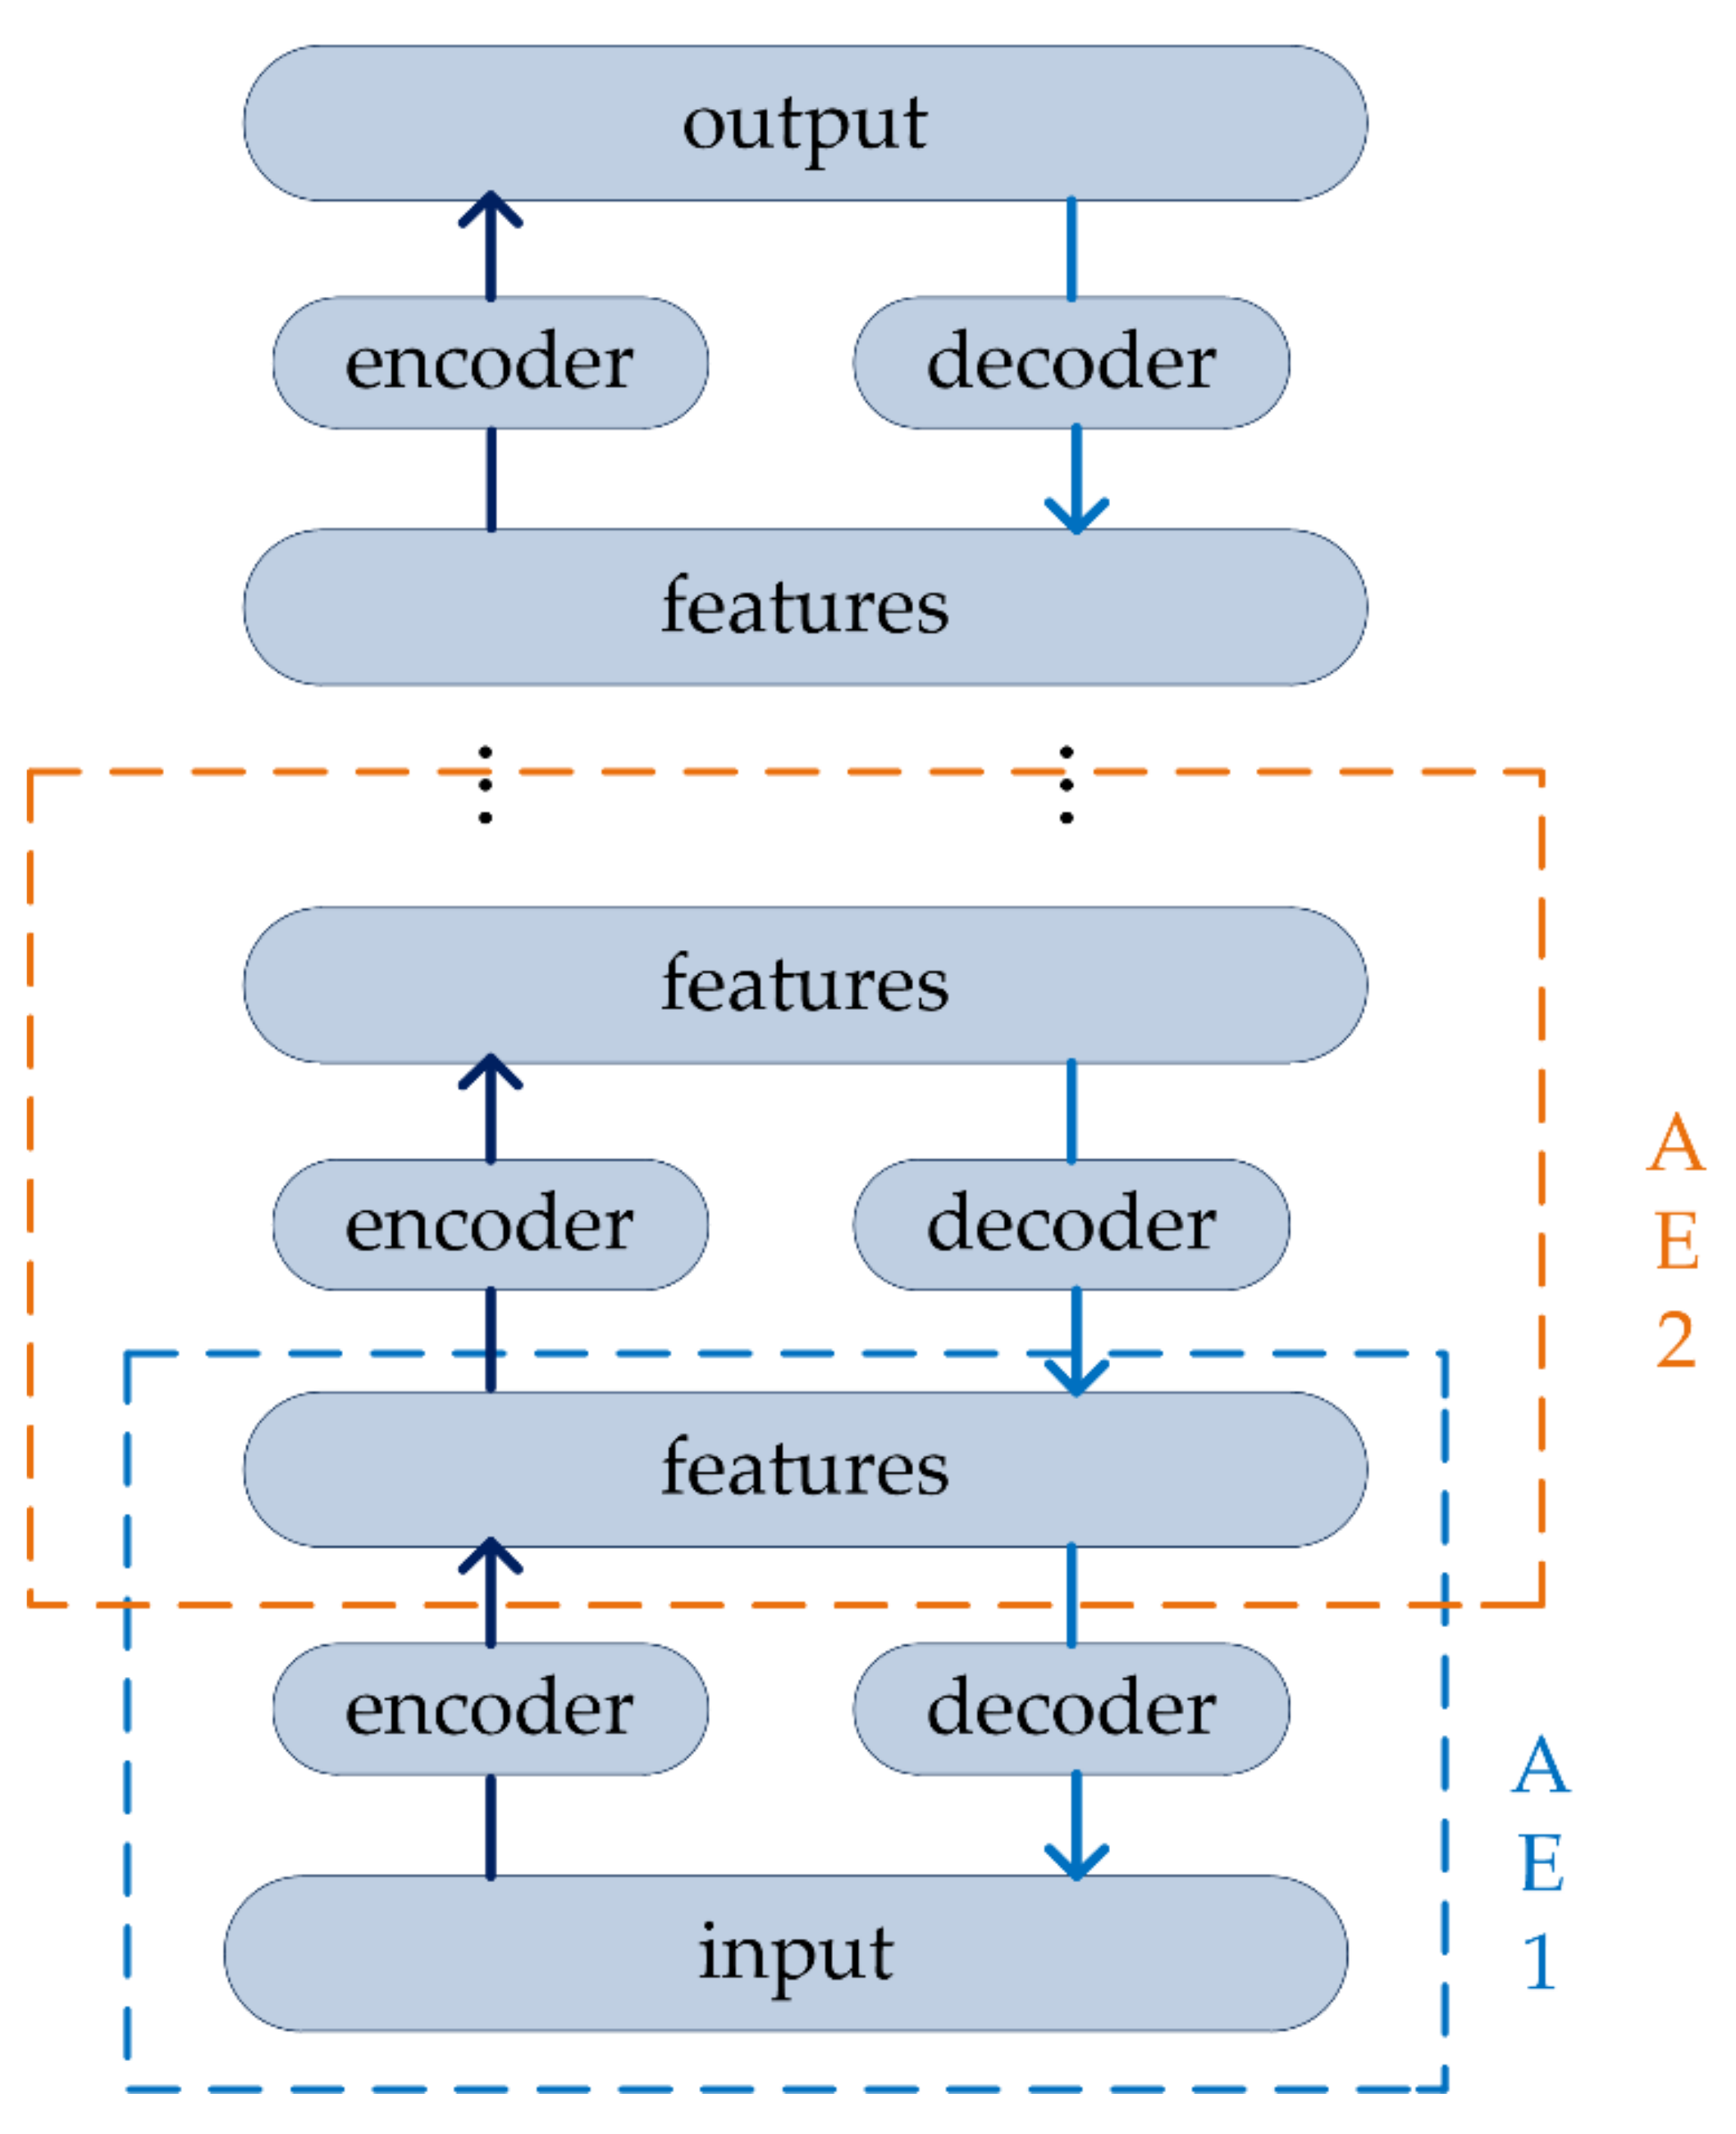
41]. The Stacked Autoencoder (SAE) can greatly solve this problem.
The SAE builds a deep neural network base on AE by stacking several AEs, putting the hidden representations of the upper layer as the input of the next AE. In other word, the compressed features of the hidden layer are extracted to the next AE for training. In this way, training layer-by-layer can achieve input features compressed. At the same time, more meaningful features of DNA barcode sequences are obtained. The decoder can be reconstructed back into the input with a sufficiently small difference, the structure of SAE is expressed in Figure 2.
There are two basic steps in SAE training: encoder and decoder.
(1) Encoder: the activation function σe maps input data vector x to hidden representation h. This process compresses the input data and retains more useful representations, the typical form is represented by a nonlinear representation as follows:
h = σ e ( W x + b )
where x denotes the input data vector, W is the weight matrix connecting the input and hidden layers, b is the bias vector belonging to the latent layer nodes, and σe represents the activation function, such as Sigmoid, Relu, Tanh, etc.
(2) Decoder: in this step, the hidden representation h is mapped into reconstruction vector y, the typical form as follows:
y = σ d ( W h + b )
where W’ is the weight matrix connecting the latent and output layers, b’ is the bias vector, and σd represents the activation function.
Loss function is defined to measure the reliability of SAE. SAE is trained to reconstruct the features of input and adjust the weights of the encoder and decoder to minimize the error between the output and the input. Thus, loss function is introduced, which is expressed in terms of mean square error as follows:
L ( W , b ) = y x 2
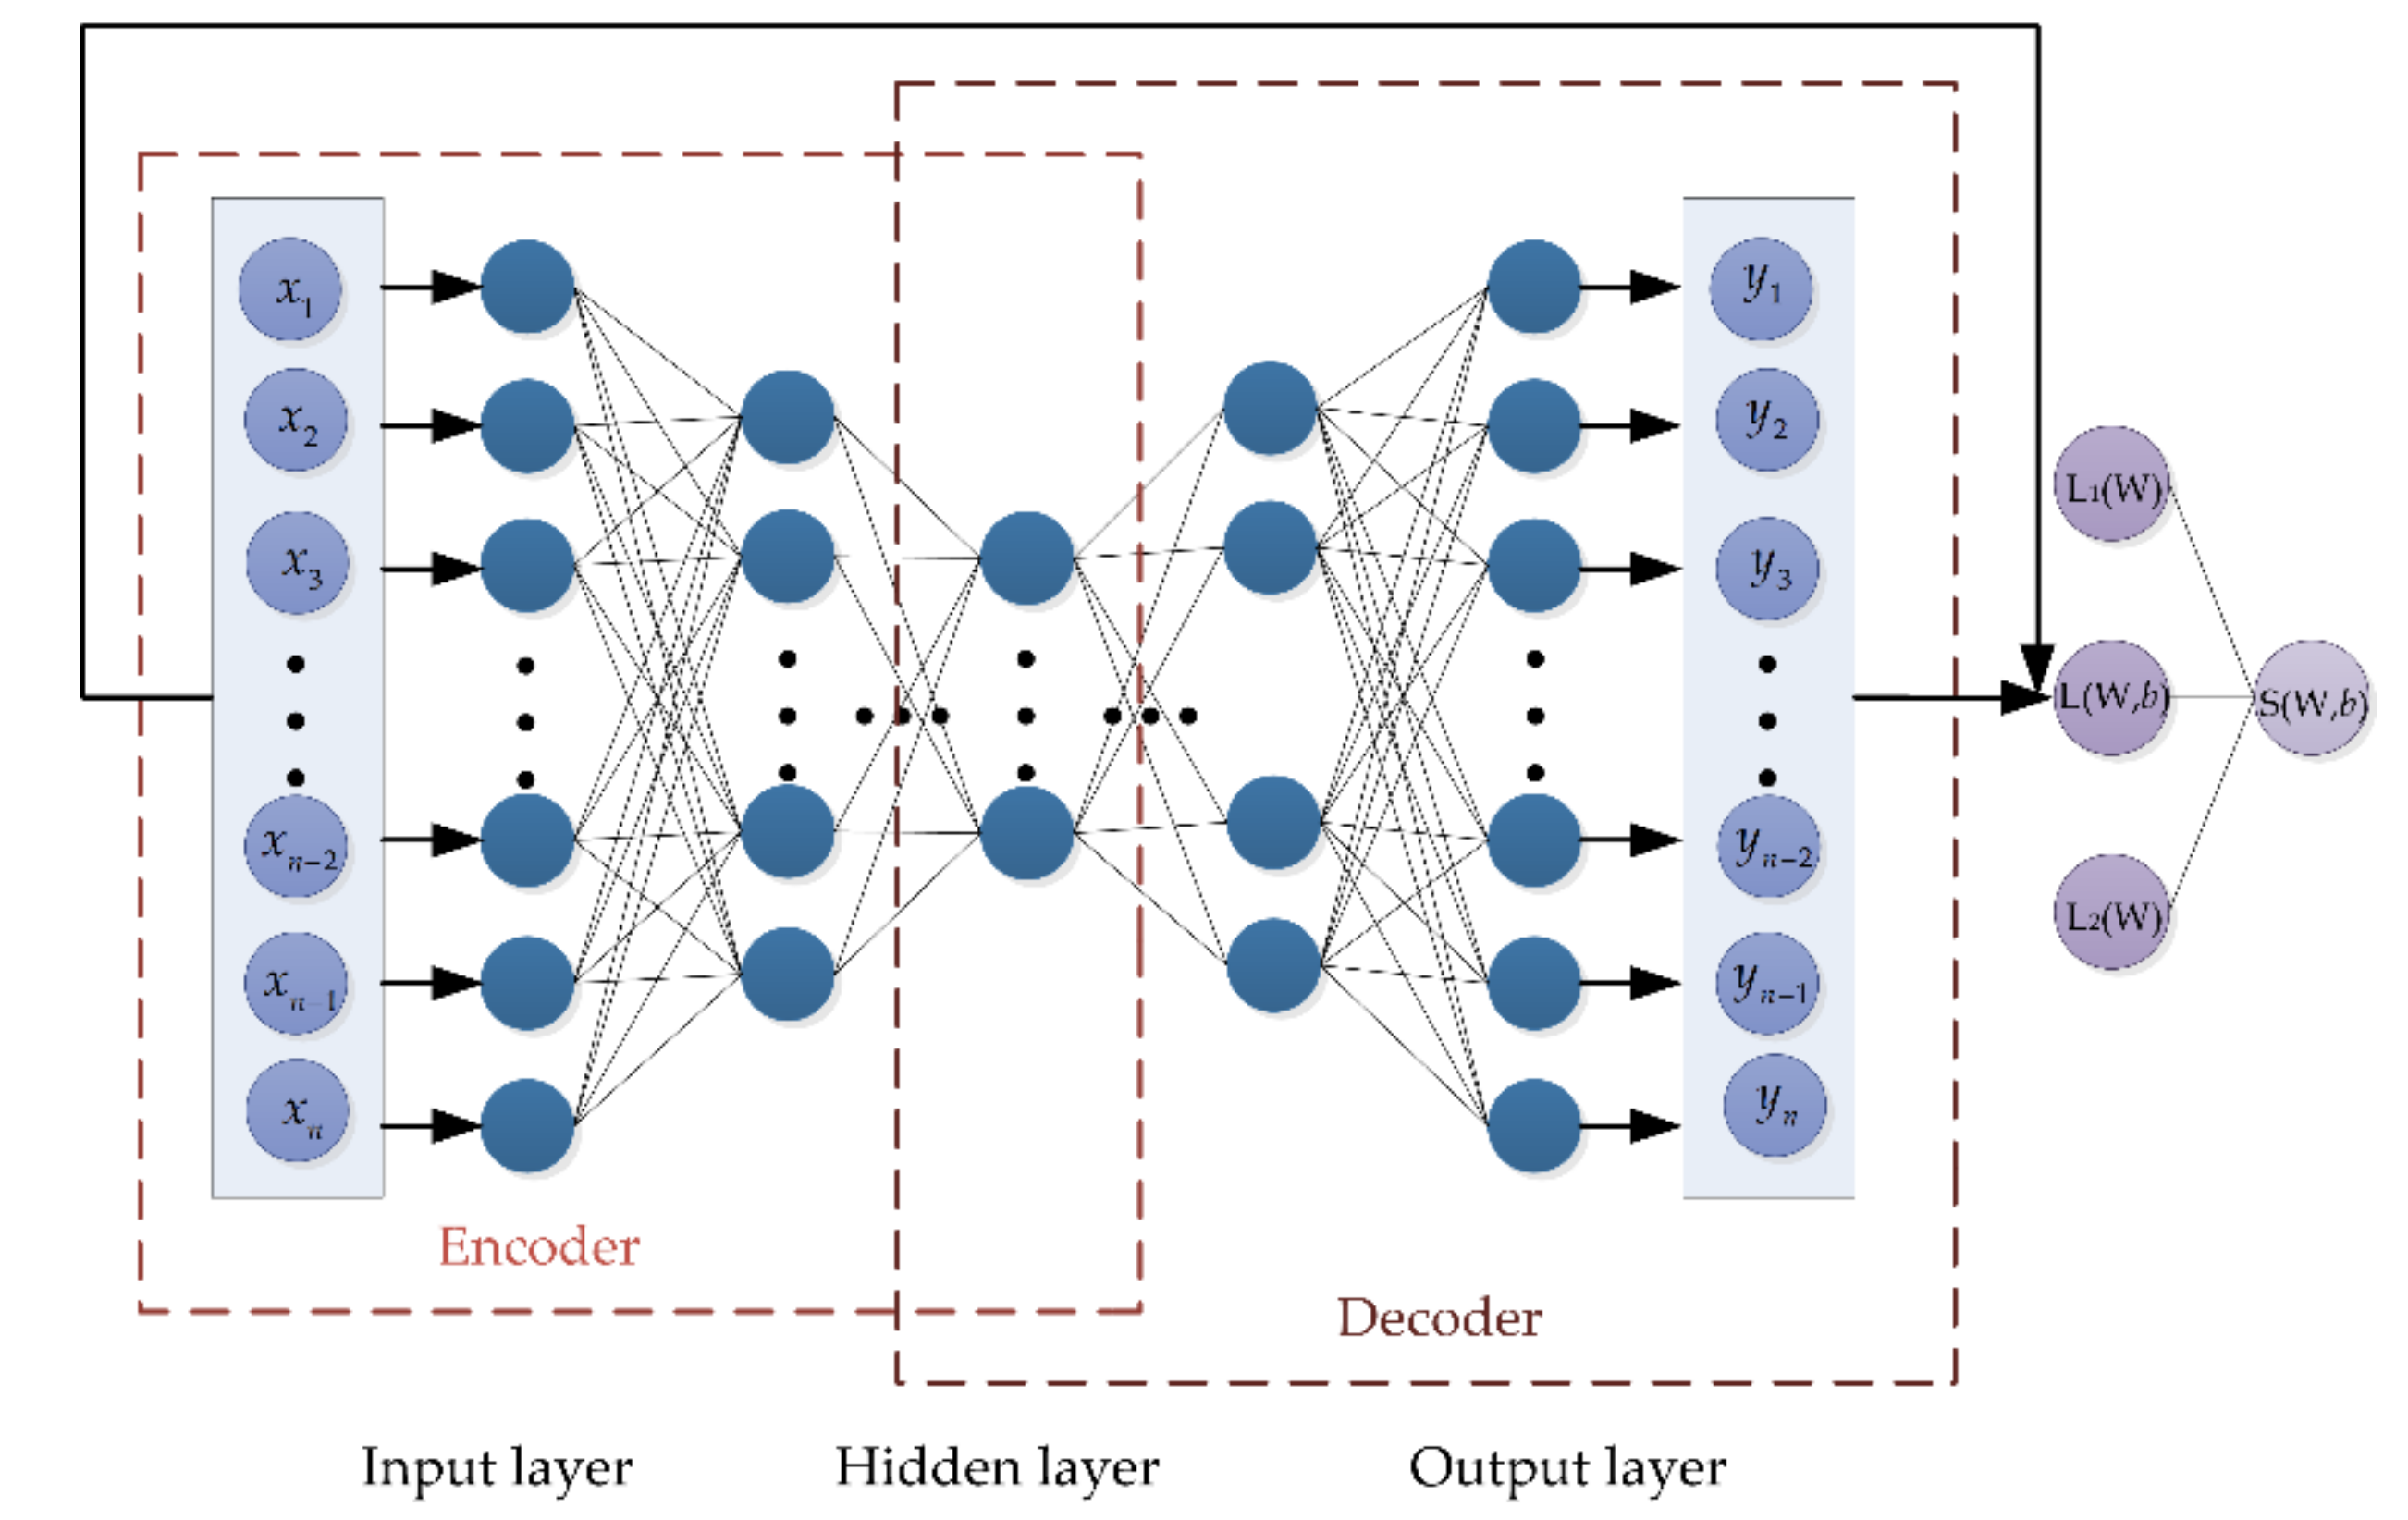
However, each family contains a limited number of fish species, resulting in a relatively small sample size for each dataset, and overfitting can easily occur during the training process. At the same time, due to the high dimensionality of DNA barcode sequences, training the model is time consuming. In order to improve the generalization ability of the proposed model and reduce model training time, some constraints are added to reduce the weight of useless features. Based on this point, Elastic Net composing of L1-norm and L2-norm is introduced in this method. The structure of EN-SAE model is shown in Figure 3. It can also treat L1-norm and L2-norm as penalty for loss function to restrict some parameters in the process of training.
L1-norm, also called Lasso regression, contributes to generate a sparse matrix. It is defined as: L 1 ( W ) = W = i W i , denotes the sum of the absolute value of each element in weight vector W. Thus, it can be used to choose more meaningful representations. When training the model, too many features of a sample make it difficult to select features that contribute more to the model. Therefore, we drop the connections that contribute tiny to the model and dropping them even have no impact on the classification performance. For high dimensional data, it can reduce time consuming and extract more useful features.
L2-norm, also called Ridge regression, is defined as: L 2 ( W ) = W 2 = i W i 2 , denotes the sum of the squares of each element in weight vector W. During the model training, we usually tend to make the weight as small as possible, because it is generally believed that model with small parameters can effectively fit different data. Thus, L2-norm can void overfitting to some extent and improve the generalization of model to fit small datasets for fish classification.
On the basis of proposed EN-SAE model, the outgroup score of each sample can be defined as a measure of whether the fish is an outgroup. The higher the outgroup scores are, the more likely they are to be considered as outgroups.
The outgroup score can be calculated by the following formula:
S ( W , b ) = y x 2 + λ 1 ( W 2 ) + λ 2 ( W )
where λ1 is a parameter to adjust the L2-norm, λ2 is a parameter to adjust the L1-norm.
The EN-SAE model maps high-dimensional features into low-dimensional features step by step to obtain a higher representation of DNA barcode sequences, which is more suitable for extracting features and expressing data from original data.

2.2.4. Analyzing the Outgroup Scores by KDE

KDE is the most common nonparametric density estimation technique [42]. KDE provides a way to smooth data points, and then fits the distribution by the properties of data itself. In our method, the decision threshold is determined by KDE base on the outgroup scores. After that, the correct classification results of fish will be found. Given the outgroup score vector s obtained from the EN-SAE model, KDE estimates the probability density function (PDF) p(s) in a nonparametric way:
p ( s ) 1 n h i = 1 n K ( s s i h )
where n is the size of dataset, {si} i = 1, 2, …, n, is the outgroup score vector of dataset, K (⋅) is the kernel function, and h is the bandwidth.
There are many kinds of kernel functions, and the epanechnikov function is the most commonly used function in density estimation, and also has good effects. Therefore, epanechnikov is used to estimate the PDF:
K e ( s ) α ( 3 4 ( 1 s 2 ) )
After obtaining p(s), the cumulative distribution function (CDF) F(s) can be defined as follows:
F ( s ) = s p ( s ) d s
Given a significance level parameter α ϵ [0, 1] and combined with CDF, a decision threshold sα can be found, sα satisfies the following formula:
F ( s α ) = 1 α
If the outgroup score of each species meets the condition ssα, the sample will be considered as an outgroup. On the contrary, it is an ingroup. Confirmed by repeated experiments that significance level parameter α is recommended to be set to 0.05. The ESK model, which fuses EN-SAE with KDE, is summarized as shown in Algorithm 1.

2.3. Evaluation Method

To test the performance of proposed model, the sample is divided into four situations based on the actual classification and the ESK predicted classification. In Table 2, four situations are illustrated with a confusion matrix. True positive (TP) is the number of ingroups that are correctly classified as ingroups. True negative (TN) is the number of outgroups that are correctly classified as outgroups. False positive (FP) is the number of outgroups that are wrongly classified as ingroups. False negative (FN) is the number of ingroups that are wrongly classified as outgroups.
Algorithm 1. Fish classification using DNA barcode sequences through ESK model.
Input: DNA barcode sequences of each dataset;
Output: the outgroups in matrix x;
1: Step 1: Preprocessing data
2:   Align DNA barcode sequences to obtain the sequences with the same length;
3:   Encode the matrix into a numeric type as matrix x;
4: EndStep
5: Step 2: Training EN-SAE model
6:   Set the number of stacked AEs L;
7:   Encoder process:
8:    h 1 = σ e ( W 1 x + b 1 )
9:      for i = 2 to L do
10:          h i = σ e ( W i x + b i )
11:      end for
12:   Decoder process:
13:    y L = σ d ( W L x + b L )
14:      for j = L − 1 to 1 do
15:          h j = σ d ( W L x + b L )
16:      end for
17: EndStep
18: Step 3: Training KDE
19:   Calculate the outgroup score: s = ( y - x ) 2 + λ 1 W + λ 2 W 2 ;
20:   If s < s α
21:      the fish is an ingroup;
22:   else
23:      the fish is an outgroup;
24:   end if
25: EndStep
With confusion matrix, the classification performance of all experiments is measured by three criterions: accuracy, recall, and F1-Score. Those evaluation equations are formulated as follows:
Accuracy = TP + TN TP + TN + FP + FN
Recall = TP TP + FN
F 1 - Score = 2 TP 2 TP + FP + FN

3. Results

3.1. Impact of the Number of Stacked AEs on the Outgroup Score

For deep learning, the number of layers in the model is a critical factor because it directly affects the performance of the model. The trend of outgroup scores for AEs stacked from 3 to 8 on three datasets is shown in Figure 4. The experimental results shown in Figure 4a demonstrate that the outgroup score on Sciaenidae decreases rapidly when the number of AEs is less than five. The score gradually stabilizes when the number of AEs is greater than five. The outgroup scores on other datasets show the same trend as Sciaenidae. When the number of AEs is stacked to five, the change in the outgroup score tends to be stable.
Additionally, Table 3 illustrates the details of Figure 4. The results of Table 3 show that the outgroup scores of ESK with five layers on different datasets are 0.0193, 0.0197, and 0.0177, respectively. Moreover, after the number of AEs increased from 3 to 5, the outgroup scores on three datasets decreased by approximately 29.04%, 41.02%, and 16.90%, respectively. Those results indicate that proposed method can achieve low scores on classifying fish from different families and the outgroup scores tend to be stable gradually.

3.2. Impact of Elastic Net on Classification Performance

To evaluate effect of Elastic Net on model performance, Stacked Autoencoder-Kernel Density Estimation (SK) model without adding Elastic Net and ESK model are compared in Figure 5. The evaluation metrics have been defined in Section 2.3. As shown in Figure 5, all evaluation indicators of the ESK are higher than the SK without Elastic Net.
In addition, Table 4 illustrates the detailed data corresponding to Figure 5. The accuracy, recall, and F1-Score on Mugilidae increased by approximately 4.98%, 5.24%, and 2.78%, respectively. Similarly, under the same conditions, the performance measures also increased in other two datasets. Those results indicate that add Elastic Net can improve the classification performance of the ESK.

3.3. Performance Evaluation with Different Methods

We compared our method, the ESK, with four machine learning algorithms, one class-support vector machines (OC-SVM) [33], KNN [34], isolation Forest (iForest) [43], and AE [44], to evaluate the performance on the task of classifying fish from different families based on DNA barcode sequences. Cross validation is used for model training, and the confusion matrix of different algorithms on three datasets is shown in Figure 6.
In order to show the specific advantages between our method and the other four methods, we utilized histograms to compare the performance of three metrics as shown in Figure 7, Figure 8 and Figure 9. Additionally, Table 5 exhibits the detailed data corresponding to Figure 7, Figure 8 and Figure 9. Accuracy, recall and F1-Score on Sciaenidae are 2.83%, 1.00%, and 1.51% higher compared to the algorithm with the next highest detection. As we can see in Figure 7, Figure 8 and Figure 9, the ESK provides stable and efficient effects on other two datasets, and generates the highest accuracy, recall and F1-Score. Those results show that ESK is better than other four algorithms and is effective in fish classification.

3.4. Analysis of Running Time

We analyzed the running time of the proposed method by comparing with two methods based on Autoencoder network structure. Table 6 reports the time consumption of the AE, SK, ESK methods in second. We can find that ESK has a longer running time compared with AE, and ESK has a shorter time consumption compared with SK.
As shown in Table 4, Table 5 and Table 6, the AE has the shortest running time and the poorest classification results compared with the other two models. The AE consists of only a single Autoencoder, but only one Autoencoder cannot learn the deep features of DNA barcode sequences well, resulting in poor classification results compared with deep learning methods. Although the ESK time consumption is longer than AE, the accuracy, recall, and F1-Score improved for all datasets, by 8.44%, 8.77%, and 4.84%, respectively.
The SK with multiple Autoencoders does not incorporate Elastic Net resulting in a relatively longer runtime compared to ESK. This is because Elastic Net provides sparse connection, which can save training time of the ESK model. Moreover, due to the limitations of obtaining fish DNA barcode sequences, the absence of Elastic Net can lead to overfitting in small datasets, resulting in unsatisfactory experimental results. Compared with ESK, the accuracy, recall and F1-Score decreased by approximately 2.80%, 2.19%, 1.54%, respectively. At the same time, the running time on the three data sets is 26.5792 (s) longer than ESK. Therefore, the ESK works well in fish classification although it is a deep learning model with relatively long running time.

4. Discussion

This study set out with aim of constructing a novel deep learning model base on DNA barcode sequences with the employ of representative features to classify fish from different families and distinguish the outgroups. In this section, we discuss and analyze the experimental results and findings.
An important experimental result is that when the number of stacked AEs was set to five, the outgroup scores tend to level off and change smoothly. There are several possible reasons for this result. Due to the high dimensionality of the data, the features of COI fragment cannot be fully learned when the number of stacked AEs is few. As the increase of the number of AEs, the proposed model can mine the deeper useful features of DNA sequences. Obviously, when the number of AEs increased to five, the outgroup scores decreased sharply. The experiments showed that increasing the number of AEs did not improve performance. The performance tended to be stable when the number of AEs was more than five because the deep features had been already fully learned. Hence, the number of stacked AEs in ESK was five.
Another considerable experimental result is that Elastic Net can improve the performance of the proposed model. A good deep learning model usually requires abundant data to train and analyze, while the limitations of obtaining DNA barcode sequences of fish species from different families and the problem of overfitting in small datasets are more and more serious. To solve the overfitting problem in training process on small datasets is of great importance. In our study, Elastic Net is used to solve overfitting problem and improve the generalization ability of the ESK model. Moreover, genetic characteristics of species belong to high-dimensional data, which are time consuming during training. However, directly combining a set of fully connected EN-SAE is often has little effect for extracting useful information. Elastic Net provides sparse connection, which can also save training time. Therefore, Elastic Net can improve the performance of proposed model.
The most surprising finding was that our method could accurately classify fish from different families on three datasets. EN-SAE is used to calculate the outgroup scores. When the score is high, the probability of being considered an outgroup increases. There are far more fish in the same family than other families, EN-SAE can well fit and learn the characteristics of intraspecific fish during training. On the contrary, the number of fish from different families is relatively small, we cannot get a good fit, resulting in the high outgroup scores. Therefore, they are more likely to be treated as outgroups. At the same time, compared with other algorithms, it further confirmed that the proposed method has better performance in fish classification.
These positive results and findings suggest that the ESK based on deep learning, with the utilization of DNA barcode technology, can effectively classify fish from different families.

5. Conclusions

In this study, we propose a fish classification method based on DNA barcode sequences, the ESK model, which combines EN-SAE and KDE. Since the relatively long base pair segments of DNA barcodes lead to high dimensionality in each dataset, ESK can mine potential key features of data through deep learning. At the same time, the size of each dataset is small due to the limitation of each fish species, the ESK adds Elastic Net can prevent overfitting more effectively, improve the generalization ability, and shorten running time. The classification performance of ESK is evaluated on three datasets and compared with four famous machine learning algorithms. The experimental results show that, compared with four algorithms, such as OC-SVM, KNN, iForest, AE, the ESK proposed in this paper has a better effect in fish classification. The experimental results and findings demonstrate the effectiveness of the proposed model.
In future work, we plan to study a more efficient method to improve the performance of fish classification base on DNA barcode sequences. The Journal of Symmetry covers the study of symmetry/asymmetry in all aspects of natural science, which will provide more inspiration for our research work in the future. We also plan to study more deep learning methods to extract better deep features of DNA barcode sequences. For some fish species with few samples, the adversarial learning method is considered, which can synthesize similar species, increase the diversity of training samples, and improve the accuracy of classification. In addition, in order to reduce the running time during training, some measure should be taken in the future.

Supplementary Materials

The following are available online at https://www.mdpi.com/article/10.3390/sym13091599/s1, Table S1: Species of experimental samples on Sciaenidae, Table S2: Species of experimental samples on Barbinae, Table S3: Species of experimental samples on Mugilidae.

Author Contributions

Conceptualization, L.J., J.Y. and X.D.; methodology, L.J. and J.Y.; software, L.J.; validation, J.Y., X.Y. and L.J.; resources, X.Y.; writing—original draft preparation, L.J.; writing—review and editing, X.Y. and X.D.; supervision, J.Y.; project administration, L.J. All authors have read and agreed to the published version of the manuscript.

Funding

This research was funded by The National Natural Science Foundation of China under Grant 61862060, Grant 61462079 and Grant 61562086.

Institutional Review Board Statement

Not applicable.

Informed Consent Statement

Not applicable.

Data Availability Statement

The data presented in this study are available in www.ncbi.nlm.nih.gov (accessed on 18 October 2020). Details on each dataset can be found in supplementary material.

Acknowledgments

The authors would like to thank editors and referees for their precious remarks and comments.

Conflicts of Interest

The authors declare no conflict of interest.

References

  1. Xu, L.; Wang, X.; Van Damme, K.; Huang, D.; Li, Y.; Wang, L.; Ning, J.; Du, F. Assessment of fish diversity in the South China Sea using DNA taxonomy. Fish. Res. 2021, 233, 105771. [Google Scholar] [CrossRef]
  2. Fautin, D.; Dalton, P.; Incze, L.S.; Leong, J.A.; Pautzke, C.; Rosenberg, A.; Sandifer, P.; Sedberry, G.; Tunnell, J.W., Jr.; Abbott, I.; et al. An overview of marine biodiversity in United States waters. PLoS ONE 2010, 5, e11914. [Google Scholar] [CrossRef] [Green Version]
  3. Knowlton, N.; Weigt, L.A. New dates and new rates for divergence across the Isthmus of Panama. Proc. R. Soc. B Biol. Sci. 1998, 265, 2257–2263. [Google Scholar] [CrossRef] [Green Version]
  4. Thu, P.T.; Huang, W.C.; Chou, T.K.; Van Quan, N.; Van Chien, P.; Li, F.; Shao, K.T.; Liao, T.Y. DNA barcoding of coastal ray-finned fishes in Vietnam. PLoS ONE 2019, 14, e0222631. [Google Scholar] [CrossRef]
  5. Hebert, P.D.; Cywinska, A.; Ball, S.L.; de Waard, J.R. Biological identifications through DNA barcodes. Proc. Biol. Sci. 2003, 270, 313–321. [Google Scholar] [CrossRef] [Green Version]
  6. 6Ramirez, J.L.; Rosas-Puchuri, U.; Canedo, R.M.; Alfaro-Shigueto, J.; Ayon, P.; Zelada-Mazmela, E.; Siccha-Ramirez, R.; Velez-Zuazo, X. DNA barcoding in the Southeast Pacific marine realm: Low coverage and geographic representation despite high diversity. PLoS ONE 2020, 15, e0244323. [Google Scholar] [CrossRef]
  7. 7Liang, H.; Meng, Y.; Luo, X.; Li, Z.; Zou, G. Species identification of DNA barcoding based on COI gene sequences in Bagridae catfishes. J. Fish. Sci. China 2018, 25, 772–782. [Google Scholar] [CrossRef]
  8. Xu, L.; Van Damme, K.; Li, H.; Ji, Y.; Wang, X.; Du, F. A molecular approach to the identification of marine fish of the Dongsha Islands (South China Sea). Fish. Res. 2019, 213, 105–112. [Google Scholar] [CrossRef]
  9. Ren, B.Q.; Xiang, X.G.; Chen, Z.D. Species identification of Alnus (Betulaceae) using nrDNA and cpDNA genetic markers. Mol. Ecol. Resour. 2010, 10, 594–605. [Google Scholar] [CrossRef]
  10. Newmaster, S.G.; Fazekas, A.J.; Steeves, R.A.; Janovec, J. Testing candidate plant barcode regions in the Myristicaceae. Mol. Ecol. Resour. 2008, 8, 480–490. [Google Scholar] [CrossRef] [PubMed]
  11. Liu, J.; Moller, M.; Gao, L.M.; Zhang, D.Q.; Li, D.Z. DNA barcoding for the discrimination of Eurasian yews (Taxus L., Taxaceae) and the discovery of cryptic species. Mol. Ecol. Resour. 2011, 11, 89–100. [Google Scholar] [CrossRef] [PubMed]
  12. Necchi, O.; West, J.A.; Rai, S.K.; Ganesan, E.K.; Rossignolo, N.L.; de Goër, S.L. Phylogeny and morphology of the freshwater red algaNemalionopsis shawii(Rhodophyta, Thoreales) from Nepal. Phycol. Res. 2016, 64, 11–18. [Google Scholar] [CrossRef]
  13. Valentini, A.; Pompanon, F.; Taberlet, P. DNA barcoding for ecologists. Trends Ecol. Evol. 2009, 24, 110–117. [Google Scholar] [CrossRef] [PubMed]
  14. Ji, Y.; Ashton, L.; Pedley, S.M.; Edwards, D.P.; Tang, Y.; Nakamura, A.; Kitching, R.; Dolman, P.M.; Woodcock, P.; Edwards, F.A.; et al. Reliable, verifiable and efficient monitoring of biodiversity via metabarcoding. Ecol. Lett. 2013, 16, 1245–1257. [Google Scholar] [CrossRef] [PubMed]
  15. Gathier, G.; van der Niet, T.; Peelen, T.; van Vugt, R.R.; Eurlings, M.C.; Gravendeel, B. Forensic identification of CITES protected slimming cactus (Hoodia) using DNA barcoding. J. Forensic Sci. 2013, 58, 1467–1471. [Google Scholar] [CrossRef]
  16. Liu, J.; Yan, H.-F.; Newmaster, S.G.; Pei, N.; Ragupathy, S.; Ge, X.-J.; Lowe, A. The use of DNA barcoding as a tool for the conservation biogeography of subtropical forests in China. Divers. Distrib. 2015, 21, 188–199. [Google Scholar] [CrossRef]
  17. Wang, T.; Qi, D.; Sun, S.; Liu, Z.; Du, Y.; Guo, S.; Ma, J. DNA barcodes and their characteristic diagnostic sites analysis of Schizothoracinae fishes in Qinghai province. Mitochondrial DNA Part A 2019, 30, 592–601. [Google Scholar] [CrossRef]
  18. Hebert, P.D.; Stoeckle, M.Y.; Zemlak, T.S.; Francis, C.M. Identification of Birds through DNA Barcodes. PLoS Biol. 2004, 2, e312. [Google Scholar] [CrossRef] [Green Version]
  19. Kerr, K.C.R.; Stoeckle, M.Y.; Dove, C.J.; Weigt, L.A.; Francis, C.M.; Hebert, P.D.N. Comprehensive DNA barcode coverage of North American birds. Mol. Ecol. Notes 2007, 7, 535–543. [Google Scholar] [CrossRef]
  20. Wang, G.; Li, C.; Guo, X.; Xing, D.; Dong, Y.; Wang, Z.; Zhang, Y.; Liu, M.; Zheng, Z.; Zhang, H.; et al. Identifying the main mosquito species in China based on DNA barcoding. PLoS ONE 2012, 7, e47051. [Google Scholar] [CrossRef]
  21. Zhang, J. Species identification of marine fishes in china with DNA barcoding. Evid.-Based Complement. Altern. Med. 2011, 8, 1–10. [Google Scholar] [CrossRef]
  22. Steinke, D.; Zemlak, T.S.; Boutillier, J.A.; Hebert, P.D.N. DNA barcoding of Pacific Canada’s fishes. Mar. Biol. 2009, 156, 2641–2647. [Google Scholar] [CrossRef]
  23. Talaga, S.; Leroy, C.; Guidez, A.; Dusfour, I.; Girod, R.; Dejean, A.; Murienne, J. DNA reference libraries of French Guianese mosquitoes for barcoding and metabarcoding. PLoS ONE 2017, 12, e0176993. [Google Scholar] [CrossRef] [PubMed]
  24. Decru, E.; Moelants, T.; De Gelas, K.; Vreven, E.; Verheyen, E.; Snoeks, J. Taxonomic challenges in freshwater fishes: A mismatch between morphology and DNA barcoding in fish of the north-eastern part of the Congo basin. Mol. Ecol. Resour. 2016, 16, 342–352. [Google Scholar] [CrossRef]
  25. Iyiola, O.A.; Nneji, L.M.; Mustapha, M.K.; Nzeh, C.G.; Oladipo, S.O.; Nneji, I.C.; Okeyoyin, A.O.; Nwani, C.D.; Ugwumba, O.A.; Ugwumba, A.A.A.; et al. DNA barcoding of economically important freshwater fish species from north-central Nigeria uncovers cryptic diversity. Ecol. Evol. 2018, 8, 6932–6951. [Google Scholar] [CrossRef]
  26. Ward, R.D.; Hanner, R.; Hebert, P.D. The campaign to DNA barcode all fishes, FISH-BOL. J. Fish Biol. 2009, 74, 329–356. [Google Scholar] [CrossRef]
  27. Blaxter, M.; Mann, J.; Chapman, T.; Thomas, F.; Whitton, C.; Floyd, R.; Abebe, E. Defining operational taxonomic units using DNA barcode data. Philos. Trans. R. Soc. B Biol. Sci. 2005, 360, 1935–1943. [Google Scholar] [CrossRef]
  28. Weitschek, E.; Van Velzen, R.; Felici, G.; Bertolazzi, P. BLOG 2.0: A software system for character-based species classification with DNA Barcode sequences. What it does, how to use it. Mol. Ecol. Resour. 2013, 13, 1043–1046. [Google Scholar] [CrossRef]
  29. Yang, C.H.; Wu, K.C.; Chuang, L.Y.; Chang, H.W. DeepBarcoding: Deep Learning for Species Classification using DNA Barcoding. IEEE/ACM Trans. Comput. Biol. Bioinform. 2021. [Google Scholar] [CrossRef] [PubMed]
  30. Emu, M.; Sakib, S. Species Identification using DNA Barcode Sequences through Supervised Learning Methods. In Proceedings of the 2019 International Conference on Electrical, Computer and Communication Engineering (ECCE), Cox’s Bazar, Bangladesh, 7–9 February 2019; IEEE: Piscataway, NJ, USA, 2019; pp. 1–6. [Google Scholar] [CrossRef]
  31. Weitschek, E.; Fiscon, G.; Felici, G. Supervised DNA Barcodes species classification: Analysis, comparisons and results. BioData Mining 2014, 7, 4. [Google Scholar] [CrossRef] [PubMed] [Green Version]
  32. Ghouri, M.Z.; Ismail, M.; Javed, M.A.; Khan, S.H.; Munawar, N.; Umar, A.B.; Mehr-un-Nisa; Aftab, S.O.; Amin, S.; Khan, Z.; et al. Identification of Edible Fish Species of Pakistan Through DNA Barcoding. Front. Mar. Sci. 2020, 7. [Google Scholar] [CrossRef]
  33. Erfani, S.M.; Rajasegarar, S.; Karunasekera, S.; Leckie, C. High-dimensional and large-scale anomaly detection using a linear one-class SVM with deep learning. Pattern Recognit. 2016, 58, 121–134. [Google Scholar] [CrossRef]
  34. Abeywickrama, T.; Cheema, M.A.; Taniar, D. K-nearest neighbors on road networks: A journey in experimentation and in-memory implementation. Proc. VLDB Endow. 2016, 9, 492–503. [Google Scholar] [CrossRef]
  35. Meher, P.K.; Sahu, T.K.; Gahoi, S.; Tomar, R.; Rao, A.R. funbarRF: DNA barcode-based fungal species prediction using multiclass Random Forest supervised learning model. BMC Genet. 2019, 20, 2. [Google Scholar] [CrossRef] [PubMed]
  36. Jin, S.; Zeng, X.; Xia, F.; Huang, W.; Liu, X. Application of deep learning methods in biological networks. Brief. Bioinform. 2021, 22, 1902–1917. [Google Scholar] [CrossRef]
  37. Kumar, S.; Stecher, G.; Li, M.; Knyaz, C.; Tamura, K. MEGA X: Molecular Evolutionary Genetics Analysis across Computing Platforms. Mol. Biol. Evol. 2018, 35, 1547–1549. [Google Scholar] [CrossRef]
  38. Chu, Z.; Yu, J. An end-to-end model for rice yield prediction using deep learning fusion. Comput. Electron. Agric. 2020, 174, 105471. [Google Scholar] [CrossRef]
  39. Chen, J.; Sathe, S.; Aggarwal, C.; Turaga, D. Outlier Detection with Autoencoder Ensembles. In Proceedings of the 2017 SIAM International Conference on Data Mining (SDM), Houston, TX, USA, 27–29 April 2017; pp. 90–98. [Google Scholar] [CrossRef] [Green Version]
  40. Homoliak, I. Convergence Optimization of Backpropagation Artificial Neural Network Used for Dichotomous Classification of Intrusion Detection Dataset. J. Comput. 2017, 143–155. [Google Scholar] [CrossRef]
  41. Vincent, P.; Larochelle, H.; Lajoie, I.; Bengio, Y.; Manzagol, P.A. Stacked Denoising Autoencoders: Learning Useful Representations in a Deep Network with a Local Denoising Criterion. J. Mach. Learn. Res. 2010, 11, 3371–3408. [Google Scholar]
  42. Taaffe, K.; Pearce, B.; Ritchie, G. Using kernel density estimation to model surgical procedure duration. Int. Trans. Oper. Res. 2018, 28, 401–418. [Google Scholar] [CrossRef]
  43. Liu, F.T.; Ting, K.M.; Zhou, Z.H. Isolation-Based Anomaly Detection. ACM Trans. Knowl. Discov. Data 2012, 6, 1–39. [Google Scholar] [CrossRef]
  44. Gou, J.; Liu, G.; Zuo, Y.; Wu, J. An Anomaly Detection Framework Based on Autoencoder and Nearest Neighbor. In Proceedings of the 2018 15th International Conference on Service Systems and Service Management (ICSSSM), Hangzhou, China, 21–22 July 2018; IEEE: Piscataway, NJ, USA, 2018; pp. 1–6. [Google Scholar] [CrossRef]
Figure 1. An overview of ESK. The distribution of the outgroup scores in three datasets is shown in Stage 3.
Symmetry 13 01599 g001
Figure 2. The structure of Stacked Autoencoder (SAE).
Symmetry 13 01599 g002
Figure 3. The structure of Elastic Net-Stacked Autoencoder (EN-SAE).
Symmetry 13 01599 g003
Figure 4. Impact of the number of stacked Autoencoders (AEs) on the outgroup score. (a) The outgroup score trends on Sciaenidae. (b) The outgroup score trends on Barbinae. (c) The outgroup score trends on Mugilidae.
Symmetry 13 01599 g004
Figure 5. Impact of Elastic Net on classification performance. (a) Accuracy on Stacked Autoencoder-Kernel Density Estimation (SK) and ESK. (b) Recall on SK and ESK. (c) F1-Score on SK and ESK.
Symmetry 13 01599 g005
Figure 6. Confusion matrix of five methods on three datasets.
Symmetry 13 01599 g006
Figure 7. The evaluation metrics on Sciaenidae.
Symmetry 13 01599 g007
Figure 8. The evaluation metrics on Barbinae.
Symmetry 13 01599 g008
Figure 9. The evaluation metrics on Mugilidae.
Symmetry 13 01599 g009
Table 1. Summary of datasets.
DatasetDimensionSampleOutgroup Ratio (%)
Sciaenidae23843255.54
Barbinae217610222.35
Mugilidae22607962.51
Table 2. Confusion matrix.
Predicted PositivePredicted Negative
Actual positiveTPFN
Actual negativeFPTN
Table 3. The outgroup scores with different numbers of AEs on three datasets.
Dataset345678
Sciaenidae0.02720.02400.01930.01930.01850.0183
Barbinae0.03340.02180.01970.01960.01960.0196
Mugilidae0.02130.01900.01770.01730.01730.0173
Table 4. The evaluation metrics on SK and ESK models.
DatasetEvaluation MetricsSKESK
ACC0.95280.9623
SciaenidaeRecall0.95000.9600
F1-Score0.97440.9796
ACC0.96910.9938
BarbinaeRecall0.99000.9934
F1-Score0.98350.9967
ACC0.92120.9710
MugilidaeRecall0.91700.9694
F1-Score0.95670.9845
Table 5. The evaluation metrics of three datasets.
DatasetEvaluation MetricsOC-SVMKNNiForestAEESK
ACC0.74530.84910.93400.83020.9623
SciaenidaeRecall0.73000.86000.95000.82000.9600
F1-Score0.84390.91490.96450.90110.9796
ACC0.95990.92280.97220.93210.9938
BarbinaeRecall0.95680.94020.97010.92690.9934
F1-Score0.97790.95770.98480.96210.9967
ACC0.95440.96270.93780.91700.9710
MugilidaeRecall0.95200.96070.93450.91270.9694
F1-Score0.97540.98000.96610.95430.9845
Table 6. The runtime (s) of three methods.
DatasetAESKESK
Sciaenidae60.0625149.7429122.3258
Barbinae154.4989322.0283295.8245
Mugilidae94.0478226.5478201.4312
Publisher’s Note: MDPI stays neutral with regard to jurisdictional claims in published maps and institutional affiliations.

