Article

Network Intrusion Detection Based on an Efficient Neural Architecture Search

1
School of Computer Science, Beijing University of Posts and Telecommunications, Beijing 100876, China
2
School of Electronic Engineering, Beijing University of Posts and Telecommunications, Beijing 100876, China
*
Author to whom correspondence should be addressed.
Symmetry 2021, 13(8), 1453; https://doi.org/10.3390/sym13081453
Submission received: 10 June 2021 / Revised: 22 July 2021 / Accepted: 3 August 2021 / Published: 9 August 2021
(This article belongs to the Section Computer)

Abstract

:
Deep learning has been applied in the field of network intrusion detection and has yielded good results. In malicious network traffic classification tasks, many studies have achieved good performance with respect to the accuracy and recall rate of classification through self-designed models. In deep learning, the design of the model architecture greatly influences the results. However, the design of the network model architecture usually requires substantial professional knowledge. At present, the focus of research in the field of traffic monitoring is often directed elsewhere. Therefore, in the classification task of the network intrusion detection field, there is much room for improvement in the design and optimization of the model architecture. A neural architecture search (NAS) can automatically search the architecture of the model under the premise of a given optimization goal. For this reason, we propose a model that can perform NAS in the field of network traffic classification and search for the optimal architecture suitable for traffic detection based on the network traffic dataset. Each layer of our depth model is constructed according to the principle of maximum coding rate attenuation, which has strong consistency and symmetry in structure. Compared with some manually designed network architectures, classification indicators, such as Top-1 accuracy and F1 score, are also greatly improved while ensuring the lightweight nature of the model. In addition, we introduce a surrogate model in the search task. Compared to using the traditional NAS model to search the network traffic classification model, our NAS model greatly improves the search efficiency under the premise of ensuring that the results are not substantially different. We also manually adjust some operations in the search space of the architecture search to find a set of model operations that are more suitable for traffic classification. Finally, we apply the searched model to other traffic datasets to verify the universality of the model. Compared with several common network models in the traffic field, the searched model (NAS-Net) performs better, and the classification effect is more accurate.

1. Introduction

Deep learning, as a new, hot research topic in machine learning, is widely used in image recognition [1], speech recognition [2], natural language processing [3] and other fields and has achieved many fruitful results. In the field of network intrusion detection, numerous scholars have extensively explored the network model of malicious network traffic classification and achieved excellent results. These studies often focused on feature selection [4], training strategy [5], model stacking [6] and other aspects, but there were few studies on the topological structure of classification models. A network that can solve complex problems often also has a complex structure, such as AlexNet [7], InceptionNet [8], MobileNet [9] and other architectures that were carefully designed by researchers in the field of image recognition. People usually rely on rich experience and professional knowledge for the design of a network architecture, which makes this type of design very difficult for most people. This causes the focus of researchers in the field of traffic classification to deviate from the design of a network model architecture. NAS, a research hotspot in recent years, can search for effective architectures for specific deep-learning problems without manual intervention, replacing the process of designing cumbersome network architectures. With the continuous advancement of NAS research and application, people have realized that NAS is an indispensable component of automatic machine learning (AutoML) [10,11,12].
To simultaneously ensure the classification accuracy and the lightweight nature of the model, the architecture search needs to complete a multi-objective optimization task. Evolutionary algorithms (EAs) are an algorithm type that is widely used in architecture search. EAs explore the optimal solution to the problem solved by imitating the process of natural biological evolution and natural selection. Using EAs to search for a neural network architecture usually imposes certain restrictions on the network architecture, such as setting the depth of each layer and the set of optional operations for each layer in advance. Common multi-objective optimization algorithms based on evolutionary algorithms include multi-objective particle swarm optimization (MOPSO), ant colony optimization (ACO), non-dominated sorting genetic algorithm II (NSGA-II) [13], multi-objective evolutionary algorithm based on decomposition (MOEA/D), and so on.
However, even a limited search space has a huge number of candidate architectures, so a large number of unevaluated candidate architectures are generated during the population iteration process, which undoubtedly leads to unpredictable time consumption and the necessity of huge computing resources. For this reason, many scholars have put forward corresponding solutions in this respect, such as weight sharing [14], and changing architecture search strategy [15]. These methods can improve the efficiency of an architecture search to a certain extent, but all need to optimize the parameters of candidate architectures. In [16], a surrogate model was adopted to predict the performance of candidate architectures that can navigate the direction of the architecture search task. However, since building an accurate surrogate model requires a large number of training samples, it is inevitable that the searched network architecture needs to be extensively sampled when training the surrogate model, which results in its low efficiency in the initial stage of the search task. In [17], an online surrogate model was dynamically constructed for each iteration when using a genetic algorithm to search for the model architecture and used the surrogate model to predict the performance of the generated offspring when using a genetic algorithm to perform population iteration. In the last part, the Pareto frontier architecture was selected for parameter optimization, which greatly conserves computing resources.
The search task of neural architecture has made great progress in the field of image recognition, but research on NAS and improving search efficiency is rare in the field of network intrusion detection. Therefore, we propose a NAS model applied in the field of network traffic, which uses a genetic algorithm to complete the architecture search task. To improve the search efficiency of the model, the surrogate model is introduced in the process of architecture evaluation. At the same time, in the process of the architecture search, different operation blocks are selected, and related operation blocks in the image recognition field are introduced. By fusing the knowledge of different fields, the network architecture most suitable for traffic datasets can be easily discovered, and the accuracy of the model classification can be improved.
The main contributions of this paper are summarized as follows.
  • In the network intrusion detection task, NAS is introduced to search for more effective architectures. The classification model is better than the manually designed network traffic classification model. At the same time, in the architecture search task, the online surrogate model is used to optimize the architecture search efficiency, which results in a significant improvement in search efficiency, compared with the general NAS model.
  • On the basis of previous studies, by filtering suitable operation blocks and introducing new operation blocks to adapt to the network traffic dataset, the performance of the search model is improved, so as to improve the search space of the network architecture.
  • The network architecture search model is evaluated in different network traffic datasets and compared with the manually designed network traffic classification models, including CIC-DoS2017, ISCXIDS2012 and CIC-DDoS2019. Experiments show that our model offers strong scalability and effectiveness.
The rest of this paper is arranged as follows: Section 2 introduces the related work of this paper, and the details of our NAS model, which include the search space, search strategies and performance evaluation strategies. Section 3 shows the data processing and our experimental results. Finally, the conclusions are given in Section 4.

2. Materials and Methods

2.1. Classification Method for Malicious Network Traffic

With the continuous development of the internet, an increasing number of network security problems are exposed. For the task of network traffic detection and management, the classification of malicious traffic is essential. At present, there are many classification algorithms that can complete the task of traffic classification, such as SVM [18], KNN [19], and random forest [20], in traditional machine learning. The effect of this kind of research largely depends on the selection of features. Instead of manual intervention to select features, ref. [21] proposed an unsupervised method, which is used for large-scale data analysis and improves classification accuracy, to automatically extract network flow features. Ref. [22] used the supervised pretraining of CNN and the data reconstruction module based on Autoencoder to construct a structure that can extract deep features from a small number of abnormal samples. This solves the problem that the abnormal behavior in the network environment is far less prevalent than the normal behavior, resulting in the poor performance of model anomaly detection. Ref. [23] proposed an unbalanced distribution encrypted traffic classification scheme based on random forest, using a feature selection scheme to filter out redundant features, and using a mixed sampling scheme to effectively solve the sample imbalance problem. Ref. [24] proposed a repeated Bayesian Stackelberg game based on machine-learning technology, which improves the detection performance of cloud-based systems and has high operation efficiency. Ref. [25] proposed a resource aware maxmin game theoretical model, which improved the detection probability of distributed attacks in multiple users’ virtual machines (VMs), reduced the false positive rate of anomaly detection system, and improved the utilization efficiency of resources in the detection process. Ref. [26] compared the classification effects of different types of machine learning on the KDD99 dataset. The machine learning algorithms include SVM, naive Bayes, J.48 and decision table. Ref. [27] designed an adaptive ensemble machine-learning model, which integrated the decision tree, random forest, KNN, DNN and other basic classifiers. An accuracy rate of 85.2% was achieved by adopting the adaptive voting algorithm on the NSL-KDD dataset. Ref. [28] proposed a hybrid layered intrusion detection system, which combined different machine-learning algorithms and feature selection techniques to achieve higher accuracy and lower false positive rate on NSL-KDD dataset.
With the rise of deep learning, models such as CNN [29], RNN [30] and LSTM [31] can automatically learn useful depth features to classify from the original traffic data. In the field of network intrusion detection, to improve the classification effect of deep learning models, researchers have primarily made some improvements in the loss function, model input characteristics and so on. Ref. [32] proposed a deep-learning system (BDHDLS), which used several deep learning models to learn different data distributions of clusters. Compared with the previous single model BDHDLS, the detection rate of network intrusion detection was greatly improved. Ref. [33] introduced the angle margin into the depth feature space to increase the interclass spacing and reduce the intraclass spacing in the traffic classification task, which improved the classification performance of the model. Deep learning can also achieve good results in various other fields in addition to traffic, and the design of a network architecture for classification models requires much experience and professional knowledge from researchers, which is also the key to further improving the classification effect of the model.
For the task of traffic data processing, ref. [34] combined the relevant principles of the image field and transformed the hexadecimal data in the original PCAP package into 6 × 6 , 8 × 8 , 16 × 16 , and 32 × 32 gray images as the input of the model. Ref. [35] proposed the concept of network traffic images (NTIs), transformed the network traffic into two dimensions, and classified it by using a deep convolution neural network. The accuracy of the network traffic classification task is 98.93%.

2.2. Neural Architecture Search
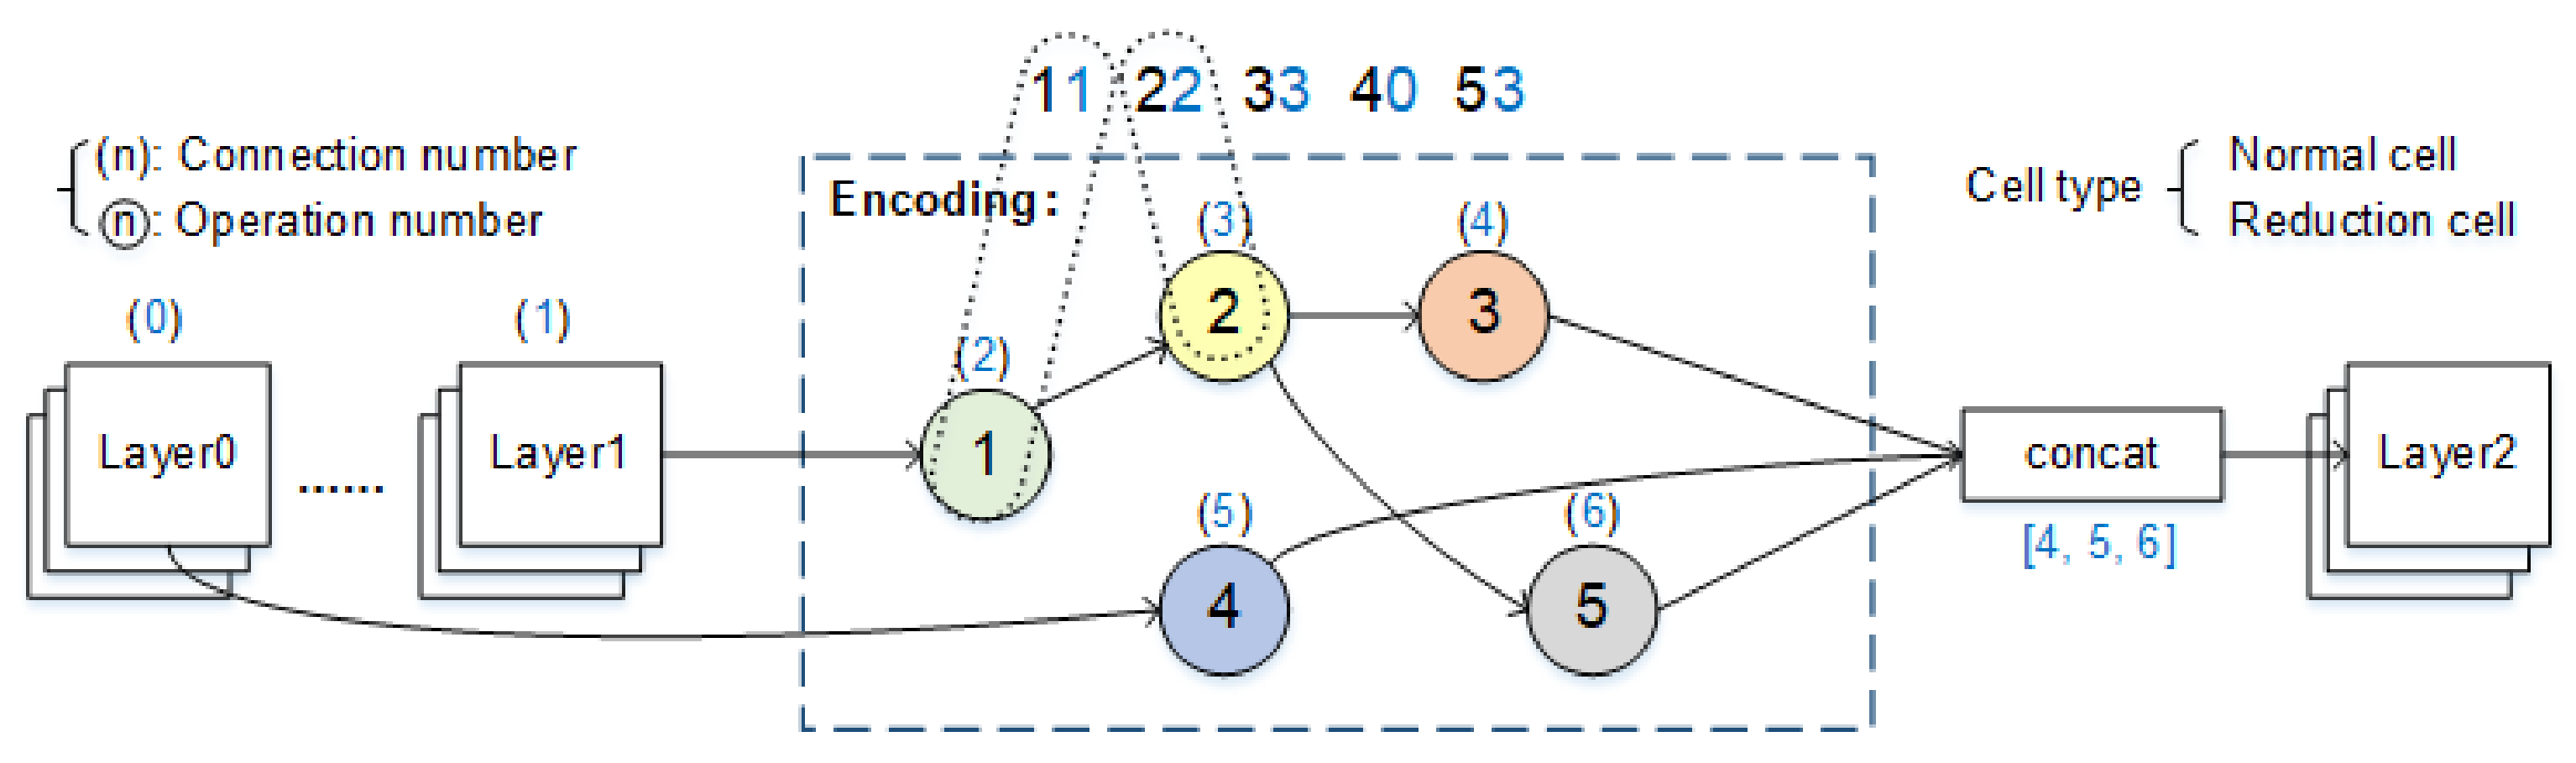
NAS is a subdomain of AutoML, which can be divided into three parts: search space, search strategy and performance evaluation strategy. BlockQNN [36] designed different block structures referring to the current mainstream deep neural network architectures, such as ResNet [37] and Inception [38]. The model is constructed by block stacking, and the network architecture search space can be greatly reduced by the block design. Moreover, due to the variable structure of the block stacking, it only needs to stack different numbers of blocks for different datasets or tasks, which endows the model with strong generalization ability. Ref. [39] designed two kinds of cells: normal cells and reduction cells (the operation in a normal cell will not change the size of the input feature map, while the operation in a reduction cell will halve the size of the input feature map). The model is also stacked by several cells. Ref. [40] took a series of operations, such as convolution and pooling, as search operands. The search space of the network architecture is defined and represented by coding. Combined with the genetic algorithm, network architecture coding is searched iteratively. Finally, good results are achieved on the CIFAR, ImageNet and human chest X-ray datasets. Darts [41] weakened the discrete search space into a continuous search space and searched the high-performance network architecture with complex graphical topology. Meanwhile, darts studied a double-layer optimization problem: for the process of NAS, it also optimized the network parameters at the same time.
In the neural network architecture search task, the search strategy defines how to find the appropriate architecture more rapidly and effectively. The common search strategies include random search, Bayesian optimization, evolutionary algorithms, reinforcement learning, gradient-based algorithms and so on. Among them, the evolutionary algorithm is widely used in architecture search. Ref. [16] proposed a progressive NAS model, which used a sequential model-based optimization (SMBO) strategy to accelerate the search of the network model in a complex search space. Ref. [42] combined the particle swarm optimization (PSO) algorithm to search the deep learning network model architecture on hyperspectral datasets, using one-dimensional PSO-NET and three-dimensional PSO-net as spectral and spectral spatial HSI classifiers, and achieved good results on two famous hyperspectral datasets. Ref. [43] proposed a randomly enhanced tabu algorithm as a controller to select candidate architectures in the process of NAS, which enabled the model to balance global exploration and local exploration more effectively.
The purpose of NAS is to find a network architecture with high performance from the huge search space. To guide the search process, it is necessary to evaluate the performance of the selected candidate architecture. In [40], the candidate architecture was trained on the training dataset, and its performance indicators were obtained on the verification dataset, but it undoubtedly consumed substantial computing resources. Therefore, it is very important to choose an appropriate performance evaluation strategy for the efficient optimization of the NAS search network architecture. Ref. [17] regarded the NAS as a two-level optimization problem: the upper layer completes the optimization of the network architecture, and the lower layer completes the optimization of the network parameters. For the lower layer optimization, a “super network” is trained in advance. In the architecture search stage, the weights of the candidate architectures are directly relayed from the super network as the initialization of the lower-level optimization. This makes it unnecessary for candidate networks to perform gradient optimization from the beginning, which greatly saves computing resources. In addition, the online surrogate model is used in the lower-level optimization, that is, an offline surrogate model is trained before the population iteration of the genetic algorithm to evaluate the performance of the offspring. This online surrogate model greatly improves the efficiency of searching samples because it is not necessary to evaluate the performance of each offspring by using the gradient descent method.

2.3. Search Space

The search space defines the possible topological structures of all candidate architectures and can be divided into three categories, according to network types: chain architecture space, multibranch architecture space, and search space constructed by cell/block. In the chain structure, the output of the upper layer network is the input of the lower layer network. When the number of network layers is large, gradient dispersion easily occurs. In the multibranch architecture space, some artificial designs are introduced, such as skip connections, which are similar to the residual structure in ResNet and can alleviate the gradient dispersion problem caused by the increase in network depth. The NAS task based on cells does not need to search the whole network architecture. For example, two different types of cells—normal cells and reduction cells—were proposed in [39]. The final network is composed of these two kinds of cells, which greatly reduces the search space and improves the search efficiency. Moreover, the model performs well on different datasets by migrating cells.
Our NAS model search space references [40]. We limit the search space so that the structure of the search model is N stacked cells, and each cell contains M operation blocks. At the same time, to build an extensible architecture, we use two types of cells to stack the network: (1) normal cell—input and output have the same feature map size; (2) reduction cell—after entering this cell, the size of the feature map is halved. We use a directed acyclic graph composed of five nodes to construct these two types of cells. Each node has a double branch structure. Two inputs are mapped to one output. The operation block in the search space contains operations and connections, which makes the search space more comprehensive. Figure 1 shows the architecture coding process. There are five nodes in the process, and the search parameters include five operations and five connections.
In addition, compared with the original search space, the relevant operation block is introduced in the Inception to stack the features of different receptive fields, which can obtain better features and improve the classification effect of the model. Table 1 shows the optional operations for the searching space. Among them, Inception A, Inception B and Inception C contain four different receptive field operations, and the structure is shown in Figure 2.
The operation blocks searched in the search space contain operations and connections. In a cell structure, if the total number of nodes is n, then the searchable connection combination is ( n + 1 ) ! . Considering that there are two different types of cell structures (normal cell and reduction cell) in the search space, the total connection combination is ( ( n + 1 ) ! ) 2 . In addition, since the optional operands are n _ o p s , considering the number of cell types, the total number of operands in a cell is ( n _ o p s ) 2 n . In summary, for a cell structure, the number of possible resultant combinations of a cell is β , as follows in (1).
β = ( ( n + 1 ) ! ) 2 · ( n _ o p s ) 2 n .

2.4. Search Strategy

The search strategy defines how to find the appropriate network architecture more rapidly and effectively. The evolutionary algorithm is widely used in architecture search. The optimization objectives in the architecture search process are usually manifold. Common multi-objective optimization strategies based on evolutionary algorithms include NSGA-II, MOEA/D and MOPSO. In this paper, three different algorithms are used to search the neural network architecture.

2.4.1. NSGA-II

NSGA-II is a fast and elite multi-objective genetic algorithm. In addition, NSGA-II proposes a crowding comparison method for individual sorting, which improves the diversity of the algorithm results. NSGA-II imitates the principles of natural selection and survival of the fittest, and obtains the final high-quality population through population iteration. First, the population is initialized, according to the given parameters. After the generation of offspring through selection, crossover and mutation, the parents and offspring are merged and sorted, according to the dominance relationship and crowding degree. Then, suitable individuals are selected to generate new parents. Finally, the population iteration is repeated until the end condition of population iteration is reached, and a high-quality population is obtained. As one of the most popular multi-objective genetic algorithms, the NSGA-II algorithm is described as Algorithm 1.
Algorithm 1 General framework of NSGA-II
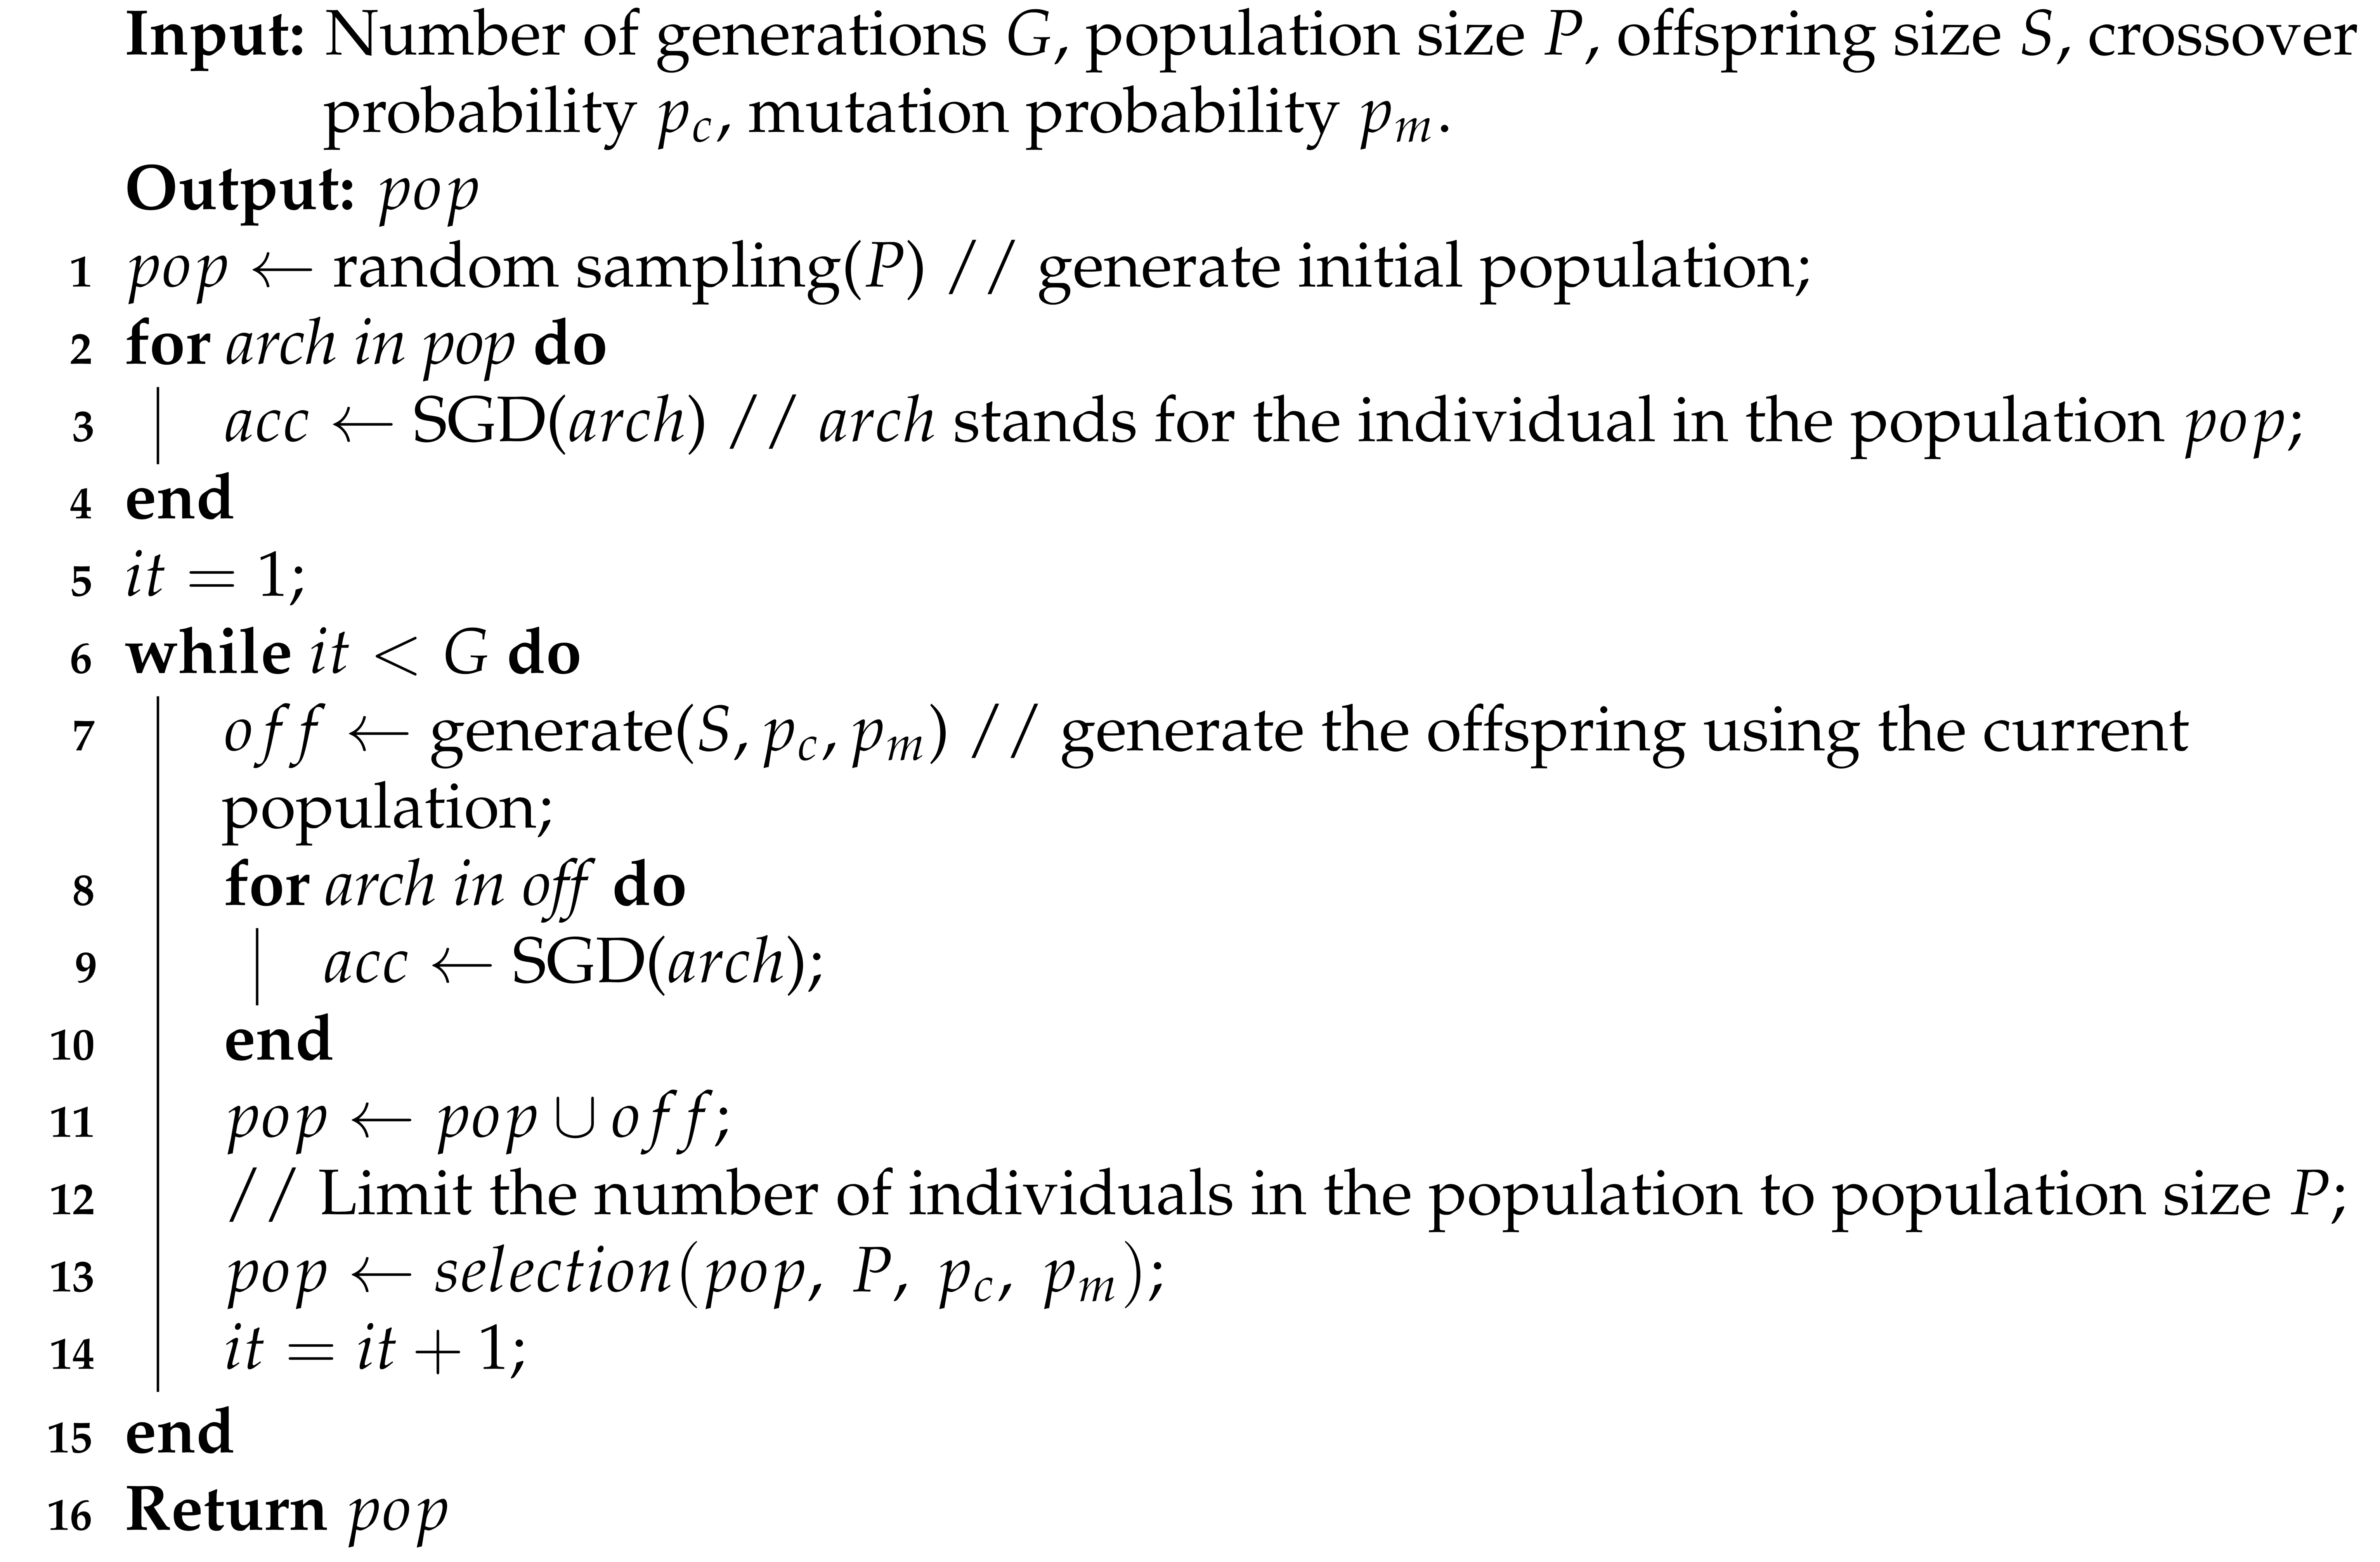
Symmetry 13 01453 i001

2.4.2. MOEA/D

MOEA/D is called the multi-objective evolutionary algorithm based on decomposition. MOEA/D introduces decomposition into a multi-objective optimization algorithm and transforms the multi-objective optimization problem into many single objective optimization subproblems. For each subproblem, the information of a certain number of adjacent subproblems is used for optimization, and a set of Pareto optimal solutions are obtained. In MOEA/D, the definition of weight λ is shown as (2). m is the number of optimization indicators.
λ = ( λ 1 , , λ m ) T , λ i 0 a n d i = 1 m λ i = 1
Usually, there are two ways to transform the multi-objective optimization problem into many scalar optimization problems. Equation (3) shows the first method of weight sum ( w s ). The space where x is located is the variable space. f contains m real valued objective functions. The multi-objective optimization problem f is transformed into the scalar optimization problem g w s ( x | λ ) by weight λ . One of the disadvantages of the w s method is that it does not perform well on nonconvex functions.
m i n i m i z e g w s ( x | λ ) = i = 1 m λ i f i ( x ) .
Equation (4) shows another method: the Tchebycheff method ( t e ). Here, z * is the reference point ( z 1 * , , z m * ) T . | f i ( x ) z i * | is equivalent to a coordinate transformation. Different from the weight aggregation of the first method, the Tchebycheff method is the maximum value of comparison, that is, given a set of λ = ( λ 1 , , λ m ) T and input x, select the maximum value of λ i | f i ( x ) z i * | (on the right side of the equation), and then, according to the minimum objective optimization principle, select a smaller value (the left side of the equation); here, x is the independent variable. One disadvantage of this method is that its aggregate function is not smooth for continuous multi-objective optimization problems, but its performance is still better than that of the w s method.
m i n i m i z e g t e ( x | λ , z * ) = m a x 1 i m λ i | f i ( x ) z i * | . z i * = min f i * ( x ) | x Ω 3
Specifically, first, a certain size of population is initialized, and each individual in the population is assigned a weight to transform the multi-objective optimization problem into a single objective optimization subproblem. Then, the parents are selected from the individual groups of several adjacent subproblems of each subproblem to generate the offspring, and population optimization is carried out, according to the weight vectors of different subproblems. In every subproblem, each generation of the population is a set composed of the current optimal solution.

2.4.3. MOPSO

MOPSO is a multi-objective optimization algorithm that simulates social behavior and has a unique search mechanism and convergence performance. In the application of particle swarm optimization (PSO) to multi-objective optimization, the key is how to choose the individual optimal solution and the global optimal solution. For the individual optimal solution, in the two states A and B of a particle in MOPSO, if each optimization goal of A is better than that of B, then A is selected as the individual optimal solution of the particle. If the two states cannot be distinguished strictly, the best state is selected randomly. For the global optimal solution, MOPSO chooses one according to the crowding degree in the optimal solution set (the lower the crowding degree, the higher the probability of the particle being selected).
In MOPSO, first, a certain number of particles are initialized randomly, and the fitness (multi-objective optimization index) is calculated. Then, the individual optimal solution and global optimal solution of each particle are initialized. Then, the algorithm updates the position and velocity of the particle, according to the velocity formula, as in (5), and the position formula, as in (6), where r 1 and r 2 are random numbers, w represents the internal factor, c 1 represents the local velocity factor, c 2 represents the global velocity factor, p b e s t represents the individual optimal solution, and g b e s t represents the global optimal solution. After the velocity and position of the particles are updated, the particle fitness is recalculated, and the individual optimal solution p b e s t and the global optimal solution g b e s t are updated, according to the fitness. Finally, the iteration is repeated until it converges or reaches the maximum number of iterations to obtain high-quality search results.
v i = w × v i + c 1 r 1 ( p b e s t p i ) + c 2 r 2 ( g b e s t p i ) .
p i = p i + v i .

2.5. Surrogate Model

Because substantial computing resources are needed to iteratively optimize the candidate architectures one by one to make them converge, we introduce a surrogate model to predict the performance of the model in the process of model architecture search, using a genetic algorithm. The input of the model is neural network architecture coding (as shown in Figure 1), and the output is the neural network performance prediction (such as accuracy, F1 value, etc.).
We use three different prediction surrogate models: multi-layer perceptron (MLP) [16], classification and regression trees (CART) [44], and Gaussian process (GP) [45]. MLP generally has three layers: input layer, hidden layer and output layer. The hidden layer and input layer are generally fully connected, while the hidden layer to the output layer is generally a softmax regression. CART is a kind of decision tree. The CART algorithm can be used to create both a classification tree and regression tree. In this study, in order to predict the performance of the model (discrete value), a regression tree is established. The steps of the GP model to complete the regression task are as follows: (1) determine the Gaussian process; (2) determine the expression of prediction points, according to the posterior probability; (3) solve the super parameters by maximum likelihood; and (4) input data to obtain the prediction results.
It cannot be guaranteed that every surrogate model can perform well in different classification tasks. We use an adaptive switching (AS) selection mechanism, select the best prediction model (by comparing the correlation between prediction and actual value) in each iteration to train three kinds of surrogate models at the same time when training the surrogate models, and select the appropriate model adaptively through cross selection.

2.6. Lightweight Model

With the same size of the receptive field, the number of ( n + 2 ) × ( n + 2 ) convolution kernel parameters is ( n + 2 ) 2 , while that of two n × n convolution kernels is 2 × n 2 . To make the model lightweight, we use the superposition of two n × n convolution kernels to replace the ( n + 2 ) × ( n + 2 ) convolution kernel in the searchable operation structure. At the same time, in the face of some large convolution kernels, a 1 × n convolution kernel and a n × 1 convolution kernel are added to replace a n × n convolution kernel to reduce the number of parameters, as the number of parameters of the former is ( 1 × n ) + ( n × 1 ) , which is less than n × n of the latter. In addition, different sizes of depth separable convolution and whole convolution are used to replace the general convolution kernel so that the model parameters are reduced when the receptive field is the same.
We use FLOPS (floating point operations per second), parameters, model reasoning ability and other indicators to measure the complexity of the model.

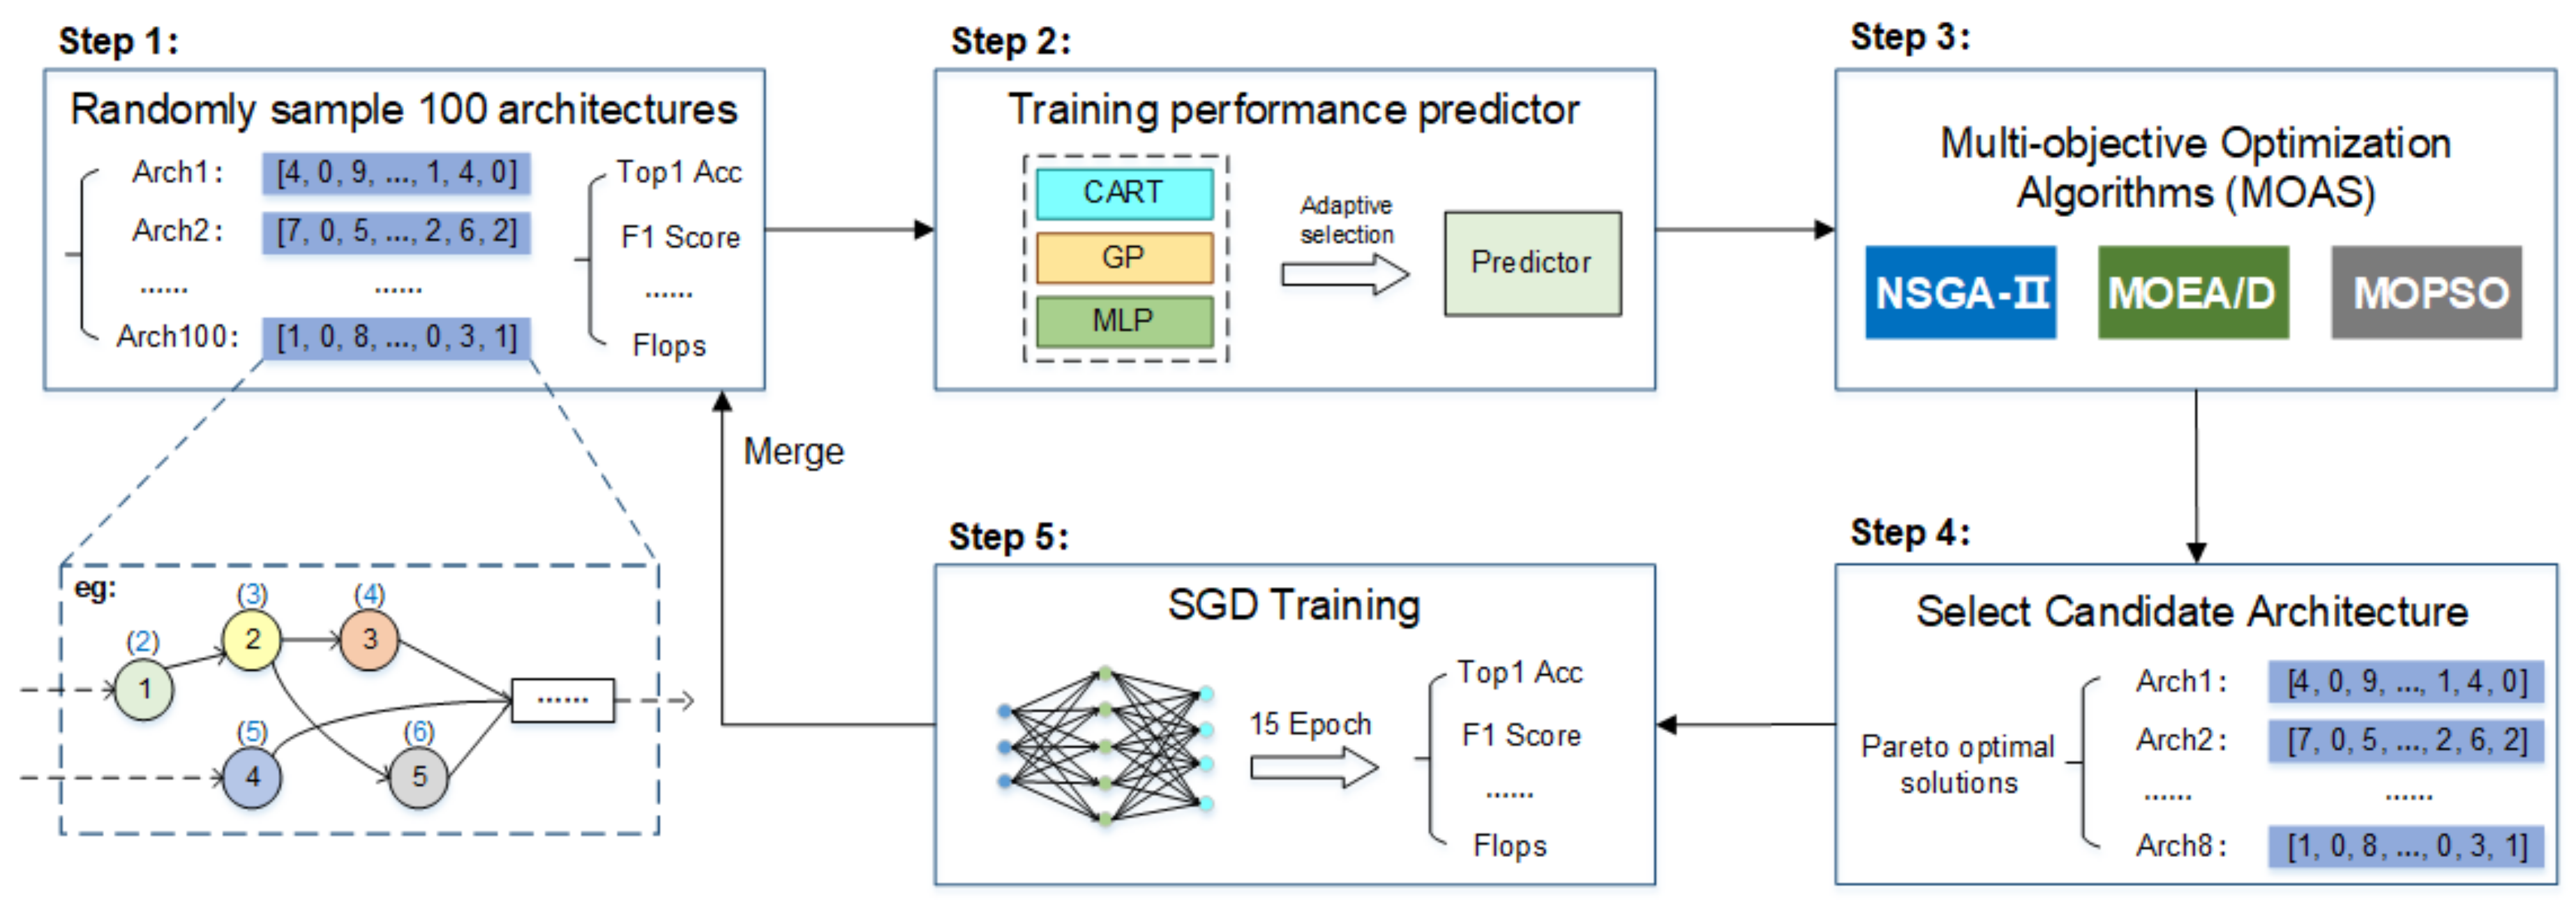
2.7. Proposed Approach

Based on the genetic algorithm, we use three different multi-objective optimization algorithms, namely, NSGA-II, MOEA/D and MOPSO, to search the neural network architecture of the traffic screening model. To improve the efficiency of the network search, a surrogate model is introduced in the process of the architecture search. Figure 3 and Algorithm 2 show our NAS model (Efficient-NAS) and the specific steps of the architecture search task.
We divide our model into two layers: the outer layer maintains a set of architectures, A r c h i v e , stores the architecture evaluated by the SDG method, and trains the surrogate model through this architecture collection. The inner layer uses a surrogate model to optimize multi-objective tasks. The multi-objective optimization algorithms are NSGA-II, MOEA/D and MOPSO. The performance evaluation of the candidate architecture by the surrogate model only requires minimal computing resources, which greatly improves the efficiency of the multi-objective optimization task in the inner layer of the NAS model.
Step 1: Randomly initialize the number of 100 architectures to A r c h i v e , that is, randomly select the network architecture codes from the specified search space. Each code represents a network architecture, and the performance of each architecture in the initialization population is evaluated. The model parameters are trained by the gradient descent method, and performance indexes, such as Top-1 error and the F1 score, are obtained.
Step 2: For the existing A r c h i v e training surrogate model, the input is the model architecture code, and the output is the predicted model performance index.
Step 3: Three multi-objective optimization algorithms based on evolutionary algorithms (NSGA-II, MOEA/D and MOPSO) are used to generate a high-quality architecture set through the inner layer iteration on the initialization of architectures. In the process of the inner layer iteration, the surrogate model is used to predict the performance to improve the search efficiency.
Step 4: A certain number (default: 8) of candidate architectures are obtained by screening the Pareto frontier.
Step 5: Gradient descent parameter optimization is performed on the selected candidate architectures to obtain the real performance indicators. These candidate architectures are added to A r c h i v e , and Step 2 is repeated for a certain number of iterations.
Algorithm 2 General framework of Efficient-NAS
Symmetry 13 01453 i002

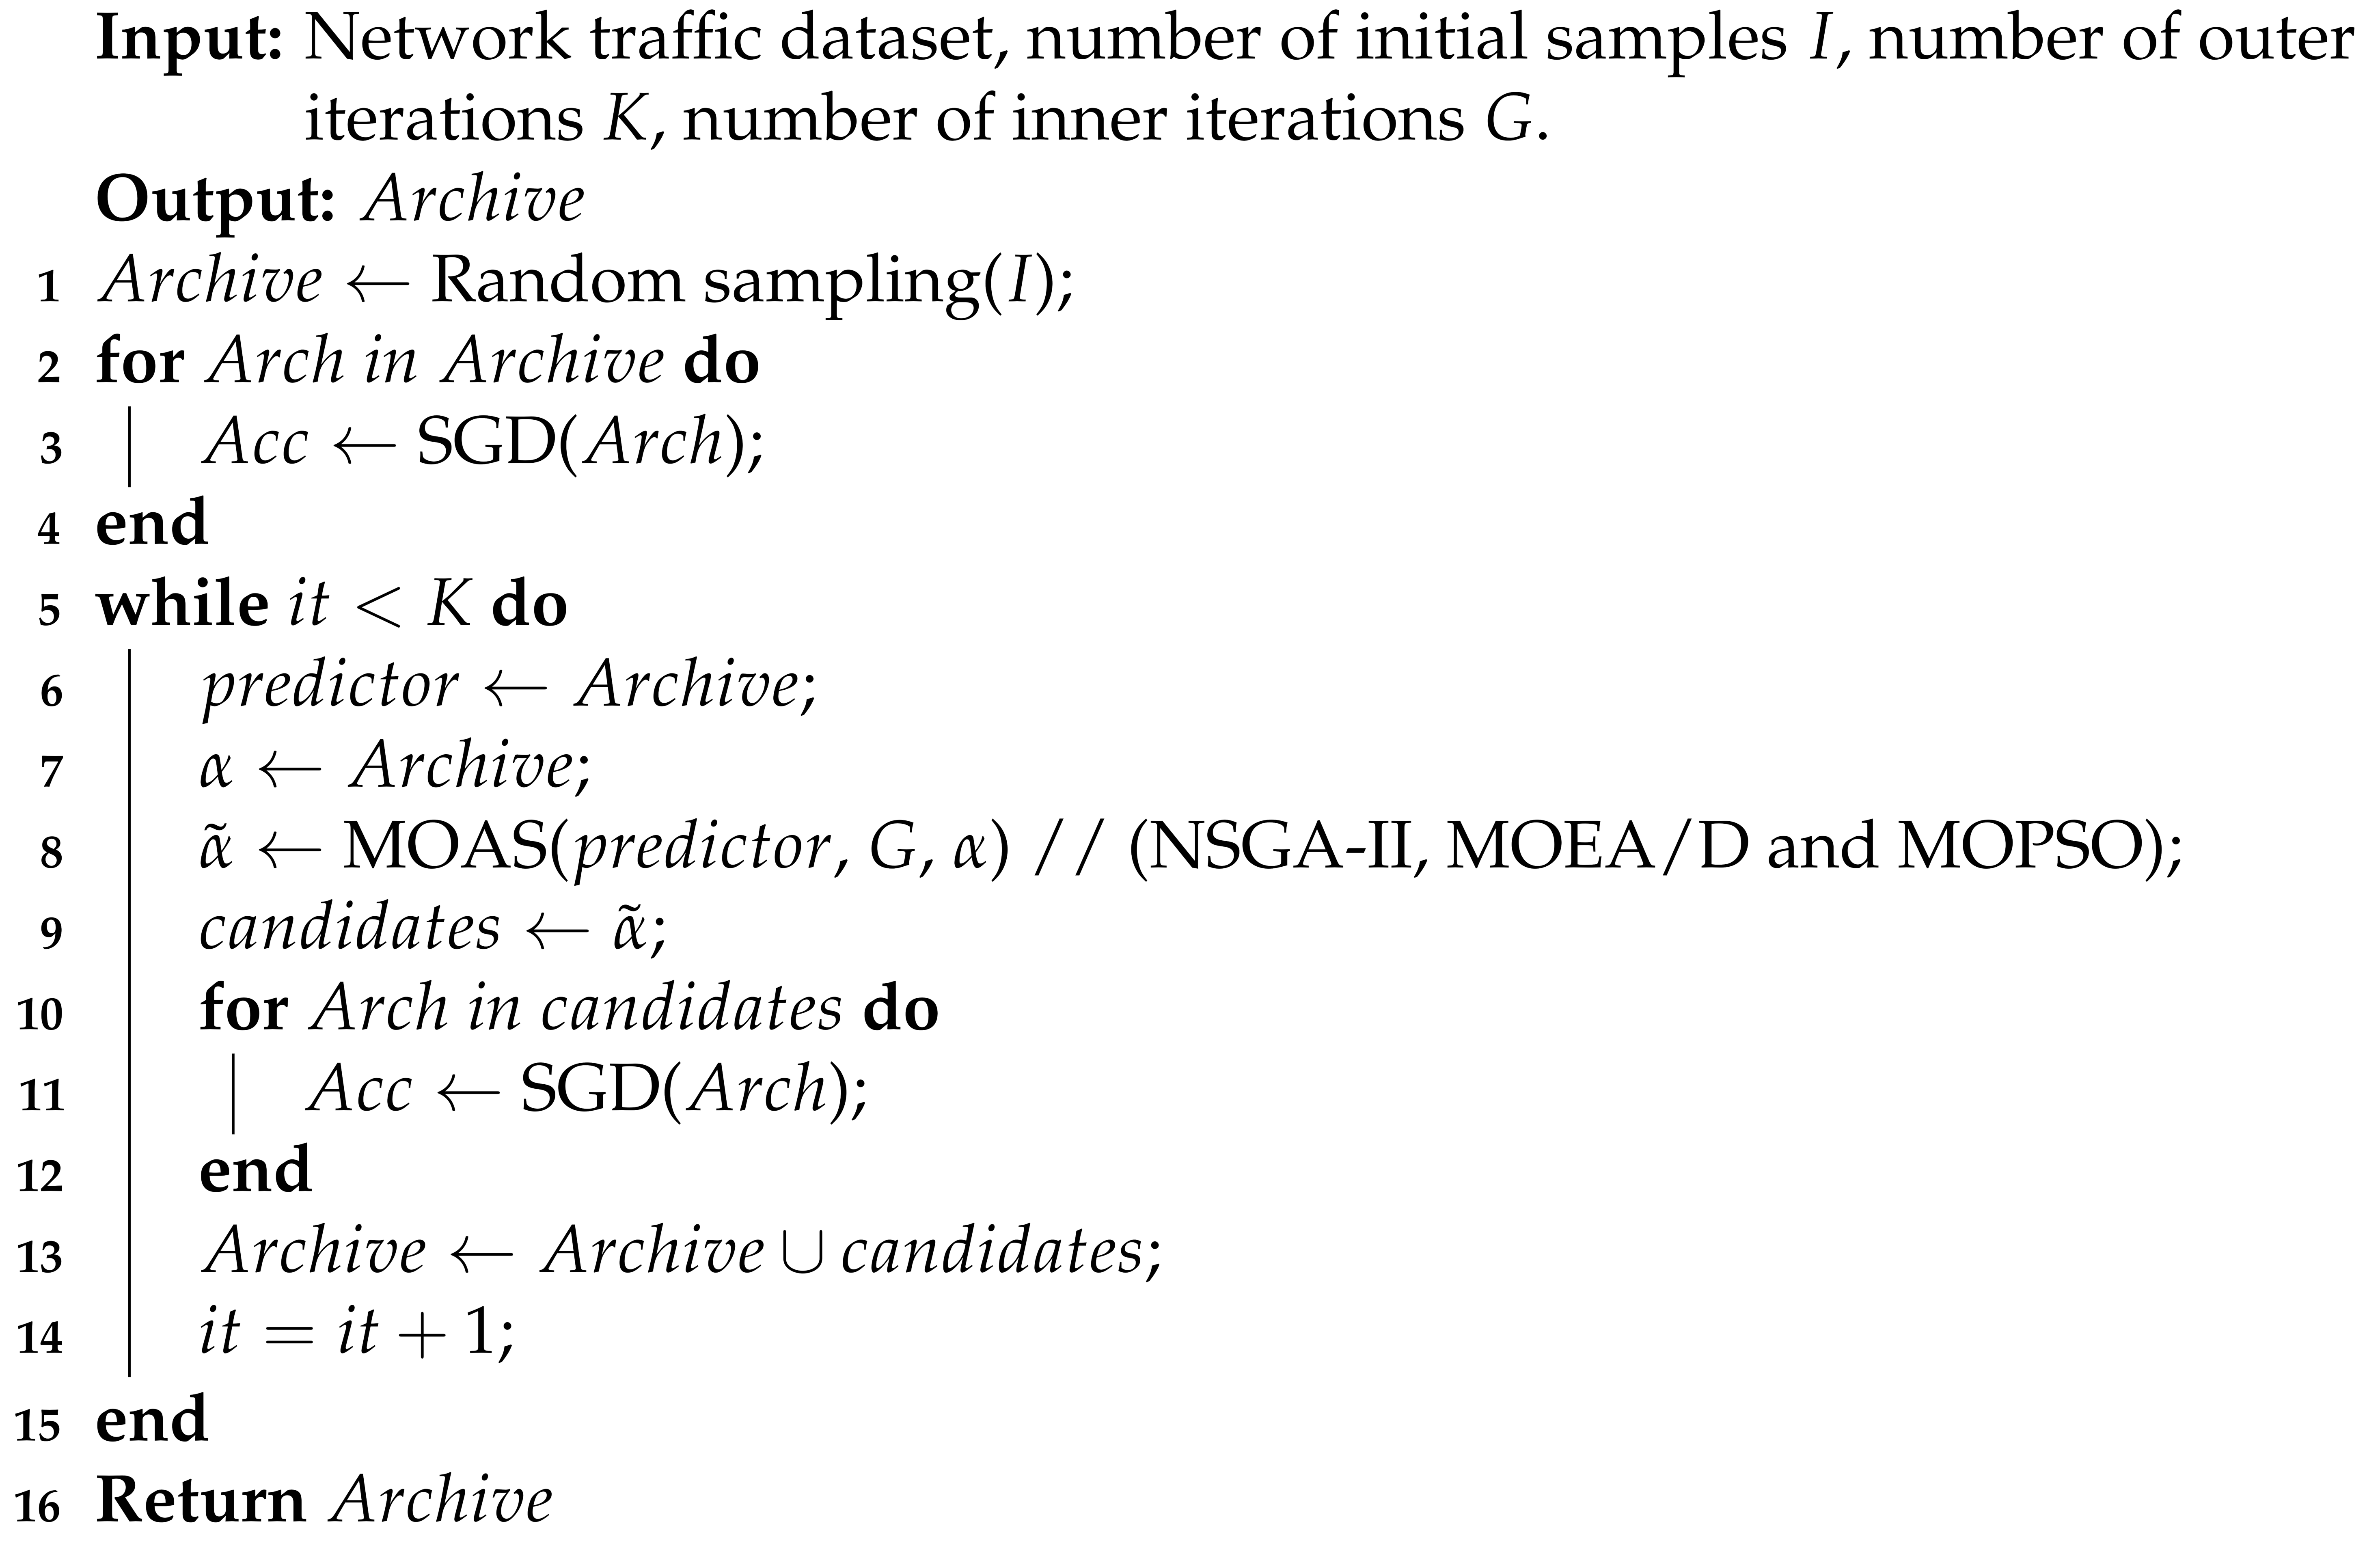
3. Results and Discussion

3.1. Data Description

Dataset 1 CIC-DoS2017: The dataset contains an application layer of denial of service (DoS) attacks on the internet. This kind of attack is usually divided into high capacity attacks and low capacity attacks. High capacity attacks are usually called flooding attacks. The nature of these attacks is similar to the traditional DoS attack, which is characterized by sending a large number of application layer requests (such as HTTP GET, DNS query, and SIP INVITES) to the victim. The characteristic of a low-capacity DoS attack is to transmit a small amount of attack traffic to the victim, strategically. Because one-time attacks usually take advantage of specific weaknesses or vulnerabilities in application-level protocols/services, the dataset is mainly more general in application layer DoS slow attacks, which are usually manifested in two kinds of changes: slow sending and slow reading. A testbed environment is established. The victim network server runs Apache Linux v.2.2.22, PHP5 and Drupal v.7 as the content management system. The most common attack is the DoS type of the application layer. The generated application layer DoS attacks are mixed with the normal traffic of the ISCX-IDS dataset. Four types of attacks are conducted with different tools, and eight different application layer DoS attacks are obtained. These attacks are aimed at the 10 web servers with the most connections in the ISCX dataset, and the resulting set contains 24 h network traffic, with a total size of 4.6 GB. We extract the attack types of these eight different application layers from the dataset, and the traffic distribution is shown in Table 2.
Dataset 2 ISCXIDS2012: The data in the ISCXIDS2012 dataset contain normal traffic and malicious traffic (infiltrating the network from inside, HTTP Denial of Service, Distributed Denial of Service using an IRC Botnet, and Brute Force SSH). Based on the concept of the configuration file, the behavior of central users is abstracted into a configuration file. Different attack scenarios are designed to generate real-world malicious traffic. The dataset contains network activities spanning 7 days, and the specific distribution is shown in Table 3.
Dataset 3 CIC-DDoS2019: In the dataset CIC-DDoS2019, researchers analyzed new attacks that can be executed, using TCP/UDP-based protocols at the application layer, and proposed new classifications: reflection-based DDoS and exploitation-based attacks. They all accomplish the attack by using a legitimate third-party component to hide the attacker’s identity. In the former attack type, the attack can be executed through the application layer protocol, using the transport layer protocol, that is, the transmission control protocol (TCP), user datagram protocol (UDP), or a combination of the two. For the latter, the attack can also be performed through application-layer protocols, using transport-layer protocols, such as TCP and UDP. The dataset uses a B-Profile system to describe the abstract behavior of human interaction and to generate natural, benign background traffic in the proposed testbed. The dataset builds abstract behaviors for 25 users based on HTTP, HTTPS, FTP, SSH, and email protocols. In order to facilitate the test, we use only the first day’s traffic data in our study and limit the number of samples to alleviate data imbalances. The specific distribution is shown in Table 4.

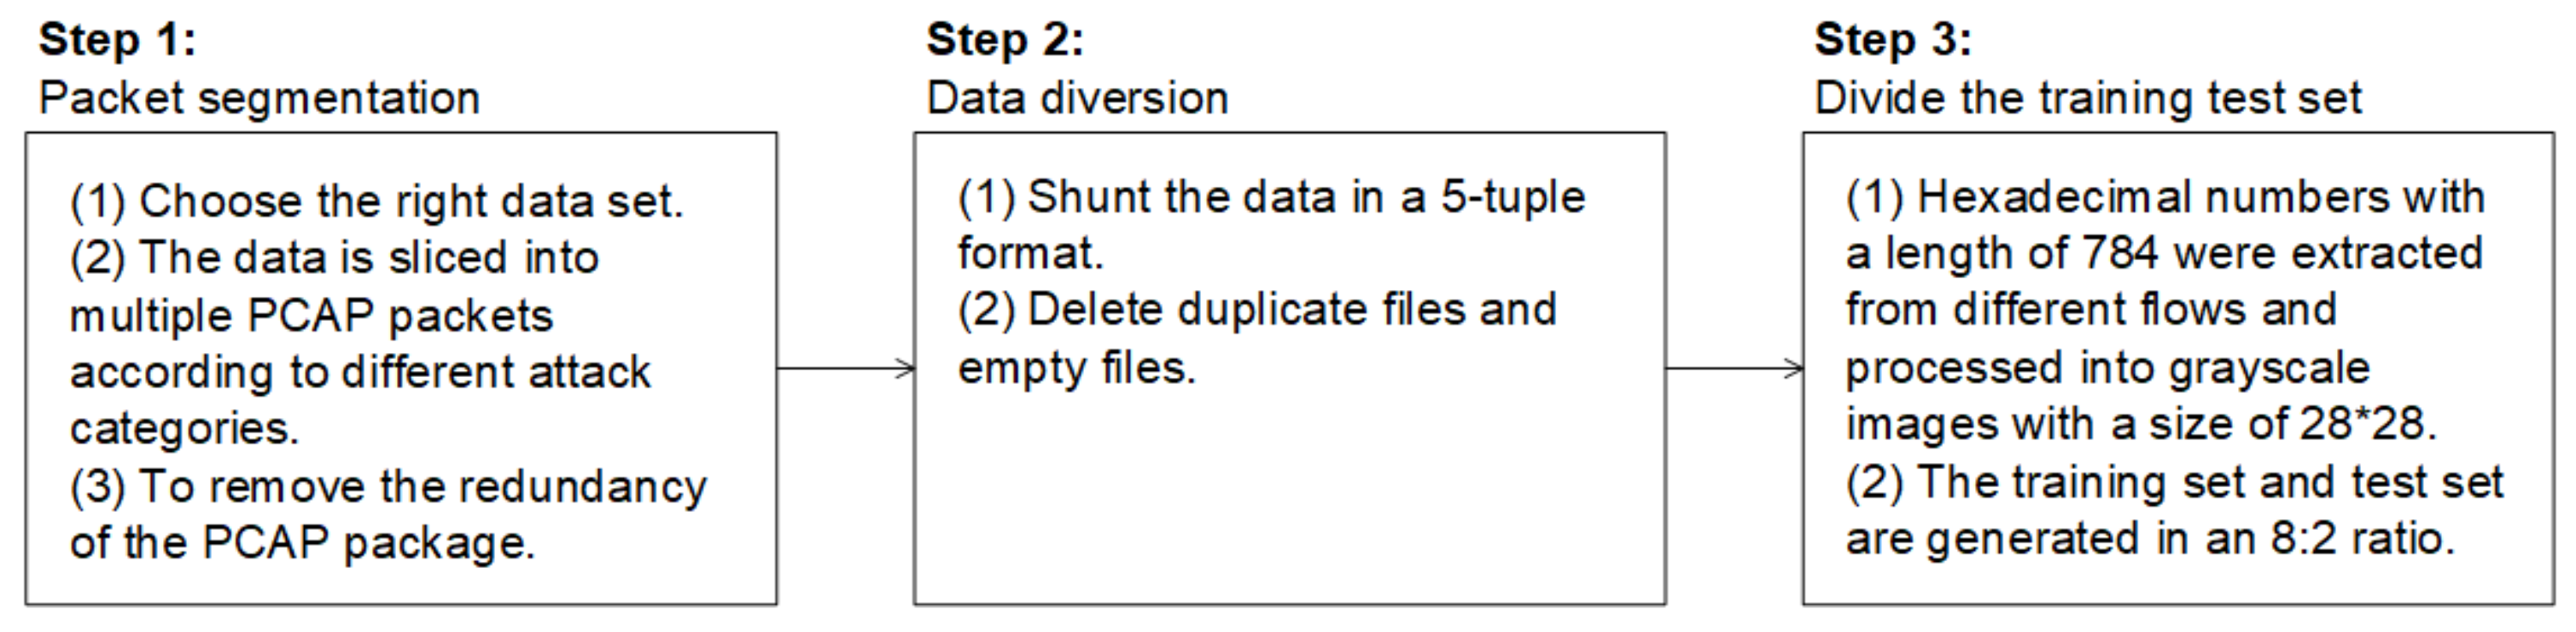
3.2. Data Processing

There are many kinds of traffic data processing. Although the purpose of processing files is to extract single sample data from PCAP files one by one, due to different operations, such as flow cutting and redundancy removal, the results may be different. For example, ref. [34] processed the original traffic data into n × n grey images and then input them into the deep learning model. In [46], a traffic data processing integration tool USTC-TK2016 was mentioned, which can process the original traffic data from the PCAP package into trainable sample data. We refer to various methods of previous traffic data processing, and, according to the actual application scenario, the traffic data processing in this study is divided into three steps, as shown in Figure 4.
Traffic packet segmentation: The original traffic packets on the network are divided into PCAP packet formats, according to different attack types, such as time and IP address. The redundancy of generated PCAP packets is removed by, for example, deleting out-of-order and retransmitted packets.
Data streaming: Combined with the integration tool USTC-TK2016, different kinds of PCAP files are processed into streams in the form of five tuples. In the process of streaming, duplicate files and empty files are deleted.
Generation of the training and testing sets: The hexadecimal numbers are extracted from the data stream, processed into a 28 × 28 matrix and saved in the form of a JSON file. Due to the imbalance of some categories in the dataset, we limit the maximum number of samples for each attack category to 10,000. At the same time, the data should be labeled, and the label information should include the address and category of the sample data. Finally, the labeled data are divided into training and testing sets at a ratio of 8:2.

3.3. Implementation Details

In this study, we use the Python language and PyTorch framework to experiment on a single NVIDIA 2080Ti GPU. Data processing, and model training and testing are all performed in the environment of Ubuntu 16.04/RTX 2080Ti × 1/Cuda 11.0 + Cudnn 11.0. The Python and PyTorch versions are Python 3.7.7 and PyTorch 1.2.0.

3.3.1. NAS Parameter Setting

In parameter setting, because the network traffic data obtained, according to the data processing scheme, are smaller than the image data size, to prevent the model from fitting, the number of cells searched is set to 1, and the number of blocks (block structure in a cell) is set to 5. To ensure that there are enough samples to support agent model training, the number of initialization architectures is 100. During each population iteration, the individuals in the initialization parent species are Pareto optimal solutions of the evaluated architecture set. The number of sub algebra items generated by each iteration is 40, and 30 iterations are used to obtain a high-quality population. Then, eight optimal architectures are selected from the high-quality population for evaluation and are added to the evaluated architecture; the whole process is iterated 30 times. The specific parameter settings are shown in Table 5.
Because a cell contains n _ b l o c k block structures, a block contains n _ n o d e s nodes. In addition, since two different types of cells (normal cell and reduction cell) are set, the number of architecture codes to be searched should be multiplied by 2. Considering the change in the number of input channels, the number of network architecture codes in the search space is n _ v a r , as in (7).
n _ var = n _ c e l l s × n _ b l o c k s × n _ n o d e s × 2 + 1 = 41 .
During the architecture search process, every iteration of the outer architecture search is completed, and n _ i t e r architectures are selected from the population after iteration for parameter optimization. The process is iterated for n _ i t e r a t i o n s times in total. Therefore, the total number of architectures evaluated in the whole architecture search task is n _ a r c h , as follows in (8).
n _ a r c h = n _ d o e + n _ i t e r a t i o n s × n _ i t e r = 340 .

3.3.2. Model Training Parameter Setting

During the process of model training, the Adam algorithm is used to optimize parameters, and cosine annealing is used to adjust the learning rate. Each architecture is trained for 15 rounds during parameter training to ensure that the parameters converge as much as possible. For other training parameters, refer to Table 6.

3.4. Experimental Results and Analysis

3.4.1. The Evaluation Index

The evaluation index is mainly divided into three parts: the first part evaluates the classification effect of different types of data from the perspective of the model; the second part evaluates the lightweight evaluation index; and the third part evaluates the quality of the search results from the perspective of NAS.
Evaluation index of model effect: To evaluate the classification results of the experiment, four indexes, namely, accuracy, recall, precision and weight-F1, are used. The expression of the index is as follows:
A c c u r a c y = T P + T N T P + T N + F P + F N .
R e c a l l = 1 N i = 1 N T P T P + F N .
P r e c i s i o n = 1 N i = 1 N T P T P + F P .
W e i g h t f 1 = i = 1 N w 2 × P r e c i s i o n × R e c a l l P r e c i s i o n × R e c a l l .
For Class A, T P represents the number of samples that are actually Class A and predicted to be Class A, T N represents the number of samples that are not actually Class A and predicted not to be Class A, F P represents the number of samples that are not actually Class A but predicted to be Class A, F N represents the number of samples that are not actually Class A but predicted not to be Class A, N represents the total number of samples, and W represents the proportion of sample data in Category I with respect to the total sample data of all categories. Accuracy is the proportion of correctly classified samples among all sample data, and recall is the average proportion of correctly classified samples in the real results. Precision is the average of the proportion of each correct classification in the prediction results, and Weight-F1 is the harmonic average of precision and recall.
Architecture search effect evaluation index: To evaluate the computational power consumption of the model, the FLOPs parameter of the model is calculated. FLOPs is the abbreviation for floating point operations, which means the number of floating-point operations. It is understood as the amount of computation and can be used to measure the complexity of the algorithm or model.
Architecture search effect evaluation index: For the single objective optimization task, the search results can be evaluated in two respects—the computing resources consumed by the architecture search and the optimized model index—while the computing resources can be evaluated by the time consumed by the search task and the number of optimized architectures in the search process. For multi-objective optimization tasks (for example, optimizing model classification accuracy and model complexity at the same time), in addition to evaluation from the perspective of computing resources, we also need to consider a number of evaluation indexes. In this study, we consider the hypervolume index. The hypervolume index represents the volume of the hypercube bounded by the individuals in the solution set and the reference points in the target space. The hypervolume index evaluation method is a Pareto-compliant evaluation method, that is, if one solution set S is better than another solution set S , then the hypervolume index of solution set S will also be greater than that of solution set S .

3.4.2. Classification Effect of NAS-Net

To better complete the task of traffic classification through the architecture obtained by NAS, the model obtained by NAS and the general, manually designed classification model are applied to the traffic dataset. These networks include the manually designed LeNet, CNN, ResNet, VGG and our NAS-Net. The results are shown in Table 7.
Compared with ResNet and VGG, NAS-net has a higher F1 score and smaller FLOPs. For LeNet, because its network architecture is too simple, even though it has a very low model complexity, its F1 score index is relatively low, and its performance is not as good as those of other network models. The complexity of the self-designed CNN network model is higher than that of LeNet, and the F1 score is also higher but it is still not high enough, compared with ResNet, VGG and NAS-Net. In summary, we can draw a conclusion: the architecture searched by NAS (NAS-Net) is more suitable for the task of network intrusion detection.

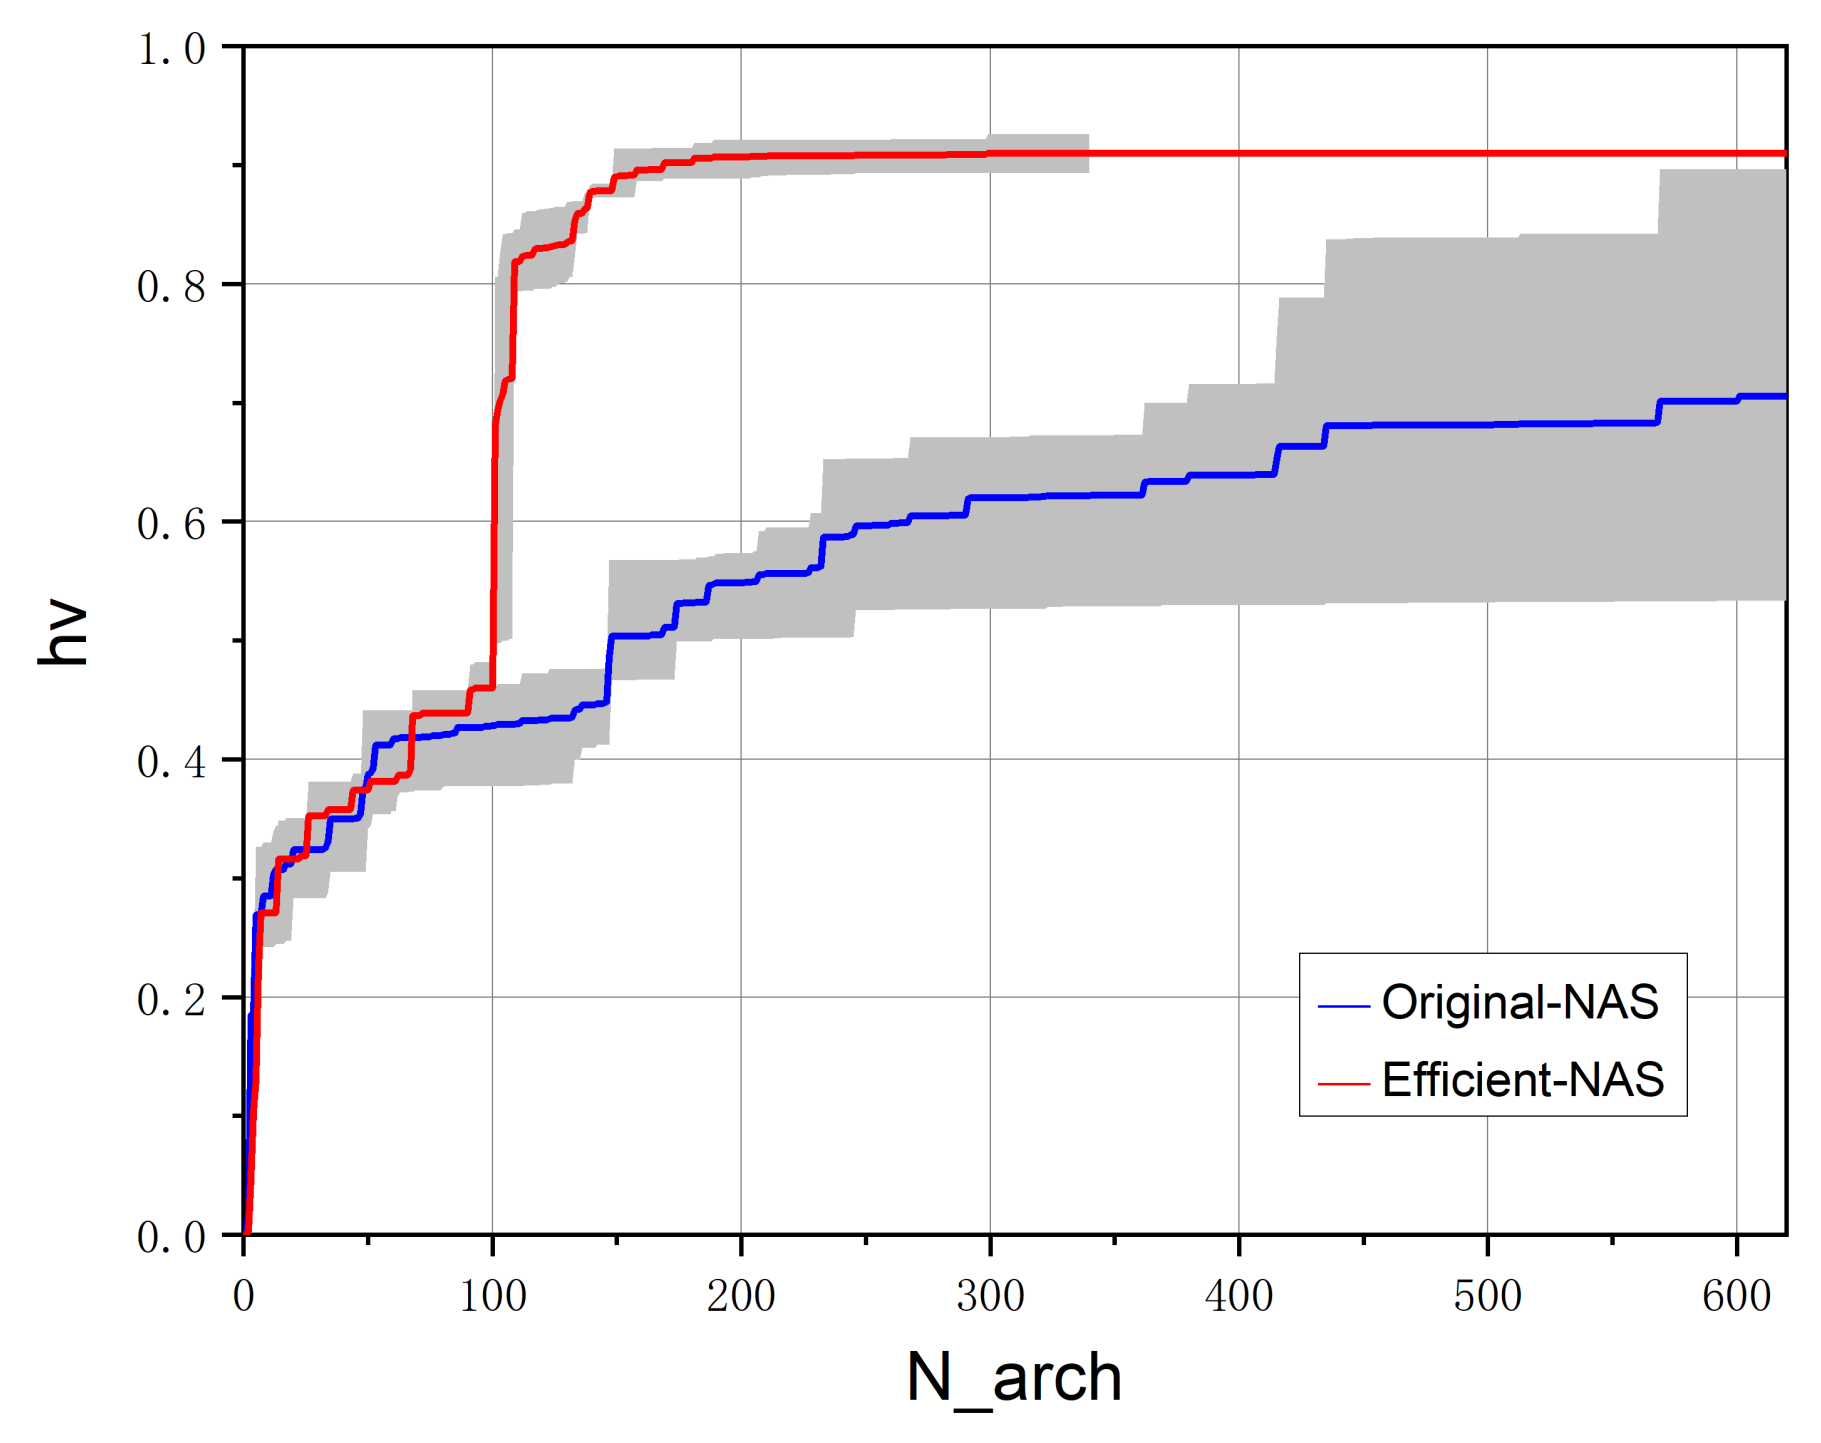
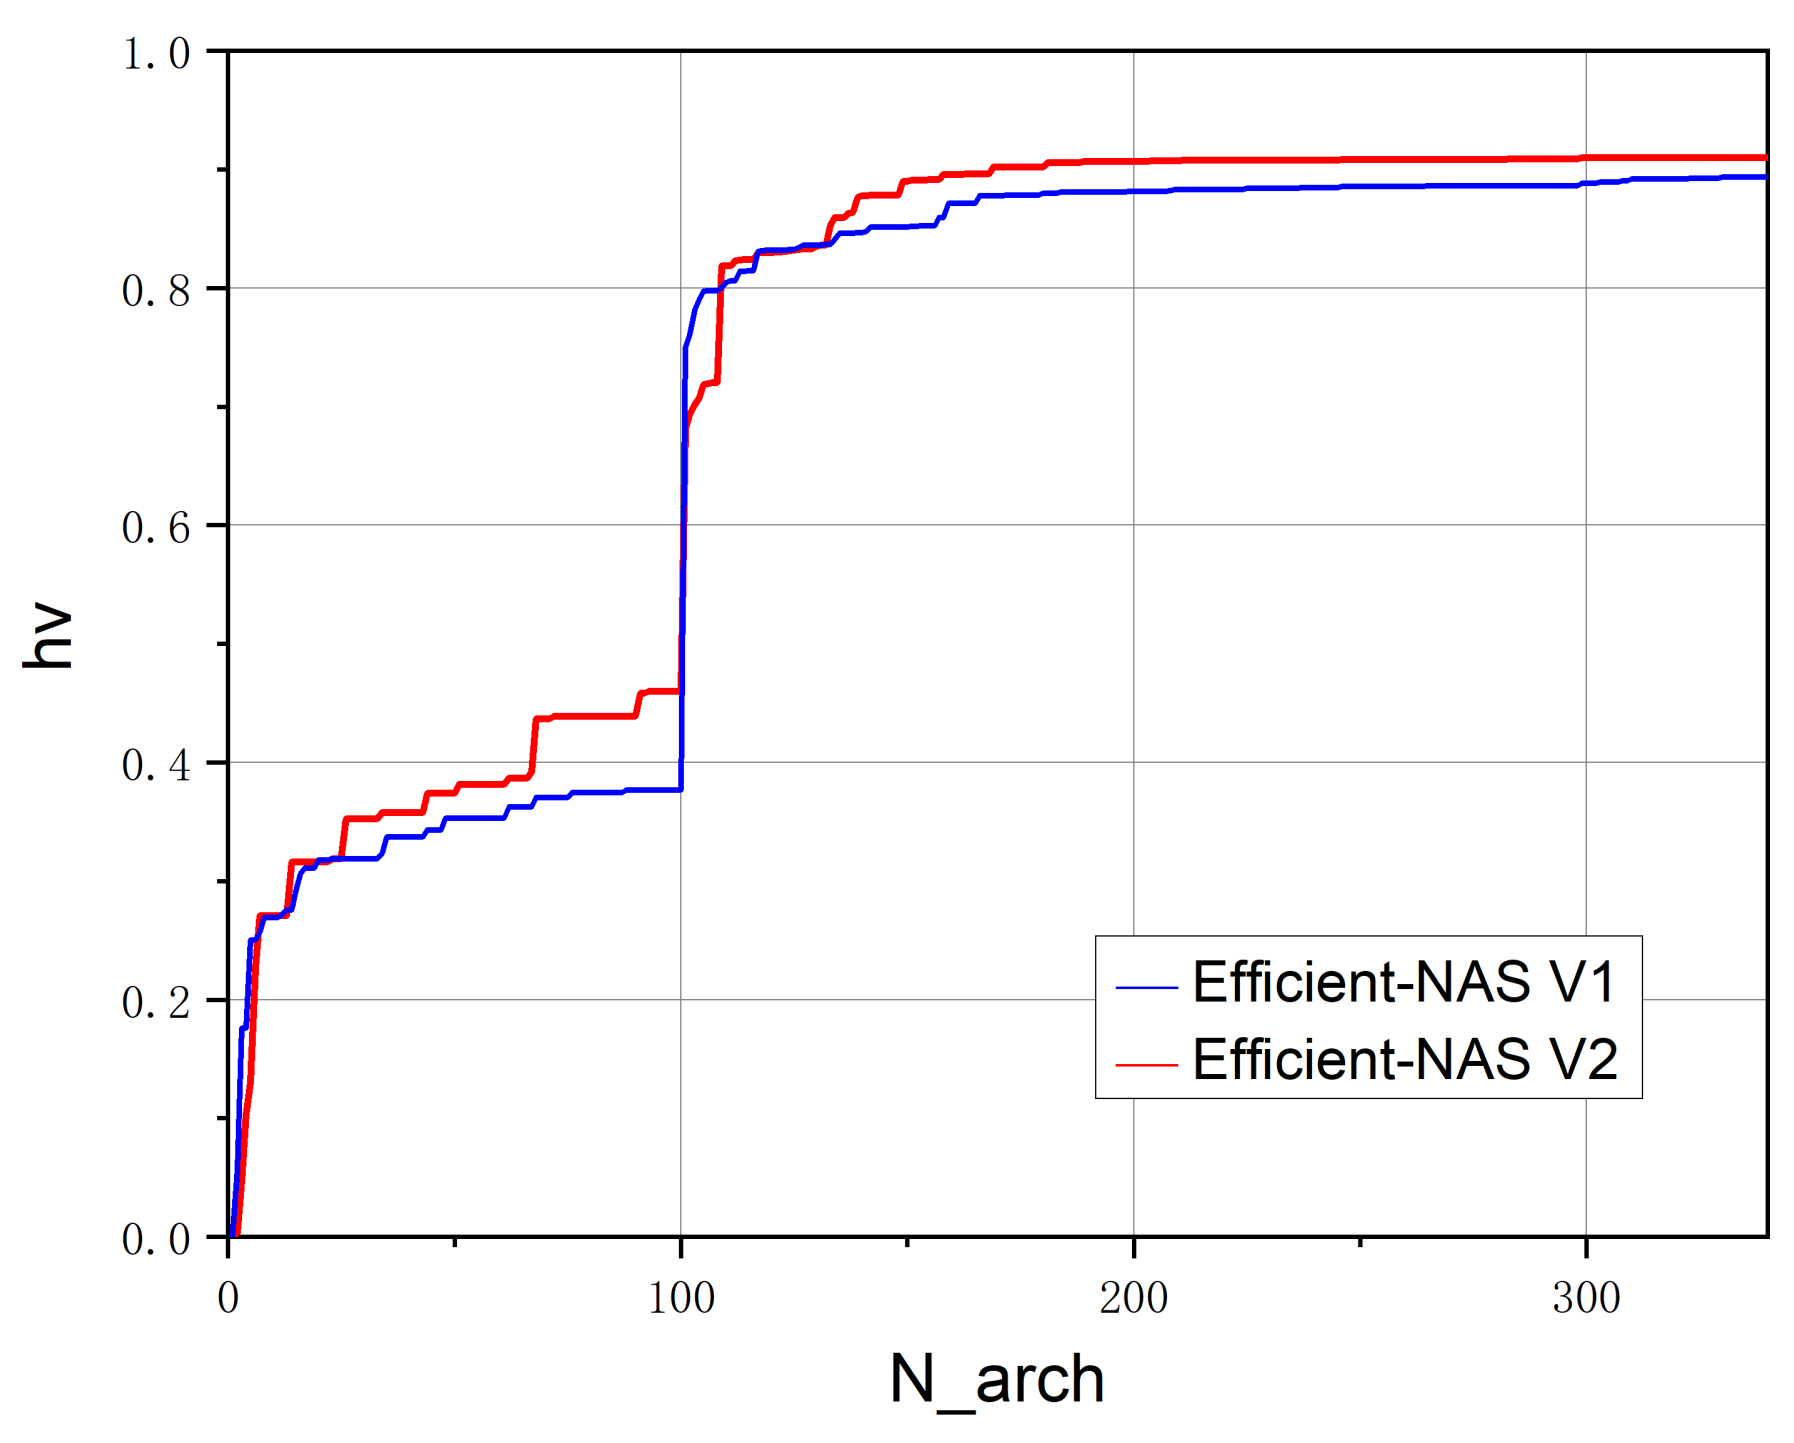
3.4.3. Search Efficiency

First, in the process of NAS, we introduce surrogate models to improve the search efficiency. To quantify the search efficiency, we first compare the single-objective optimization results before and after introducing the surrogate models, that is, the total number of architectures evaluated when reaching the highest F1 score.
It can be seen from Table 8 that after introducing the surrogate model, Efficient-NAS is 1.72× faster than Original-NAS. In addition, from the comparison of the F1 scores, our NAS model can achieve higher classification accuracy with higher efficiency.
Second, to compare the relative search efficiency between Efficient-NAS, which introduced the surrogate model, and Original-NAS, the hypervolume metric (hv) is used to measure the performance of objective optimization. We conduct three experiments on different NAS models. Figure 5 shows the change curve of the hypervolume with respect to the number of evaluation architectures in the process of the architecture search in which a larger hypervolume value indicates a better Pareto frontier.
Based on the increase rate of the super volume measurements, we observe that Efficient-NAS achieves a better Pareto frontier. In addition, when completing the architecture search task, 340 architectures are evaluated by Efficient-NAS, while 620 architectures are evaluated by Original-NAS.
Figure 6 shows the comparison of search results. It can be seen from the figure that before the introduction of the surrogate model, the model is more inclined to search for models with higher classification accuracy, while after the introduction of the surrogate model, the search results of the model are more evenly distributed with respect to the two optimization indicators (Top-1 error and Flops), which indicates higher diversity versus the former model. In general, after introducing the surrogate model, the results of the model are not very different from the previous results (the difference of Top-1 error is approximately 5% when FLOPs is larger than 10 MB), but the search efficiency is improved by nearly 172.2%, which can prove the effectiveness of introducing the surrogate model in improving the search efficiency of the architecture.

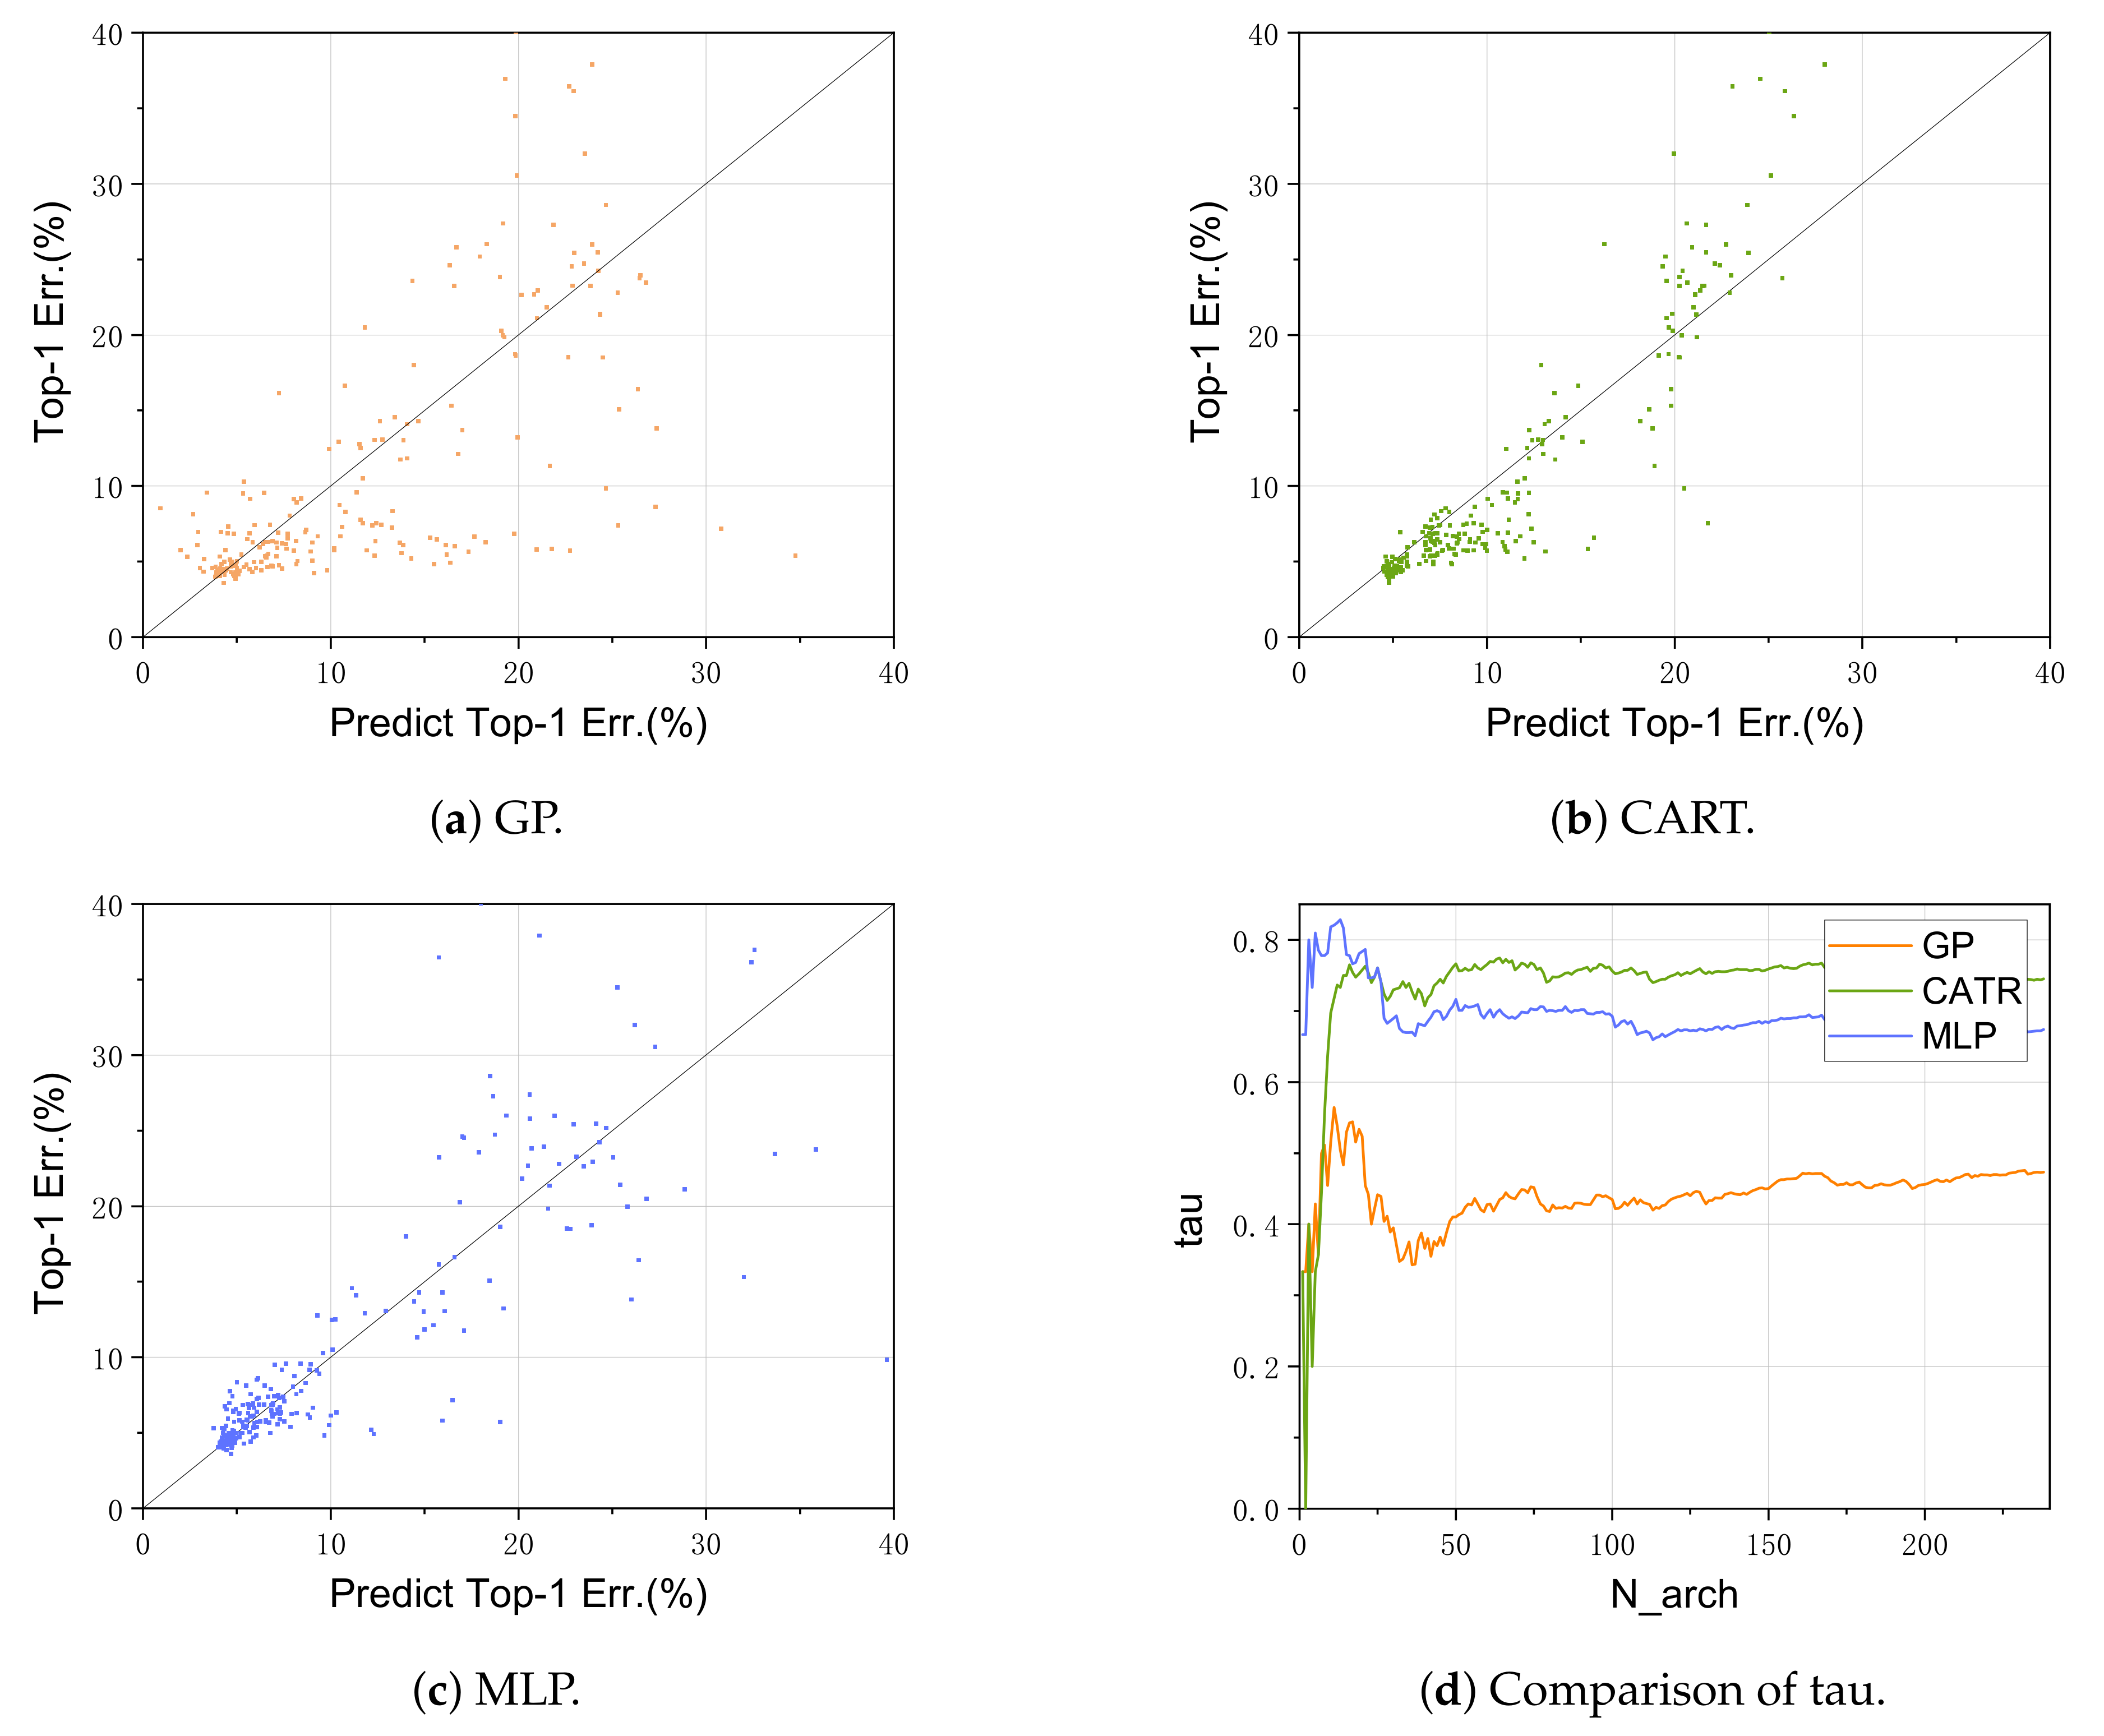
3.4.4. Representation of Surrogate Model

By introducing the surrogate model and using different surrogate models to select adaptively, the computing resources required in the population iteration process are greatly reduced. The main task of the surrogate model is to predict the accuracy of the model architecture to guide the direction of the architecture search. We use 340 architectures to verify the performance of the surrogate models, of which 100 architectures are used as the initial architectures of the training surrogate model, while the rest are used as the testing set of the performance test of different surrogate models. As the experiment continues, the evaluated architectures continue to add training sets to train the surrogate model to simulate the search process of NAS. Figure 7a–c shows the performance of three different surrogate models (GP, CART and MLP) in predicting the architecture performance (predicted Top-1 error; (%) represents the architecture performance index predicted by the surrogate model). When only one surrogate model is used for the performance prediction, the performance is inconsistent. Figure 7d shows the comparison of the tau index, which can represent the correlation between the two groups of indicators. With the change in N_arch, none of the three surrogate models’ tau index remains the best.
In the experiment, instead of using the above three surrogate models, we use the AS model, which adaptively selects different surrogate models in the search task. We record the performance evaluation results of the surrogate models during the architecture search process. The performance of the four different forms of surrogate models in the prediction mode is shown in Table 9. Tau is the correlation coefficient between the prediction index and the real index. It can be seen that the adaptive selection mode improves the accuracy of our performance predictor.

3.4.5. Comparison of Different Operations

A total of twelve optional operations are defined in the complete search task. Different operations on the traffic datasets have different effects. To improve the classification effect, optional operations are continuously screened. At the same time, the inception operation block is introduced to integrate the knowledge of the image recognition field and traffic detection field to obtain better results. Finally, the selected model operation is shown in Table 1. The changes in the hypervolume metric before and after replacement are shown in Figure 8; a larger hypervolume value indicates a better Pareto frontier. After adding the new operation block (Efficient-NAS V2), the NAS model can be closer to the frontier, that is, it can better complete the search task.

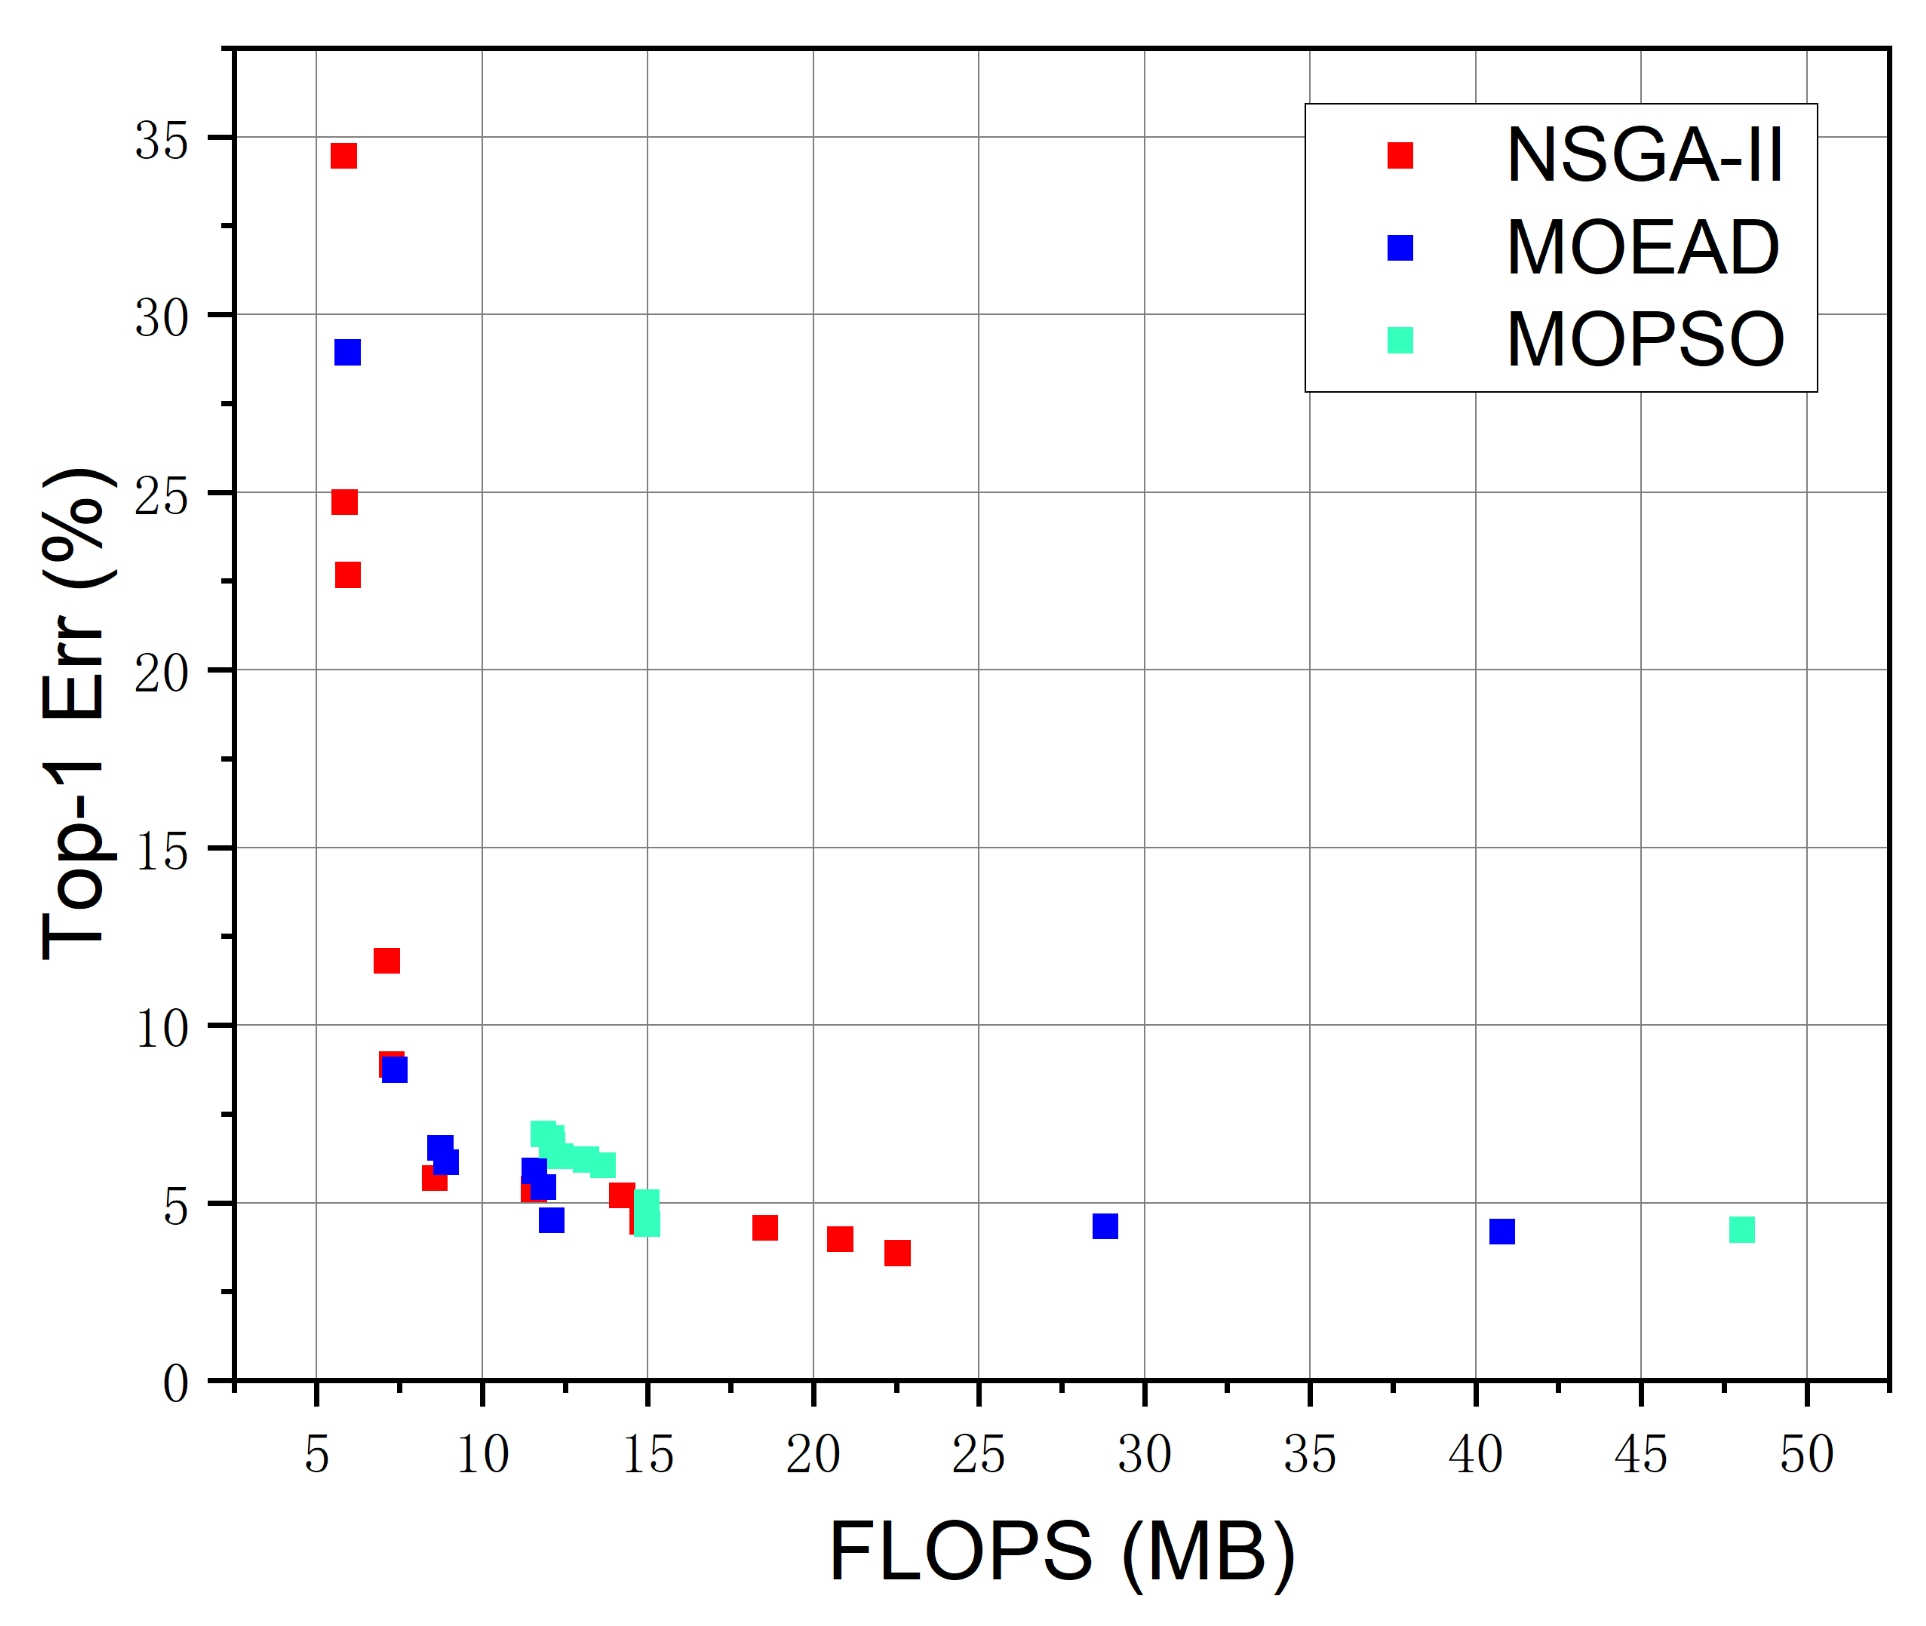
3.4.6. Comparison of Different Search Strategies

In this study, three different multi-objective optimization algorithms are used for the architecture search task. These algorithms are NSGA-II, MOEA/D and MOPSO. After 30 iterations, the architectures generated by different algorithms are obtained, and the scatter diagrams of these architectures are shown in Figure 9. First, before the introduction of the surrogate model, the search results of the NAS model are relatively concentrated, and the diversity is low. After the introduction of the surrogate model, the results of the NSGA-II algorithm are more uniform with respect to the distribution of two optimization indexes (Top-1 error and FLOPs). The MOEA/D algorithm tends to search the architecture with high accuracy, which leads to more concentrated search results. The results of the MOPSO algorithm concentrate on one area, which is poor in terms of diversity and accuracy. This is because in the process of using the MOPSO algorithm to search the network architecture, all particles tend to represent an ideal optimal solution set, and we use a surrogate model to repeat this process, which leads to amplification of the trend (to one point). Based on the scatter plot of the four experimental results, we can preliminarily conclude that the NSGA-II algorithm can approach the Pareto frontier after introduction of the surrogate model.
Comparing the distribution of the Pareto frontier architectures obtained by the three algorithms, as shown in Figure 10, we can see that the search results of NSGA-II and MOEA/D exhibit little difference, but NSGA-II has a more uniform frontier distribution and higher architecture diversity as compared with the MOEA/D algorithm. MOPSO performs the worst because its results are too concentrated.

3.4.7. Experimental Results on Multiple Datasets

To verify the universality of the NAS model, the model with better performance in the search results is applied to different datasets and compared with other networks. The results are shown in Table 10. From the data in the table, we can see that the network model searched by NAS offers good performance in each dataset, which verifies the universality of the model, that is, it can adapt to most traffic datasets.
In addition, we compare the recent research methods in the anomaly detection direction in Table 11. From the comparison results, we can see that our model has a great improvement in performance indicators on different datasets, which proves the effectiveness of the NAS model.

4. Conclusions

In this paper, we propose a network architecture search algorithm in the field of network traffic combined with a surrogate model to solve the problem of network traffic domain model architecture design. First, compared with the general manually designed network architecture, the network architecture we search has better classification accuracy and enables lightweight models. Second, we introduce a surrogate model into the network architecture search task to predict the performance of candidate architectures, which improves the efficiency of the architecture search and alleviates the problems of the requirement of large computing resources and substantial time consumption of the network search algorithm to a certain extent. For the application of the surrogate model, we design corresponding training strategies according to NSGA-II, MOEA/D and MOPSO and train a online surrogate model before each iteration. This reduces the number of samples required for training the surrogate model, and the prediction performance of our surrogate model will increase as the architecture search task continues. Third, the feasibility of the neural network architecture search model with an agent model in the field of traffic detection is verified by setting up contrast experiments. For some optional operations in the architecture search task, we introduce the image domain-related operation block (Inception operation block) on the original basis to obtain a set of operation sets suitable for the network traffic datasets so that the search network architecture has better performance. Finally, the universality of the network model obtained by the architecture search is verified by the classification task for other traffic datasets.
In future work, we will perform further research focused on the following aspects: (1) adjustment of the architecture search space optional operations to further improve the classification effect; (2) optimization of the search strategy to improve the diversity of the search results; (3) expansion of the number of targets that can be optimized (not just in terms of model classification accuracy and FLOPs) and improvement of the evaluation means of the architecture search effect.

Author Contributions

Methodology, Y.Z.; Resources, L.J.; writing—original draft preparation, R.L.; writing—review and editing, R.L., M.H. and X.W. All authors have read and agreed to the published version of the manuscript.

Funding

This work was supported by the National Natural Science Foundation of China (Grant No. 62071056) and the action plan project of Beijing University of Posts and Telecommunications (No. 2020XD-A03-1).

Data Availability Statement

The datasets used in this paper are available at https://www.unb.ca/cic/datasets/ and https://github.com/yungshenglu/USTC-TK2016/ (accessed on 8 August 2021), and they are also available from the corresponding author upon request.

Conflicts of Interest

The authors declare no conflict of interest.

References

  1. Dong, Y.-N.; Liang, G.-S. Research and Discussion on Image Recognition and Classification Algorithm Based on Deep Learning. In Proceedings of the 2019 International Conference on Machine Learning, Big Data and Business Intelligence (MLBDBI), Taiyuan, China, 8–10 November 2019; pp. 274–278. [Google Scholar]
  2. Wang, P. Research and Design of Smart Home Speech Recognition System Based on Deep Learning. In Proceedings of the 2020 International Conference on Computer Vision, Image and Deep Learning (CVIDL), Chongqing, China, 10–12 July 2020; pp. 218–221. [Google Scholar]
  3. Goularas, D.; Kamis, S. Evaluation of Deep Learning Techniques in Sentiment Analysis from Twitter Data. In Proceedings of the 2019 International Conference on Deep Learning and Machine Learning in Emerging Applications (Deep-ML), Istanbul, Turkey, 26–28 August 2019; pp. 12–17. [Google Scholar]
  4. Xin, M.; Wang, Y. Research on Feature Selection of Intrusion Detection Based on Deep Learning. In Proceedings of the 2020 International Wireless Communications and Mobile Computing (IWCMC), Limassol, Cyprus, 15–19 June 2020; pp. 1431–1434. [Google Scholar]
  5. Wang, X.; Chen, S.; Su, J. App-Net: A Hybrid Neural Network for Encrypted Mobile Traffic Classification. In Proceedings of the IEEE INFOCOM 2020—IEEE Conference on Computer Communications Workshops (INFOCOM WKSHPS), Toronto, ON, Canada, 6–9 July 2020; pp. 424–429. [Google Scholar]
  6. Zeng, Y.; Gu, H.; Wei, W.; Guo, Y. Deep-Full-Range: A Deep Learning Based Network Encrypted Traffic Classification and Intrusion Detection Framework. IEEE Access 2019, 7, 45182–45190. [Google Scholar] [CrossRef]
  7. Krizhevsky, A.; Sutskever, I.; Hinton, G. ImageNet Classification with Deep Convolutional Neural Networks. In Advances in Neural Information Processing Systems; Curran Associates Inc.: Red Hook, NY, USA, 2012. [Google Scholar]
  8. Szegedy, C.; Liu, W.; Jia, Y.; Sermanet, P.; Reed, S.; Anguelov, D.; Erhan, D.; Vanhoucke, V.; Rabinovich, A. Going Deeper with Convolutions. In Proceedings of the 2015 IEEE Conference on Computer Vision and Pattern Recognition (CVPR), Boston, MA, USA, 7–12 June 2015. [Google Scholar]
  9. Howard, A.G.; Zhu, M.; Chen, B.; Kalenichenko, D.; Wang, W.; Weyand, T.; Andreetto, M.; Adam, H. MobileNets: Efficient Convolutional Neural Networks for Mobile Vision Applications. arXiv 2017, arXiv:1704.04861. [Google Scholar]
  10. You, J. A Genetic Algorithm-based AutoML Approach for Large-scale Traffic Speed Prediction. In Proceedings of the 2020 IEEE 5th International Conference on Intelligent Transportation Engineering (ICITE), Beijing, China, 11–13 September 2020; pp. 111–116. [Google Scholar]
  11. Dyrmishi, S.; Elshawi, R.; Sakr, S. A Decision Support Framework for AutoML Systems: A Meta-Learning Approach. In Proceedings of the 2019 International Conference on Data Mining Workshops (ICDMW), Beijing, China, 8–11 November 2019; pp. 97–106. [Google Scholar]
  12. Nagarajah, T.; Poravi, G. A Review on Automated Machine Learning (AutoML) Systems. In Proceedings of the 2019 IEEE 5th International Conference for Convergence in Technology (I2CT), Bombay, India, 29–31 March 2019; pp. 1–6. [Google Scholar]
  13. Deb, K.; Pratap, A.; Agarwal, S.; Meyarivan, T.A.M.T. A fast and elitist multiobjective genetic algorithm: NSGA-II. IEEE Trans. Evol. Comput. 2002, 6, 182–197. [Google Scholar] [CrossRef] [Green Version]
  14. Pham, H.; Guan, M.; Zoph, B.; Le, Q.; Dean, J. Efficient Neural Architecture Search via Parameter Sharing. In Proceedings of the International Conference on Machine Learning, Stockholm, Sweden, 10–15 July 2018. [Google Scholar]
  15. Chen, Z.; Li, B. Efficient Evolution for Neural Architecture Search. In Proceedings of the 2020 International Joint Conference on Neural Networks (IJCNN), Glasgow, UK, 19–24 July 2020; pp. 1–7. [Google Scholar]
  16. Liu, C.; Zoph, B.; Neumann, M.; Shlens, J.; Hua, W.; Li, L.; Li, F.; Yuille, A.; Huang, J.; Murphy, K. Progressive Neural Architecture Search. In Proceedings of the European Conference on Computer Vision, Munich, Germany, 8–14 September 2018. [Google Scholar]
  17. Lu, Z.; Deb, K.; Goodman, E.; Banzhaf, W.; Boddeti, V.N. NSGANetV2: Evolutionary Multi-Objective Surrogate-Assisted Neural Architecture Search. In Proceedings of the European Conference on Computer Vision, Glasgow, UK, 23–28 August 2020. [Google Scholar]
  18. Anish, H.A.; Sundarakantham, K. Machine Learning Based Intrusion Detection System. In Proceedings of the 2019 3rd International Conference on Trends in Electronics and Informatics (ICOEI), Tirunelveli, India, 23–25 April 2019. [Google Scholar]
  19. Chen, L.; Gao, S.; Liu, B.; Lu, Z.; Jiang, Z. FEW-NNN: A fuzzy entropy weighted natural nearest neighbor method for flow-based network traffic attack detection. China Commun. 2020, 17, 151–167. [Google Scholar] [CrossRef]
  20. Waskle, S.; Parashar, L.; Singh, U. Intrusion Detection System Using PCA with Random Forest Approach. In Proceedings of the 2020 International Conference on Electronics and Sustainable Communication Systems (ICESC), Coimbatore, India, 2–4 July 2020. [Google Scholar]
  21. Liu, J.; Chung, S.S. Automatic Feature Extraction and Selection For Machine Learning Based Intrusion Detection. In Proceedings of the 2019 IEEE SmartWorld, Ubiquitous Intelligence & Computing, Advanced & Trusted Computing, Scalable Computing & Communications, Cloud & Big Data Computing, Internet of People and Smart City Innovation (SmartWorld/SCALCOM/UIC/ATC/CBDCom/IOP/SCI), Leicester, UK, 19–23 August 2019; pp. 1400–1405. [Google Scholar]
  22. He, M.; Wang, X.; Zhou, J.; Xi, Y.; Jin, L.; Wang, X. Deep-Feature-Based Autoencoder Network for Few-Shot Malicious Traffic Detection. Secur. Commun. Netw. 2021, 2021, 6659022. [Google Scholar] [CrossRef]
  23. Zhang, F.; Shang, T.; Liu, J. Imbalanced Encrypted Traffic Classification Scheme Using Random Forest. In Proceedings of the 2020 International Conferences on Internet of Things (iThings) and IEEE Green Computing and Communications (GreenCom) and IEEE Cyber, Physical and Social Computing (CPSCom) and IEEE Smart Data (SmartData) and IEEE Congress on Cybermatics (Cybermatics), Rhodes, Greece, 2–6 November 2020; pp. 837–842. [Google Scholar]
  24. Wahab, O.A.; Bentahar, J.; Otrok, H.; Mourad, A. Resource-Aware Detection and Defense System against Multi-Type Attacks in the Cloud: Repeated Bayesian Stackelberg Game. IEEE Trans. Dependable Secur. Comput. 2021, 18, 605–622. [Google Scholar] [CrossRef]
  25. Wahab, O.A.; Bentahar, J.; Otrok, H.; Mourad, A. How to Distribute the Detection Load among Virtual Machines to Maximize the Detection of Distributed Attacks in the Cloud. In Proceedings of the 2016 IEEE International Conference on Services Computing (SCC), San Francisco, CA, USA, 27 June–2 July 2016; pp. 316–323. [Google Scholar]
  26. Mehmood, T.; Rais, H.B.M. Machine learning algorithms in context of intrusion detection. In Proceedings of the 2016 3rd International Conference on Computer and Information Sciences (ICCOINS), Kuala Lumpur, Malaysia, 15–17 August 2016; pp. 369–373. [Google Scholar]
  27. Gao, X.; Shan, C.; Hu, C.; Niu, Z.; Liu, Z. An Adaptive Ensemble Machine Learning Model for Intrusion Detection. IEEE Access 2019, 7, 82512–82521. [Google Scholar] [CrossRef]
  28. Cavusoglu, U. A new hybrid approach for intrusion detection using machine learning methods. Appl. Intell. 2019, 49, 2735–2761. [Google Scholar] [CrossRef]
  29. Shaaban, A.R.; Abd-Elwanis, E.; Hussein, M. DDoS attack detection and classification via Convolutional Neural Network (CNN). In Proceedings of the 2019 Ninth International Conference on Intelligent Computing and Information Systems (ICICIS), Cairo, Egypt, 8–10 December 2019; pp. 233–238. [Google Scholar]
  30. Park, S.H.; Park, H.J.; Choi, Y. RNN-based Prediction for Network Intrusion Detection. In Proceedings of the 2020 International Conference on Artificial Intelligence in Information and Communication (ICAIIC), Fukuoka, Japan, 19–21 February 2020; pp. 572–574. [Google Scholar]
  31. He, M.; Jin, L.; Wang, X.; Li, Y. Web log classification framework with data augmentation based on GANs. J. China Univ. Posts Telecommun. 2020, 27, 34–46. [Google Scholar]
  32. Zhong, W.; Yu, N.; Ai, C. Applying big data based deep learning system to intrusion detection. Big Data Min. Anal. 2020, 3, 181–195. [Google Scholar] [CrossRef]
  33. Chen, M.; Wang, X.; He, M.; Jin, L.; Javeed, K.; Wang, X. A Network Traffic Classification Model Based on Metric Learning. Comput. Mater. Contin. 2020, 64, 941–959. [Google Scholar]
  34. Lim, H.; Kim, J.; Heo, J.; Kim, K.; Hong, Y.; Han, Y. Packet-based Network Traffic Classification Using Deep Learning. In Proceedings of the 2019 International Conference on Artificial Intelligence in Information and Communication (ICAIIC), Okinawa, Japan, 11–13 February 2019; pp. 46–51. [Google Scholar]
  35. Saleh, I.; Hao, J. Network Traffic Images: A Deep Learning Approach to the Challenge of Internet Traffic Classification. In Proceedings of the 2020 10th Annual Computing and Communication Workshop and Conference (CCWC), Las Vegas, NV, USA, 6–8 January 2020. [Google Scholar]
  36. Zhong, Z.; Yan, J.; Wu, W.; Shao, J.; Liu, C. Practical Block-Wise Neural Network Architecture Generation. In Proceedings of the 2018 IEEE/CVF Conference on Computer Vision and Pattern Recognition, Salt Lake City, UT, USA, 18–23 June 2018; pp. 2423–2432. [Google Scholar]
  37. He, K.; Zhang, X.; Ren, S.; Sun, J. Deep Residual Learning for Image Recognition. In Proceedings of the IEEE Conference on Computer Vision and Pattern Recognition, Las Vegas, NV, USA, 27–30 June 2016. [Google Scholar]
  38. Szegedy, C.; Ioffe, S.; Vanhoucke, V.; Alemi, A.A. Inception-v4, Inception-ResNet and the Impact of Residual Connections on Learning. In Proceedings of the Thirty-First AAAI Conference on Artificial Intelligence, San Francisco, CA, USA, 4–9 February 2017. [Google Scholar]
  39. Zoph, B.; Le, Q.V. Neural Architecture Search with Reinforcement Learning. Science of the Total Environment. arXiv 2016, arXiv:1611.01578. [Google Scholar]
  40. Lu, Z.; Whalen, I.; Dhebar, Y.; Deb, K.; Goodman, E.D.; Banzhaf, W.; Boddeti, V.N. Multi-Objective Evolutionary Design of Deep Convolutional Neural Networks for Image Classification. IEEE Trans. Evol. Comput. 2020, 25, 277–291. [Google Scholar] [CrossRef]
  41. Liu, H.; Simonyan, K.; Yang, Y. Darts: Differentiable architecture search. arXiv 2018, arXiv:1806.09055. [Google Scholar]
  42. Zhang, C.; Liu, X.; Wang, G.; Cai, Z. Particle Swarm Optimization Based Deep Learning Architecture Search for Hyperspectral Image Classification. In Proceedings of the IGARSS 2020—2020 IEEE International Geoscience and Remote Sensing Symposium, Waikoloa, HI, USA, 26 September–2 October 2020; pp. 509–512. [Google Scholar]
  43. Hu, K.; Tian, S.; Guo, S.; Li, N.; Luo, L.; Wang, L. Recurrent Neural Architecture Search based on Randomness-Enhanced Tabu Algorithm. In Proceedings of the 2020 International Joint Conference on Neural Networks (IJCNN), Glasgow, UK, 19–24 July 2020; pp. 1–8. [Google Scholar]
  44. Sun, Y.; Wang, H.; Xue, B.; Jin, Y.; Yen, G.G.; Zhang, M. Surrogate-Assisted Evolutionary Deep Learning Using an End-to-End Random Forest-Based Performance Predictor. IEEE Trans. Evol. Comput. 2019, 24, 350–364. [Google Scholar] [CrossRef]
  45. Dai, X.; Zhang, P.; Wu, B.; Yin, H.; Sun, F.; Wang, Y.; Dukhan, M.; Hu, Y.; Wu, Y.; Jia, Y.; et al. ChamNet: Towards Efficient Network Design Through Platform-Aware Model Adaptation. In Proceedings of the 2019 IEEE/CVF Conference on Computer Vision and Pattern Recognition (CVPR), Long Beach, CA, USA, 15–20 June 2019. [Google Scholar]
  46. USTC-TK2016. Available online: https://github.com/yungshenglu/USTC-TK2016/ (accessed on 8 August 2021).
  47. Varghese, J.E.; Muniyal, B. An Efficient IDS Framework for DDoS Attacks in SDN Environment. IEEE Access 2021, 9, 69680–69699. [Google Scholar] [CrossRef]
  48. Le, T.T.H.; Kim, Y.; Kim, H. Network intrusion detection based on novel feature selection model and various recurrent neural networks. Appl. Sci. 2019, 9, 1392. [Google Scholar] [CrossRef] [Green Version]
  49. Siddiqi, M.A.; Pak, W. Optimizing Filter-Based Feature Selection Method Flow for Intrusion Detection System. Electronics 2020, 9, 2114. [Google Scholar] [CrossRef]
  50. Scaranti, G.F.; Carvalho, L.F.; Barbon, S.; Proenca, M.L. Artificial immune systems and fuzzy logic to detect flooding attacks in software-defined networks. IEEE Access 2020, 8, 100172–100184. [Google Scholar] [CrossRef]
  51. Shurman, M.; Khrais, R.; Yateem, A. DoS and DDoS attack detection using deep learning and IDS. Int. Arab J. Inf. Technol. 2020, 17, 655–661. [Google Scholar]
  52. Babić, I.; Miljković, A.; Čabarkapa, M.; Nikolić, V.; Đorđević, A.; Ranđelović, M.; Ranđelović, D. Triple Modular Redundancy Optimization for Threshold Determination in Intrusion Detection Systems. Symmetry 2021, 13, 557. [Google Scholar] [CrossRef]
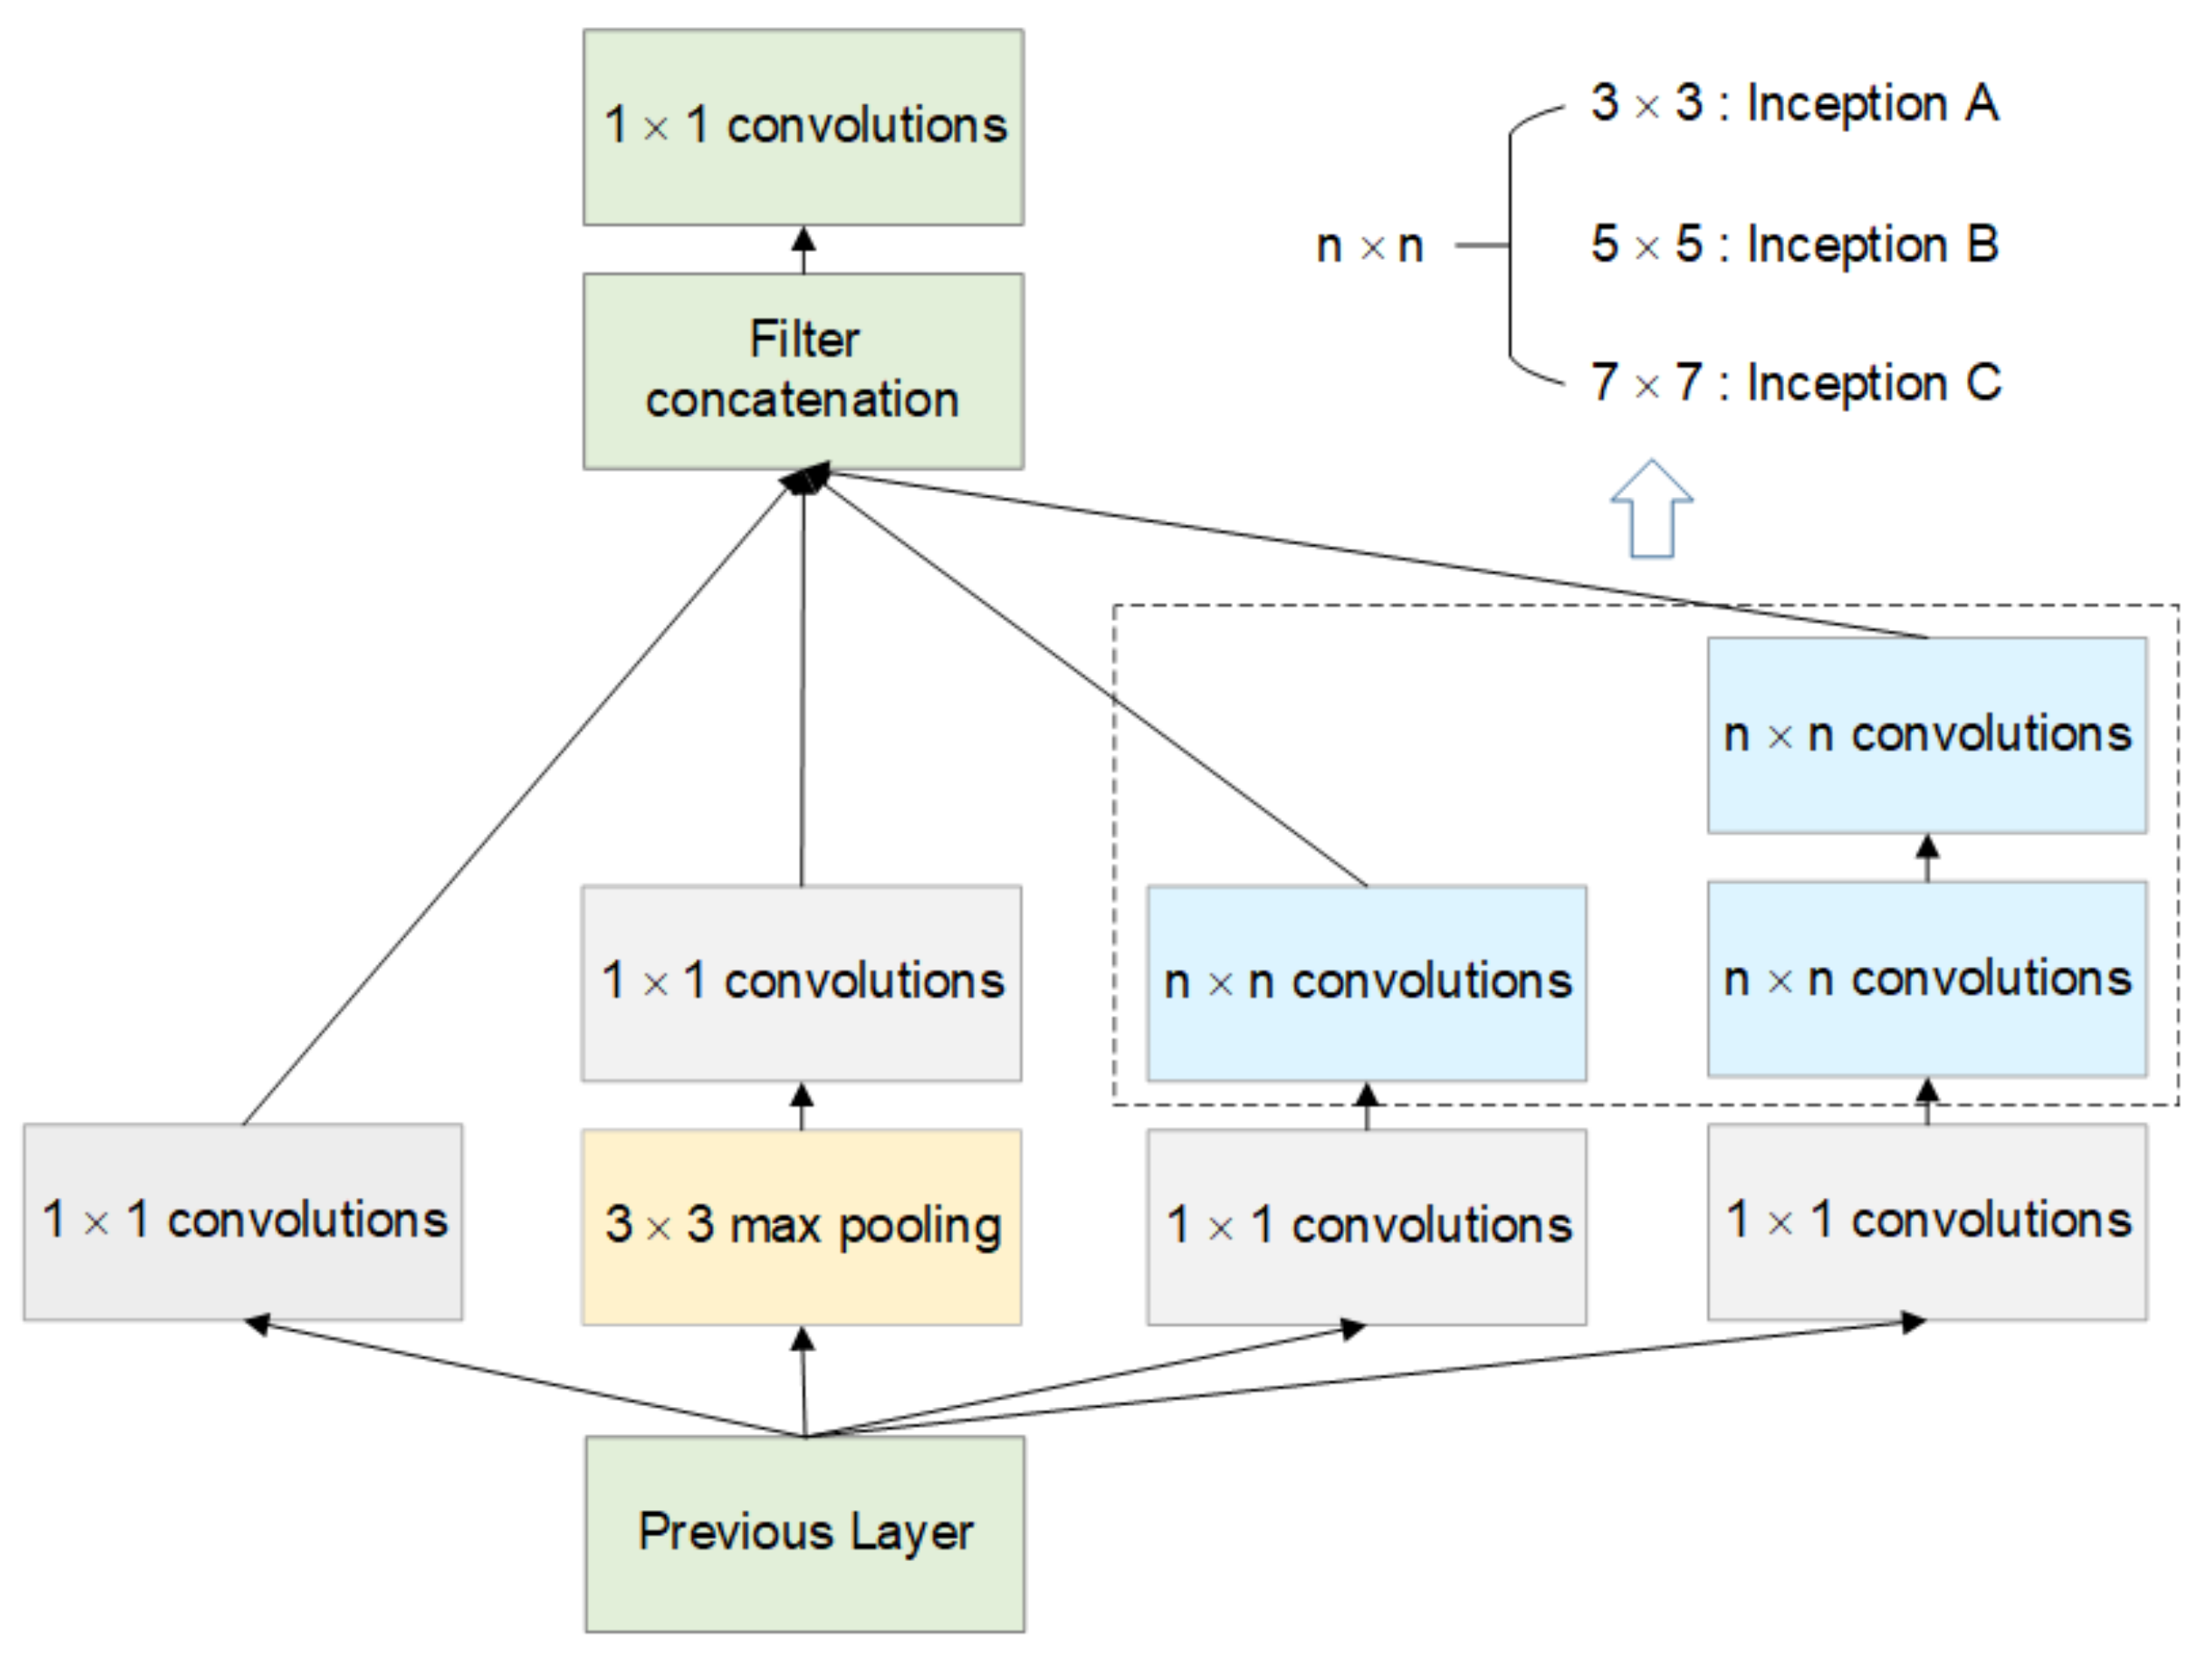
Figure 1. Network coding process. The code (1122334053) contains operations and connections.
Symmetry 13 01453 g001
Figure 2. Structural diagram of Inception operation blocks. The n values of Inception A, Inception B and Inception C in the figure are 3, 5 and 7, respectively.
Symmetry 13 01453 g002
Figure 3. Efficient-NAS structure. The whole model is divided into two layers: the outer layer is composed of Steps 1–5, which are used to maintain the evaluated architecture set. Step 3 is also used as an inner layer network to iterate with the assistance of the surrogate model.
Symmetry 13 01453 g003
Figure 4. Data processing scheme. In the process of data processing, combined with the integration tool USTC-TK2016 and Python, the traffic data are processed into suitable model training sample data.
Symmetry 13 01453 g004
Figure 5. Comparison of hypervolume metrics. The curve in the figure represents the average hypervolume value of the three experiments, and the grey area represents the range of experimental results.
Symmetry 13 01453 g005
Figure 6. Search task optimal dissolution point graph.
Symmetry 13 01453 g006
Figure 7. Surrogate model performance comparison. Differently colored points or curves represent different surrogate models.
Symmetry 13 01453 g007
Figure 8. The hypervolume value change curve before and after the introduction of a new operation block. The curve in the figure represents the average hypervolume value of the three experiments.
Symmetry 13 01453 g008
Figure 9. The architecture scatter diagram obtained from Original-NAS and Efficient-NAS (NSGA-II, MOEA/D and MOPSO).
Symmetry 13 01453 g009
Figure 10. The distribution of the Pareto frontier architecture from NSGA-II, MOEA/D and MOPSO.
Symmetry 13 01453 g010
Table 1. Optional operations in the search space.
skip connect3 × 3 dilated convolution
3 × 3 max pooling5 × 5 dilated convolution
3 × 3 avg pooling1 × 7 then 7 × 1 convolution
3 × 3 depthwise separable convolutionInception A
5 × 5 depthwise separable convolutionInception B
7 × 7 depthwise separable convolutionInception C
Table 2. Data distribution of dataset CIC-DoS2017.
Flow TypesNumberPercentage (%)
Ddossim84802.79
Goldeneye89,81429.51
Hulk60,60119.91
Slowbody (rudy)21,2616.99
Slowbody (Slowhttptest)36,76212.08
Slowheaders (Slowhttptest)45,84815.07
Slowheaders (Slowloris)21,0996.93
Slowread20,4526.72
Table 3. Data distribution of dataset ISCXIDS2012.
Flow TypesNumberPercentage (%)
Benign1,433,29394.4165
Brute Force SSH14,0560.9259
DDoS45,0162.9654
HttpDoS65330.4304
Infiltrating Transfer19,1561.2619
Table 4. Data distribution of dataset CIC-DDoS2019.
Flow TypesNumberPercentage (%)
PortMap23110.9345
NetBIOS60,00024.2622
LDAP60,00024.2622
MSSQL22680.9171
UDP60,00024.2622
UDP-Lag60,00024.2622
SYN27191.0995
Table 5. NAS parameter setting (partial).
Parameter TypesParameter NamesInstructionsValues
Model structuren_cellsNumber of cells to search1
n_blocksNumber of blocks in a cell5
n_nodesNumber of nodes per phases4
Outer layer search strategyn_iterationsNumber of iterations to run search30
n_doeNumber of architectures to train before fitting the surrogate model100
n_iterNumber of architectures to train in each iteration8
Inner layer search strategy
(NSGA-II)
pop_sizePopulation size of networks40
n_gensNumber of population iterations30
n_offspringNumber of offspring created per generation40
Inner layer search strategy
(MOEA/D)
n_partitionsNumber of weights (equal to number of population)100
n_gensNumber of population iterations30
n_neighborsNumber of neighboring reference lines to be used for selection20
prob_neighbor _matingProbability of selecting the parents in the neighborhood0.7
Inner layer search strategy
(MOPSO)
particlesNumber of particles30
cycle_Number of iterations30
wInertial factor1
c1Local velocity factor2
c2Global velocity factor2
mesh_divThe number of equal meshes10
Table 6. Model training parameter setting (partial).
Parameter NamesValues
learning_rate0.025
momentum0.9
batch_size128
epochs15
Table 7. Comparison of model effects.
ModelF1 ScoreParms (MB)Flops (MB)
LeNet0.8897490.0442560.2860
CNN0.9522050.1176720.0968
ResNet0.98175211.171784456.76
VGG0.97846120.038344398.29
NAS-Net0.9956810.05404814.9763
Table 8. Comparison before and after adding surrogate models.
ModelF1 ScoreN_arch a AvgSpeedup
Original-NAS b 0.95836014031.722×
0.9576246
0.9609362
Efficient-NAS c 0.9641299234
0.9660158
0.9632246
a Represents the number of architectures whose parameters are optimized by SGD-based weight optimization. b NAS without surrogate model. c Introduces the surrogate model of NAS.
Table 9. Correlation coefficient comparison among surrogate models.
Surrogate ModelTau
GP0.4735
CART0.7449
MLP0.6737
AS0.7454
Table 10. Comparison of models with different datasets (F1 score). The bold font NAS-Net is the experiments of proposed model.
ModelCIC-DoS2017ISCXIDS2012CIC-DDoS2019
LeNet0.8897490.9847270.945900
CNN0.9522050.9893450.993975
ResNet0.9817520.9897750.995437
VGG0.9784610.9897790.995762
NAS-Net0.9956810.9897810.995766
Table 11. Experiment results and comparison of different datasets.
DatasetsMethodsPrecRecallAccF1-Score
CIC-DoS2017Varghese and Muniyal [47]--0.8833-
Proposed work0.99420.99440.99570.9957
ISCXIDS2012Le et al. [48]0.94750.975-0.9708
Siddiqi and Pak [49]0.92860.93510.95200.9317
Proposed work0.98910.98990.98980.9898
CIC-DDoS2019Scaranti et al. [50]0.8903-0.8865-
Shurman et al. [51]--0.9919-
Babić et al. [52]0.97800.84360.90360.9059
Proposed work0.99640.99190.99580.9957
Publisher’s Note: MDPI stays neutral with regard to jurisdictional claims in published maps and institutional affiliations.

