2.1. Introducing a Headgroup Hydration Shell in the Scattering Model for Lipid Bilayers
The SDP model simultaneously accounts for small-angle neutron and the X-ray data (SANS/SAXS) of lipid bilayers thus enabling a unique combination of the different contrasts offered by the two techniques (see, e.g., [
13]). The very backbone of the SDP model is a parsing of the trans-bilayer structure into quasimolecular fragments, based on geometrical considerations [
16] and MD simulations [
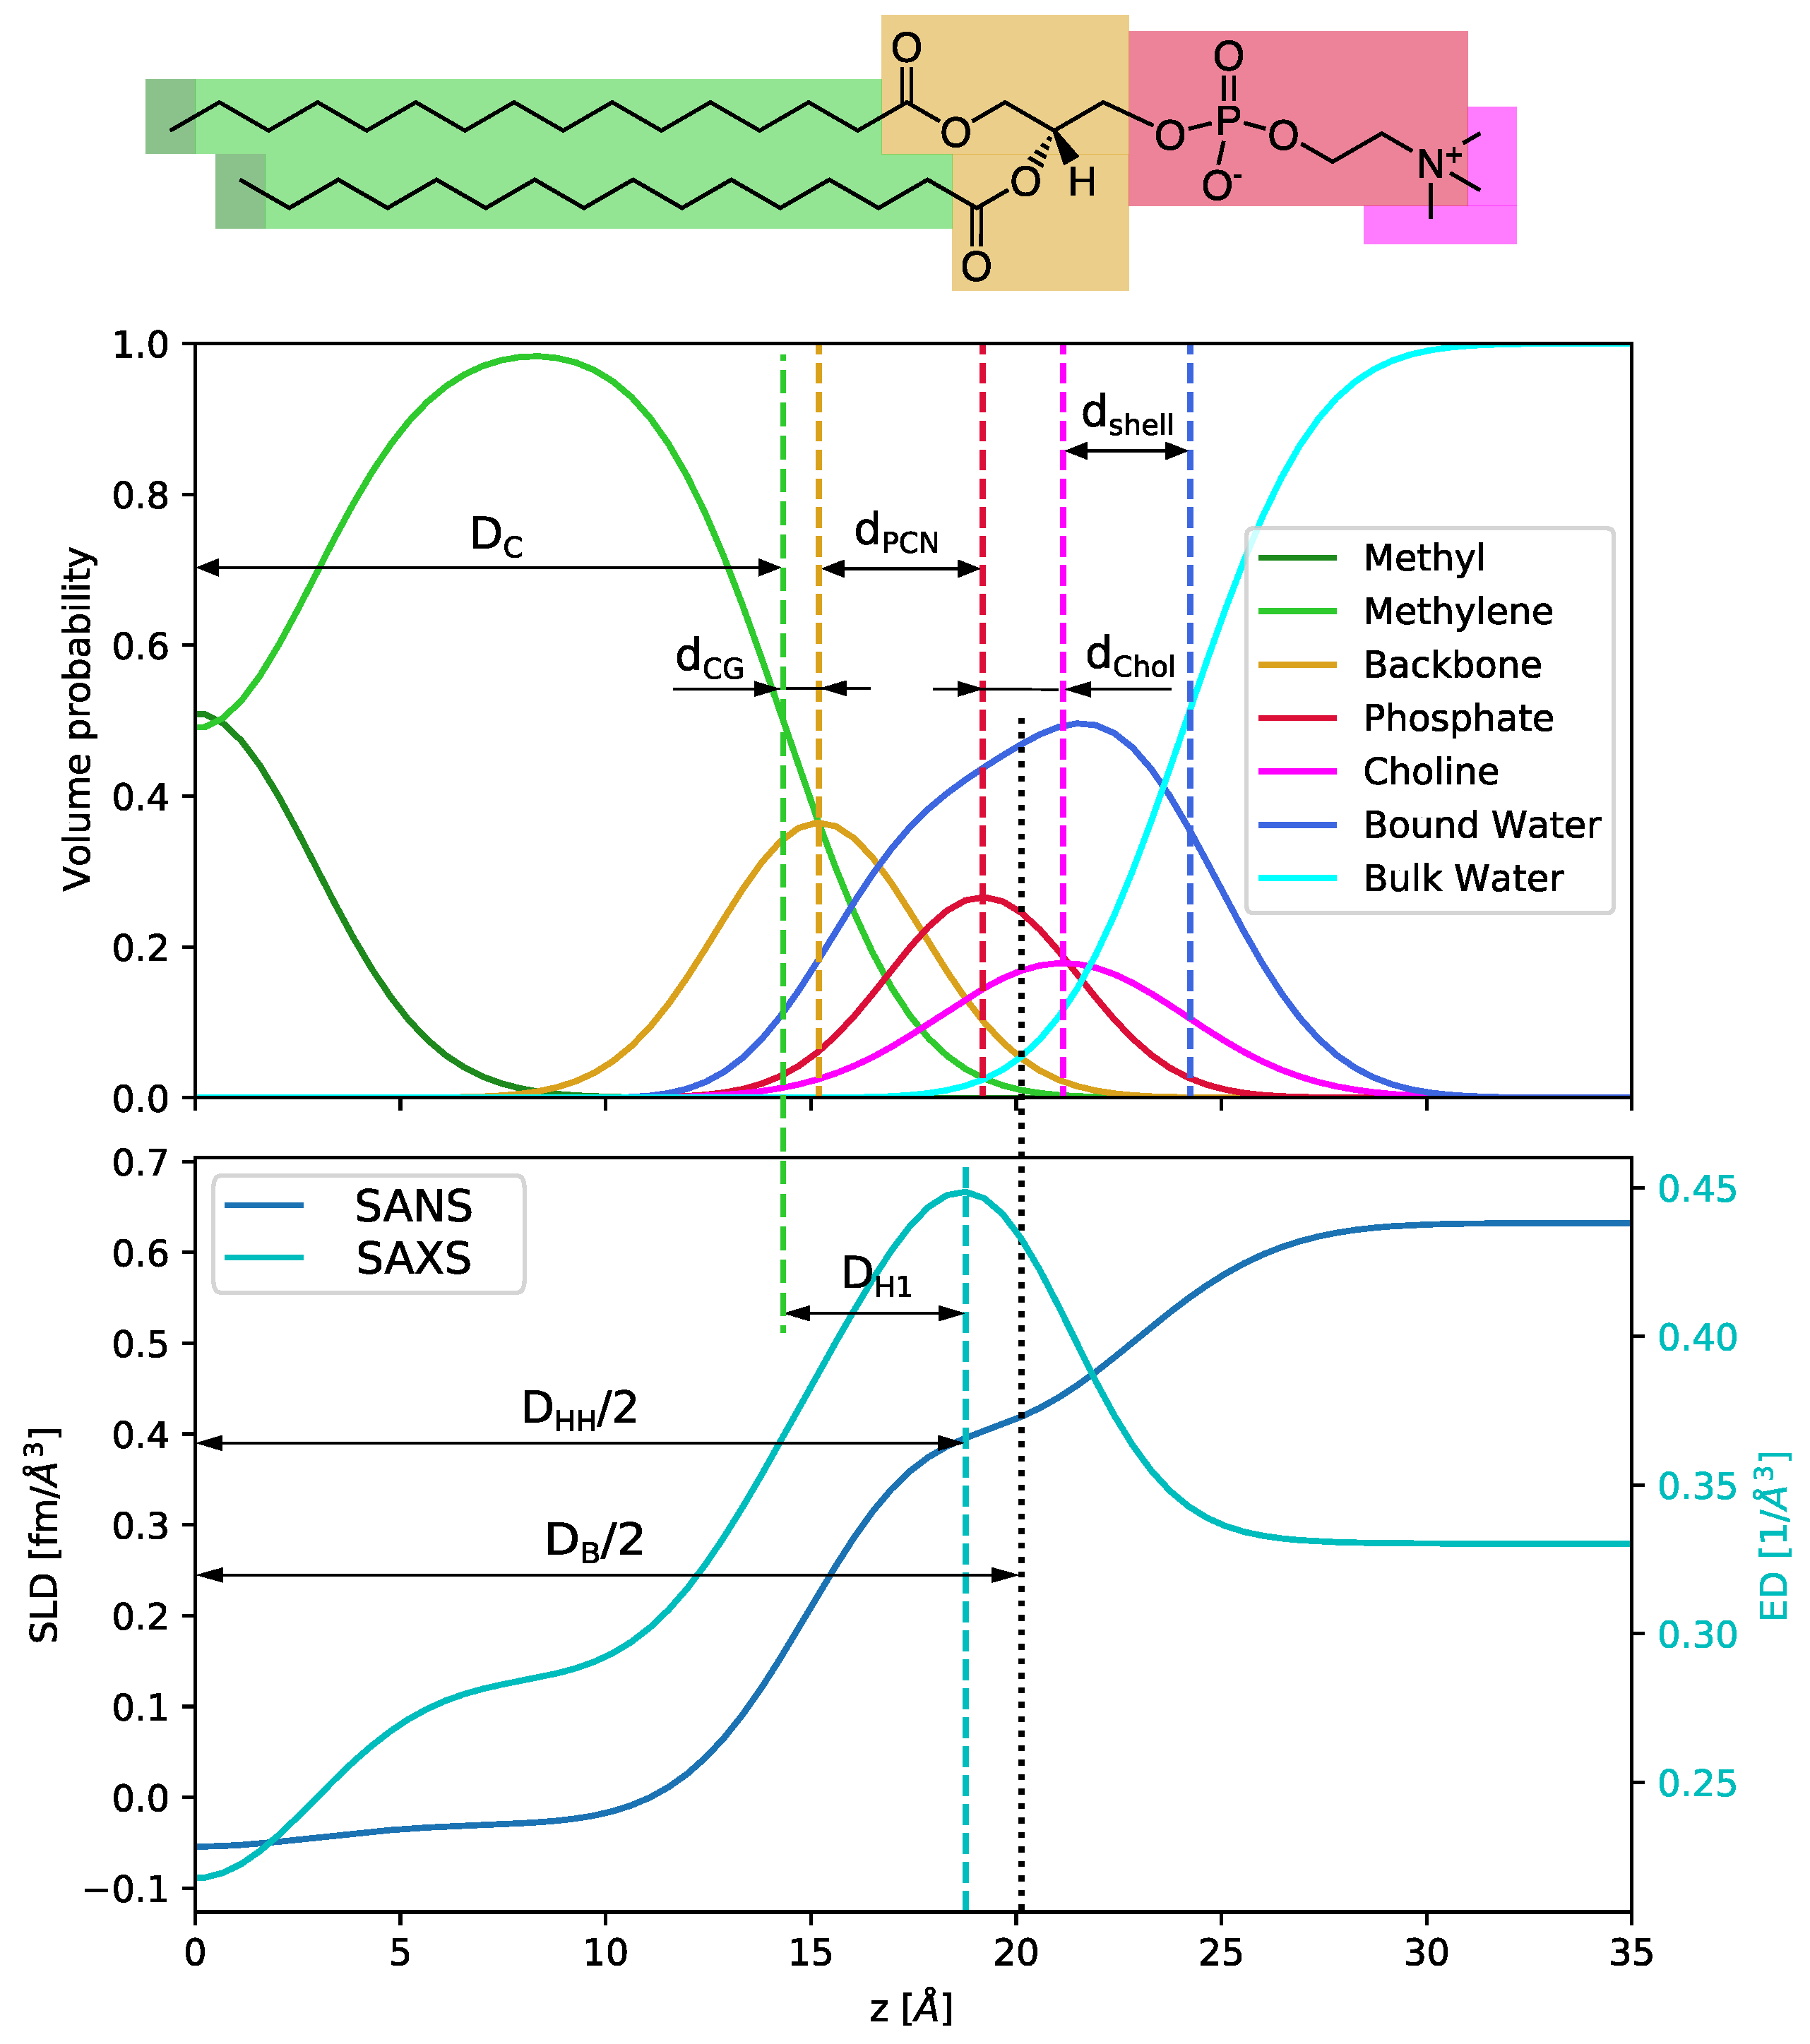
14]. This leads to a representation of the membrane structure in terms of Gaussian-type volume probability distributions (
Figure A1). The SDP technique has been highly successful in reporting the high-resolution membrane structures of numerous glycero- and sphingolipids [
3,
17,
18,
19,
20,
21], including also polyunsaturated phosphatidylcholines [
22].
We first implemented the SDP model for a spherical-shell bilayer (i.e., a vesicle) using the separated form factor method [
15], which extended the analysis to previously unconsidered low scattering vectors
q (see
Section 4.3 and
Appendix A) and performed a test on the benchmark-lipid DPPC. Using published parameters [
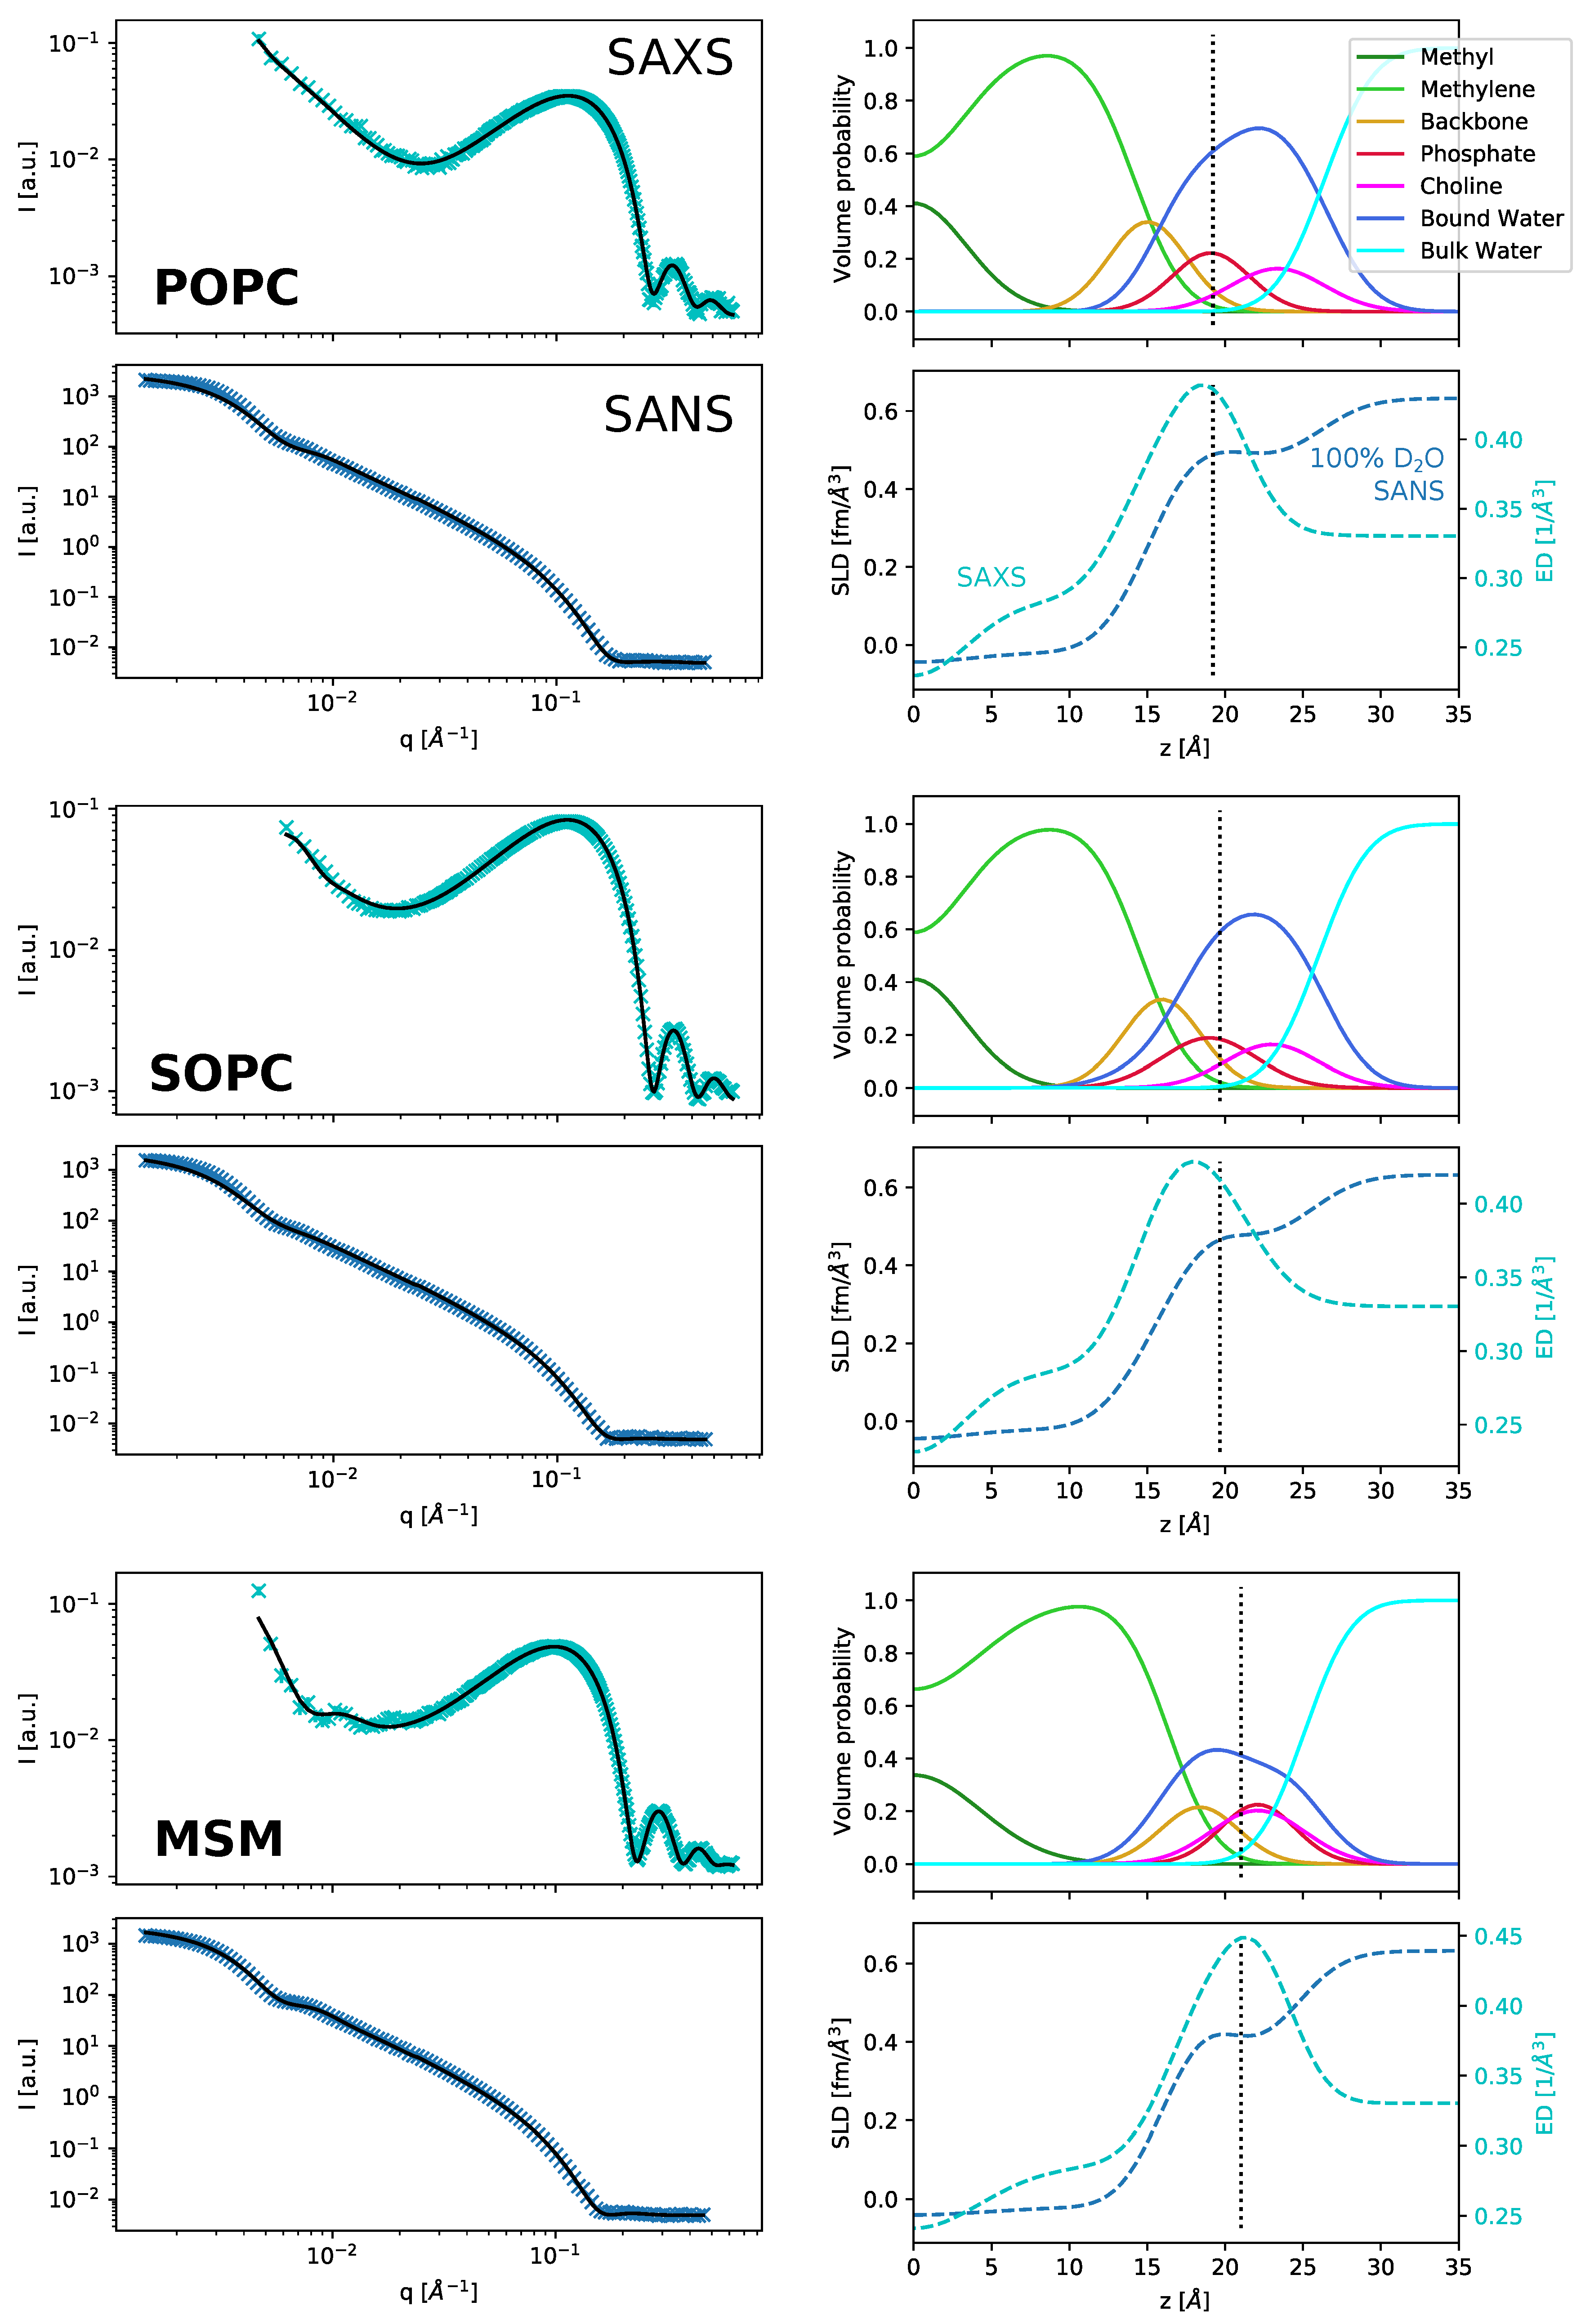
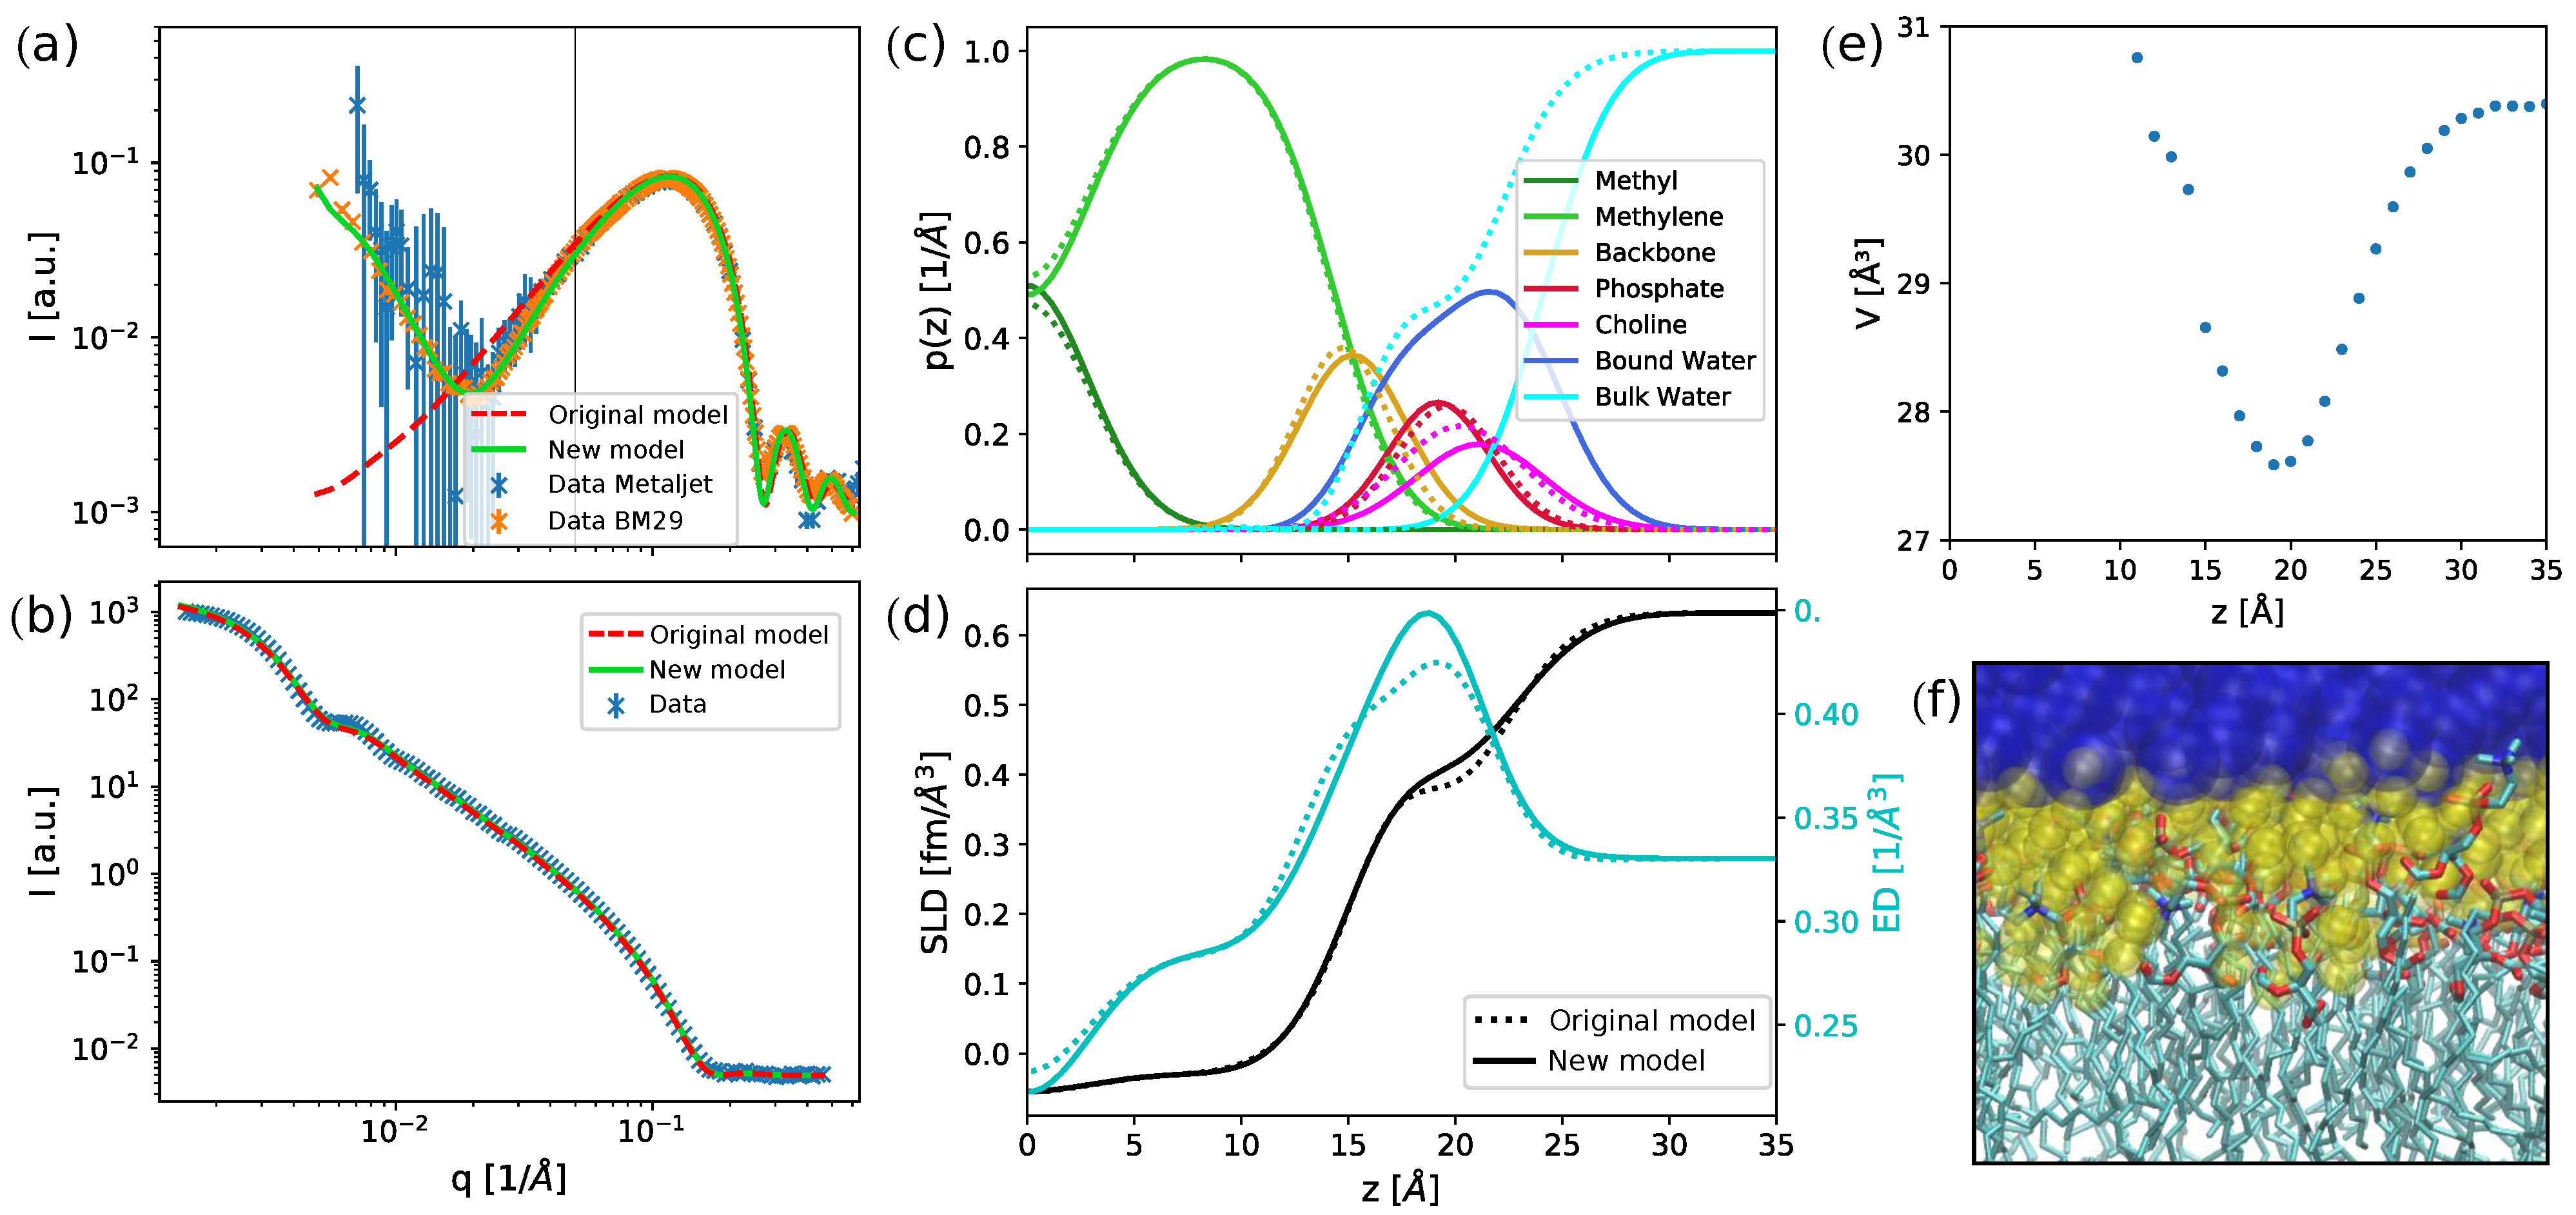
3], the model fits very well to the SANS data herein, but not to the low-
q region in SAXS (
Figure 1a,b). In particular, the SAXS intensity minimum at
Å
−1 is completely missed by the fit, while a good agreement is obtained for
Å
−1, i.e., the
q-range reported previously [
3]. We also measured an independently prepared sample of DPPC using a SAXSpoint laboratory camera. Although these data are intrinsically more noisy, particularly at a low
q, they clearly agree with synchrotron data and demonstrate that the mismatch of the previous data modeling is a salient feature. Fits to this region have, however, been attained by other models, which unlike SDP, do not depend on the specific composition of the lipid bilayer [
23,
24]. This indicates that the solution might be an additional degree of freedom in the scattering length density (SLD) profile. Indeed, we found that increasing the contrast in the headgroup region, e.g., by decreasing the headgroup volume, drastically improves the agreement to low-
q SAXS-data, while having no significant impact on the neutron form factor (data not shown). Note that a similar approach was reported in [
25]. An alternative and physically realistic way to do this is to account for the layer of bound water molecules (
Figure 1c,d). In this model, we assumed that the water molecules surrounding the polar headgroup take up a more ordered structure than in the bulk, leading to a higher density in this region. Hydration shells of this kind are extensively used for SAXS data analysis of protein solutions [
26,
27] and have also been predicted for lipid membranes [
16]. We implemented hydration water using an error function that adds one layer of more dense water to the water accessible groups of the lipid bilayer as detailed in
Section 4.3 and
Appendix A. Our fit estimates the water density in this shell to be 3% higher than in the bulk, which agrees with previous reports on hydration shells for proteins or nucleic acids [
26,
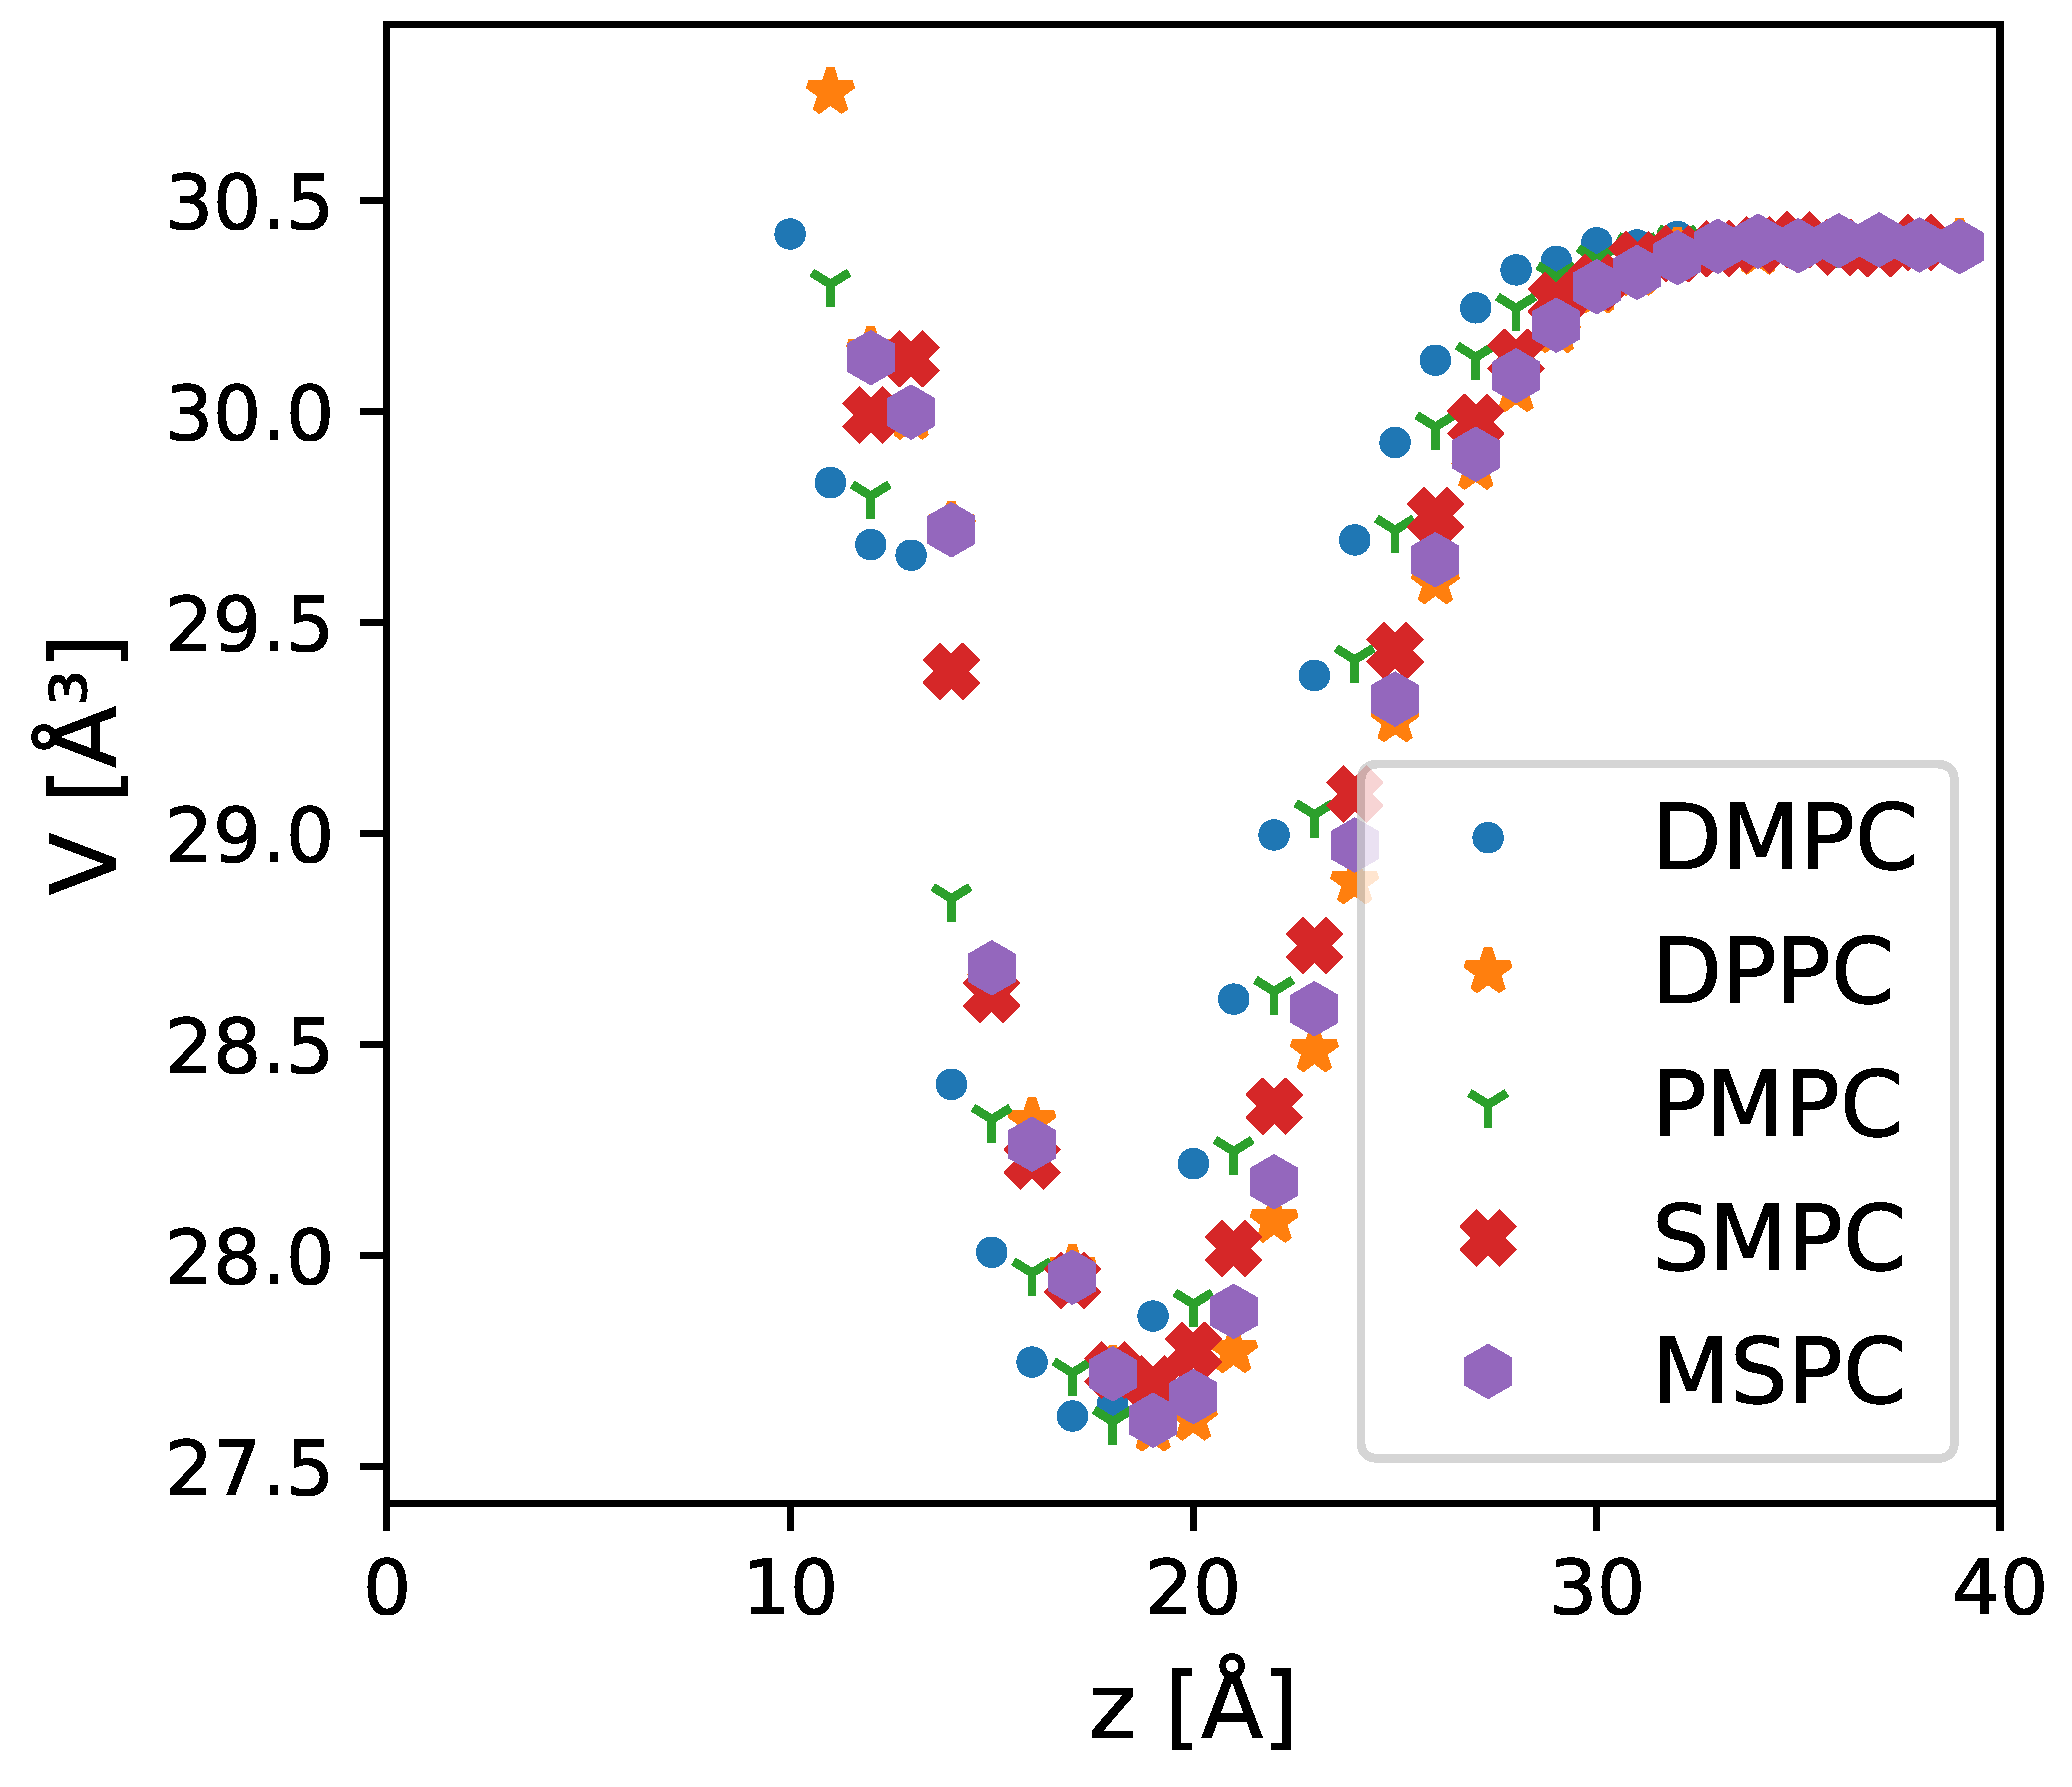
27]. This increased water density between the headgroups can also be found in all-atom MD simulations (
Figure 1e,f and
Figure A5), where the volume of water molecules near the lipid headgroups decreased by up to 10% compared to the bulk value.
In achieving the fits shown in
Figure 1a,b, we also tested for overfitting or parameter correlations. The SDP model relies on a rather high number of adjustable parameters (i.e., 12 to describe the membrane structure) compared to simpler models using slabs [
28] or Gaussian distributions [
29]. The high number of adjustable parameters is mostly due to the limited available information about the volumes and structures of the individual moieties in the lipid, which are hardly experimentally accessible and can only be estimated from scattering studies and simulations [
30]. Previous studies applying the SDP model led to no obvious temperature or composition-dependent trends for several parameters, especially for those describing the headgroup (
,
,
) and the volume fractions (
,
,
,
) [
3,
20]; see
Table A2 and
Table A3 for a list of all SDP parameters.
Parameter correlations were analyzed using a Markov chain Monte Carlo (MCMC) approach as described in
Section 4.3 (see also [
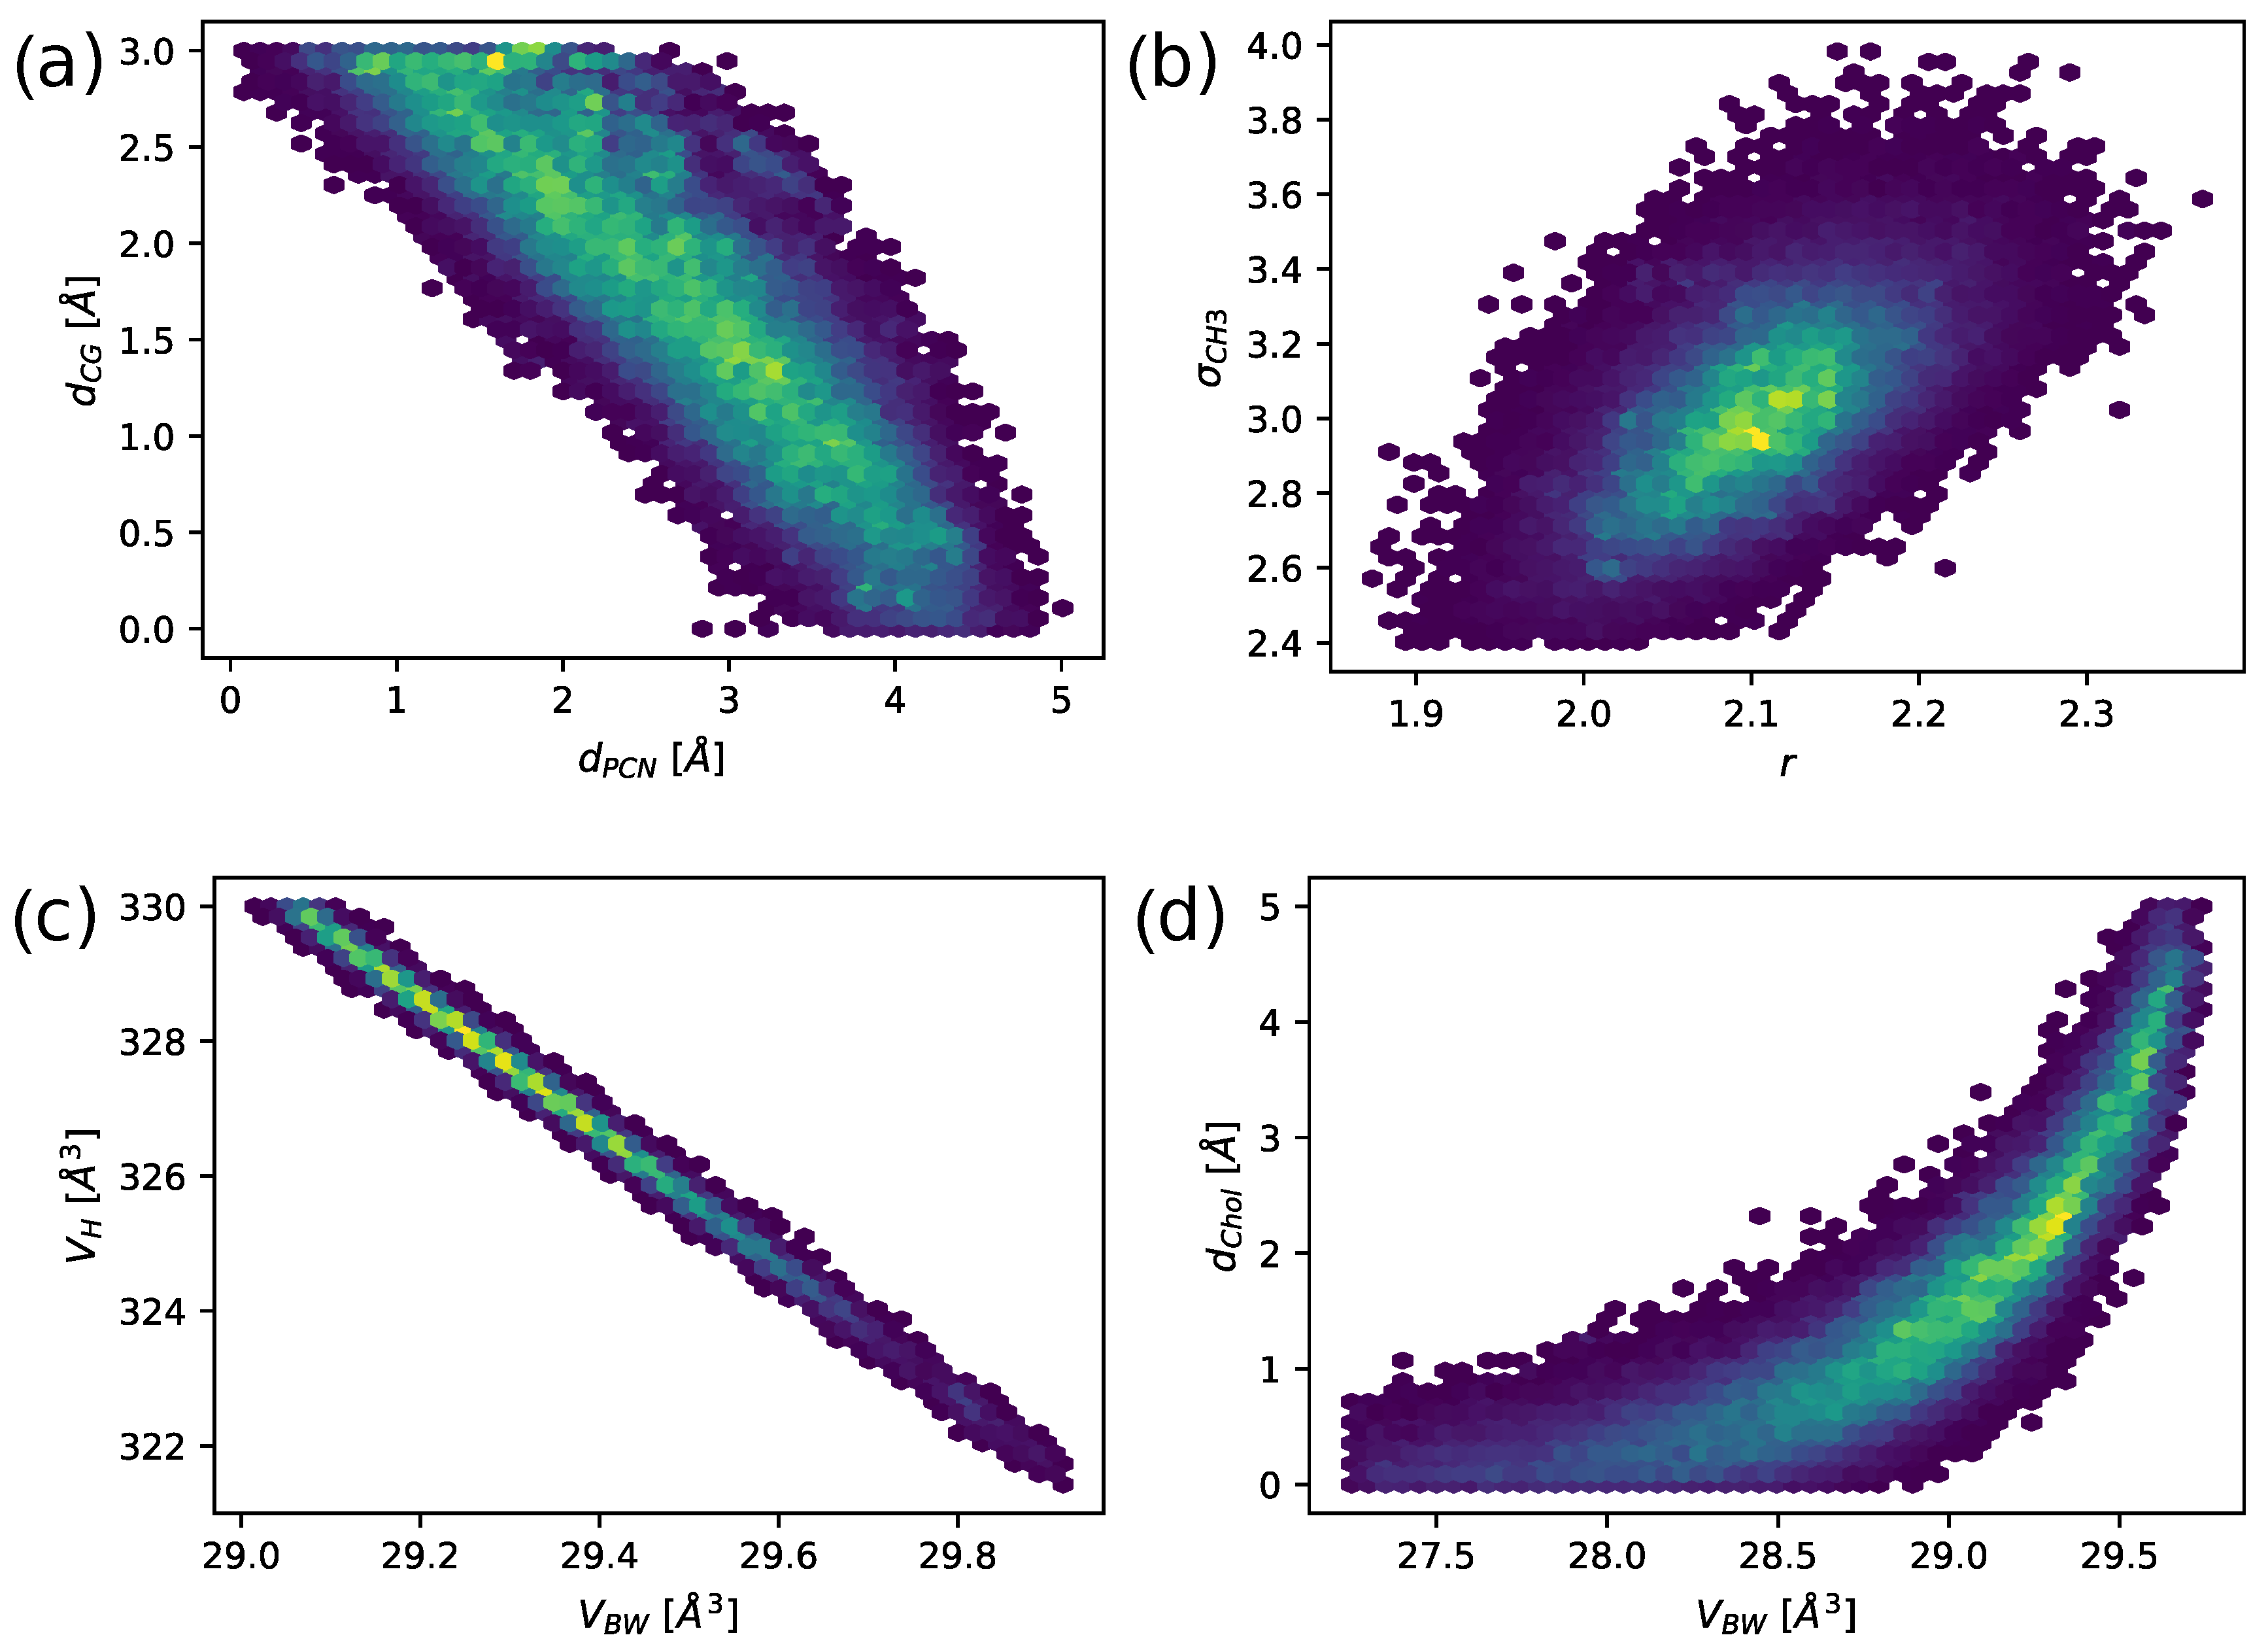
31]). MCMC provides the probability density profiles of the used model parameters and, if plotted in two dimensions, correlations between them (
Figure 2). Plateaus of high probability as seen in, e.g., (
Figure 2c), suggest strong correlations, meaning that the quality of the fit will only change minimally if one moves along iso-probability regions. Small differences in the experimental noise can therefore lead to large changes in these parameters, making the estimates of the most likely value (or global minimum) less reliable. In our case, we observed strong correlations between headgroup parameters, such as the positions of carbonyl-glycerol and phosphate groups (
Figure 2a). Furthermore, the volume fractions (
,
,
r) are very flexible parameters insofar that they correlate with the standard deviations of their respective Gaussians (
,
,
).
Figure 2b shows for example the correlation between
r and
. In the following,
will be one of our parameters of interest. Therefore, we decided to fix the volume of the CH3 group, along with those of the other moieties to the values recently published in [
30] (see
Table A2 and
Table A3), to maximize the comparability between different lipids. This also reduces the number of adjustable parameters for the trans-bilayer structure by three (four in the case of mono-unsaturated lipids) compared to previous studies. We also fixed
= 3 Å, as has been done before [
3], and
= 2.5 Å.
Figure 2c also shows how the introduction of the hydration shell is in fact an alternative to varying the volume of the headgroup
. The volume per bound water molecule
is linearly correlated with
, if we keep the headgroup structure constant. Varying either of them is thus a valid approach to increase the headgroup SLD. We chose to include the hydration shell in order to conform to published values for the volumes [
30]. Additionally, if we keep the headgroup volume constant (
Å
3),
correlates with the width of the headgroup and thus the number of bound water molecules (shown by the correlation between the distance phosphate to choline
and
in
Figure 2d). The distribution shows the highest probability density between
= 29.0–29.5 Å
3 for
, which also leads to a physically realistic range of distances
. We chose
= 29.3 Å
3, which is at the peak of the distribution.
Despite the improved fit of SAXS data at
Å
−1, we observed only minor changes in membrane structural parameters (
Table A2). This can be expected due to the excellent agreement of the previous SDP model for
Å
−1, i.e., for scattering vectors probing distances in the order of the membrane thickness and below. The newly introduced hydration shell gives us an estimate of the number of bound water molecules per lipid. Note that this is not an explicit fitting parameter, but is defined by the integral over the water volume probability density function within the Luzzati thickness, as has been in detail described in [
32]. The number of bound water molecules we obtained varied between 9.6 and 12.8 for saturated PCs and MSM, and was about 16 for the more loosely-packed monounsaturated PCs. These numbers agree roughly with previously published values [
32,
33]. However, there is a wide spread in measured values, mostly due to varying definitions of
. Furthermore, in our case we attribute a large uncertainty to these values, as it is strongly influenced by the choice of other parameters as discussed above.
2.2. Membrane Structure and Interleaflet Hydrocarbon Partitioning
In the next step, we applied our modified SDP anaylsis to various chain-asymmetric PCs as well as the highly asymmetric milk-sphingomyelin extract (average acyl chain length: C22:0). Fits and all parameters are reported in the appendix, in
Figure A2 and
Figure A3 and
Table A2 and
Table A3. High-resolution structural data for POPC and SOPC were detailed previously [
3]. Again, we find no substantial modifications to reported structural details upon the application of our model. To the best of our knowledge, structural details for MSPC, SMPC, PMPC and MSM have not been reported previously, however. Notably, we found that the area per lipid,
A, of all four lipids is very similar and that
A of MSPC, SMPC and PMPC agrees within experimental uncertainty with the
A of DPPC. This demonstrates that chain-asymmetry has no major influence on the general packing of these lipids within the bilayer in the biologically most relevant lamellar fluid phase far above the melting transition. Substituting the
sn2-hydrocarbon with an oleoyl chain significantly increases
A, in agreement with [
3]. The thickness of the bilayer,
, and the thickness of the hydrocarbon chain region,
, in turn, varies between MSPC, SMPC, PMPC and MSM according to the total number of methylenes. Interestingly,
Å for DPPC, MSPC, and SMPC, suggesting that the overall membrane thickness depends for saturated hydrocarbons only on the average number of carbons per chain and is not even influenced by the extreme acyl chain asymmetries of MSPC and SMPC. Note also that the slightly different
values for these three lipids are equal within experimental resolution.
Several fluid phase structures of sphingomyelins have been recently published [
21,
34], namely palmitoyl-sphingomyelin (PSM), stearoyl-sphingomyelin (SSM) and egg yolk-sphingomyelin (ESM). In both studies, the structure of PSM was measured at 45 °C; the reported areas per lipid differ, however, possibly due to the different experimental approaches (X-ray surface diffraction on stacks of bilayers vs. SAXS/SANS on vesicles). For ESM, a natural lipid mixture such as MSM, but with PSM as its main constituent and the same structure as for PSM was measured [
34], suggesting that hydrocarbon chain heterogeneity does not induce a significant disorder in the chain region. For SSM, however, the reported
= 62.5 Å
2 is considerably higher than the one for PSM [
21]. Our result for MSM is again higher (
= 64.8 Å
2), using a similar methodology as reported in [
21]. The lateral packing density of sphingomyelin might therefore be directly related to the (average) length of its acyl-chain: PSM/ESM (16:0) < SSM (18:0) < MSM (22:0). Bilayer thickness and terminal methyl overlap are higher for MSM than for the other published lipids, which is expected, again due to its longer acyl chains.
In the following we focus on the hydrocarbon chain interdigitation, which can be expected to be significant given the chain asymmetries of the presently studied lipids. Interleaflet interdigitation may, however, also arise from the specific backbone structure of glycerophospholipids, where the ester bonded hydrocarbon at
sn2 protrudes less into the bilayer core even at nominally equal chain length [
10]. Here, we use the width of the terminal methyl group,
, as a measure for hydrocarbon chain interdigitation.
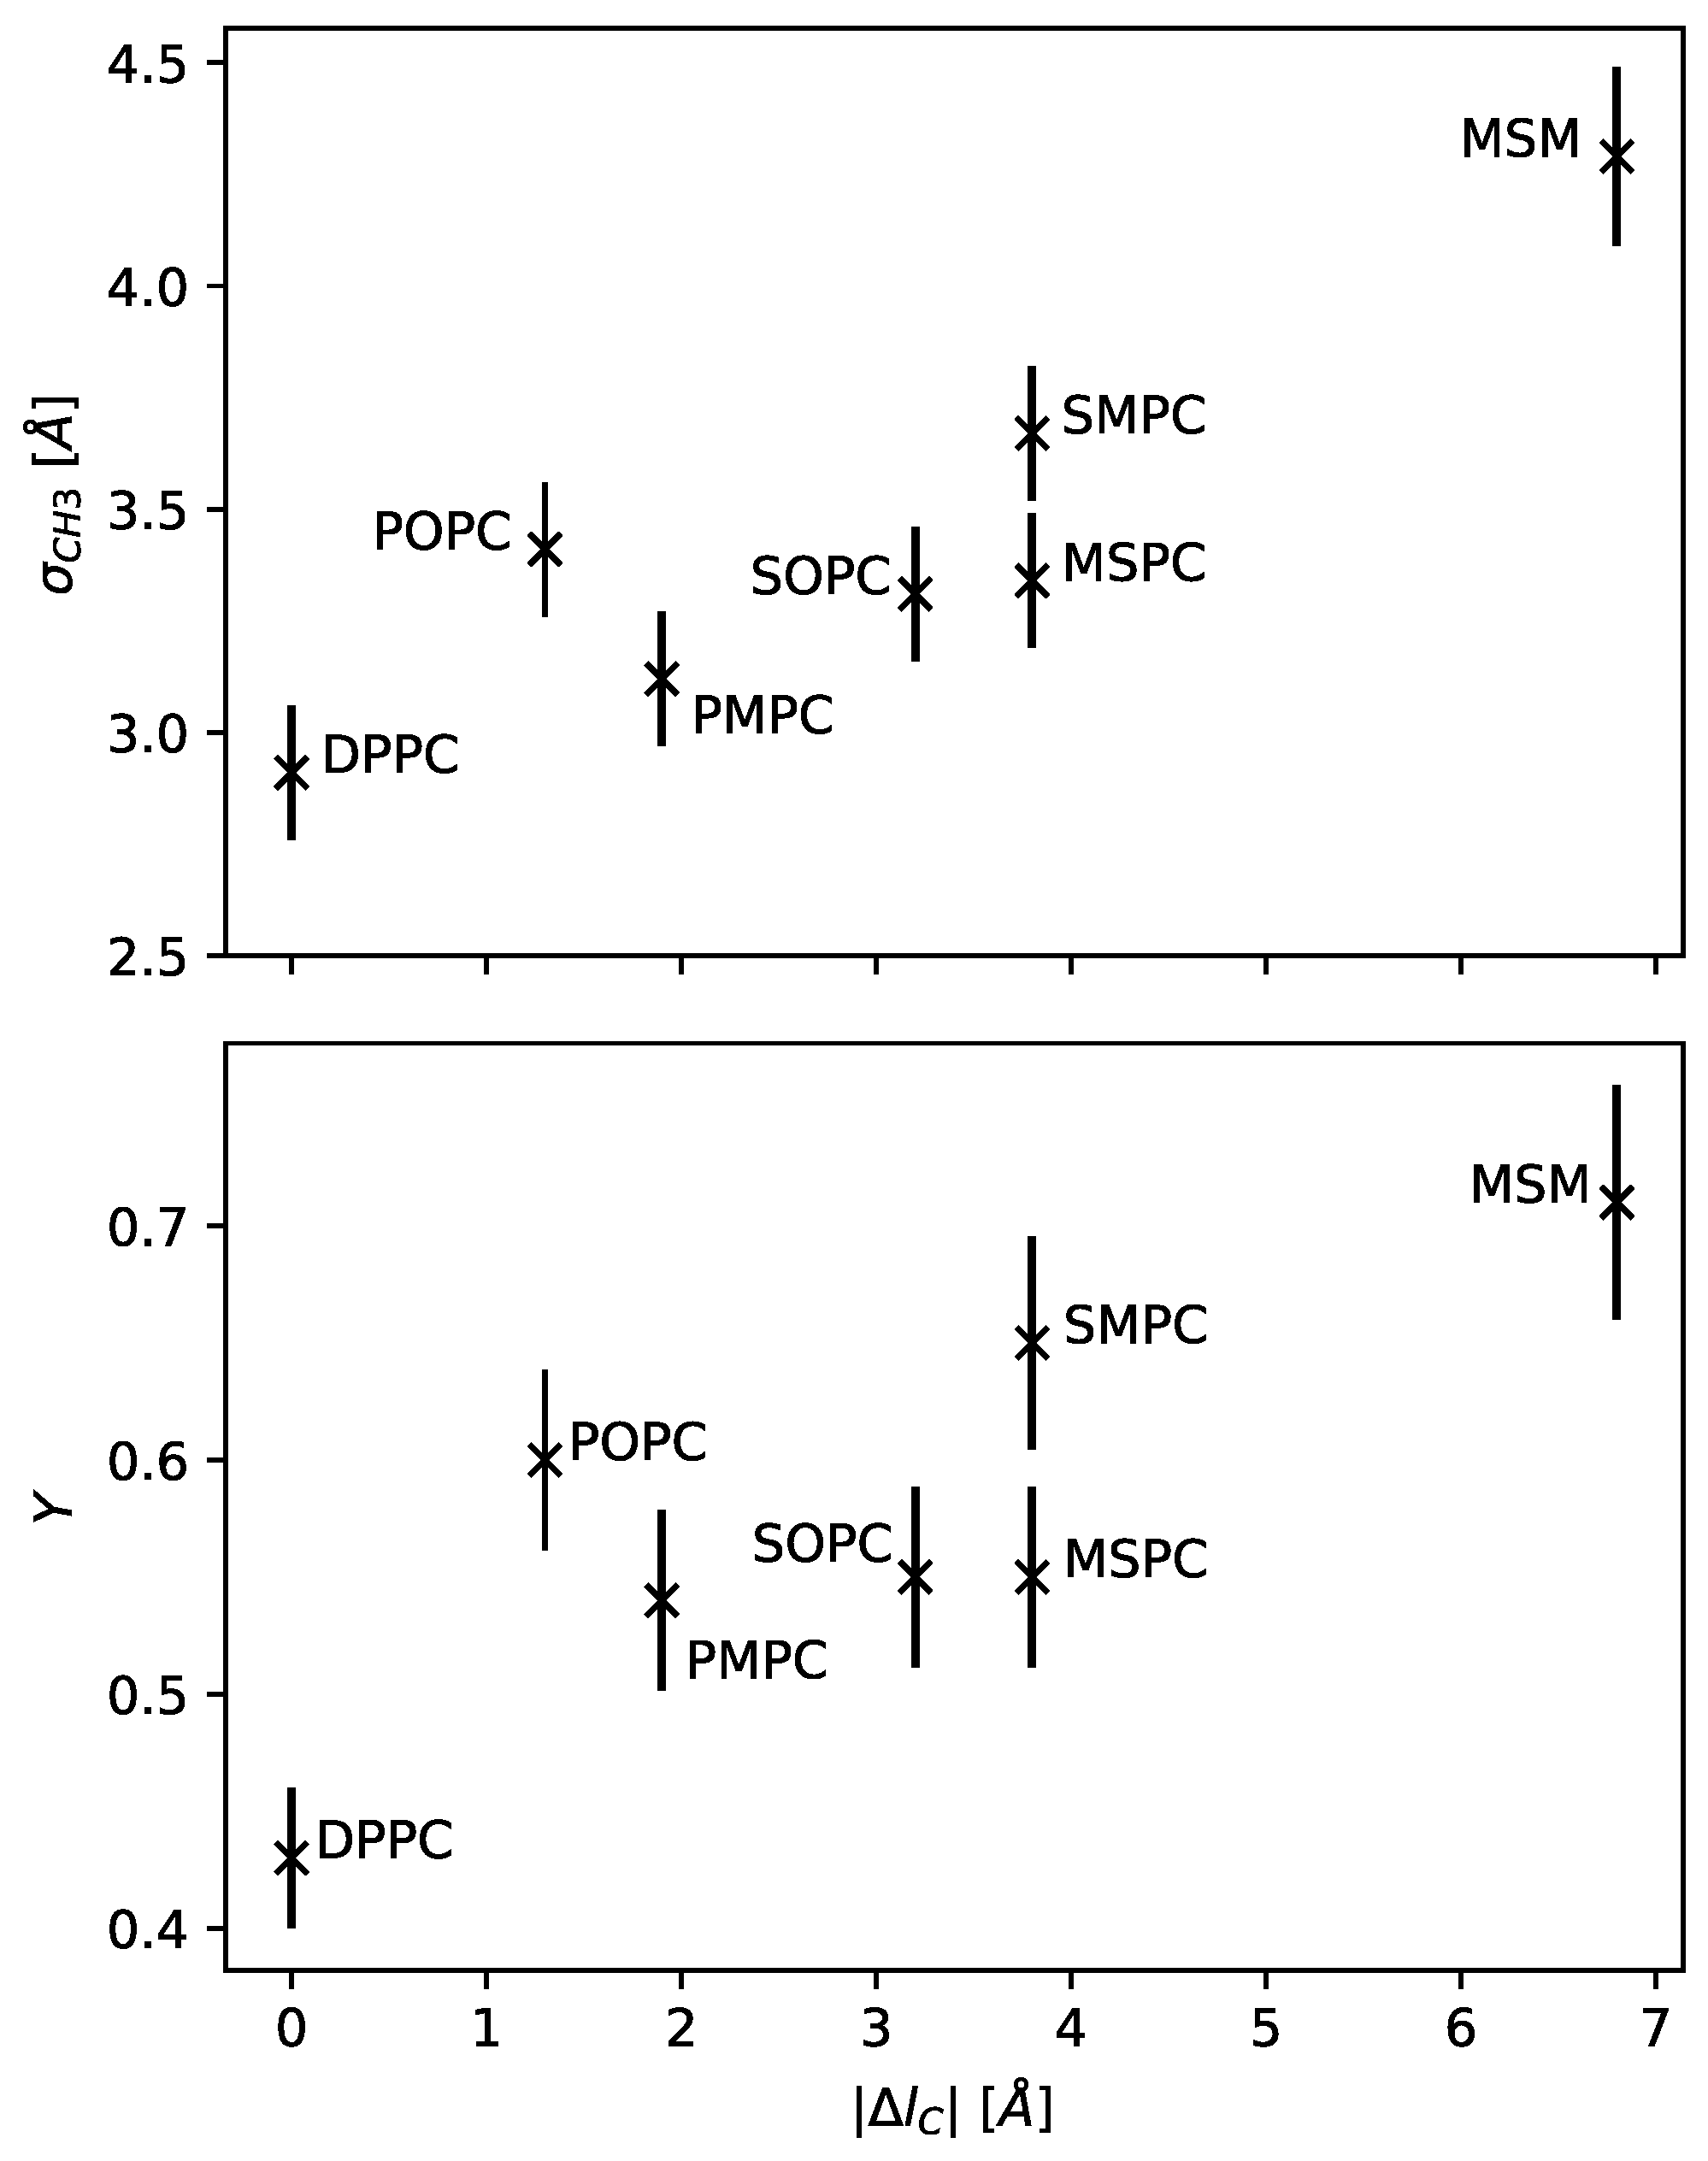
varied significantly for the different lipids studied (
Table 1). In order to derive a possible correlation between chain asymmetry and
, we define the chain length mismatch
. Furthermore, we estimated
by assuming
to be equal to the half-hydrophobic thickness
of the corresponding chain-symmetric lipid bilayers (see
Table A5).
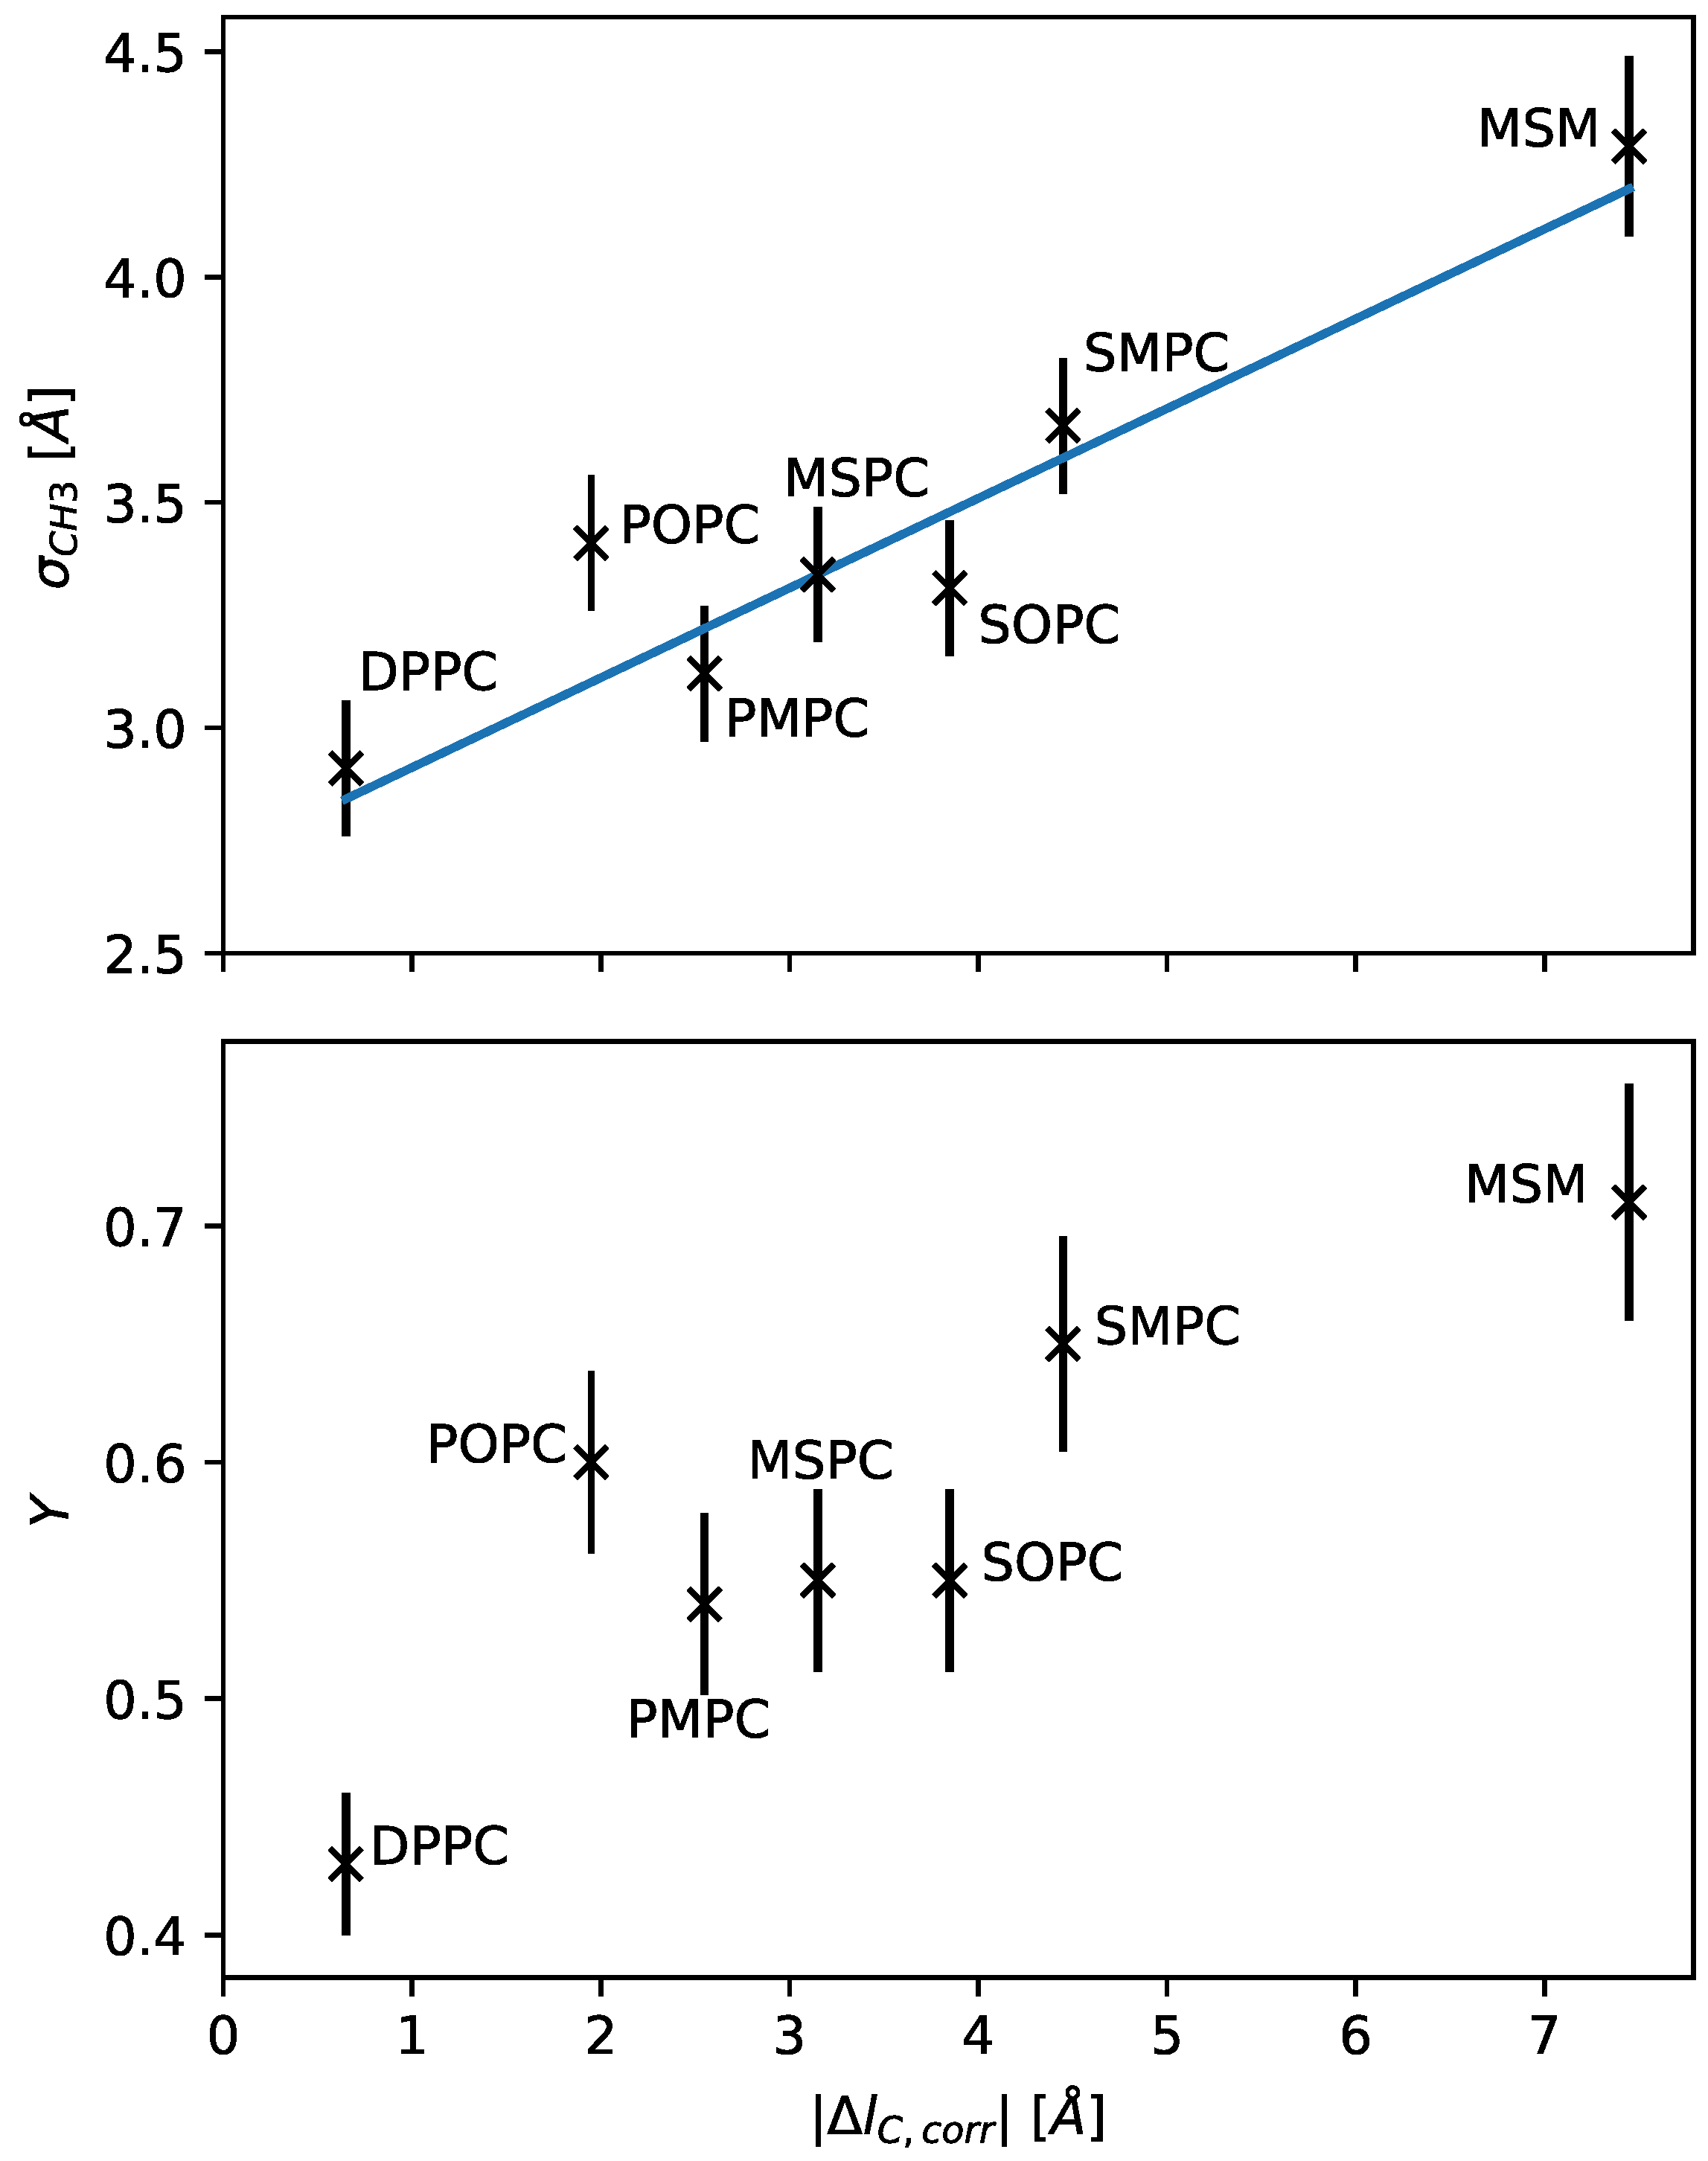
Figure 3 presents the resulting dependence of
on
. We observed a nearly linear increase in hydrocarbon overlap with increasing chain length mismatch.
SMPC and MSPC possess a priori the same absolute value of chain length mismatch. In this case, it is, however, important to take the well-known tilting of the glycerol backbone [
9] into account, which effectively lengthens the
sn1 and shortens the
sn2 chain. We therefore introduce a correction
on the chain length-mismatch (Equation (
1)):
We estimate its value by assuming a linear relation between the corrected, absolute chain length mismatch
and
. In order to evaluate the most likely value for
, we use an iterative approach, alternately optimizing:
and Equation (
1). Here,
k is the slope and
is the terminal methyl width of a hypothetical lipid of equally long chains; for details, see the pseudocode Algorithm A1.
The result is shown in the upper panel of
Figure 3, with the value
Å. In terms of chain length dependence on the number of carbons (
Table A5), this corresponds to about half the length of a CH
2-segment. The parameters of the linear fit result in
and
Å. The chain overlap thus rises only slowly with the chain length mismatch (20% of its length), which fits into a bilayer picture of fluid hydrocarbon chains, not directly pointing towards the center, but significantly diverted and/or bent. Note that our analysis indicates that even DPPC has some inherent hydrocarbon interdigitation.
2.3. Quantifying Hydrocarbon Chain Overlap Relative to the Hydrophobic Thickness
The standard deviation of the Gaussian accounting for the terminal methyl groups
gives a measure for hydrocarbon chain interdigitation or, more precisely, the terminal methyl dislocation. However, in some cases, it might be helpful to describe this quantity relative to the thickness of the hydrocarbon layer to estimate its effect on chain disordering. We therefore introduce the dimensionless parameter
Y and connect it to the SDP model, by defining the state
(no chain overlap) when the volume probability density of the CH
3-groups reaches one at the bilayer center. This is the case for
. Furthermore, we define the state
by
, representing a smeared-out state, where the CH
3 volume is distributed over the whole hydrocarbon region (fully interdigitated). This leads to the definition:
The extreme states (
Y = 0, 1) are most likely purely theoretical.
is around 1.4 Å for the studied lipids, while results from
Section 2.2 suggest that
Å for PC-lipids. Moreover, the
-values of other molecular groups also lie far above this value, suggesting that overall fluctuations of the molecules will not permit localization to such an extent. On the other hand, for
Y approaching 1, the probability distribution of the CH
3 group might no follow a Gaussian shape. In intermediate cases, as for systems used in this study,
Y could mark a major characteristic of a bilayer. Here, our results suggest that the relative dislocation of the chain termini also monotonously increases with hydrocarbon chain mismatch (
Figure 3), and can reach up to ~70% of hydrocarbon chain thickness. POPC, interestingly, does not fit into this picture, having within experimental uncertainty a relative chain overlap similar to that of SOPC or SMPC. This is most likely a signature of the unsaturated hydrocarbon, which increases due to its kink at the
cis double bond the width of the distribution of the terminal CH
3.
2.4. Chain Interdigitation and Back-Bending in Simulated Systems
From our experiments, we were not able to distinguish between lipids in the inner in and outer leaflets. Hence, broadening of the CH
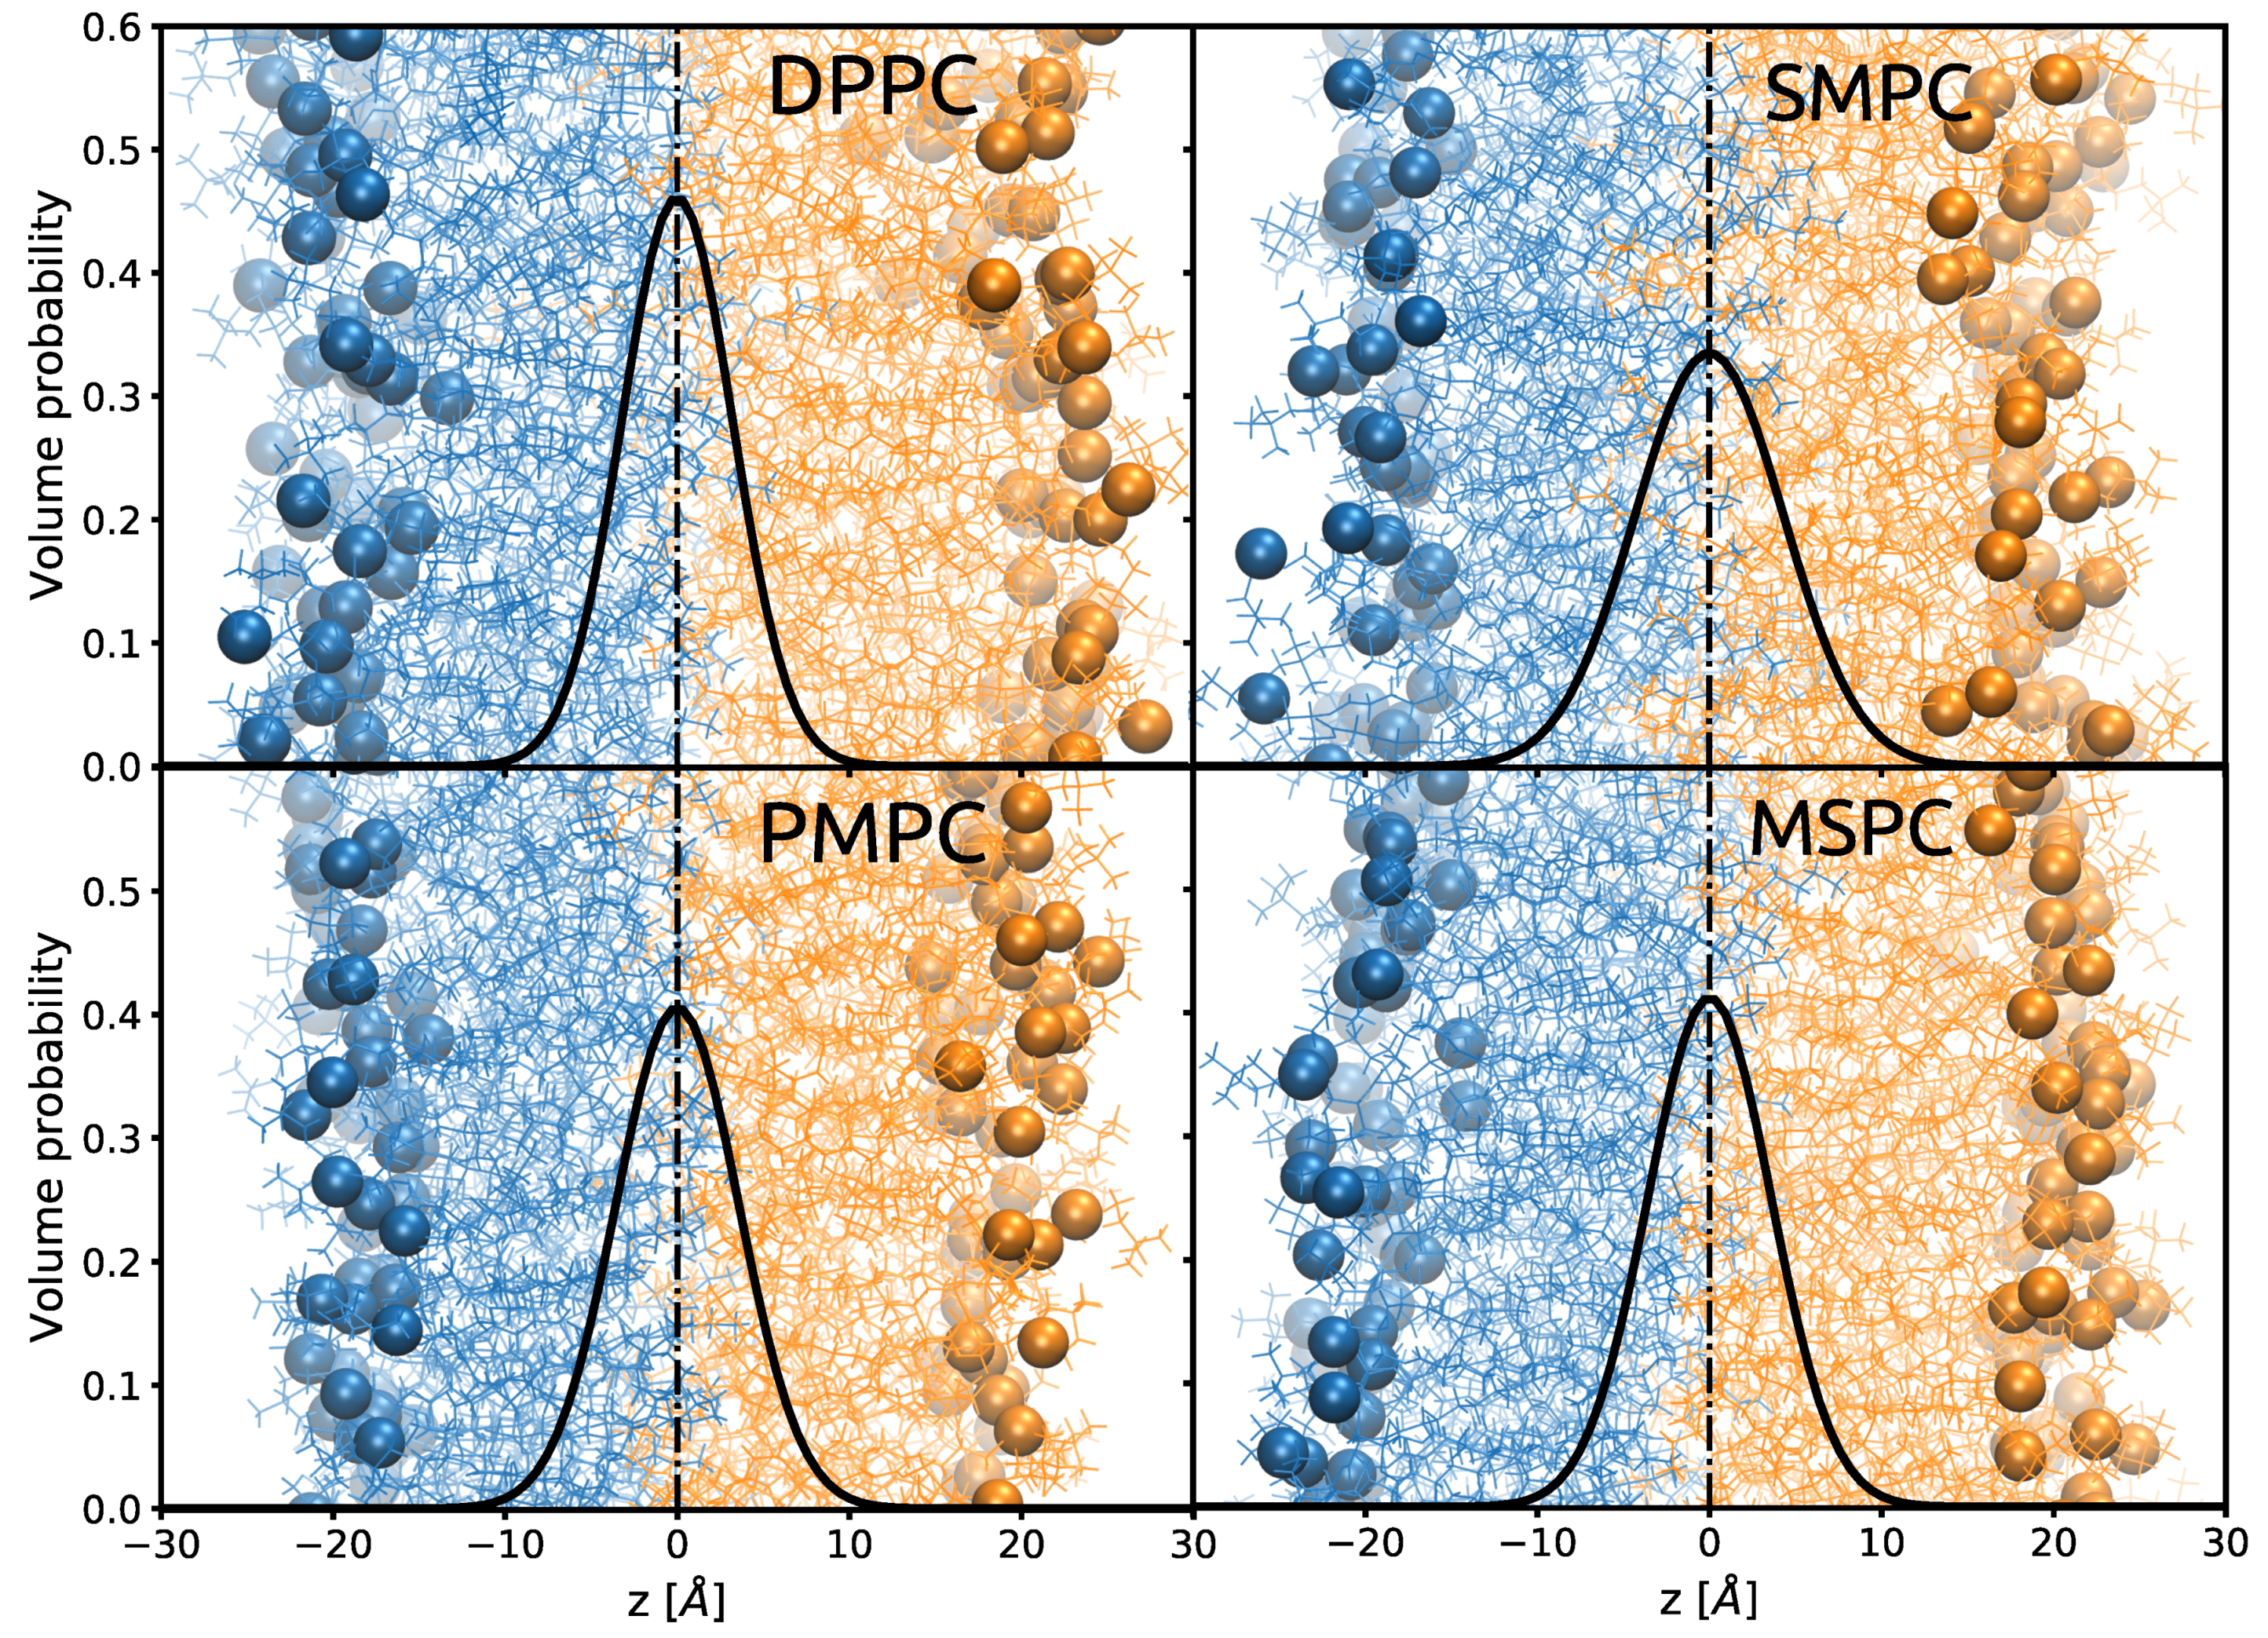
3-Gaussian could be either caused by interdigitation or by the back-bending of the longer hydrocarbon chain. In order to clarify this issue, we performed MD-simulations on DPPC, MSPC, SMPC, PMPC and dimyristoyl PC (DMPC) to gain access to details in the behavior of the hydrocarbon chains at the bilayer center. Simulation snapshots and the overall volume probability distributions of terminal methyl groups of DPPC, MSPC, SMPC, PMPC are shown in
Figure 4. In all cases, the CH
3 distributions are centered in the middle of the bilayer, although their widths are broader than our experimental values (
Table A2). However, the trend over the chain length mismatch agrees with our experimental observation. The snapshots additionally show a significant number of chains penetrating deeply into the opposing leaflet for MSPC, PMPC and SMPC. Overlaid are the volume probability distributions of the terminal methyls, which result from fluctuations of both the individual chains and whole lipid molecules (protrusions).
A closer look into the shape of the CH
3 distribution functions reveals that they actually decay slower than Gaussians (
Figure A6). Separating the distribution into contributions from
sn1 and
sn2-chains, from inner and outer leaflet (
Figure 5) leads to further insight. In particular, one can see that the deviation from a bell-shaped function is connected to the shape of the distributions of the individual chains, which are slightly asymmetric with a tailing to the back towards their headgroups. This tailing is equally present for DPPC and thus not a consequence of chain asymmetry. However, while for DPPC all methyl groups clearly have the peaks of their distributions in their own leaflet, the distributions of the shorter chains from inner and outer leaflets are well separated for MSPC, PMPC and SMPC, while the long chains overlap much more. In the case of MSPC and PMPC, the long chain distribution functions from opposing leaflets almost perfectly overlap in the center of the lipid bilayer and only deviate in the tailing toward the headgroup region. This suggests that there is a balance between hydrocarbon interdigitation and back-bending in the center of the membrane, while contributions from backward bent chains dominate over interdigitated hydrocarbons when moving closer to the glycerol backbone. This asymmetric part accounts for 8% of the total area of the distribution (
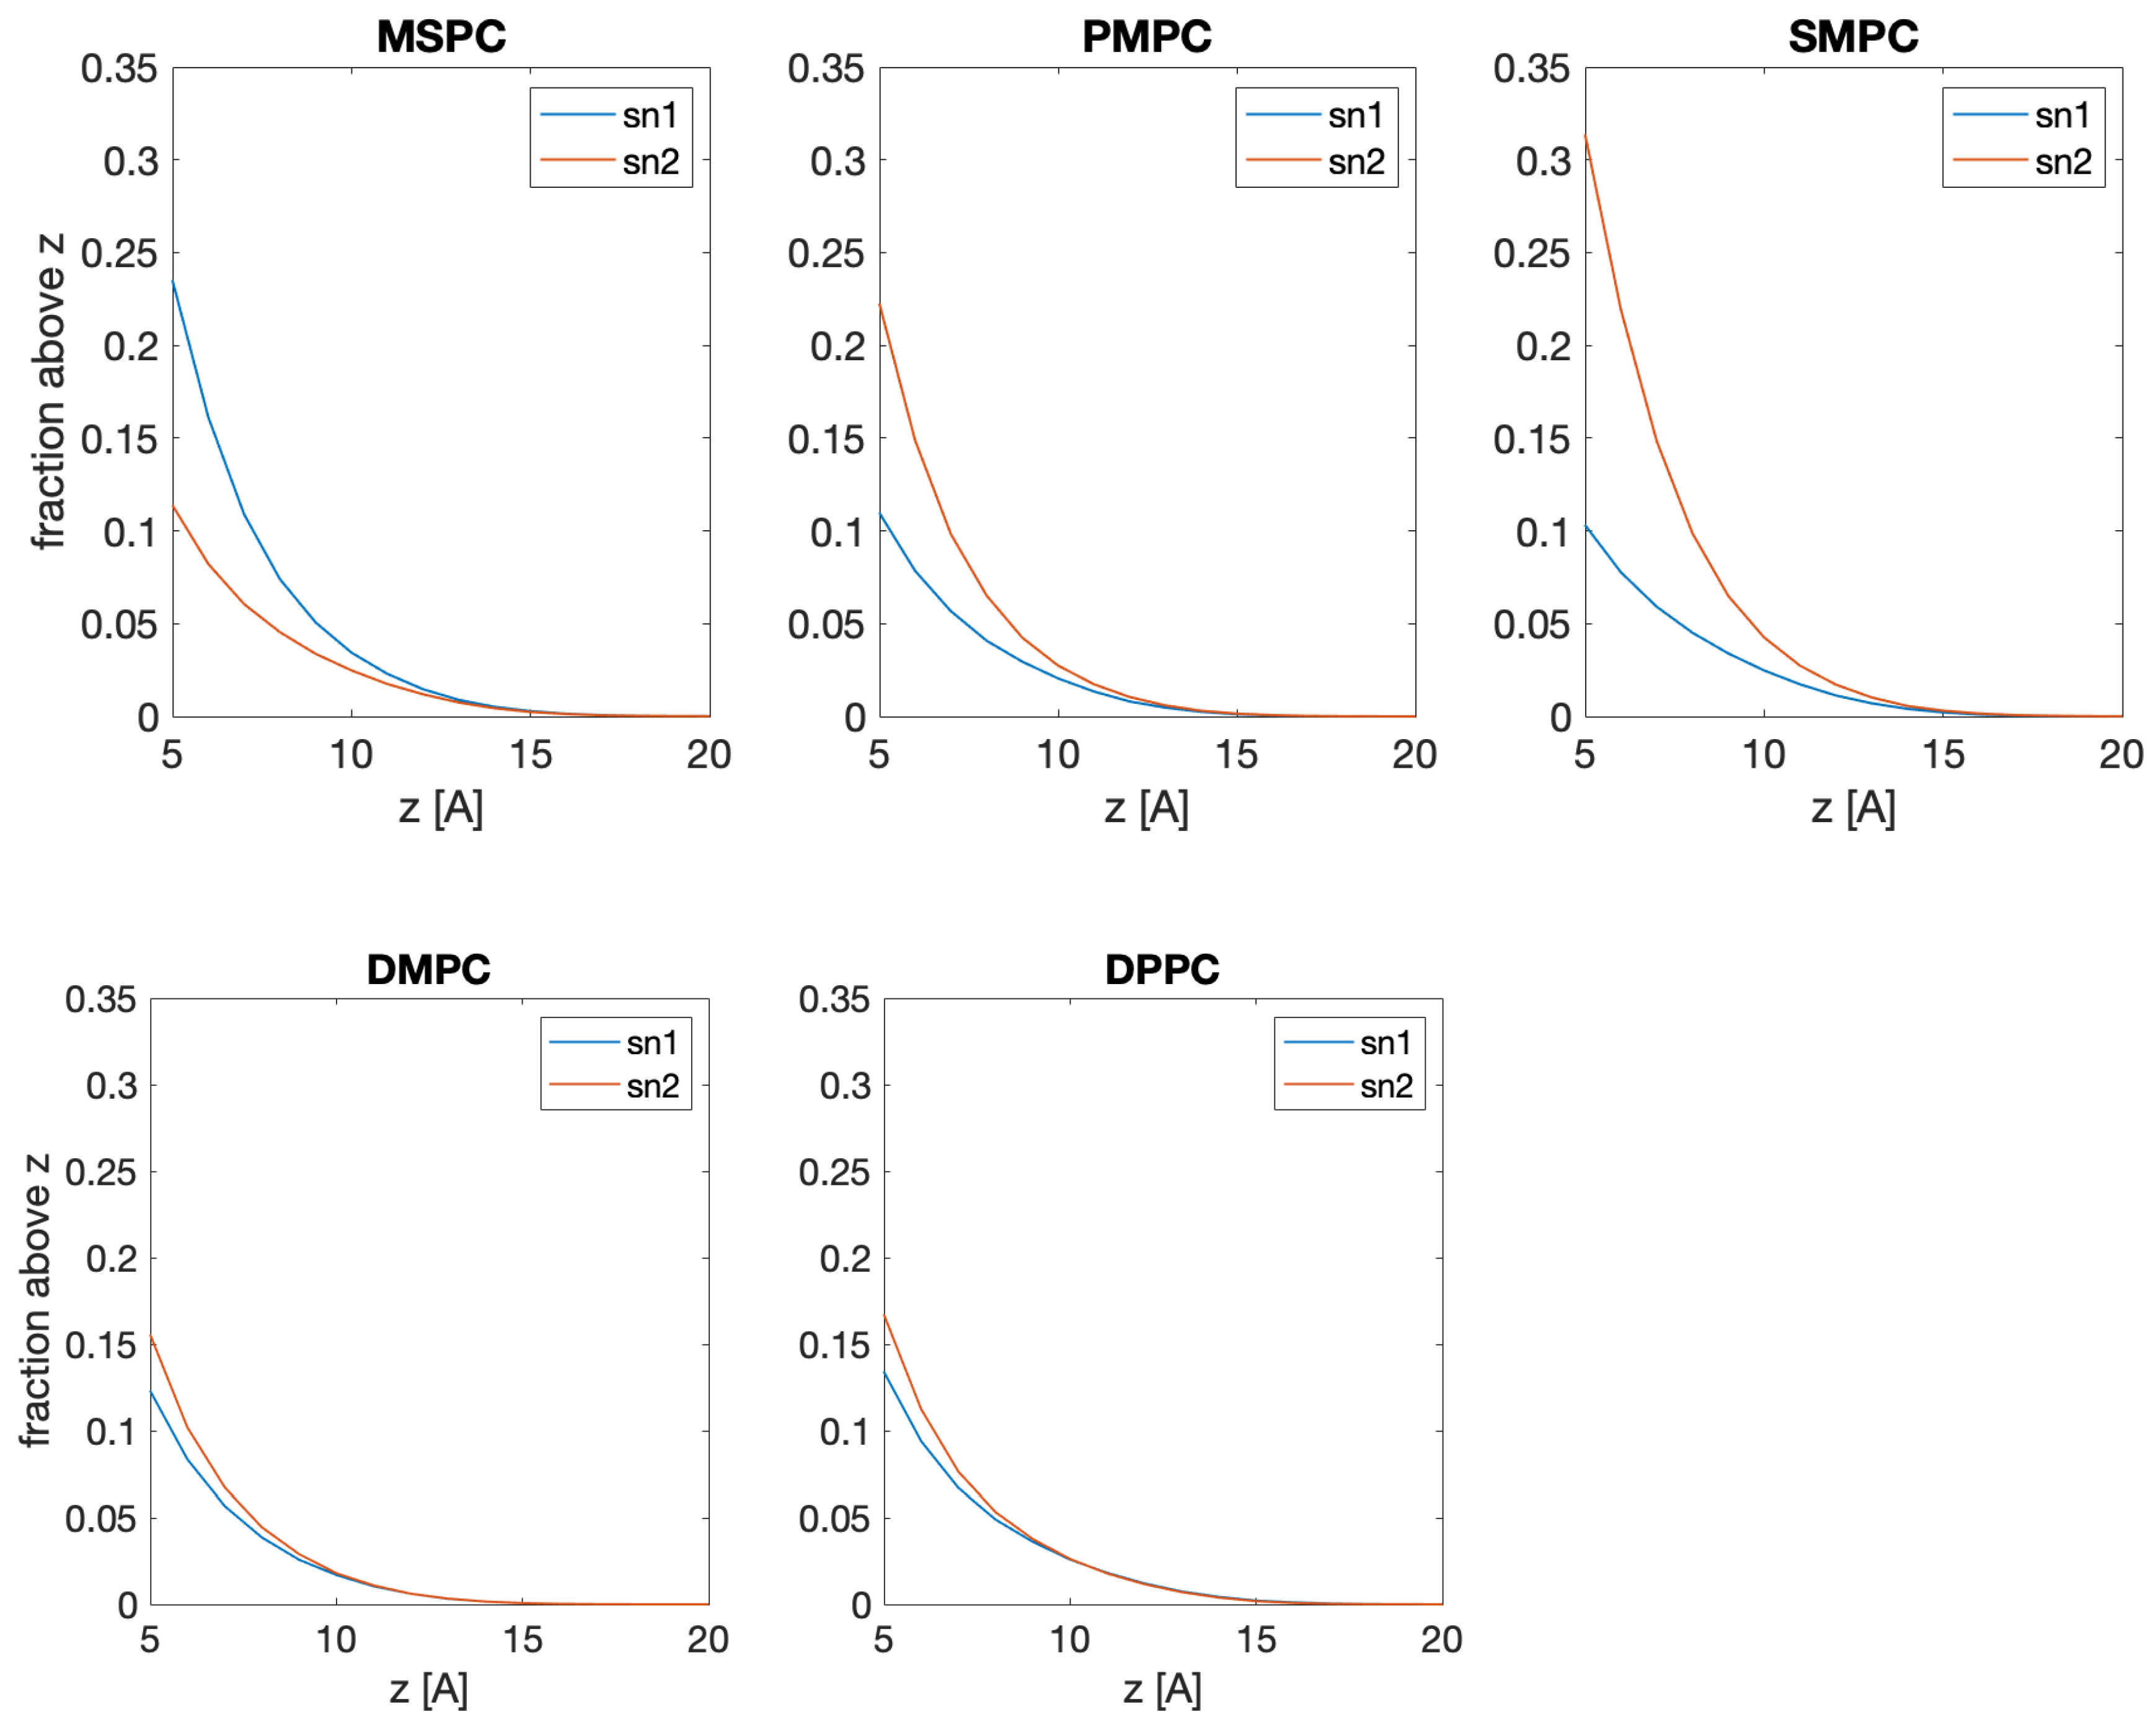
Figure A6). This can be alternatively visualized by plotting the fraction of lipids with their methyl termini located above a certain distance from the center of the bilayer (
Figure A7). In the case of SMPC, the long chains penetrate deeper, with the maxima of their distributions in the opposing leaflet.
An interesting consequence of the prevalence of contributions from back-bent hydrocarbons further away from the bilayer center becomes clear considering that packing defects typically have larger effects on the lateral pressure profile, if they occur closer to the glycerol backbone [
35]. That is, even if we do find similar lipid areas for DPPC, SMPC, MSPC, and PMPC, their stored elastic energies may differ significantly and will be dominated by the back-bent hydrocarbons, not by the interdigitating ones.
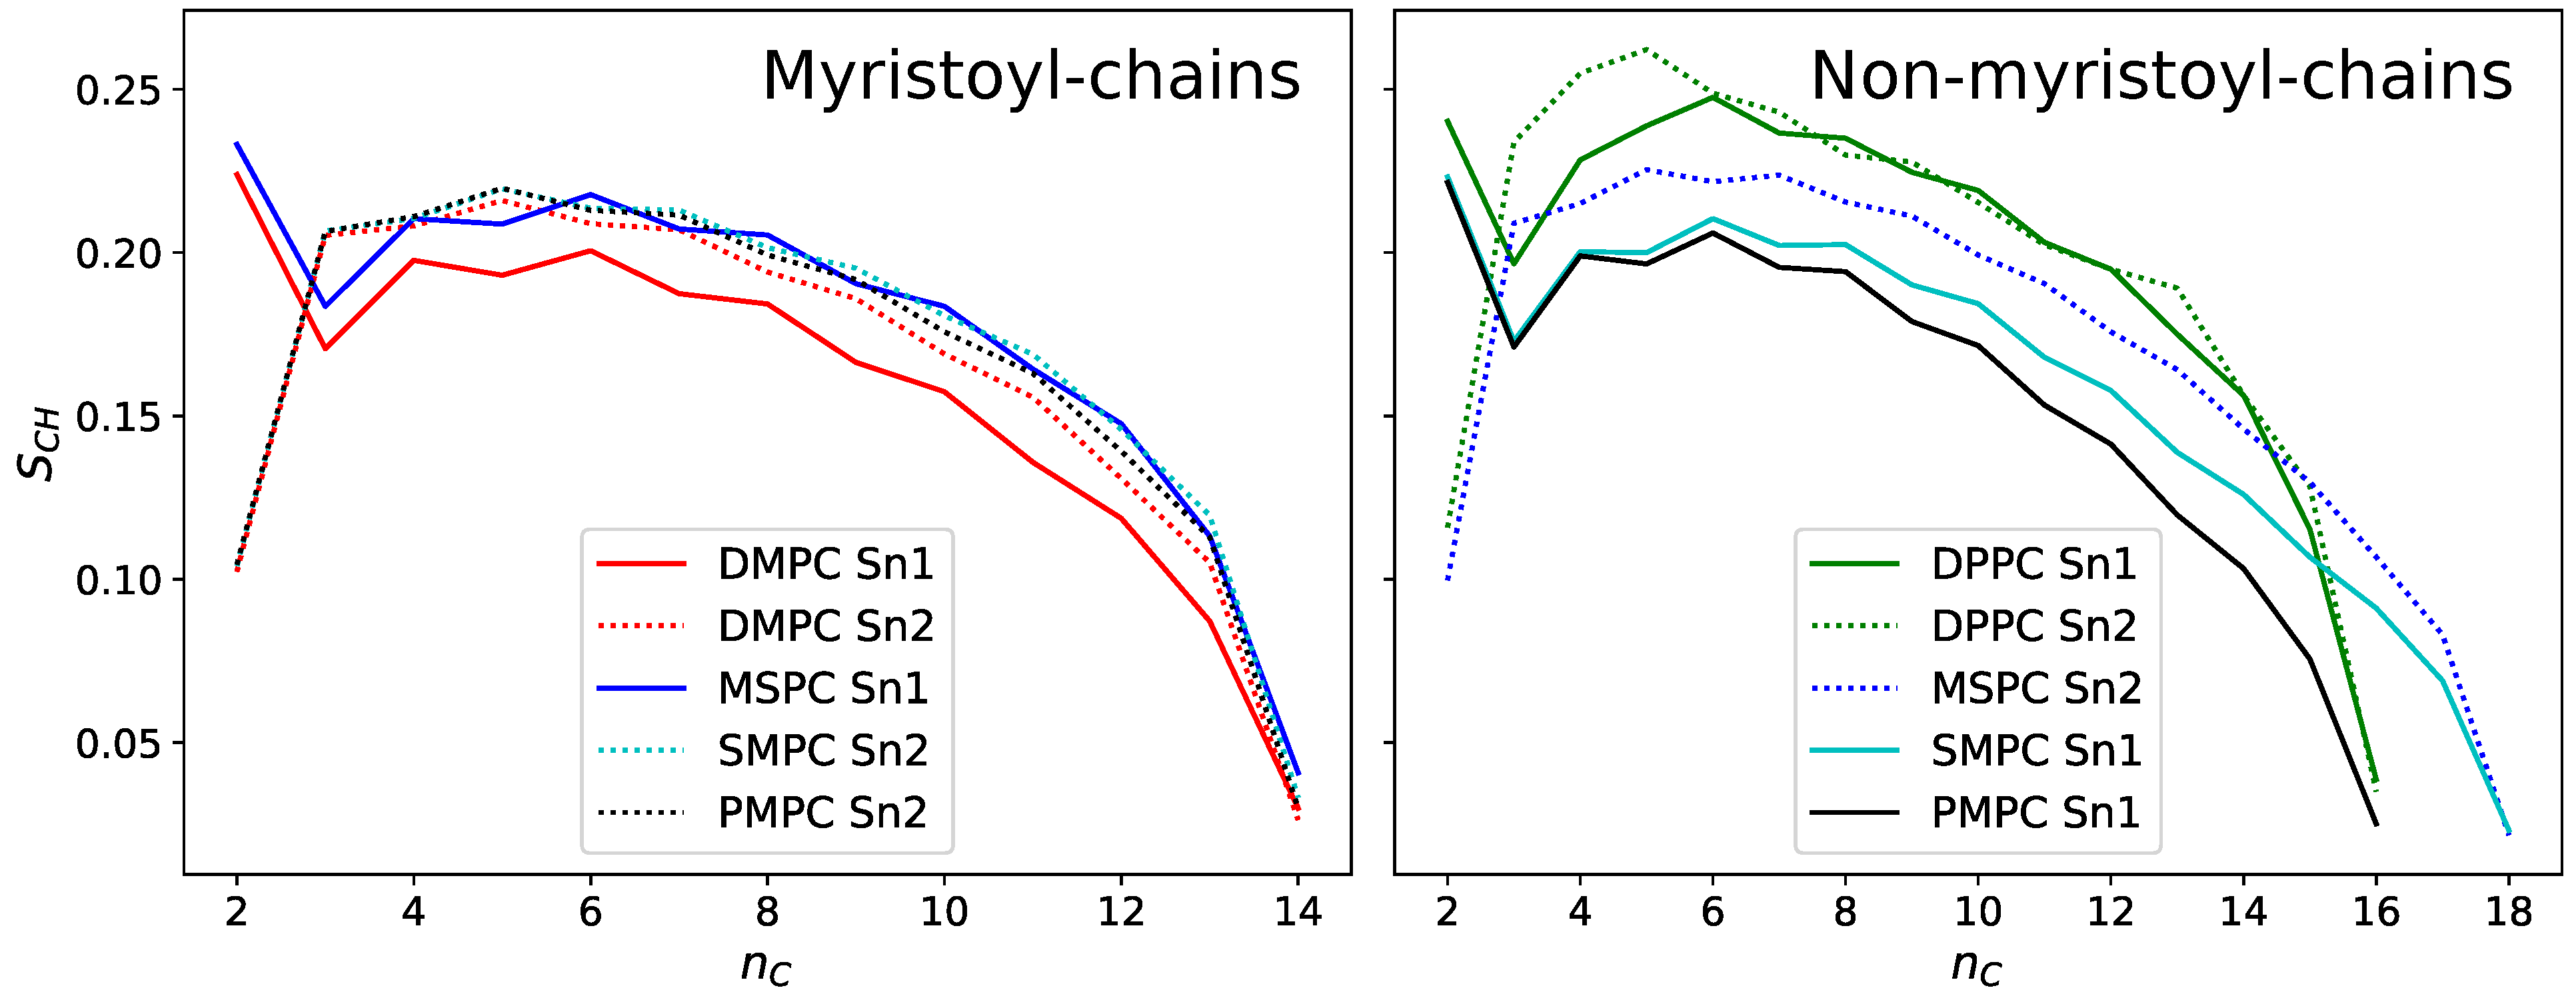
Another effect of the hydrocarbon chain mismatch can be seen in the orientational order parameter
of the hydrocarbons, which was also derived from MD simulations (
Figure 6). This dimensionless number represents the average orientation of the respective C–H bonds relative to the bilayer normal [
36] and approaches 1 for perfectly ordered chains. Hydrocarbons are labelled by the number
, starting with 1 at the ester bond. In the case of chain-symmetric lipids, the strength of the attractive van der Waals interactions between the hydrocarbon chains increases with chain length, leading to a higher ordered state, as can be seen in the example of DMPC (14 carbons/chain) and DPPC (16 carbons/chain). If there is a chain length mismatch, however, the longer chain lacks its direct neighbor at its tip, decreasing its order. In fact, order parameters of the longer chains in MSPC, SMPC and PMPC are close to the ones of DMPC for low
and well below those of DPPC. Again, we see a difference between MSPC and SMPC: due to the glycerol-tilt, the 18:0 chain in MSPC has a lower effective length difference to its 14:0 chain and is therefore more ordered than in SMPC. On the other hand, the behavior of the short myristoyl-chain is almost identical for all lipids, as they all have a long neighboring chain to optimize van der Waals’ interactions. Solely the
sn1-chain in DMPC, again being longer than its
sn2 due to the glycerol-tilt, has slightly lower order parameters.
