Abstract
Recent years have seen a growing call for use of big data analytics techniques to support the realisation of symmetries and simulations in digital twins and smart factories, in which data quality plays an important role in determining the quality of big data analytics products. Although data quality affecting big data analytics has received attention in the smart factory research field, to date a systematic review of the topic of interest for understanding the present state of the art is not available, which could help reveal the trends and gaps in this area. This paper therefore presents a systematic literature review of research articles about data quality affecting big data analytics in smart factories that have been published up to 2020. We examined 31 empirical studies from our selection of papers to identify the research themes in this field. The analysis of these studies links data quality issues toward big data analytics with data quality dimensions and methods used to address these issues in the smart factory context. The findings of this systematic review also provide implications for practitioners in addressing data quality issues to better use big data analytics products to support digital symmetry in the context of smart factory.
1. Introduction
The increasing connections of systems produce massive amount of data that support manufacturing decision-making in smart factories (SF) [1]. Furthermore, the interaction and convergence of both physical and virtual manufacturing worlds to achieve symmetry by using digital twins is an inevitable trend in SF, also boosting on big data [2]. On the other hand, big data analytics (BDA) techniques help enterprises extract and discover the patterns, trends and relationships that exist in this large amount of data [3]. The products derived from BDA contribute to digital symmetry and simulation modelling for achieving SF objectives. For example, these products are used for product quality control [4] and predictive maintenance of equipment [5], in order to improve the competitiveness of enterprises. The quality of BDA products relies heavily on data quality (DQ). For instance, incomplete and inaccurate data from the maintenance information system (IS) affects the results of the data analysis in SF symmetries and simulations that lead to services being provided to the wrong customers and an increase in maintenance costs [6]. Hence, poor quality of the data employed in BDA for digital symmetry is a significant cost factor for many manufacturing enterprises.
DQ, referring to both ‘fitness for use’ and ‘conformance to requirements’ [7] has been studied during the last three decades, while addressing DQ remains as a significant challenge in performing BDA in the SF context. The field effort has provided support to improve DQ by developing data management frameworks [8] and DQ control tools [9] for BDA. However, this body of research has paid limited attention to defining DQ that is a multidimensional problem. As noted in Hazen et al. [6], ‘you cannot improve that which you cannot measure’, so defining DQ for measurement is a fundamental concern before attempts can be made to improve DQ for BDA. Although previous literature reviews have investigated the challenges in achieving high-quality data and data issues in the SF context, they only looked at DQ as a part of their study context but it was not the focus of the study scope. The specific manifestations of DQ issues regarding BDA remain unclear in the SF context. Such an investigation should help better discover a DQ issue in practice and trace to its root causes for solution, contributing to systematically addressing how DQ affects BDA in SF.
The objective of this study is thus to examine the extant literature to identify DQ issues for BDA and the methods used to address these issues in the SF context. The identified DQ issues are linked to DQ dimensions, assisting in better understanding and defining DQ. This also contributes to facilitating a consistent use of the terms used to describe DQ dimensions and providing support to define and measure DQ and identify relevant DQ issues under each DQ dimension. The methods used to address DQ issues identified provide references for dealing with DQ and offer clues about the methods’ selection and improvement. By giving an overview of the research themes in relation to DQ affecting BDA in SF, we gain insights to which application scenarios of SF supported by DBA with quality-assured data have been studied and potential areas for further exploration. To achieve this objective the review is guided by three research questions (RQs):
RQ1: What are the research themes addressing DQ for BDA in the SF context have been studied?
RQ2: What are the issues of DQ affecting BDA that have been studied in the SF context?
RQ3: What are the methods used to address these DQ issues in the SF context?
In this study, the systematic literature review (SLR) approach was selected as it offers a method for the selection, analysis and interpretation of available literature in relation to addressing a specific research topic, a RQ or a phenomenon of interest [10] that best fits this study to study and understand the state of the art on the topic of interest. We followed the guidelines proposed by Wolfswinkel et al. [11] to conduct an SLR of the empirical studies that have a focus on DQ affecting BDA in the SF context (up to 2020, inclusive), with well-defined steps to provide comprehensive information to the research community. The findings of the present study will benefit for data analysts on defining DQ and selecting and applying methods to address identified DQ issues for BDA based on their affordances and limitations, and developing BDA products with high-quality data to support symmetries and simulations in digital twins and SF. This study also allows decision makers to raise the awareness of utilising quality-assured BDA products in manufacturing decisions and develop strategies to ensure DQ in routine practices for BDA.
The rest of the paper is organised as follows: Section 2 describes the essential concepts applied in this paper and reviews related studies on DQ in SF and Section 3 presents the research methods used in this study. Guided by the RQs, Section 4 gives the results from the SLR. Section 5 discusses our research findings, proposes potential areas for further exploration, and provides contributions and limitations of this study. Section 6 concludes this paper.
2. Definition and Related Studies
This section presents the definitions for the three essential concepts concerned in the present study (namely, digital symmetry, DQ for BDA, and SF) and reviews related studies.
2.1. Digital Symmetry
In this article, the term ‘digital symmetry’ in the SF context is essentially similar to the concept of digital twin. The digital twin in SF is divided into two worlds of symmetry, namely the physical world and the virtual world of manufacturing (adapted from Shangguan et al. [12]). In the physical world, operational information of manufacturing such as speed and energy consumption of production machines, temperature and humidity of products processing and location and speed of logistics vehicles for manufacturing and services is sent to the digital twin via data and control bus. In the virtual world, the digital twin based on big data contains four main layers (adapted from Ghita et al. [13]): (1) data interaction layer deals with data collection, transmission and preprocessing; (2) data analysis layer addresses data modelling, simulation, and prediction; (3) data visualisation layer enables to visualise the results of the data analysis; and (4) data application layer concerns operational instructions and decision making of manufacturing guided by the BDA products (see Figure 1).
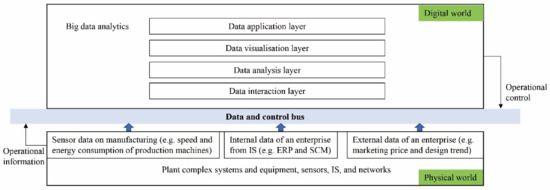
Figure 1.
The physical world and digital world in the digital twin based on big data in the SF context. ERP = enterprise resource planning; SCM = supply chain management.
As shown in Figure 1, functions of the virtual world of manufacturing integrated with the physical world can be enhanced by the digital twin that help achieve symmetries in SF. To specify, the digital twin creates virtual models of physical objects in a digital way to simulate the objects’ behaviours in real world and connects both physical and digital worlds via the linked data for virtual-physical integration. As such, the physical operation process can be analysed, predicted and optimised in virtual models and after the simulation and optimisation of the manufacturing process, the digital twin guides the operations to realise the optimisation in the physical world. In this process, more and more data is accumulated and integrated from both worlds and BDA performed based on this data also better supports symmetries and simulations in digital twins and SF.
2.2. Data Quality
As mentioned, DQ has been defined both as ‘fitness for use’ and as ‘conformance to requirements’ [7]. In the IS domain, researchers have divided DQ into dimensions to describe different DQ aspects, such as completeness and accuracy that are operationally measured [14]. In the present study, we also distinguish data quality and information quality as advised by Tilly et al. [15], and only look at the quality of the data for BDA in SF in this SLR. Therefore, we draw on the research articles on DQ affecting BDA in SF to study and understand this phenomenon.
DQ has an impact on firm’s intention for BDA [15] and a certain level of DQ being ensured helps develop BDA products and unlock values from BDA [16]. Although the role of DQ has been realised in the BDA literature, most of these studies only focused on (1) how BDA products supported by high-quality data help companies create values and competitive advantages [17] and (2) how DQ affects BDA values [16,18]. Limited attention has been paid to defining DQ and investigating DQ issues for BDA that assist in assessing DQ and determining a DQ issue for solution. To address these gaps in the literature, this study reviews the DQ issues affecting BDA in the SF context and maps these issues to the corresponding DQ dimensions (with relevant definitions used). This helps to better: (1) define and assess DQ for BDA and (2) discover a DQ issue. Furthermore, the present study also examines the methods used to address DQ issues and links these methods to the DQ issues that benefit for selecting and applying these methods for addressing DQ issues and reveal possible improvements for these methods. In this light, DQ has a better chance to be dealt with for BDA products, in order to realise symmetries and simulations in the context of SF.
2.3. Smart Factory
Smart factory is the term toward which the new industrial revolution was introduced [19]. Many attempts have been made to define SF. For example, Hrustek et al. [20] defined SF as digital manufacturing systems that can both improve overall production performance and meet demands from customers. While Gunal and Karatas [21] considered SF as an intelligent production plant that enables machines, products, human, and other industrial components to connect with each other and share their information. Researchers also utilised alternative terms such as smart manufacturing (SM) and factory-of-things to describe SF [22,23]. Although there was no consensus on the SF definitions, these definitions all highlighted the use of advanced technologies and data exchange in the manufacturing process to realise intelligent production.
As noted in O’Donovan et al. [24], SF is driven by huge amount of data collected in the manufacturing process for operation management from the production of products to their distribution, rather than traditional manufacturing that only focuses on production. Obviously, both production and distribution are two essential stages of products: (1) production focuses on the process of converting raw materials to resulted products [24]; and (2) distribution emphasises the activities made to ‘move and store a product from the suppliers to a customer in the supply chain’ [25]. Accordingly, distribution involves the process of delivering materials from suppliers to receivers (logistics) and transferring products from the suppliers to customers (sales) [26]. In this study, we thus focus on both production and distribution stages of products in the SF context.
2.4. Related Studies on Data Quality in Smart Factory
A considerable number of review studies have been published on the topic of DQ in the context of SF/SM as shown in Table 1. For example, Thoben et al. [27] looked at DQ as a technical research issue that influences the adoption of Industry 4.0 and SM. They outlined two main challenges of DQ in SM: (1) integrity of captured and communicated data and (2) heterogeneity of manufacturing data for a product in the entire life cycle, together with possible solutions to address these challenges. Thereafter, Sundarraj et al. [28] reviewed different types of data governance in the context of SF for ensuring DQ. Additionally, Emanuel et al. [8] identified data management requirements on the SM implementation, including establishing DQ standards and continuous DQ check for the IS integration, based on DQ dimensions. The researchers included DQ management as a component in their proposed data management framework for SM applications. During the same period, Cui et al. [9] examined big data technologies in SM and discussed data issues in manufacturing and data management tools to address DQ. However, DQ was not the focus of these review studies and the researchers only included DQ as an aspect in their study context. The research on DQ in SF is still fragmented that may impede the understanding of developments and trends of this field.

Table 1.
An overview of related studies on DQ in SF/SM.
To address this limitation in the literature, the study [29] reviewed the dimensions of DQ, and developed steps of building a monitoring system for improving DQ in SM. In this review, we focus on DQ affecting BDA in the SF context, not only capturing fundamental research facets of this area (i.e., publication trends, research methods, and study contexts) but also looking at research themes, DQ issues for BDA, and methods used to address these issues in the SF context. This assists in the tasks of drawing a clear picture of trends on DQ affecting BDA in SF and disclosing potential areas for future research. Our study links the DQ issues to the DQ dimensions with the definition that helps data analysts define and assess DQ for BDA and discover DQ issues for solution. The findings from the SLR also benefit decision makers in strategising solutions to address DQ in the SF context and facilitate use of high-quality data in BDA for digital symmetry to achieve SF benefits.
Our SLR differs from the existing review studies on DQ in SF/SM in the following ways:
- Timeframe of review: The timeframe of our review is up to 2020 for collecting all relevant studies developed during this period.
- Included studies: We only included the empirical studies that followed research methods such as case study, survey, and experiment on DQ affecting BDA in SF.
- Focus of review: Our study focuses on DQ for BDA in the SF context, analysing and synthesising research themes, issues of DQ for BDA, and methods used to address DQ issues in the SF context, as well as establishing relationships between these results from the reviewed studies to better understand this phenomenon.
3. Research Methods
This systematic review of DQ affecting BDA in the context of SF is conducted following the well-defined SLR guidelines [11], consisting of four steps: (1) defining the scope of the review; (2) searching the initial list of articles; (3) selecting relevant articles; and (4) analysing data from the included articles. Figure 2 describes the research process of this SLR.
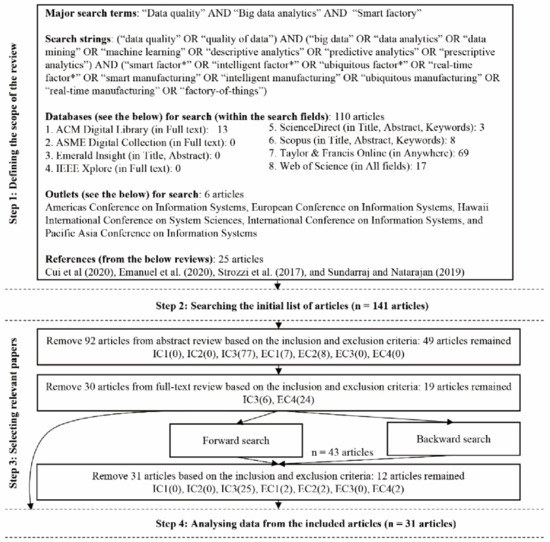
Figure 2.
The research process of this SLR.
3.1. Defining the Scope of the Review
This step includes four main activities: establishing inclusion and exclusion criteria of an article in the data sample, identifying appropriate fields of research, selecting databases and outlets, and formulating search terms [11].
3.1.1. Establishing Inclusion and Exclusion Criteria
Our study applies the following inclusion and exclusion criteria to screen the articles, as shown in Table 2.
Table 2.
The inclusion and exclusion criteria employed in this study.
3.1.2. Identifying Fields of Research
Since SF is based on a wide range of software and automation systems, this study identifies a corpus of research articles that cover various research fields such as Engineering, IS, Information Management (IM), and Computer Science to establish an exhaustive view on the field of DQ for BDA in SF.
3.1.3. Selecting Databases and Outlets
We utilised eight databases as the initial resources for the search as advised by relevant review studies in this field [8,9,22,23]. The eight databases used in this review are: ACM Digital Library, ASME Digital Collection, Emerald Insight, IEEE Xplore, ScienceDirect, Scopus, Taylor & Francis Online, and Web of Science. These databases include the potential largest set of peer-reviewed and English literature on the topic of interest, assisting in the tasks of identifying relevant research articles in this area as much as possible. As DQ for BDA in the SF context is an essential issue in interdisciplinary research areas such as IS and IM fields [30,31,32] where contributions are published in a wide variety of outlets (see Figure 2), we also used these outlets as sources to conduct a manual search in this SLR. Additionally, we included a list of references provided in related studies on DQ in SF [8,9,23,28], to identify relevant articles that might be missing in our search. To enrich the data sample for analysis, we further used the search engine Google Scholar to conduct backward (namely, identifying new papers from the reference list of the included articles) and forward (namely, finding citations to the articles) reviews [11].
3.1.4. Formulating Search Terms
Informed by our objectives and RQs, we identified the following three major search terms: ‘data quality’, ‘big data analytics’, and ‘smart factory’ for our SLR. In this study, we differentiated the definitions of data and information, and we limited to the theoretical lens of DQ. We therefore only utilised the alternative term ‘quality of data’ in the search to describe ‘data quality’ as suggested by the study [33]. Before generating the synonyms and alternative terms for the major search term ‘big data analytics’ and ‘smart factory’, we performed a preliminary survey on the existing literature reviews of BDA and SF/SM. From these literature reviews of BDA [34] and SF [22,23], we came up with the following alternative words for ‘big data analytics’ and ‘smart factory’ that were most frequently used in the literature, as shown in Table 3. Accordingly, our search began with those keywords by using the Boolean operators as the following search strings: (‘data quality’ OR ‘quality of data’) AND (‘big data’ OR ‘data analytics’ OR ‘data mining’ OR ‘machine learning’ OR ‘descriptive analytics’ OR ‘predictive analytics’ OR ‘prescriptive analytics’) AND (‘smart factor*’ OR ‘intelligent factor*’ OR ‘ubiquitous factor*’ OR ‘real-time factor*’ OR ‘smart manufacturing’ OR ‘intelligent manufacturing’ OR ‘ubiquitous manufacturing’ OR ‘real-time manufacturing’ OR ‘factory-of-things’).
Table 3.
Synonyms and alternative terms for the major search terms.
3.2. Searching the Initial List of Articles
In this step, we customised the search with the developed search strings in the selected online databases (mainly in the fields of Title, Abstract, and Keywords to centralise the search of this review) to identify the initial list of articles as shown in Figure 2.
3.3. Selecting Relevant Papers
This step is to screen relevant articles from the initial searched research publications for further analysis. We identified 141 articles, of which 92 were discarded in the abstract review according to our inclusion and exclusion criteria. After full-text review, we further removed 30 papers based on IC3 and EC4. In the backward and forward reviews, we identified additional 43 papers of which 12 articles were retained after the abstract and full-text review, based on inclusion and exclusion criteria as well. Finally, a total of 31 articles remained eligible for analysis (see Figure 2). Each article was given a unique identifier (the letter S followed by a number) so the article can be referenced in the analysis and reporting of the findings, in order to distinguish with the references that are not the included studies selected based on our inclusion and exclusion criteria in this review. All included articles of this SLR are presented in Appendix A.
3.4. Analysing Data from the Included Articles
We designed a data extraction form to extract the demographic data from the included articles, such as title of article, authors, publication year, name of outlet, research methods, and study contexts of DQ affecting BDA in the SF context. We then analysed and coded the description and details in the text of each selected article in relation to our RQs using content analysis technique [35]. However, not every article addressed all our RQs (i.e., research themes, issues of DQ, and methods used to address DQ issues, in the SF context). We thus extracted and recorded relevant responses from the included articles for the RQs into the form. Thereafter, we grouped similar content based on each RQ and gave each group an appropriate name through thematic analysis [36]. Finally, we mapped the DQ issues to DQ dimensions and the methods of addressing these issues identified from the studies being analysed and discussed our findings. In this article, due to the extensive use of acronyms we also provide relevant definitions in Appendix B for better understanding these acronyms.
4. Results
This presents the results of data analysis from the reviewed studies. We first describe the demographics of the included studies to understand the characteristics of the studies on DQ affecting BDA in SF. Thereafter, we provide the findings derived from the analysis and synthesis of the reviewed studies that address the RQs proposed in the SLR.
4.1. Demographics of the Included Studies
In this subsection, we present an overview of the characteristics of the reviewed studies from three main aspects: publication trends (in Section 4.1.1), research methods (in Section 4.1.2), and study contexts of DQ affecting BDA in SF that have been investigated in the reviewed studies (in Section 4.1.3).
4.1.1. Publication Trends
We observe a significant increase of the number of publications related to DQ affecting BDA in SF since 2016 in this review, as shown in Figure 3. This phenomenon may be due to (1) the promotion of advanced technologies (e.g., Internet of Things [S6, S21, S28, S30], wireless sensor network [S7], and mobile crowd sensing [S4]) widely used in SF that brings challenges in dealing with high-frequency collection of sensor data for BDA, and (2) the increased use of BDA tools for supporting computer and/or human decisions in production and distribution management that heavily rely on high-quality data [S1, S2, S8, S16, S22, S23].
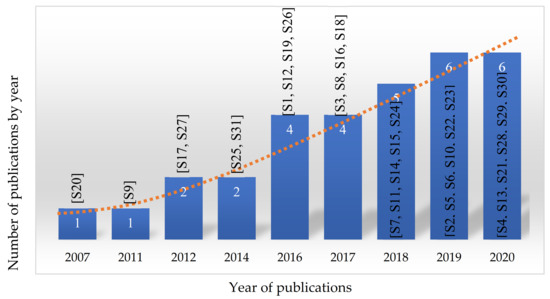
Figure 3.
Publication trends of the reviewed articles.
To better study and understand the publication trend, we analysed the titles and abstracts of the included studies. Figure 4 presents a co-occurrence map based on the analysis of titles and abstracts of the reviewed articles. For developing this figure, the titles and abstracts extracted from the included studies and imported into VOSviewer software to visualise the results. The frequency of the terms used in the titles and abstracts creates clusters that appear closer to each other with the same colour based on the publication year. As shown in Figure 4, data, system, process and approach are the terms frequently mentioned in the included publications.
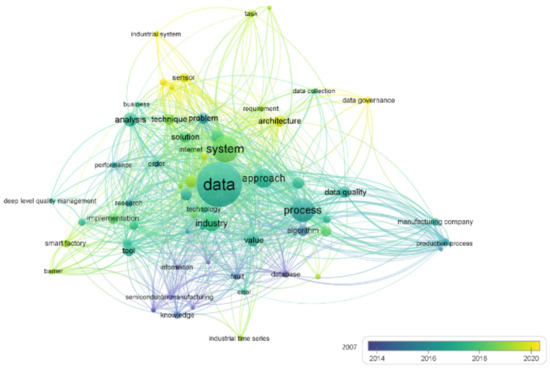
Figure 4.
The co-occurrence of the keywords based on the title and abstract of the included papers in this review. Nodes represent specific terms used in the titles and abstracts. Size of nodes represents the frequency of occurrence on the terms. A link between two nodes represents co-occurrence of the terms used in titles and abstracts.
From 2007 to 2020, the data contexts investigated in the relevant research on DQ for BDA in the SF context have transferred from database to sensor/Internet of Things (IoT) due to new technologies applied in the factory. The focus of solutions for addressing DQ have moved from algorisms to data governance and (IS/IT) architectures, and researchers are more likely to gain insights into requirements and barriers on achieving DQ for BDA than identifying data faults and errors, in order to monitor and control DQ before the occurrence of DQ issues.
4.1.2. Research Methods
We reviewed the research methods that have been used in the included 31 articles. First, we obtained the research methods that have been explicitly mentioned by the respective authors in their conducted research, including case study, experiment, and survey. Then for those studies which have not mentioned their research methods, we assigned them to the corresponding groups referring to the reviewed studies that adopted similar research methods. In this light, we generated the distribution of the research methods utilised in the included studies, as shown in Table 4. This improves the understanding about what research methods have been adopted, benefiting for both researchers and practitioners in conducting similar studies of addressing DQ for BDA in SF.
Table 4.
Distribution of the research methods used in the reviewed studies.
4.1.3. Study Contexts of DQ Affecting BDA in SF
We also identified the product stages in SF and the systems of data sources in which DQ issues for BDA have been studied in the reviewed 31 studies. Investigating the characteristics of these study contexts contributes to revealing research hotspots and potential areas for further exploration in this field. There were a number of themes in relation to product stages emerging in the data analysis that require a way to study and understand them. Hence, we first collected a flat list of the terms used in the included studies to describe the product stages and then referred to the definition of production and distribution of products as presented in Section 2.2 (as the focus of this study is on these two stages), to assign the reviewed 31 studies. Furthermore, we also assigned the systems of data sources that have been explicitly mentioned in the reviewed studies to the product stages, as presented in Table 5.
Table 5.
Allocations of the included studies on the stages of products associated with systems of data sources concerning DQ that influences BDA in the SF context in this review.
4.2. Findings for the RQs
In this subsection, we present the findings from the SLR for addressing the proposed three RQs. Section 4.2.1 addresses RQ1 presenting research themes that address DQ for BDA in the SF context. Section 4.2.2 addresses RQ2 describing DQ issues affecting BDA that have been investigated in the SF context. Section 4.2.3 addresses RQ3 summarising methods that have been used to address these DQ issues in this review.
4.2.1. Research Themes of DQ Affecting BDA in the SF Context
Through content and thematic analysis, in this review we identified a set of research themes that address DQ for BDA in the SF context, these are: production scheduling, process monitoring, quality tracing, fault detection, predictive maintenance, and process optimisation. See Table 6. This table is developed by three steps. Firstly, we identified sentences from the reviewed 31 studies that were used to present their specific objectives on addressing DQ for BDA in the context of SF. Secondly, we summarised these sentences into phrases and grouped them based on their similarity. Lastly, we gave each group an appropriate name referring to the key terms that have been explicitly mentioned in the identified sentences. Table 6 also lists a description for each research theme with relevant literature for better understanding these themes.
Table 6.
Research themes on DQ affecting BDA in the SF context in this review.
As shown in Table 6, dealing with DQ helped prepare high-quality data used in BDA for various SF objectives. For instance, data addressing DQ was used in BDA to plan tasks sequency of machines [S10], schedule production jobs [S12, S25, S26, S29], and support automated production [S22] that referred to production scheduling. Furthermore, high-quality data assisted in better understanding the operating status of machines [S4, S7, S11, S28], product movements [S19, S21], manufacturing process [S13, S20, S26], and inventory status [S31] in SF (namely, process monitoring). In this review, authors of the studies [S1, S9, S16, S17, S18, S20, S26] highlighted the role of quality-assured data in identifying root causes of product quality failures for yield improvement. Researchers also relied on high-quality data to detect faults in the performance of machines [S2, S5, S6, S8, S14, S15, S20, S23, S24, S29, S30] that was the theme most frequently studied in the SLR, and predict when machines may fail and deploy predictive maintenance [S8, S15, S23, S29, S30], ensuring safety of working environment in SF. It was also important to take DQ into account for manufacturing/technological process optimisation by predicting performance of products and machine tools prior to build them and improving their design and development [S3, S27, S29].
We also analysed these research themes based on the co-occurrence matrix of these terms developed from Table 6 and fed the data into the Gephi software to generate a co-occurrence map, as shown in Figure 5. It is evident that both fault detection and predictive maintenance were frequently investigated in one singe study. This may be due to that the quality-assured data was used to diagnose the health status of the equipment and at the same time this data can be also used to predict the working life of the equipment for early warning their downtime.
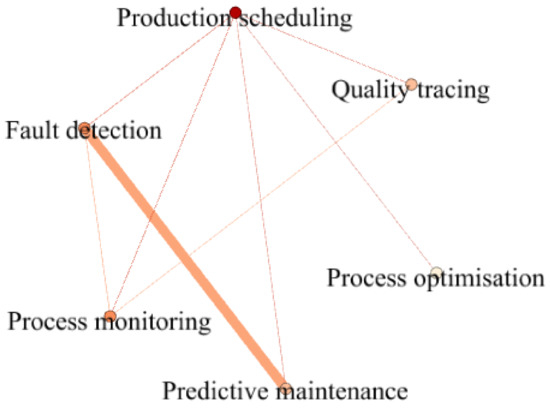
Figure 5.
The co-occurrence of the research themes of the included papers in this review.
4.2.2. DQ Issues for BDA in the SF Context
In this SLR, we identified and analysed six common DQ issues for BDA in the SF context and associated DQ dimensions described in the included studies, as presented in Table 7. Column one of this table presents the terms used in the reviewed studies to describe DQ issues for BDA, and we employed the terms that were most frequently applied in the literature to name the DQ issues grouped based on their similarity. Column two of the table gives examples from the included studies to explain these DQ issues. Column three of the table lists the DQ dimensions concerning relevant DQ issues that have been explicitly mentioned in the reviewed studies together with the terms presented in ISO25024 Measurement of DQ to describe these DQ dimensions. Column four of the table present definition of DQ dimensions derived from ISO25024. Column five of the table elaborates all examples used in the included studies to define these DQ dimensions. The following paragraphs describe the DQ issues together with all root causes of these issues identified from this review, according to actual experience or empirical findings of the respective authors.
Table 7.
DQ issues for BDA in the SF context that have been studied in this review.
Missing data. Missing data (miss values) was the most frequently studied DQ issue for BDA in the SF context, being an area of focus in 48% of the included studies. Missing data was considered as the DQ issue in relation to completeness dimension [S12, S15, S21, S26, S31] (alternative term of completeness utilised in this review identified was integrity [S9]). This DQ issue for BDA in the context of SF aroused by various reasons from either technical or non-technical perspectives. From the technical perspective, the root causes of missing data included sensor errors [S2], transmission faults [S2, S7, S21], energy limitations [S7], lack of data update [S17], and saving errors [S21] that influence the collection of required data, resulting in data incompletion or deficiency for BDA. From the non-technical perspective, the lack of data management awareness limited necessary data collection, leading to inadequate data availability [S3]. Furthermore, the sampling inspection of manufacturing processes for the process optimisation purpose incurred missing data in the process datasets used for BDA [S27]. Authors of the study [S27] indicated that in the sampling inspection process, input variables are all inspected by automated sensors of the main processing machines, while not all output variables are inspected to address time-consuming and cost-effectiveness problems as these outputs are measured by other specific inspection machines but not from the main processing machines. The portion of missing data collected from this process is thus high.
Anomalies. Anomalies, the data deviating from the true patterns of normal data [S6], were the second frequently studied DQ issue for BDA in SF in this review. Anomalies could emerge when system/equipment faults [S14], errors in sensor recording [S2, S4, S14], or human errors (e.g., fake data or incorrect orders submitted by users) [S4, S12, S14, S22] appear in the SF context. Outliers were considered as similar DQ issues as anomalies [S4]. An abnormal value (an outlier) could be a data error [S2, S4] due to system/equipment, human, or sensor faults [S14]. Meanwhile, an abnormal value could be a potential indicator of significant events representing unplanned changes in the context of SF [S6, S28] (e.g., occurrence of unexpected equipment failures). Hence, DQ issues concerning anomalies are data errors (imprecise data [S2], incorrect data [S12, S23], and fault data [S16]).
Noisy data. Noisy data (noise) was identified as the third frequently studied DQ issue for BDA in SF in this review, being considered as the data that was out of all potential values [S6]. Noisy data could be caused by featuring problems of machine working environment [S5] and reading/sensor errors [S6]. For instance, a data acquisition system for collecting machine performance installed in harsh working environments of machine can produce interferences and electronic noise is prevalent [S5]. Hence, data of equipment performance collected could have noise. Additionally, as noted in [S6], due to reading errors or sensor errors, the data detected at the sensors could produce inaccurate data, resulting in noise during the process of data collection.
Both anomalies and noisy data were identified as the DQ issues related to data accuracy. Other terms used in this review to describe accuracy dimension contain correctness and validity. Although both anomalies and noise data are different from normal data points, a few studies attempted to compare anomalies with noise data: anomalies derive from normal data but still locate inside the range of potential reasonable values [S6], which could indicate an occurring event/situation [S28]; while noise is completely erroneous [S6], impeding the understanding of true data [S28]. In this review, anomalies identified could be data errors or signals for an event. Hence, anomalies referring to data errors are treated as the DQ issues as noisy data.
Data inconsistencies. Data inconsistencies was defined as data elements from multiple data sources embracing contradictions [S12]. This type of issues concerned DQ issues under consistency dimension [S12, S26]. The issues of data inconsistency can be caused by signal interference [S2] and timestamps problems for production process steps [S12, S25, S26]. For example, when equipment transforms its working condition, this may generate signal interference and relevant data failed to be recorded at that time [S2]. Hence, issues of data inconsistencies exist during a certain period of time. Authors of the studies [S12, S25, S26] pointed out that problems of timestamps (e.g., time overlaps and inconsistent start and end timestamps) for recording data on consecutive process steps of production could cause inconsistencies in the datasets. Researchers also revealed that inconsistent data could arise from lack of policies and processes of data governance [S13]. To specify, imprecise naming of data objects and undefined rules for assigning a data object could result in the data stored in different departments of a company with different structures [S13]. Such data silos thus raise the amount of data inconsistencies.
Data redundancies. Data redundancies referred to the presence of duplicates toward the same observation in many places [S9]. Redundant data was identified as the DQ issues on consistency dimension [S13] and this finding is in an agreement with prior research [37]. Other term of DQ dimension used in the included studies for addressing this issue was repeatability [S10]. Data is considered as duplicate when the same values appear in multiple columns across all records [S9]. While a few researchers indicated that partial duplicates exist when more than one row is related to the same observation, but the values in these rows are not the same [S23]. An example of the causes of data redundancies is data over-acquisition. In the SF context, because the frequency of data sensoring and reading is very high [38], amounts of manufacturing data created could have data redundancies [S11]. Additionally, the aforementioned data silos due to missing policies and processes of data governance could also incur redundant data [S13] when the data for the same observation is stored in different departments of a company, in different data structures without any extensions.
Old data. Old data concerned the data that is out of date [S11, S18], being considered as the DQ issue about currentness dimension. The alternative term used in the reviewed studies to describe currentness dimension was timeliness [S15, S31]. Researchers looked at the causes of old data from two perspectives. Firstly, essentially, the data itself is static, as noted in [S11]. The data after over a period will become antiquated [S11]. Secondly, since communication between devices in SF is time-consuming, this is prone to low data update rates [S17]. As a result, the data is not updated at a desired time point that impairs currentness.
Similarly, we present a co-occurrence map based on the analysis of these DQ issues identified in the included studies in Figure 6. According to Figure 6, DQ issues related to completeness, accuracy and/or consistency dimensions could appear at the same time that might be the major challenges encountered by researchers and practitioners in practice required more efforts for resolution.
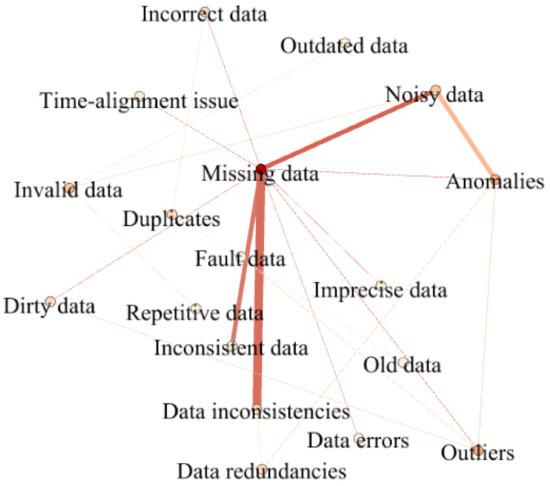
Figure 6.
The co-occurrence of the DQ issues identified from the included papers in this review.
4.2.3. Methods Used to Address DQ Issues for BDA in the SF Context
This subsection describes the methods that have been used to address DQ issues for BDA in the SF context. By using a similar analysis process summarised in Section 4.2.2, we identified problem-solving methods from the included studies. Furthermore, we mapped these methods to the corresponding DQ issues presented in the literature, as shown in Table 8.
Table 8.
Methods used to address DQ issues for BDA in the SF context in this review.
In Table 8, the methods used to address DQ issues for BDA in the SF context are divided into two main groups: technical and non-technical methods. The technical methods refer to statistical and computational methods to address DQ, while non-technical methods focus on organisational, managerial, and procedural aspects for dealing with DQ issues affecting BDA in the SF context.
Technical methods used to address DQ issues. Ten methods identified in our SLR are grouped into this category. As shown in Table 8, data imputation, case deletion, anomaly detection, data visualisation, and clustering analysis were the prevalent technical methods employed to address DQ issues for BDA in SF identified from the present study. For database commit, matching values method, ontology-based sematic enrichment, computational conformance checking, and adaptive correction threshold method, only one study mentioned one of these methods in this review. To achieve a balance between paragraphs presented for these technical methods, we thus describe the aforementioned five common methods in different paragraphs and summarise the rest methods in one paragraph.
- Data imputation. This method refers to replacing missing data or inaccurate data with plausible values from the sample data [S1, S2, S7, S12, S21, S25, S26, S27]. Plausible values were identified through a k-nearest neighbour algorithm (kNN) [S1, S12], a decision trees approach [S12], or a last observation carried forward method [S7] used in a raw dataset, algorithms (e.g., kNN, naïve Bayes classifier, association rule induction algorithm) used in a clean sample dataset [S26], combination of domain knowledge and a clean sample dataset [S2], sequence patterns learned from the whole dataset [S3], seasonal-trend decomposition and recomposition [S21], cold deck imputation [S25], and multiple imputation [S27]. These methods helped estimate a best guess value and were commonly used to fill data and minimise bias, addressing DQ issues such as missing data, anomalies/ noisy data, and data inconsistencies. However, these imputed data values are not real data, and their uncertainty need to estimate [39]. Case deletion. In this study, case deletion is defined as deleting the case of interest from a dataset. For example, null columns [S9] and the cases with missing values [S19, S20, S27] identified were removed directly from the dataset. When the values were out of potential ranges defined based on domain knowledge, these values considered as noise were deleted [S6, S28, S30]. This method was also utilised to address duplicates by deleting and replacing old data if a newer update exactly occurred [S18]. Case deletion is a simple method of dealing with DQ issues for BDA in SF, while it may miss potential information when discarding incomplete data and bias the results of BDA [S27].
- Anomaly detection. This method aims to identify the patterns of a dataset deviated from expected patterns [S6]. Unexpected changes in data values or patterns were recognised as anomalies according to understanding of machine working conditions [S2, S15], for example. A few researchers determined an anomaly when the value was out of defined ranges [S4, S6, S8, S30] or the data point had large distance deviated from normal ones [S28]. This method is commonly utilised to reveal noisy data and its root causes for solution. However, effective use of the method relies heavily on knowledge of manufacturing process [S2], in the SF context.
- Data visualisation. This method enables users to visualise data production process. For example, authors of the study [S2] developed a module that allows users to visualise abnormal detection and interact with anomalies (i.e., modify and label anomalies and upload manual repairing results). This method also was adopted to discover anomalies [23] and observe missing data [S31]. Data visualisation contributes to monitoring and controlling DQ [S31], while having challenges in displaying a large amount of information extracted from the dataset [40].
- Clustering analysis. This method pertains to classifying the data based on data characteristics. By using clustering algorithms, two studies [S16, S19] divided anomalies into groups based on data similarity and analysed the cause of these anomalies to distinguish between indicators of an event and noisy data. In this light, the identified fault data was filtered out for BDA. Clustering analysis method helps classify the data without references and disclose DQ issues, while this method only performs well with the guidance of industrial domain knowledge [S16].
- Database commit was utilised to update data in the database when receiving new records, assisting in addressing issues of old data [S18]. Matching inconsistent values method focused on constructing a classifier based on training dataset to obtain matching patterns and repairing inconsistent data based on the learned patterns [S2]. For ontology-based sematic enrichment, authors of the study [S11] referred to an ontology created for both input and output flows of a data inventory. This method addressed the differences in data interpretation from multiple sources by semantic enrichment that help avoid repetitive data created. Computational conformance checking aimed to automatically identify and diagnose root causes of data errors such as sensor faults, human faults and system/equipment faults and send alerts to system mangers for dealing with these issues [S14]. While an adaptive correction threshold method was used to identify the impact features of noise and reduce the invalid data for BDA [S5].
Non-technical methods used to address DQ issues. In this SLR, we identified five non-technical methods that are related to data governance [S13, S29] used to address DQ issues affecting BDA in the context of SF, as presented below:
- Organisational structure design referred to creating an organisational unit for data governance and dividing responsibilities within an organisation. According to the studies [S13, S29], to better deal with DQ issues for BDA, a group of people in an organisation was defined and they had responsibilities for implementing data governance. Every employee also had defined responsibilities to complete tasks of addressing DQ. In this light, actors worked toward a common goal to achieve high-quality data for BDA in the SF context.
- Organisational culture cultivation concerned a cultural change across all levels and attitude shift about transformation from traditional manufacturing to data-driven SF [S29]. When top management level and staff members understand the impacts of DQ issues and added values of using BDA for SF, they are more likely to put efforts in dealing with DQ. Furthermore, creating a problem awareness and motivation could help drive employees to follow defined rules in routine data practices and support changes required in this transformation.
- Regulation formulation addressed defining rules and conventions for data practices. As noted in [S13, S29], a universal, easy-to-follow and detailed rule for creating data associated with DQ requirements and policies of standardised documentation and storage locations helped govern data collection and storage to reduce missing data and data inconsistencies that prepare quality-assured data used for later BDA toward SF.
- Data architecture standardisation dealt with defining an architecture for combing different data sources and structures. The amount of manufacturing data is collected from multiple sources and within diverse structures and requires a well-defined architecture for data organisation and integration in order to address heterogeneity problems [S29]. Such a data architecture also helps decrease DQ issues such as missing data, data inconsistencies and redundancies by clarifying the naming of data objects [S13, S29].
- Process management pertained to monitoring and controlling data practices in manufacturing processes. As mentioned, intelligent transformation of companies could incur changes, communication and documentation of changes are needed to deal with in this process [S13]. These activities related to process management could help employees improve the understanding of SF benefits and its difficulties in the implementation, and they can be guided to address DQ issues in practices. Furthermore, monitoring the process of production and distribution also assisted in revealing DQ issues and their root causes for addressing these issues in time [S14].
We also developed a co-occurrence map based on the analysis of the methods used to address DQ issues identified from the included studies (see Figure 7). We observe that non-technical methods interacted with each other for dealing with DQ were commonly investigated in one single study. However, their applications were isolated with the use of technical methods in the reviewed studies. In other words, limited attention has been paid to: (1) the integration of both technical and non-technical methods used to address DQ issues and (2) their performance and impacts on achieving DQ.
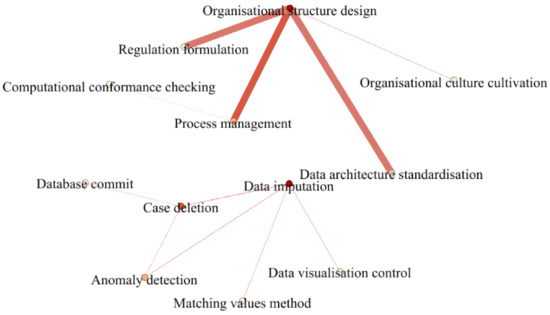
Figure 7.
The co-occurrence of the methods used to address DQ issues identified from the included papers in this review.
5. Discussion
In this section, we present our findings of this SLR that address the RQs proposed in the Introduction. We discuss these findings in the area and present potential opportunities for further exploration. Then we provide implications and limitations of this study.
5.1. Trends of DQ Affecting BDA in SF
As shown in Figure 2, this study reveals an increase in the number of empirical studies of DQ affecting BDA in the SF context. Eighty-one percent of the included articles in this SLR were published in the last five years (from 2016 to 2020). We also investigated the research methods used to conduct empirical studies in this field that reveal the characteristics of prior relevant studies and give implications for future research design. As shown in Table 4, case study was the most prevalent research method employed in this review. The majority of studies adopted this research method to gain a deep understanding of manifestation of DQ issues and their root causes and how technical and non-technical methods were used to address these DQ issues. The second popular used research method in this review was experiment that concerns the development and validation of proposed statistical and/or computational methods utilised to address DQ issues. Only two studies [S3, S22] identified in this review applied the survey research method to identify DQ issues and their root causes.
To better facilitate empirical findings, future studies could take the following items into account. The study based on a single case study context needs to be repeated in multiple cases to further validate results and improve the generalisation of research findings [S13, S15, S25]. Comparison of similar methods for addressing a DQ issue is recommended in the experiment study, assisting in gaining insights into the benefits and limitations of these methods [S5, S7, S12, S21, S26, S27]. This thus could offer the clues to select appropriate methods to address the DQ issue and may drive further improvement of the methods. Questionnaire survey can help collect larger data sample across geographic areas in order to enhance the strength of causal inferences being drawn from research findings based on interviews and measure the extent to which DQ issues influence BDA [S3, S22] to achieve the digital symmetry in the SF context. There is also an evident lack of time studies on evaluating: (1) the performance of methods used to address DQ issues for improving the quality of BDA products and (2) the added values in companies by using these methods. Such a time study could probe the longer-term benefits of addressing DQ in BDA for the symmetry of physical and virtual manufacturing worlds and improve the awareness of dealing with DQ for BDA, in the SF context.
This review reveals that DQ affecting BDA in SF has received much attention in the production context, e.g., smart planning and optimising production, product quality control, production process monitoring, and smart equipment maintenance. This is not surprising as SF is the automatic production solution of processing raw material to produce products to achieve customers’ demands and ensuring DQ for BDA products plays an essential role in realising SF objectives inside the plant. While Table 4 also shows a portion of empirical studies [S3, S4, S13, S14, S19, S31] (19%) investigating DQ issues and opportunities for application of BDA in distribution management such as designing, planning, and controlling the flow of materials through the factory as well as delivering products to customers that will become research hotpots in this field. This implies that researchers have extended the research scope on addressing DQ issues of BDA for SF objectives outside the plant. In this review, we found that only a few studies pointed out their systems of data sources for dealing with DQ. Investigating systems of data sources and understanding data flows among these systems contribute to standardising IS/IT architecture for achieving DQ requirements in both production and distribution process simulated in digital twins that need to be further explored. Furthermore, we also did not encounter any studies that published their big data on SF. The included studies played with the data derived from their cooperated company for addressing DQ. Future studies are therefore encouraged to share the experiment data with the approval of cooperated company for research reference.
5.2. Findings Addressing Research Questions
After discussing the trends of DQ affecting BDA in SF for the reviewed studies, we now give an overview of the findings aligned with each of the RQs below.
RQ1: What are the research themes addressing DQ for BDA in the SF context have been studied?
Findings: The research themes identified in this review contained production scheduling, process monitoring, quality tracing, fault detection, predictive maintenance, and process improvement.
To be specific, BDA discovers the association among production factor data, production process data and environment data to shed lights in production scheduling rules, assisting in the formation of production scheduling. High-quality data used in BDA facilitates dynamical and real-time adjustments to avoid high-risk tasks and ensure the production tasks completed on schedule. As for process monitoring, BDA helps predict the trend of energy consumption and give timely warning of possible or existing abnormal and excessive energy use, based on the collected high-quality data. In terms of quality tracing, an analytics model built upon quality-assured data contributes to identifying the root causes of products quality’s problems and proposing solutions to address the problems that help reduce the number of products rework and improve the one-time pass rate of products. Furthermore, BDA can help diagnose the health state of equipment, predict the working lifetime and possible faults of the equipment, and make plans in advance before the equipment fails, from the collected real-time equipment operation data and historical data. Based on this data, BDA can also disclose the relationships between technological parameters and quality and quantity of products to determine the range of optimal process parameters used in digital twins. In the light of this, the production processes can be adjusted and improved to maximise the SF efficacy and effectiveness.
Essentially, DQ that influences the quality of BDA products for achieving the aforementioned objectives can be ensured by multiple types of data in the SF context. For example, the historical data is updated and expanded with the real-time data joining and the real-time data can be also validated and corrected using the knowledge gained from the historical data. The physical data can be assessed and simulated by the virtual data and this virtual data can be also compared with the physical data to ensure its accuracy. As digital twins that address the physical-virtual convergence has increasingly received attention in the SF context, this produces ‘bigger’ data related to the virtual products, the physical products and their back-and-forth interactions for the creation of BDA products, in order to achieve SF objectives. A new guideline/framework utilised to deal with the quality of the data converged, integrated, and synchronised in symmetries and simulations in digital twins for SF objectives will be the research topics in the area.
RQ2: What are the issues of DQ affecting BDA that have been studied in the SF context?
Findings: The DQ issues identified from the data analysis on the included studies were divided into six groups, namely missing data, anomalies, noisy data, data inconsistencies, data redundancies, and old data.
In Section 4.2.2, we have given the definitions and examples on these DQ issues, linked the issues to the corresponding DQ dimensions, and provided the root causes on the issues. By mapping DQ issues to the corresponding DQ dimensions, we found that completeness, accuracy, consistency, and currentness were the DQ dimensions mainly concerned in this review. According to ISO25024, completeness concerns: (1) the entity that exists and (2) the values that are available for all expected attributes toward the entity. Missing values/data, null values, incomplete data and inadequate data availability are the manifestations of DQ issues related to completeness. While accuracy refers to the data that correctly represents the true value of the subject. Anomalies, abnormal/imprecise/ incorrect/ fault/noisy/dirty/invalid data, data errors, and outliers represent the DQ issues under the accuracy dimension. Consistency addresses the data that is coherent and compatible with other data. That is to say, data from different sources used to describe the same subject is consistent and this data does not appear in unnecessary places. Hence, inconsistent/ repetitive data, and duplicates are the DQ issues in relation to the consistency dimension. Currentness pertains to the data that is of the right age, and outdated/antiquated data and old data are observed as the DQ issues of this dimension.
Although the DQ dimensions and their definition differ from each other, the analysis of the six DQ issues in Section 4.2.2 reveals that they interact with each other and the DQ issue of a certain DQ dimension could trigger the issues related to other DQ dimensions. For instance, when data is not updated at the expected time of interest, the data collected could be outdated [S11, S17] or missing [S17] that is related to DQ issues under currentness and completeness dimension. Consequently, data inconsistencies could also occur during this period [S2]. This data cannot represent real situations in SF, reflecting the DQ issues of accuracy dimension [S26]. Understanding DQ issues and relationships among these issues and identifying their root causes are the first step of addressing these issues to ensure the quality of the data used in BDA to achieve digital symmetry in the SF context.
With the DQ dimension advised by ISO25024, users can better understand DQ and identify DQ issues according to different DQ dimensions. Unfortunately, only two studies [S26, S31] adopted and defined the dimensions to describe DQ. As mentioned, defining and assessing DQ is a fundamental problem for improving DQ. Future research is suggested to refer to the DQ dimensions used in ISO25024 and/or prior studies to define and study DQ. This thus also calls for establishing a system of DQ requirements for production and distribution management simulated in the digital twins supported by BDA to achieve the symmetry of both physical and virtual manufacturing worlds (e.g., describing the DQ dimensions required for developing BDA products toward these two stages together with their specific definitions in digital twins and SF).
It is worth mentioning here that from a variety of SF applications nowadays many users are interested in Automated Optical Inspection (AOI) defect inspection or predictive maintenance diagnosis. Defining DQ for training an AI model used in AOI defect inspection or predictive maintenance diagnosis is a concern for users to reduce false alarms (false positive rate) and missed alarms (1 minus true positive rate (namely, recall)). Using the completeness dimension of DQ as an example, we can define DQ as the degree to which relevant data is detected for defect inspection. Then the results of DQ assessment contributes to understanding how good the data at hand is. Essentially, it is expected to achieve a high level of completeness toward required data elements used in an AI model training as much as possible, in order to maximise true positive rate and tolerate some false positive cases. Meanwhile users also need to take the model calculation and complexity into account for a trade-off between detection accuracy and calculation time in this process. Users should make decisions on the use of this data for defect inspection, based on the performance in reducing false and missed alarms and calculation time. For predictive maintenance diagnosis applications, at this time we can define DQ as the degree to which data contains proper information for predicting failures and similarly refer to the DQ assessment results to determine whether employ this data or go further a data processing (e.g., data imputation or case deletion). As mentioned, data quality is defined as both ‘fitness for use’ and ‘conformance to requirements’ [7]. In this article we might not cover all possible examples of defining DQ for training an AI model used in SF applications. We would like to open this to users and encourage users to (1) consider other DQ dimensions or the combination of multiple DQ dimensions for defining DQ in defect inspection and predictive maintenance diagnosis according to actual situations and specific manufacturing contexts and (2) discuss and compare the results of DQ assessment when using different strategies to define DQ in the study context.
RQ3: What are the methods used to address these DQ issues in the SF context?
Findings: The methods used to address DQ issues identified from the reviewed studies included technical and non-technical methods. The technical methods were data imputation, case deletion, anomaly detection, data visualisation, and clustering analysis, database commit, matching values method, ontology-based sematic enrichment, computational conformance checking, and adaptive correction threshold method. The non-technical methods were organisational structure design, organisational culture cultivation, regulation formulation, data architecture standardisation, and process management.
It is evident from Table 8 that the majority of the studies included in this review adopted technical methods to deal with DQ issues affecting BDA in SF. These methods mainly paid attention to DQ issues after data generation. While non-technical methods were used to deal with DQ before data creation and monitor and control DQ from data creation to data usage. Hence, based on a specific DQ issue in a specific context, appropriate selection (choosing one of these methods or combining some of them referring to their affordances and limitations as outlined in Section 4.2.3) these methods contribute to better achieving high-quality data used in BDA for achieving the symmetry in digital twins and SF.
DQ has been one of the major concerns in applying BDA in production and distribution management, especially for issues regarding missing data and anomalies/ noisy data as shown in Table 7. From the production perspective, most studies focused on scheduling production plans, controlling the quality of products, detecting equipment faults, and conducting predictive maintenance of equipment. Dealing with DQ in these production activities will remain as the research focus in this field, because the missions of BDA toward SF include (1) automatic production adapting to customers’ requirements and (2) safety and environmental protection with production. While from the distribution management, the focus of the included studies was on the issues of data completeness and accuracy that affect BDA in understanding the flows of materials in supply chain and transferring products. Although only one study [S18] provided the method used to address old data, both practitioners and researchers have presented a growing interest on collecting and using real-time data to improve accuracy of equipment supervision and process monitoring [S11, S17, S24].
By reviewing the relevant literature, we also found that limited attention has been paid to developing a framework of DQ for BDA in the SF context that guides enterprises to address DQ issues. Essentially, Wang [41] proposed a Total Data Quality Management methodology to facilitate the implementation of the overall DQ policy from top to down in an organisation, dealing with DQ from defining and measuring DQ, analysing DQ issues, and improving DQ to tools, methods and processes. Similarly, Wahyudi et al. [42] indicated that a process pattern model describes the underlying data processing activities with pathways assisting in better DQ improvement. Previous DQ methodologies and models disclose that technology is not the only determinator for DQ management/improvement and the integration of technology, processes and management is the significant enabler to guarantee DQ. The relevant methodologies and models thus can be contextualised and/or improved in the SF context to construct a framework of addressing DQ issues for BDA to support digital symmetry in the SF context. Such a framework can be implemented for both production and distribution stages through a DQ management/improvement platform.
In this SLR, most research focused on addressing the quality of the data collected from one single source. While in the SF context, machines and processes of production and distribution are connected in a manufacturing system. The industrial data in different formats derived from different sources is accumulated and integrated for BDA to provide a unified view of the data. For example, enterprises employ both industrial vision images and machine readings to describe the situation of equipment usage in different data formats, assisting in better monitoring the equipment usage, especially when incomplete data occurs in either vision images or machine readings. Here the focus is on identifying the relations between this data to describe the phenomenon of a production process or the use of equipment. At this time, unified data modelling is required to map the data model to the object model. And when the data is integrated together, query answering and automated reasoning over ontologies are then used to support DQ assessment [43]. Hence, developing ontology-based methods for DQ check toward the data integrated from multiple sources in digital twins for the symmetry of both physical and virtual manufacturing worlds will be another research hotpot.
In the era of IT, one of the hottest items is ‘blockchain’. Recently, more and more enterprises have increasingly realised application scenarios of blockchain technology, e.g., supply chain management [44]. The blockchain that helps systematically store data (e.g., using encryption algorithms to ensure the data stored and transmitted without unexpected manipulation) and enable all relevant parties to view this data, facilitates information sharing for the transparency purpose of distribution [45]. As such, the data practices are performed and the relevant data only can be written into the blockchain when these operations are verified and approved by the participated subjects through the entire network broadcasting [46]. If the data is inaccurate or cannot be recognised, the system will automatically refuse this data writing that contributes to ensuring data accuracy. The blockchain technology is thus a promising technical solution to address DQ for BDA to support digital symmetry in SF and its impacts on DQ that should be further empirically investigated.
5.3. Theoretical and Practical Implications
5.3.1. Theoretical Implications
The theoretical contributions of this study include a systematic review focusing on the empirical research that addresses DQ for DBA in the SF context, identifying relevant research themes, DQ issues and methods used to address DQ issues and linking DQ dimensions, DQ issues to the methods that furthers the understanding of this phenomenon. Firstly, addressing DQ for BDA products can help achieve multiple SF objectives at once time (e.g., production scheduling, process monitoring, and quality tracing [S26]) that might further the combination of diversified research themes investigated in a single study. Meanwhile, the research themes identified assist researchers who will undertake similar studies in determining the research scope. Secondly, the ISO standardised definitions for DQ dimensions contributes to the consistent use of the terms in the literature to define DQ in the realm of SF, and users also benefit from the definitions of DQ dimensions derived from the existing literature in Table 7 to define DQ for purposes. The analysis of the DQ issues related to DQ dimensions helps users understand these relations and identify a specific DQ issue under certain DQ dimension together with its root causes. Lastly, the affordances and limitations discussed for the methods used to address DQ issues in Section 4.2.3 might facilitates the appropriate selection and use of these methods for dealing with DQ and the improvement of the methods.
By further discussing the research findings, we also identify a set of possible areas for future research: (1) developing a new guideline/framework used to deal with the quality of the data in BDA to achieve the physical and virtual worlds’ symmetry in digital twins for SF objectives; (2) establishing a system of DQ requirements including DQ dimensions and their definitions for BDA to support digital symmetry in the SF context; (3) furthering relevant DQ methodologies and models toward BDA in digital twins and SF for DQ purposes; and (4) exploring new data scenarios (e.g., dealing with the data derived from multiple sources using ontology-based methods) or new methods (e.g., the integration of both technical and non-technical methods, and blockchain technology) to deal with DQ for BDA supporting digital symmetry and their impacts on DQ management and improvement in digital twins and SF.
5.3.2. Practical Implications
DQ affecting BDA in SF requires interdisciplinary and cross-department collaboration for improvement. For example, IS and databases experts are expected to provide guidelines on how to create, collect, store and use the data in the process of production and distribution. The experts of production and distribution are required to ensure that concerned problems in operation management relying on BDA products are captured and analysed [S31]. Engineers or IS/IT vendors should take DQ requirements in digital symmetry into account when establishing and deploying IS/IT architectures and data architectures toward SF. SF project managers are required to develop strategies and enhance communication and collaboration between departments for addressing DQ issues. Data analysts are needed to understand the quality of the data collected at hand and apply appropriate methods to address DQ before data analysis. Production and distribution managers should increase the awareness of using BDA products derived from high-quality data for decision-making [S31].
The research findings of this study can be applied in manufacturing practice in the following ways. Firstly, our findings of the DQ dimensions and their definitions will be interest to IS/IT architects who are developing the SF system and data analysts who are providing BDA products for digital twins and SF. Before data generation, the database schema of the system should be better designed based on the enterprise’s requirements for production and distribution management, assisting in addressing DQ from the very beginning of data creation. Hence, the DQ dimensions with their definitions identified in this study can serve as a reference for IS/IT architects to capture the SF requirements in digital twins. Meanwhile, for data analysts, the dimensions also can serve as the indicators of assessing whether the data collected achieves the requirements when the system implements.
Secondly, the findings of DQ issues related to DQ dimensions will benefit for data analysts and engineers to identify a specific DQ issue based on the results from the DQ assessment and trace back to its root causes. In this way, data analysts and engineers can have better chance to identify the core area (e.g., to determine an abnormal value that is a data error due to human/device faults or a significant event appearing in the SF context) for resolution.
Lastly, the methods used to address DQ issues identified in this study provide candidates and direction for dealing with DQ for BDA supporting digital symmetry in the SF context. For example, data imputation is commonly used to solve missing data as it provides the estimate value to fill the null. As to DQ issues of accuracy, anomaly detection is considered as the most frequently used method for solution since it discovers the rules of changes in data values and identifies a data error or an event with the knowledge accumulated from historical data and/or current production process and environment data monitored. While for DQ issues related to consistency dimension, both imputation techniques and multiple non-technical methods are more likely to be employed for the data shared and transmitted consistently. In terms of solving the issue of old data, database commit enables the required data to be updated in a period of time for a given task. Our review shows that statistical and computational methods are mainly used to address DQ issues for BDA at the stage of data generation. However, the DQ management only relies upon technical methods that is not enough. Non-technical methods give a systematic means of addressing DQ from the process and management perspectives and support DQ management from data creation to its usage through a long-time and sustaining spectrum. The combination of both technical and non-technical methods in the manufacturing practices ensure that each link in the manufacturing process could have quality-assured data. In this light, the data accumulated and integrated for BDA in digital twins and SF has the great potential to achieve high-quality data in order to address the symmetry of physical and virtual manufacturing worlds.
5.4. Limitations of the Study
While we have consistently followed the guidelines of Wolfswinkel et al. [10] to search and select relevant articles to ensure the completeness of the data sample in this study, there may still be some publications that have not been included in our final selection. There are three limitations to consider. Firstly, our SLR was limited to the online databases and outlets with restricted keywords as advised by prior literature reviews (see Section 3). There could be potential articles in other databases and outlets, or in different languages not identified in our data sample that might have resulted in the limited number of the studies (a total of 31 studies) in this SLR. However, the primary sources of this field were used to ensure an exhaustive scope on the topic of interest, addressing the potential largest set of peer-reviewed, relevant literature from English language sources identified in our study. Secondly, we only focused on empirical studies, and we might have underestimated the current state of art in the field of DQ affecting BDA in the SF context. Future studies are encouraged to identify relevant conceptual research for expansion and comparison with our findings. Lastly, we selected the articles based on our inclusion and exclusion criteria and extracted data from the articles based on the proposed three RQs. To ensure quality of coding, any uncertain coding was discussed for resolution. We also referred to the phrases and sentences utilised in the articles to understand and group the extracted data, in order to remain faithful to the description of research themes, DQ issues, and methods used to address these issues.
6. Conclusions
This SLR not only explores fundamental research trends of DQ affecting BDA in SF but also answers three proposed RQs, based on the data extracted from 31 research publications up to 2020. This review contributes a systematic review of research themes of this area, DQ issues and methods used to address these issues, describing the role of DQ in DBA supporting digital symmetry in the SF context as well as trends and potential areas for further investigation in the field (see Section 5.3.1). In addition to these theoretical contributions, the practical implications of this study include: (1) providing DQ dimensions with the definitions that help IS/IT architects and data analysts to define and assess DQ and understand DQ issues related to measured dimensions; (2) mapping these DQ issues to problems-solving methods that benefit data analysts and engineers in selecting and using methods to address DQ issues according to their affordances and limitations; and (3) improving the awareness of decision makers on the quality of data for BDA and use of quality-assured BDA products in their manufacturing decision-making.
Author Contributions
Conceptualization, C.L. and G.P.; methodology, C.L.; software, C.L.; validation, S.L. and S.C.; formal analysis, C.L.; investigation, C.L.; resources, C.L. and G.P.; data curation, C.L.; writing—original draft preparation, C.L.; writing—review and editing, C.L. and G.P.; visualization, C.L. and Y.K.; supervision, G.P.; project administration, G.P.; funding acquisition, G.P. All authors have read and agreed to the published version of the manuscript.
Funding
This research was funded and supported by the National Natural Science Foundation of China (Grant ID: 71974215), the Guangdong Natural Science Foundation (Grant ID: 2018A030313706), and the Key Cultivation Scheme for Young Teachers in the Sun Yat-sen University Higher Education Basic Research Program (Grant ID: 20wkzd17).
Institutional Review Board Statement
Not applicable.
Informed Consent Statement
Not applicable.
Data Availability Statement
Not applicable.
Conflicts of Interest
The authors declare no conflict of interest.
Appendix A
Table A1.
List of the included articles in this SLR.
Table A1.
List of the included articles in this SLR.
| Study Number | Reference |
|---|---|
| S1 | Chien, C.F.; Chen, Y.J.; Wu, J.Z. Big data analytics for modeling WAT parameter variation induced by process tool in semiconductor manufacturing and empirical study. In Proceedings of the 2016 Winter Simulation Conference; IEEE Press: Piscataway, United States, 2016, pp.2512–2522. |
| S2 | Ding, X.; Wang, H.; Su, J.; Li, Z.; Li, J.; Gao, H. Cleanits: A data cleaning system for industrial time series. In Proceedings of the VLDB Endowment; VLDB Endowment: Los Angeles, United States, 2019, 12(12), pp.1786–1789. |
| S3 | McGinnis, L.F.; Rose, O. History and perspective of simulation in manufacturing. In 2017 Winter Simulation Conference; IEEE Press: Piscataway, United States, 2017, pp. 385–397. |
| S4 | Huang, J.; Kong, L.; Dai, H.N.; Ding, W.; Cheng, L.; Chen, G.; Jin, X.; Zeng, P. Blockchain-based mobile crowd sensing in industrial systems. IEEE Transactions on Industrial Informatics 2020, 16, 10, 6553–6563. |
| S5 | Zhao, H.; Zhang, J.; Jiang, Z.; Wei, D.; Zhang, X.; Mao, Z. A new fault diagnosis method for a diesel engine based on an optimized vibration MEL frequency under multiple operation conditions. Sensors 2019, 19, 11, p.2590. |
| S6 | Yu, W.; Dillon, T.; Mostafa, F.; Rahayu, W.; Liu, Y. Implementation of industrial cyber physical system: Challenges and solutions. In Proceedings of the 2019 IEEE International Conference on Industrial Cyber Physical Systems; IEEE Press: Piscataway, United States, 2019, pp.173–178. |
| S7 | Zhou, H.; Yu, K.M.; Lee, M.G.; Han, C.C. The application of last observation carried forward method for missing data estimation in the context of industrial wireless sensor networks. In 2018 IEEE Asia-Pacific Conference on Antennas and Propagation; IEEE Press: Piscataway, United States, 2018, pp.130–131. |
| S8 | Moyne, J.; Iskandar, J. Big data analytics for smart manufacturing: Case studies in semiconductor manufacturing. Processes 2017, 5, 3, 39. |
| S9 | Taetragool, U.; Achalakul, T. Method for failure pattern analysis in disk drive manufacturing. International Journal of Computer Integrated Manufacturing, 2011, 24, 9, 834–846. |
| S10 | Vitolo, F.; Franciosa, P.; Ceglarek, D.; Patalano, S.; De Martino, M. A generalised multi-attribute task sequencing approach for robotics optical inspection systems. In Proceedings of the 2019 II Workshop on Metrology for Industry 4.0 and IoT; IEEE Press: Piscataway, United States, 2019, pp.117–122. |
| S11 | Jayapal, J.; Kumaraguru, S. Real-time linked open data for life cycle inventory. In Proceedings of the IFIP International Conference on Advances in Production Management Systems, Springer: Cham, Switzerland, 2018, pp.249–254. |
| S12 | Reuter, C.; Brambring, F.; Weirich, J.; Kleines, A. Improving data consistency in production control by adaptation of data mining algorithms. Procedia CIRP 2016, 56, 545–550. |
| S13 | Krumay, B.; Rueckel, D. Data governance and digitalization–A case study in a manufacturing company. Paper presented at the 24th Pacific Asia Conference on Information Systems, Dubai, United Arab Emirates, 22–24 Jun 2020. |
| S14 | Wang, Y.; Hulstijn, J.; Tan, Y.H. Towards smart manufacturing: Compliance monitoring for computational auditing. Paper presented at the 26th European Conference on Information Systems, Portsmouth, United Kingdom, 23–28 Jun 2018. |
| S15 | Utz, F.; Neumann, C.; Omid, T. How to discover knowledge for improving availability in the manufacturing domain. Paper presented at the 51st Hawaii International Conference on System Sciences, Hilton Waikoloa Village, United States, 3- 6 Jan 2018. |
| S16 | Li, X.; Tu, Z.; Jia, Q.; Man, X.; Wang, H.; Zhang, X. Deep-level quality management based on big data analytics with case study. In Proceedings of the 2017 Chinese Automation Congress; IEEE Press: Piscataway, United States, 2017, pp.4921–4926. |
| S17 | Michaloski, J.; Lee, B.E.; Proctor, F.; Venkatesh, S. Web-enabled real-Time quality feedback for factory systems using MTConnect. In Proceedings of International Design Engineering Technical Conferences and Computers and Information in Engineering Conference; American Society of Mechanical Engineers: Montreal, Canada, 2012, 45011, pp.403–409. |
| S18 | Lynn, R.; Louhichi, W.; Parto, M.; Wescoat, E.; Kurfess, T. Rapidly deployable MTConnect-based machine tool monitoring systems. In Proceedings of International Manufacturing Science and Engineering Conference; American Society of Mechanical Engineers: Montreal, Canada, 2017, 50749, p.V003T04A046. |
| S19 | Cheng, Y.; Shang, W.; Zhu, L.; Zhang, D.; Feng, D. Items analysis of postal supervision. Paper presented at the 15th International Conference on Computer and Information Science, Okayama, Japan, 26–29 June 2016. |
| S20 | Chien, C.F.; Wang, W.C.; Cheng, J.C. Data mining for yield enhancement in semiconductor manufacturing and an empirical study. Expert Systems with Applications 2007, 33, 1, 192–198. |
| S21 | Liu, Y.; Dillon, T.; Yu, W.; Rahayu, W.; Mostafa, F. Missing value imputation for Industrial IoT sensor data with large gaps. IEEE Internet of Things Journal 2020, 7, 8, 6855–6867. |
| S22 | Li, S.; Peng, G.C.; Xing, F. Barriers of embedding big data solutions in smart factories: insights from SAP consultants. Industrial Management & Data Systems 2019, 119, 5, 1147–1164. |
| S23 | Iftikhar, N.; Baattrup-Andersen, T.; Nordbjerg, F.E.; Bobolea, E.; Radu, P.B. Data Analytics for Smart Manufacturing: A Case Study. In Proceedings of the 8th International Conference on Data Science, Technology and Applications; SciTePress: Setúbal, Portugal, 2019, pp.392–399. |
| S24 | Hui, K.; Ke, L.; Sheen, S.Y. Forging basic elements of cyber-physical systems in industry 4.0 with parametric characterization for FDC. In Proceedings of the 29th Annual SEMI Advanced Semiconductor Manufacturing Conference; IEEE Press: Piscataway, United States, 2018, pp.111–116. |
| S25 | Schuh, G.; Potente, T.; Thomas, C.; Brambring, F. Improving scheduling accuracy by reducing data inconsistencies in production control. Paper presented at the 25th Annual Conference of the Production and Operations Management Society “Reaching New Heights”, Atlanta, United States, 9–12 May 2014. |
| S26 | Reuter, C.; Brambring, F. Improving data consistency in production control. Procedia CIRP 2016, 41, 51–56. |
| S27 | Kwak, D.S.; Kim, K.J. A data mining approach considering missing values for the optimization of semiconductor-manufacturing processes. Expert Systems with Applications 2012, 39, 3, 2590–2596. |
| S28 | Liu, Y.; Dillon, T.; Yu, W.; Rahayu, W.; Mostafa, F. Noise removal in the presence of significant anomalies for Industrial IoT sensor data in manufacturing. IEEE Internet of Things Journal 2020, 7, 8, 7084–7096. |
| S29 | Marx, E.; Stierle, M.; Weinzierl, S.; Matzner, M. Closing the Gap between Smart Manufacturing Applications and Data Management. Paper presented at the 15th International Conference on Wirtschaftsinformatik, Potsdam, Germany, 8–11 March 2020. |
| S30 | Yu, W.; Dillon, T.; Mostafa, F.; Rahayu, W.; Liu, Y. A global manufacturing big data ecosystem for fault detection in predictive maintenance. IEEE Transactions on Industrial Informatics 2019, 16, 1, 183–192. |
| S31 | Hazen, B.T.; Boone, C.A.; Ezell, J.D.; Jones-Farmer, L.A. Data quality for data science, predictive analytics, and big data in supply chain management: An introduction to the problem and suggestions for research and applications. International Journal of Production Economics 2014, 154, 72–80. |
Appendix B
Table A2.
Definitions for the main acronyms used in this article.
Table A2.
Definitions for the main acronyms used in this article.
| Acronym | Full Form | Definition | Reference(s) |
|---|---|---|---|
| BDA | Big data analytics | the use of advanced analytic techniques to discover patterns, trends and relationships from large datasets | [3] |
| DQ | Data quality | defined both as ‘fitness for use’ and as ‘conformance to requirements’ that can be divided into dimensions for describing different DQ aspects | [7] |
| EC | Exclusion criteria | the characteristics that prospective subjects must have if they are to be removed in the study sample | Not applicable |
| IC | Inclusion criteria | the characteristics that prospective subjects must have if they are to be included in the study sample | Not applicable |
| IM | Information management | a discipline that deals with the collection, management and distribution of information | Not applicable |
| IS | Information system | a discipline/a system used to collect, process, store, and distribute information | Not applicable |
| IT | Information technologies | a discipline/the systems, software, and networks dealing with data processing and distribution | Not applicable |
| NM | Not mentioned | the concerned term/content that has not been mentioned in the studies | Not applicable |
| RQ | Research question | an inquiry that a study or research project aims to answer | Not applicable |
| SF | Smart factories | the use of advanced technologies and data exchange in the manufacturing process to realise intelligent production | [20,21,22,23] |
| SLR | Systematic literature review | a means of the selection, analysis and interpretation of the available literature in relation to addressing a specific research topic, a RQ or a phenomenon of interest | [10] |
| SM | Smart manufacturing | the use of data analytics and information and communication technologies to govern and optimise manufacturing operations | [27] |
References
- Bagozi, A.; Bianchini, D.; De Antonellis, V.; Marini, A.; Ragazzi, D. Summarisation and Relevance Evaluation Techniques for Big Data Exploration: The Smart Factory Case Study. In International Conference on Advanced Information Systems Engineering; Springer: Cham, Switzerland, 2017; pp. 264–279. [Google Scholar] [CrossRef]
- Qi, Q.; Tao, F. Digital twin and big data towards smart manufacturing and industry 4.0: 360 degree comparison. IEEE Access 2018, 6, 3585–3593. [Google Scholar] [CrossRef]
- Luo, S.; Hongwei, L.; Ershi, Q. Big data analytics–enabled cyberphysicalsystem: Model and applications. Ind. Manag. Data Syst. 2019, 119, 1072–1088. [Google Scholar] [CrossRef]
- Chien, C.F.; Chen, Y.J.; Wu, J.Z. Big data analytics for modeling WAT parameter variation induced by process tool in semiconductor manufacturing and empirical study. In Proceedings of the 2016 Winter Simulation Conference, Washington, DC, USA, 11–14 December 2016; pp. 2512–2522. [Google Scholar]
- Moyne, J.; Jimmy, I. Big data analytics for smart manufacturing: Case studies in semiconductor manufacturing. Processes 2017, 5, 39. [Google Scholar] [CrossRef]
- Hazen, B.T.; Boone, C.A.; Ezell, J.D.; Jones-Farmer, L.A. Data quality for data science, predictive analytics, and big data in supply chain management: An introduction to the problem and suggestions for research and applications. Int. J. Prod. Econ. 2014, 154, 72–80. [Google Scholar] [CrossRef]
- De Feo, J.A.; Juran, J.M. Juran’s Quality handbook: The Complete Guide to Performance Excellence, 7th ed.; McGraw-Hill: New York, NY, USA, 2017. [Google Scholar]
- Marx, E.; Stierle, M.; Weinzierl, S.; Matzner, M. Closing the Gap between Smart Manufacturing Applications and Data Management. In Proceedings of the 15th International Conference on Wirtschaftsinformatik, Potsdam, Germany, 8–11 March 2020. [Google Scholar]
- Cui, Y.; Kara, S.; Chan, K. Manufacturing big data ecosystem: A systematic literature review. Robot. Comput. Manuf. 2020, 62, 101861. [Google Scholar] [CrossRef]
- Safaei, M.; Asadi, S.; Driss, M.; Boulila, W.; Alsaeedi, A.; Chizari, H.; Abdullah, R.; Safaei, M. A systematic literature review on outlier detection in wireless sensor networks. Symmetry 2020, 12, 328. [Google Scholar] [CrossRef]
- Wolfswinkel, J.F.; Furtmueller, E.; Wilderom, C.P. Using grounded theory as a method for rigorously reviewing literature. Eur. J. Inf. Syst. 2013, 22, 45–55. [Google Scholar] [CrossRef]
- Shangguan, D.; Chen, L.; Ding, J. A digital twin-based approach for the fault diagnosis and health monitoring of a complex satellite system. Symmetry 2020, 12, 1307. [Google Scholar] [CrossRef]
- Ghita, M.; Siham, B.; Hicham, M. Digital Twins Development Architectures and Deployment Technologies: Moroccan use Case’. Int. J. Adv. Comput. Sci. Appl. 2020, 11, 468–478. [Google Scholar] [CrossRef]
- Wang, R.Y.; Strong, D.M. Beyond Accuracy: What Data Quality Means to Data Consumers. J. Manag. Inf. Syst. 1996, 12, 5–33. [Google Scholar] [CrossRef]
- Tilly, R.; Oliver, P.; Kai, F.; Detlef, S. Towards a conceptualization of data and information quality in social information systems. Bus. Inf. Syst. Eng. 2017, 59, 3–21. [Google Scholar] [CrossRef]
- Côrte-Real, N.; Pedro, R.; Tiago, O. Leveraging internet of things and big data analytics initiatives in European and American firms: Is data quality a way to extract business value? Inf. Manag. 2020, 57, 103141. [Google Scholar] [CrossRef]
- Mikalef, P.; Pappas, I.; Krogstie, J.; Giannakos, M. Big data analytics capabilities: A systematic literature review and research agenda. Inf. Syst. e Bus. Manag. 2017, 16, 547–578. [Google Scholar] [CrossRef]
- Chen, D.Q.; Preston, D.S.; Swink, M. How the use of big data analytics affects value creation in supply chain management. J. Manag. Inf. Syst. 2015, 32, 4–39. [Google Scholar] [CrossRef]
- Büchi, G.; Cugno, M.; Castagnoli, R. Smart factory performance and Industry 4.0. Technol. Forecast. Soc. Chang. 2020, 150, 119790. [Google Scholar] [CrossRef]
- Hrustek, L.; Vrcek, N.; Furjan, M.T. ERP systems in the context of smart factories. In Proceedings of the 62nd International Scientific Conference on Economic and Social Development, Budapest, Hungary, 4–5 September 2020. [Google Scholar]
- Gunal, M.M.; Mumtaz, K. Industry 4.0, digitisation in manufacturing, and simulation: A review of the literature. In Simulation for Industry 4.0; Springer: Berlin/Heidelberg, Germany, 2019; pp. 19–37. [Google Scholar]
- Mabkhot, M.M.; Al-Ahmari, A.M.; Salah, B.; Alkhalefah, H. Requirements of the Smart Factory System: A Survey and Perspective. Machines 2018, 6, 23. [Google Scholar] [CrossRef]
- Strozzi, F.; Claudia, C.; Alessandro, C.; Carlo, N. Literature review on the ‘Smart Factory’concept using bibliometric tools. Int. J. Prod. Res. 2017, 55, 6572–6591. [Google Scholar] [CrossRef]
- O’Donovan, P.; Leahy, K.; Bruton, K.; O’Sullivan, D.T. An industrial big data pipeline for data-driven analytics maintenance applications in large-scale smart manufacturing facilities. J. Big Data 2015, 2, 25. [Google Scholar] [CrossRef]
- Chopra, S. Designing the distribution network in a supply chain. Transp. Res. Part E Logist. Transp. Rev. 2003, 39, 123–140. [Google Scholar] [CrossRef]
- Rushton, A.; Phil, C.; Peter, B. The Handbook of Logistics and Distribution Management: Understanding the Supply Chain; Kogan Page Publishers: London, UK, 2014. [Google Scholar]
- Thoben, K.D.; Wiesner, S.; Wuest, T. “Industrie 4.0” and smart manufacturing-a review of research issues and application examples. Int. J. Autom. Technol. 2017, 11, 4–16. [Google Scholar] [CrossRef]
- Sundarraj, M.; Rajkamal, M.N. Data governance in smart factory: Effective metadata management. Int. J. Adv. Res. Ideas Innov. Technol. 2019, 5, 798–804. [Google Scholar]
- Mäkinen, M.V. Data Quality in Smart Manufacturing. Master’s Thesis, University of Vaasa, Vaasa, Finland, 2020. [Google Scholar]
- Krumay, B.; David, R. Data governance and digitalization-A case study in a manufacturing company. In Proceedings of the 24th Pacific Asia Conference on Information Systems, Dubai, United Arab Emirates, 22–24 June 2020. [Google Scholar]
- Wang, Y.; Joris, H.; Yao-hua, T. Towards smart manufacturing: Compliance monitoring for computational auditing. In Proceedings of the 26th European Conference on Information Systems, Portsmouth, UK, 23–28 June 2018. [Google Scholar]
- Utz, F.; Christian, N.; Tafreschi, O. How to discover knowledge for improving availability in the manufacturing domain. In Proceedings of the Paper Presented at the 51st Hawaii International Conference on System Sciences, Waikoloa Village, HI, USA, 3–6 January 2018. [Google Scholar]
- Sadiq, S.; Naiem, K.Y.; Marta, I. 20 years of data quality research: Themes, trends and synergies. In Proceedings of the 22rd Australasian Database Conference, Perth, Australia, 17–20 January 2011. [Google Scholar]
- Van Nguyen, T.; Zhou, L.; Spiegler, V.; Ieromonachou, P.; Lin, Y. Big data analytics in supply chain management: A state-of-the-art literature review. Comput. Oper. Res. 2018, 98, 254–264. [Google Scholar] [CrossRef]
- Shelley, M.; Krippendorff, K. Content Analysis: An Introduction to its Methodology. J. Am. Stat. Assoc. 1984, 79, 240. [Google Scholar] [CrossRef]
- Boyatzis, R.E. Transforming Qualitative Information: Thematic Analysis and Code Development; Sage Publications: New York, NY, USA, 1998. [Google Scholar]
- Zhang, R.; Marta, I.; Shazia, S. Discovering data quality problems. Bus. Inf. Syst. Eng. 2019, 61, 575–593. [Google Scholar] [CrossRef]
- Zhang, Y.; Wang, W.; Du, W.; Qian, C.; Yang, H. Coloured Petri net-based active sensing system of real-time and multi-source manufacturing information for smart factory. Int. J. Adv. Manuf. Technol. 2017, 94, 3427–3439. [Google Scholar] [CrossRef]
- Scheffer, J. Dealing with missing data. In Research Letters in the Information and Mathematical Sciences; Institute of Information and Mathematical Sciences: Auckland, New Zealand, 2002; pp. 153–160. [Google Scholar]
- Descrimes, M.; Ben Zouari, Y.; Wery, M.; Legendre, R.; Gautheret, D.; Morillon, A. VING: A software for visualization of deep sequencing signals. BMC Res. Notes 2015, 8, 419. [Google Scholar] [CrossRef][Green Version]
- Wang, R.Y. A product perspective on total data quality management. Commun. ACM 1998, 41, 58–65. [Google Scholar] [CrossRef]
- Wahyudi, A.; Kuk, G.; Janssen, M. A Process Pattern Model for Tackling and Improving Big Data Quality. Inf. Syst. Front. 2018, 20, 457–469. [Google Scholar] [CrossRef]
- Daraio, C.; Lenzerini, M.; Leporelli, C.; Naggar, P.; Bonaccorsi, A.; Bartolucci, A. The advantages of an Ontology-Based Data Management approach: Openness, interoperability and data quality. Scientometrics 2016, 108, 441–455. [Google Scholar] [CrossRef]
- Choi, T.-M. Blockchain-technology-supported platforms for diamond authentication and certification in luxury supply chains. Transp. Res. Part E Logist. Transp. Rev. 2019, 128, 17–29. [Google Scholar] [CrossRef]
- Choi, T.-M.; Luo, S. Data quality challenges for sustainable fashion supply chain operations in emerging markets: Roles of blockchain, government sponsors and environment taxes. Transp. Res. Part E Logist. Transp. Rev. 2019, 131, 139–152. [Google Scholar] [CrossRef]
- Xuan, S.; Zhang, Y.; Tang, H.; Chung, I.; Wang, W.; Yang, W. Hierarchically Authorized Transactions for Massive Internet-of-Things Data Sharing Based on Multilayer Blockchain. Appl. Sci. 2019, 9, 5159. [Google Scholar] [CrossRef]
Publisher’s Note: MDPI stays neutral with regard to jurisdictional claims in published maps and institutional affiliations. |
© 2021 by the authors. Licensee MDPI, Basel, Switzerland. This article is an open access article distributed under the terms and conditions of the Creative Commons Attribution (CC BY) license (https://creativecommons.org/licenses/by/4.0/).