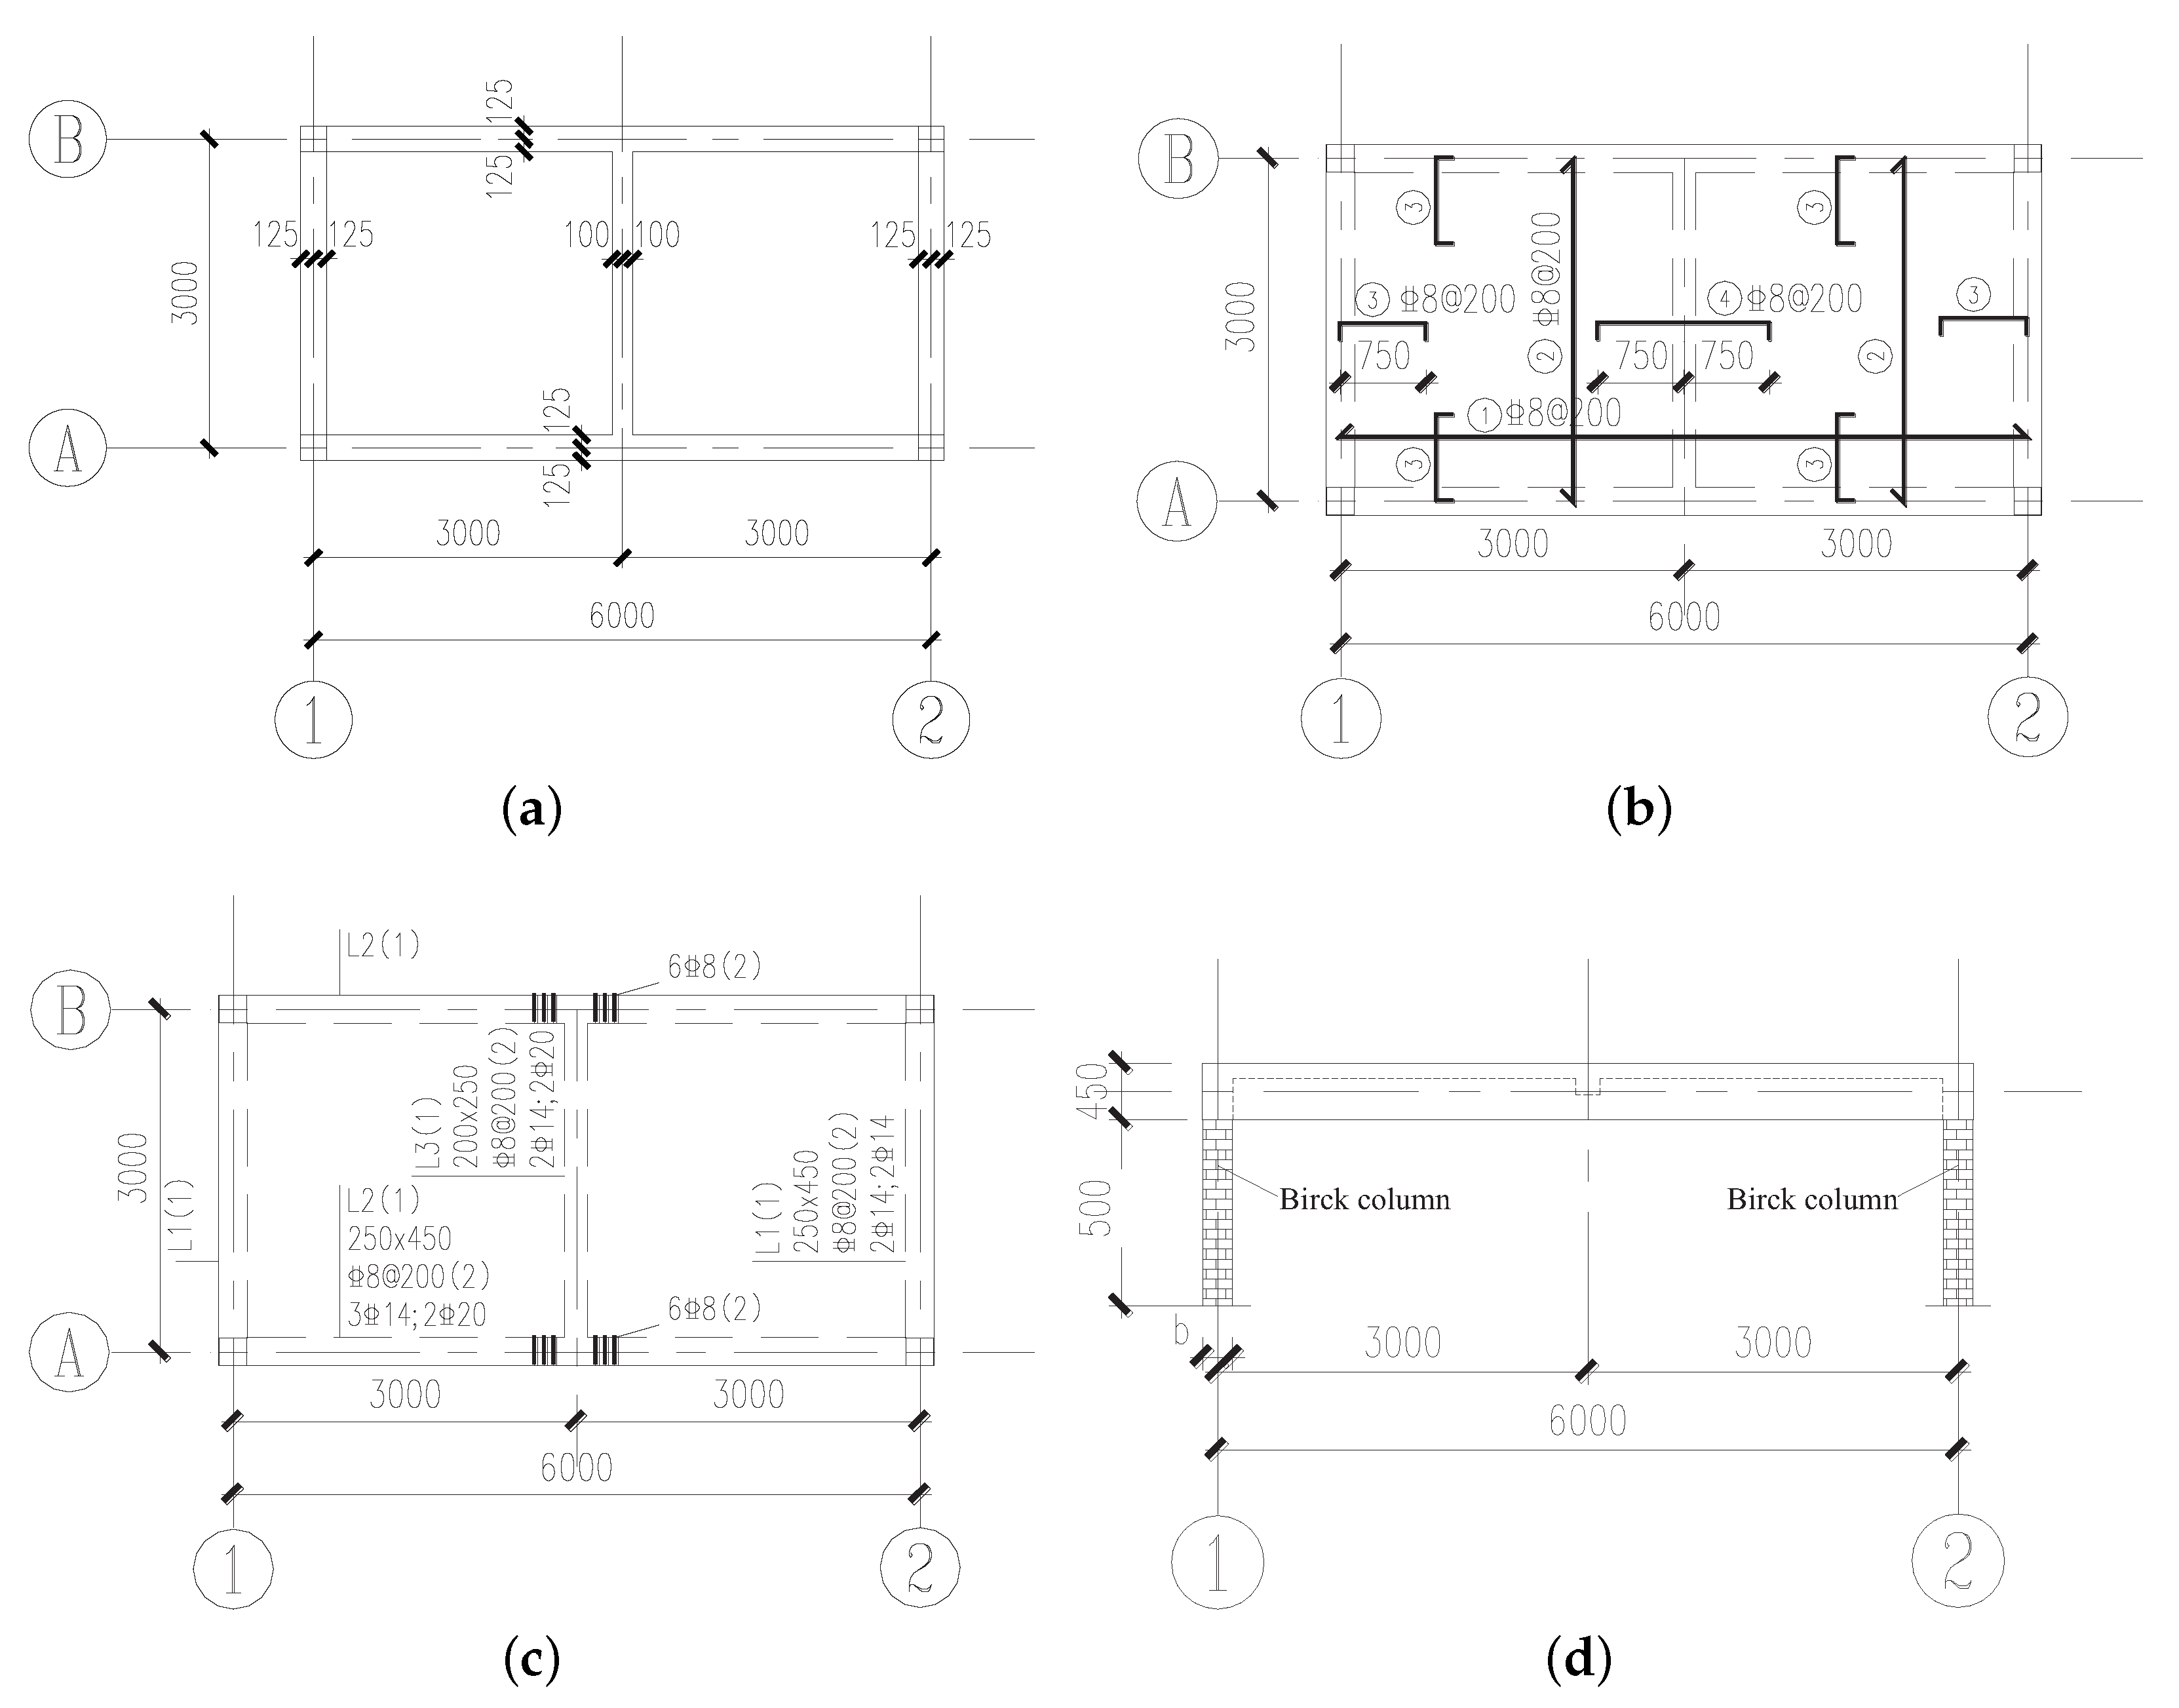
Figure 1.
The layout of and reinforcements arrangement of the test platform: (a) layout of the plate; (b) arrangement of reinforcements in the floor slab; (c) arrangement of beam reinforcements; and (d) side view of the long side of the plate.
Figure 1.
The layout of and reinforcements arrangement of the test platform: (a) layout of the plate; (b) arrangement of reinforcements in the floor slab; (c) arrangement of beam reinforcements; and (d) side view of the long side of the plate.
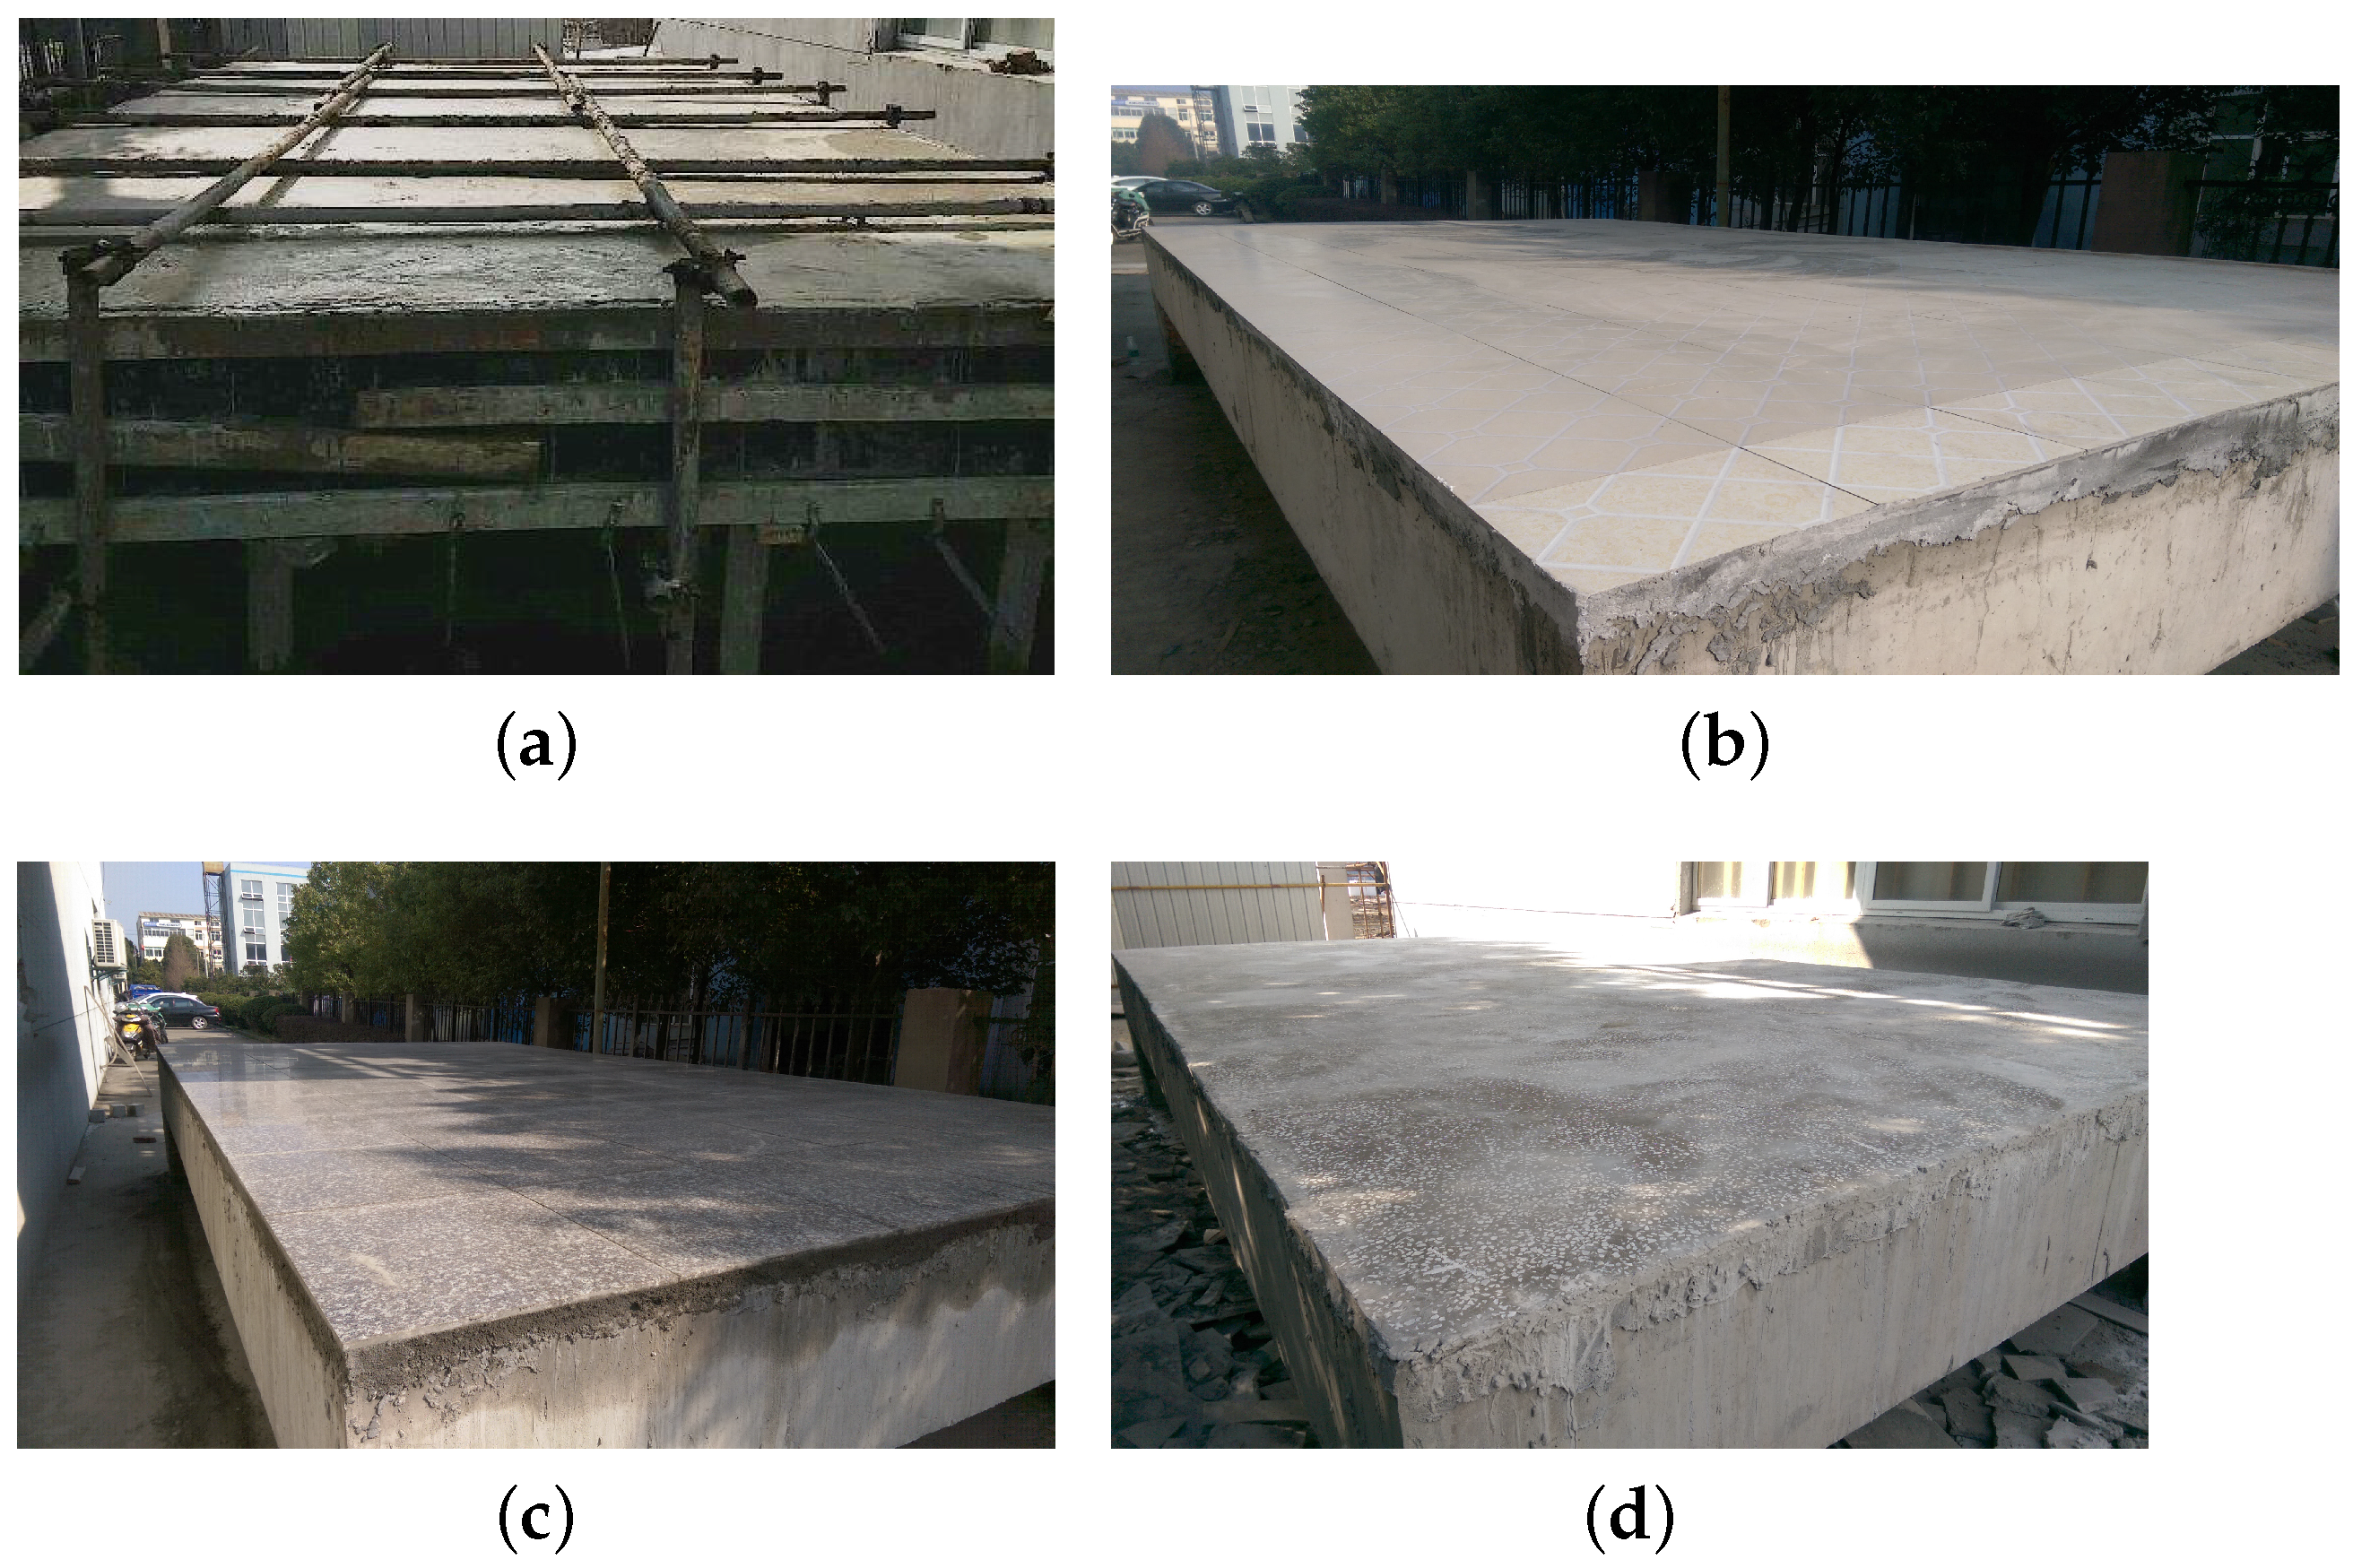
Figure 2.
Test platform: (a) the maintenance of the test platform; (b) plate with ceramic tiles surface; (c) plate with marble surface; and (d) plate with terrazzo surface.
Figure 2.
Test platform: (a) the maintenance of the test platform; (b) plate with ceramic tiles surface; (c) plate with marble surface; and (d) plate with terrazzo surface.
Figure 3.
The layout of the main test devices.
Figure 3.
The layout of the main test devices.
Figure 4.
Layout of floor measurement points.
Figure 4.
Layout of floor measurement points.
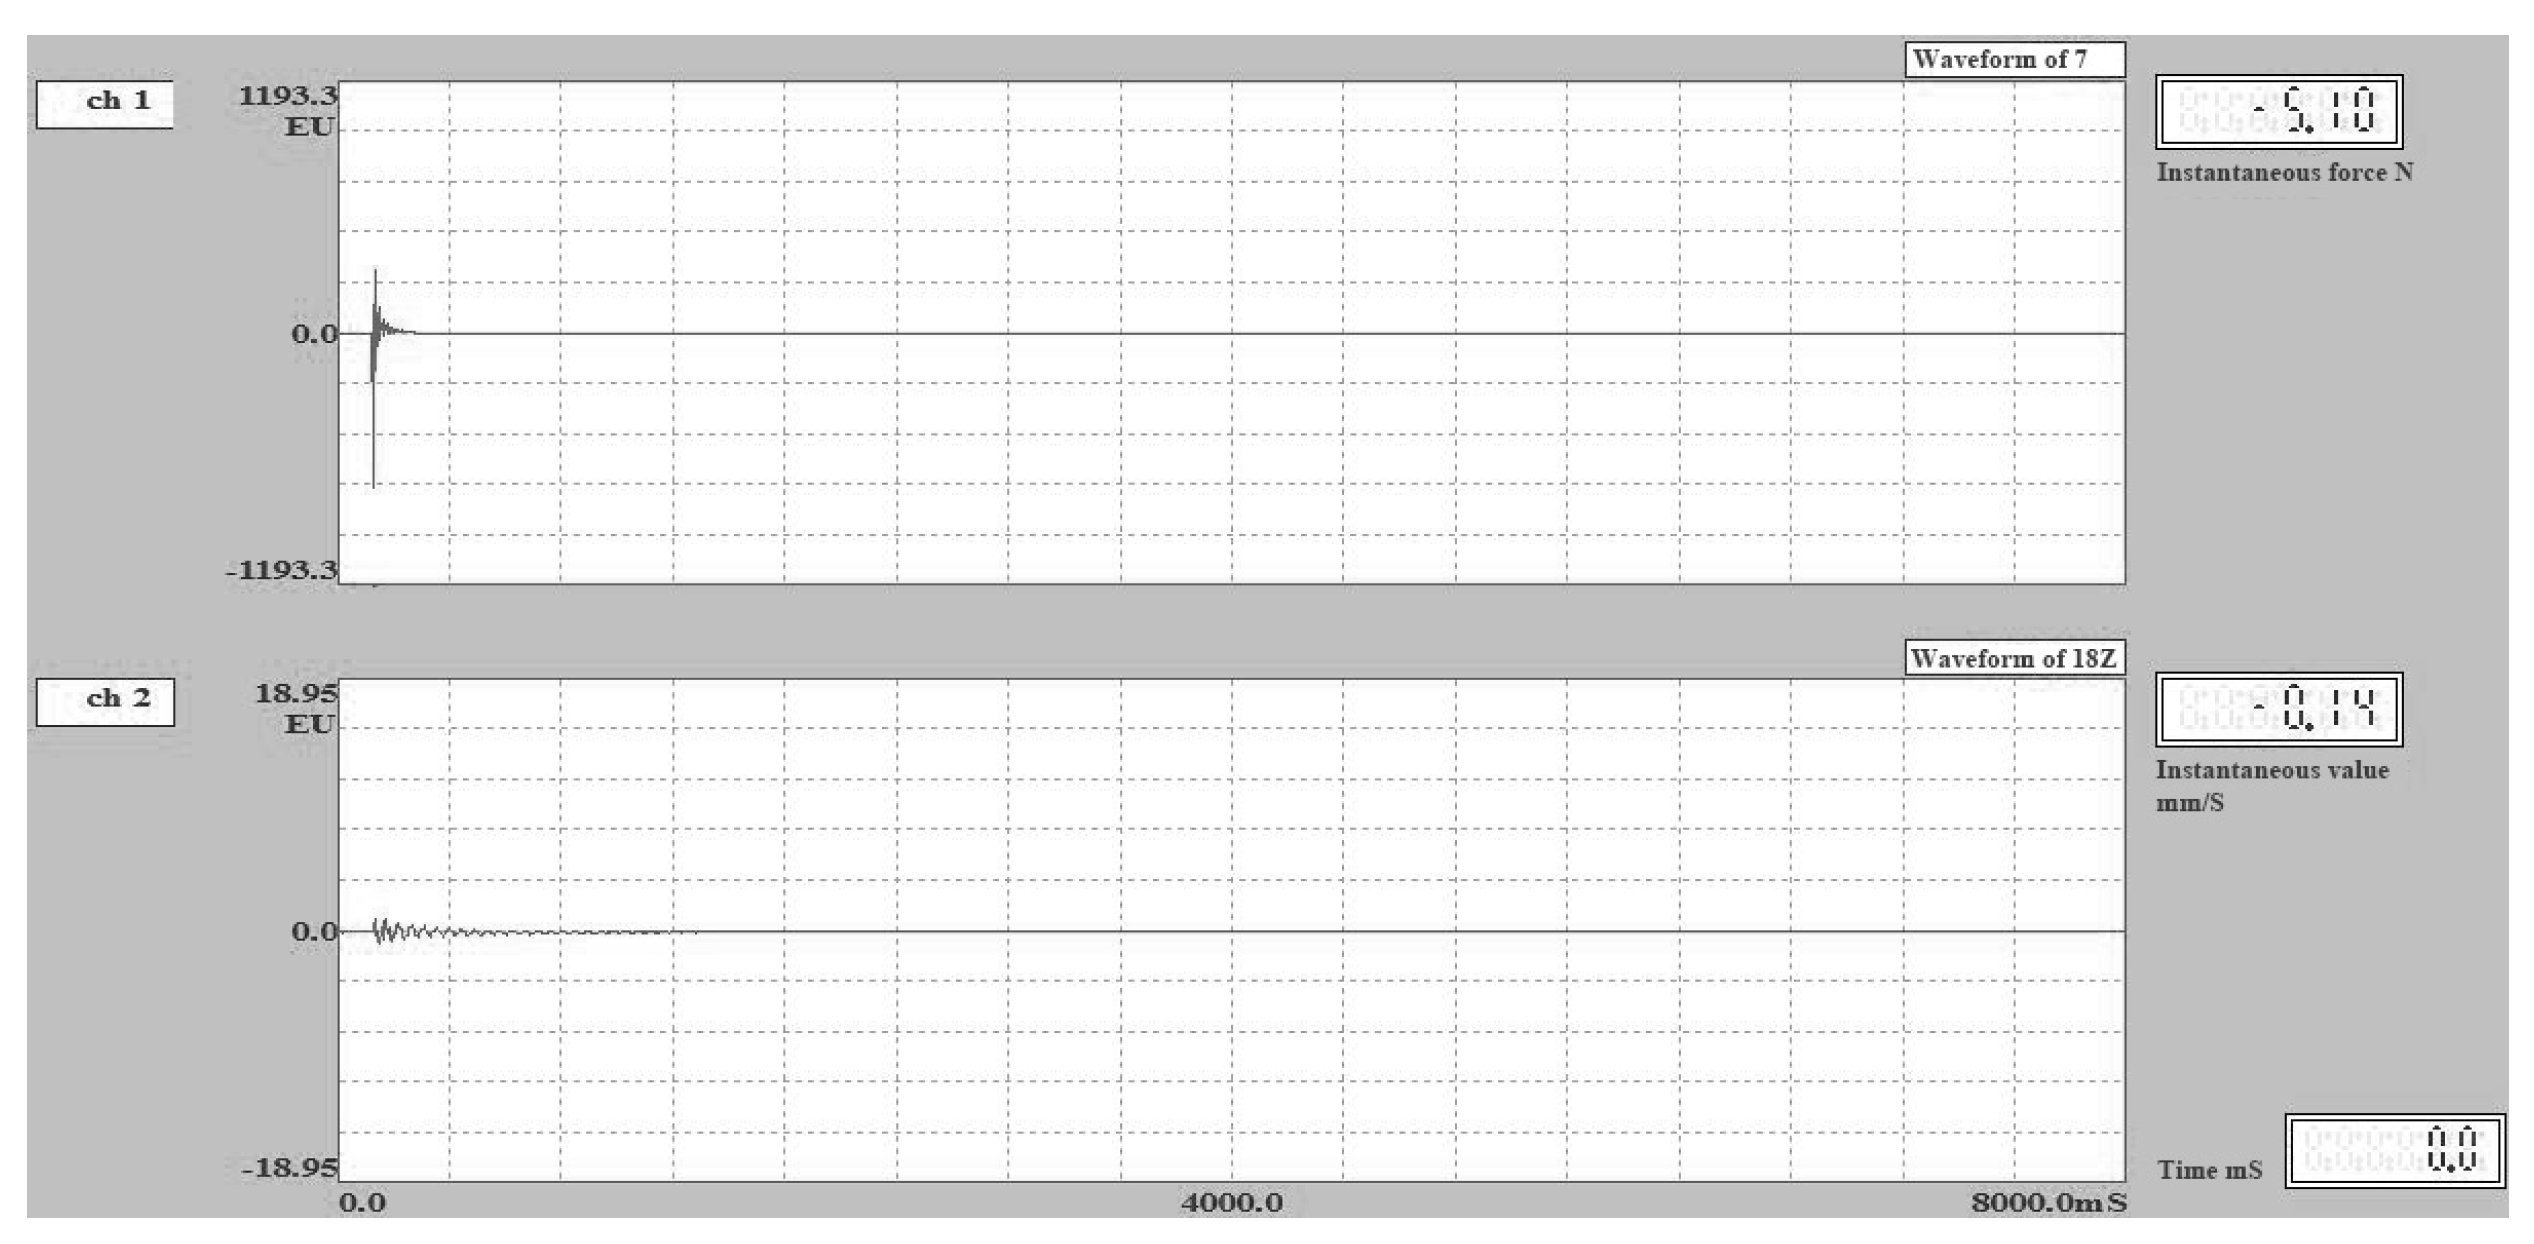
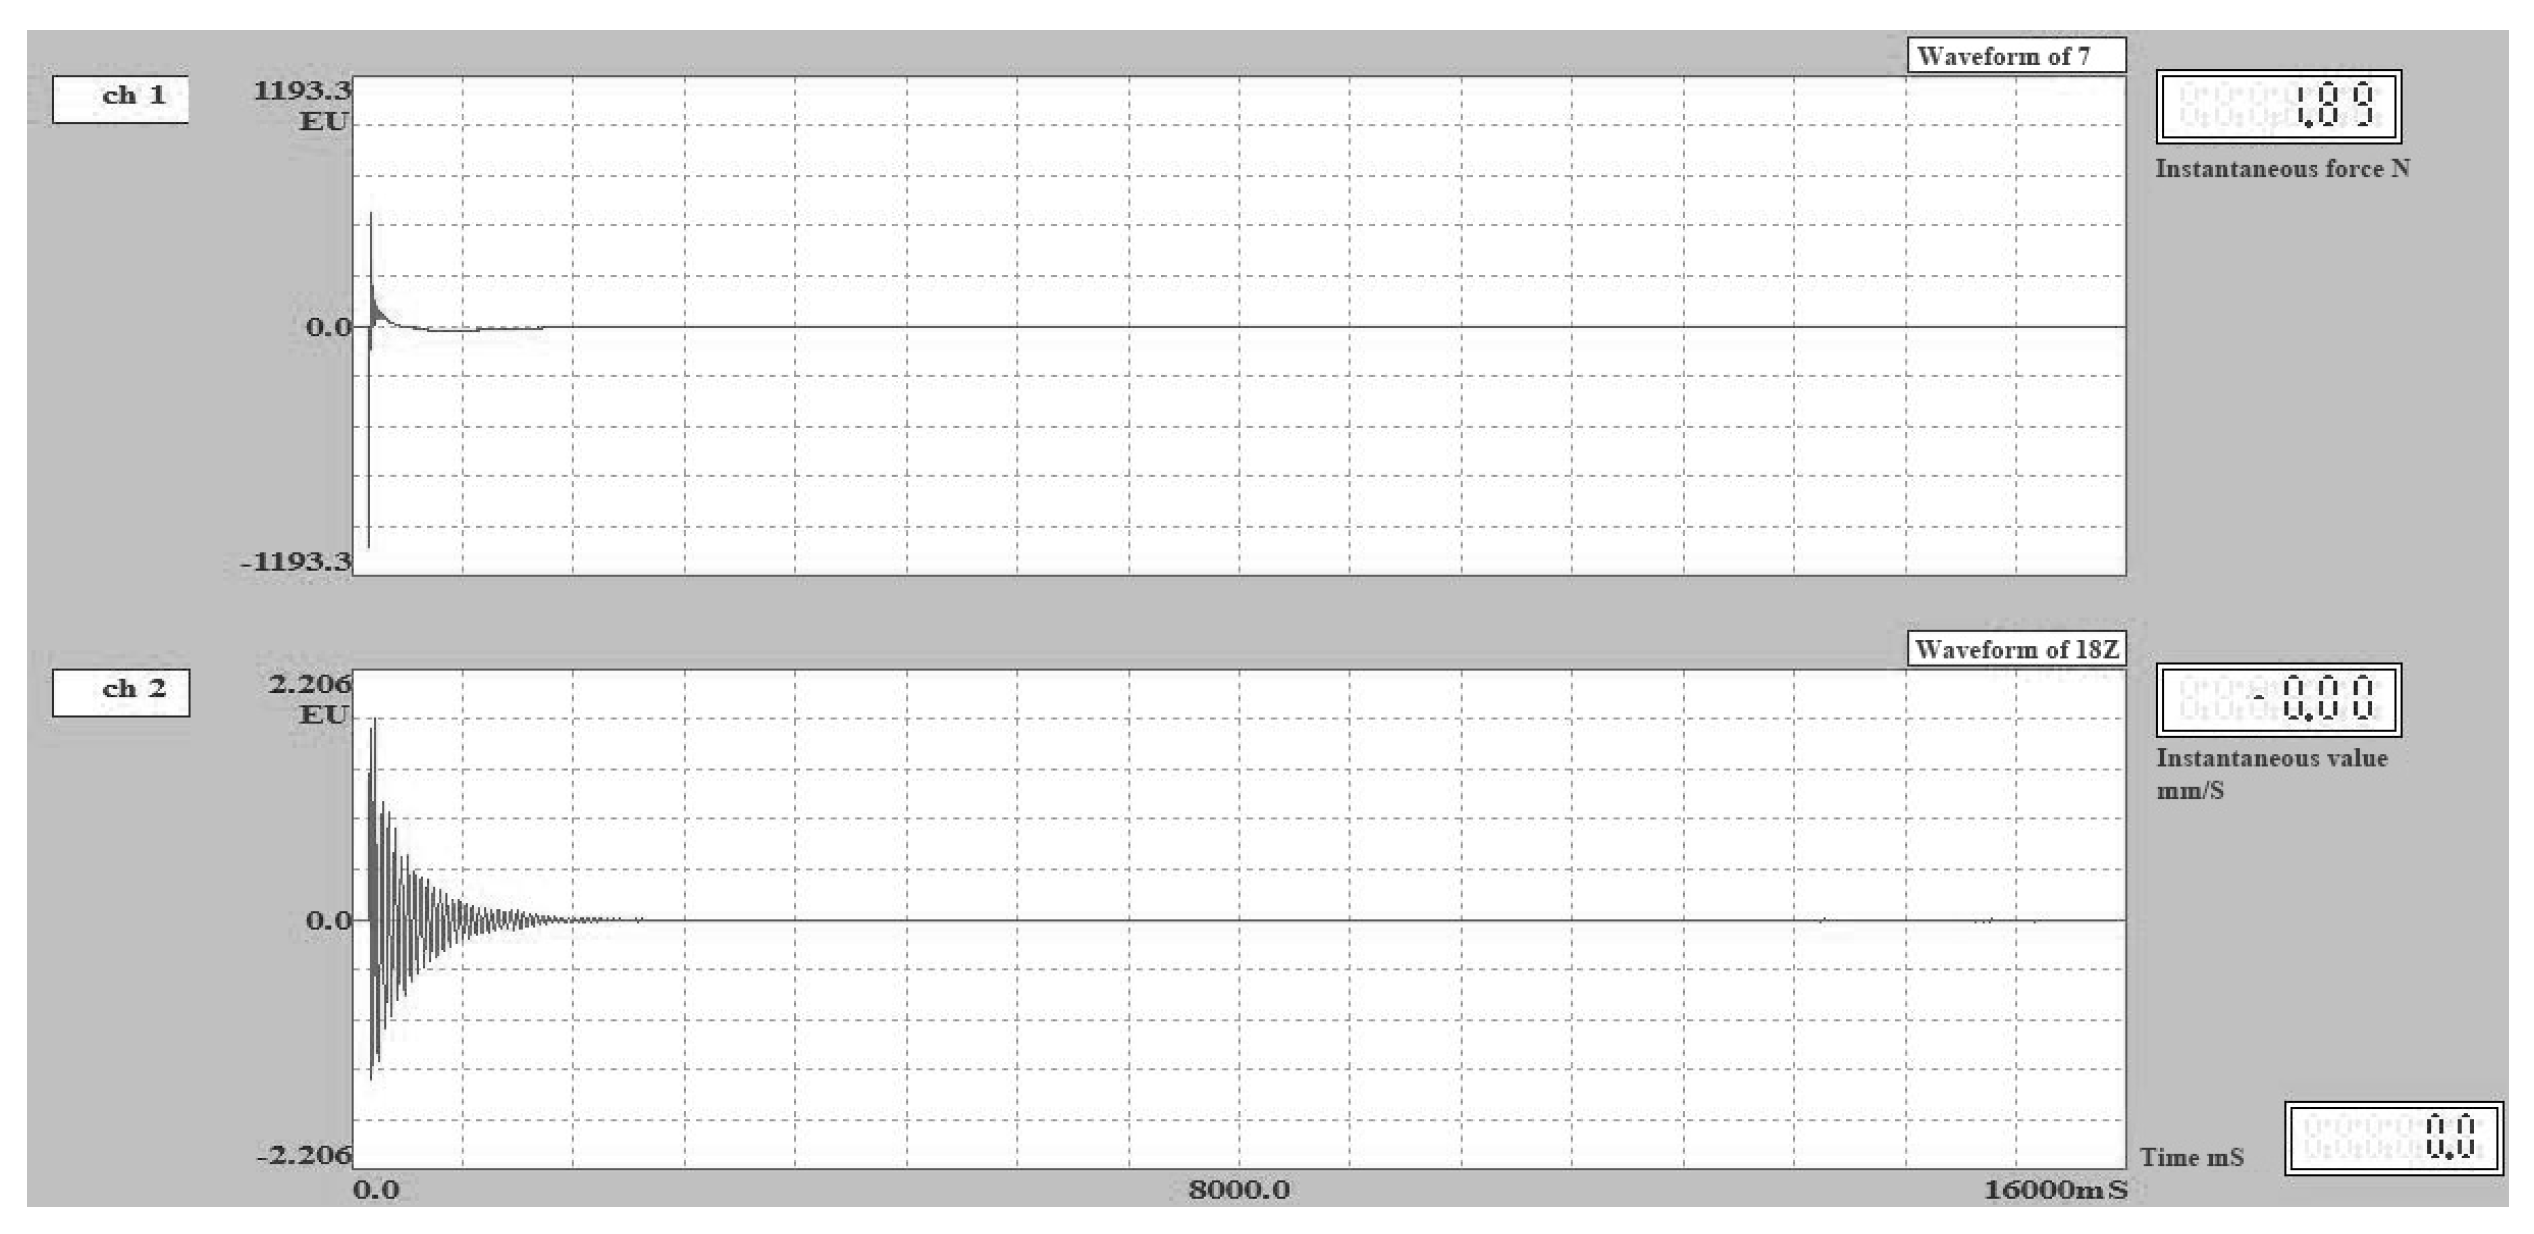
Figure 5.
The velocity time curve of Measurement Point 18 in Test 2.
Figure 5.
The velocity time curve of Measurement Point 18 in Test 2.
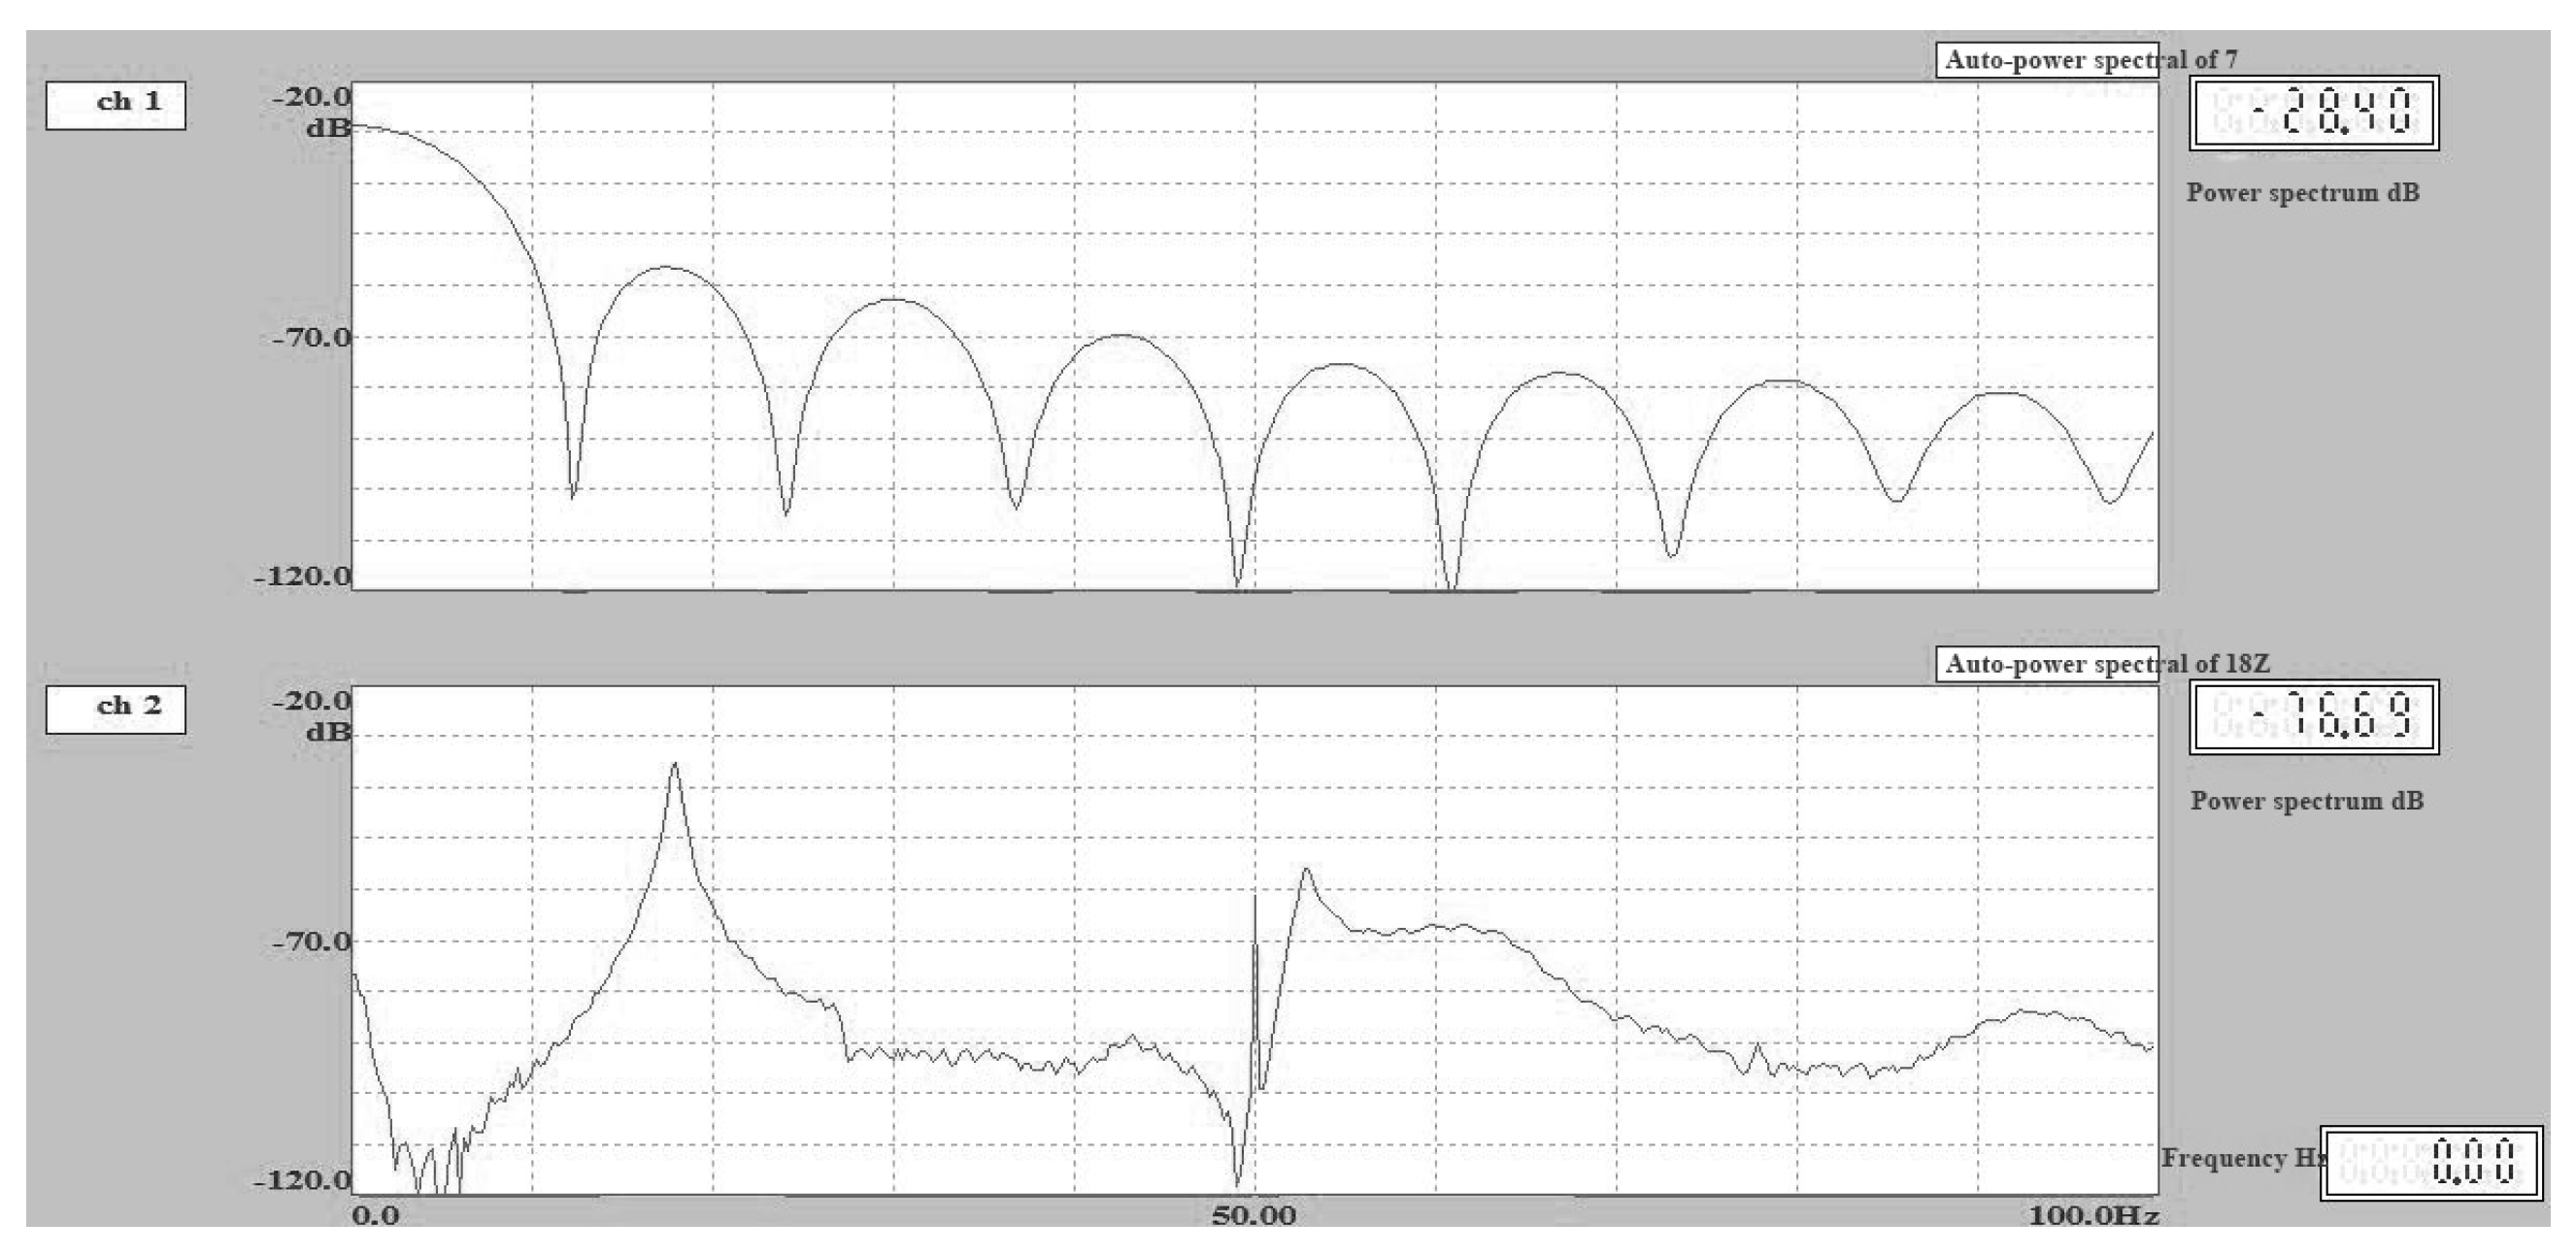
Figure 6.
Velocity power spectrum curve of Point 18 in Test 2.
Figure 6.
Velocity power spectrum curve of Point 18 in Test 2.
Figure 7.
The natural frequency of the structure obtained from the identification process.
Figure 7.
The natural frequency of the structure obtained from the identification process.
Figure 8.
First three modes and shape function of the original structure in Test 2: (a) first mode, frequency 17.89 Hz, damping ratio 1.91%; (b) second mode, frequency 26.98 Hz, damping ratio 2.29%; and (c) third mode, frequency 42.10 Hz, damping ratio 3.72%.
Figure 8.
First three modes and shape function of the original structure in Test 2: (a) first mode, frequency 17.89 Hz, damping ratio 1.91%; (b) second mode, frequency 26.98 Hz, damping ratio 2.29%; and (c) third mode, frequency 42.10 Hz, damping ratio 3.72%.
Figure 9.
The set of frequency response functions between the excitation point and the measurement point in Test 2.
Figure 9.
The set of frequency response functions between the excitation point and the measurement point in Test 2.
Figure 10.
The velocity time curve of Measurement Point 18 in Test 6.
Figure 10.
The velocity time curve of Measurement Point 18 in Test 6.
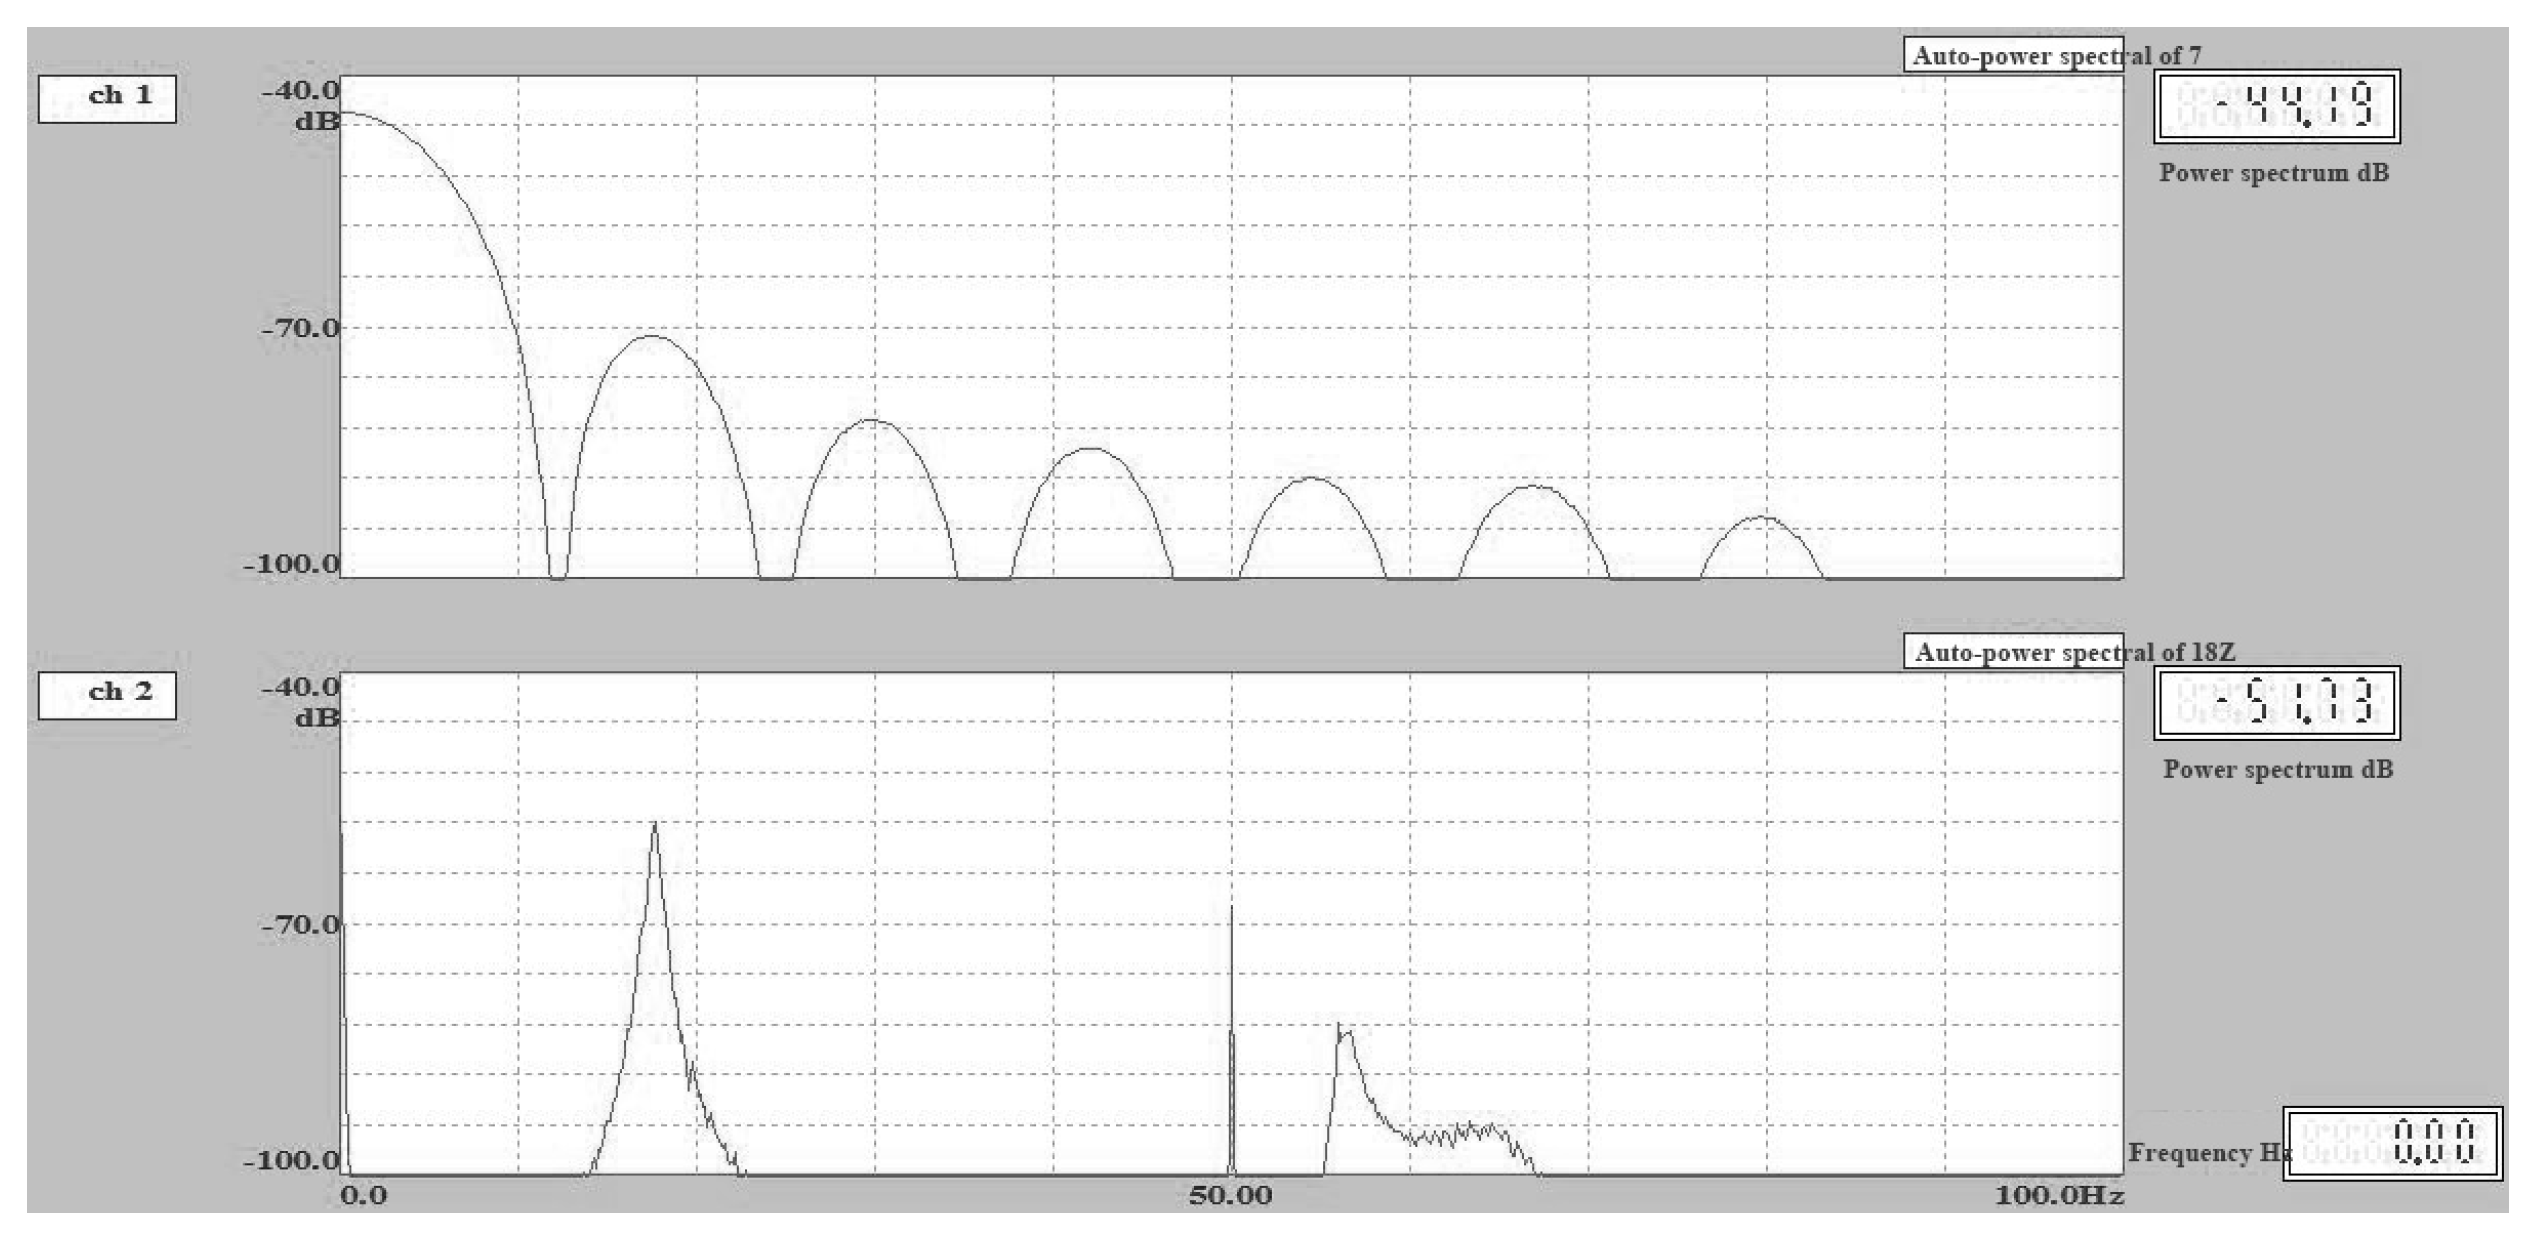
Figure 11.
Velocity power spectrum curve of Point 18 in Test 6.
Figure 11.
Velocity power spectrum curve of Point 18 in Test 6.
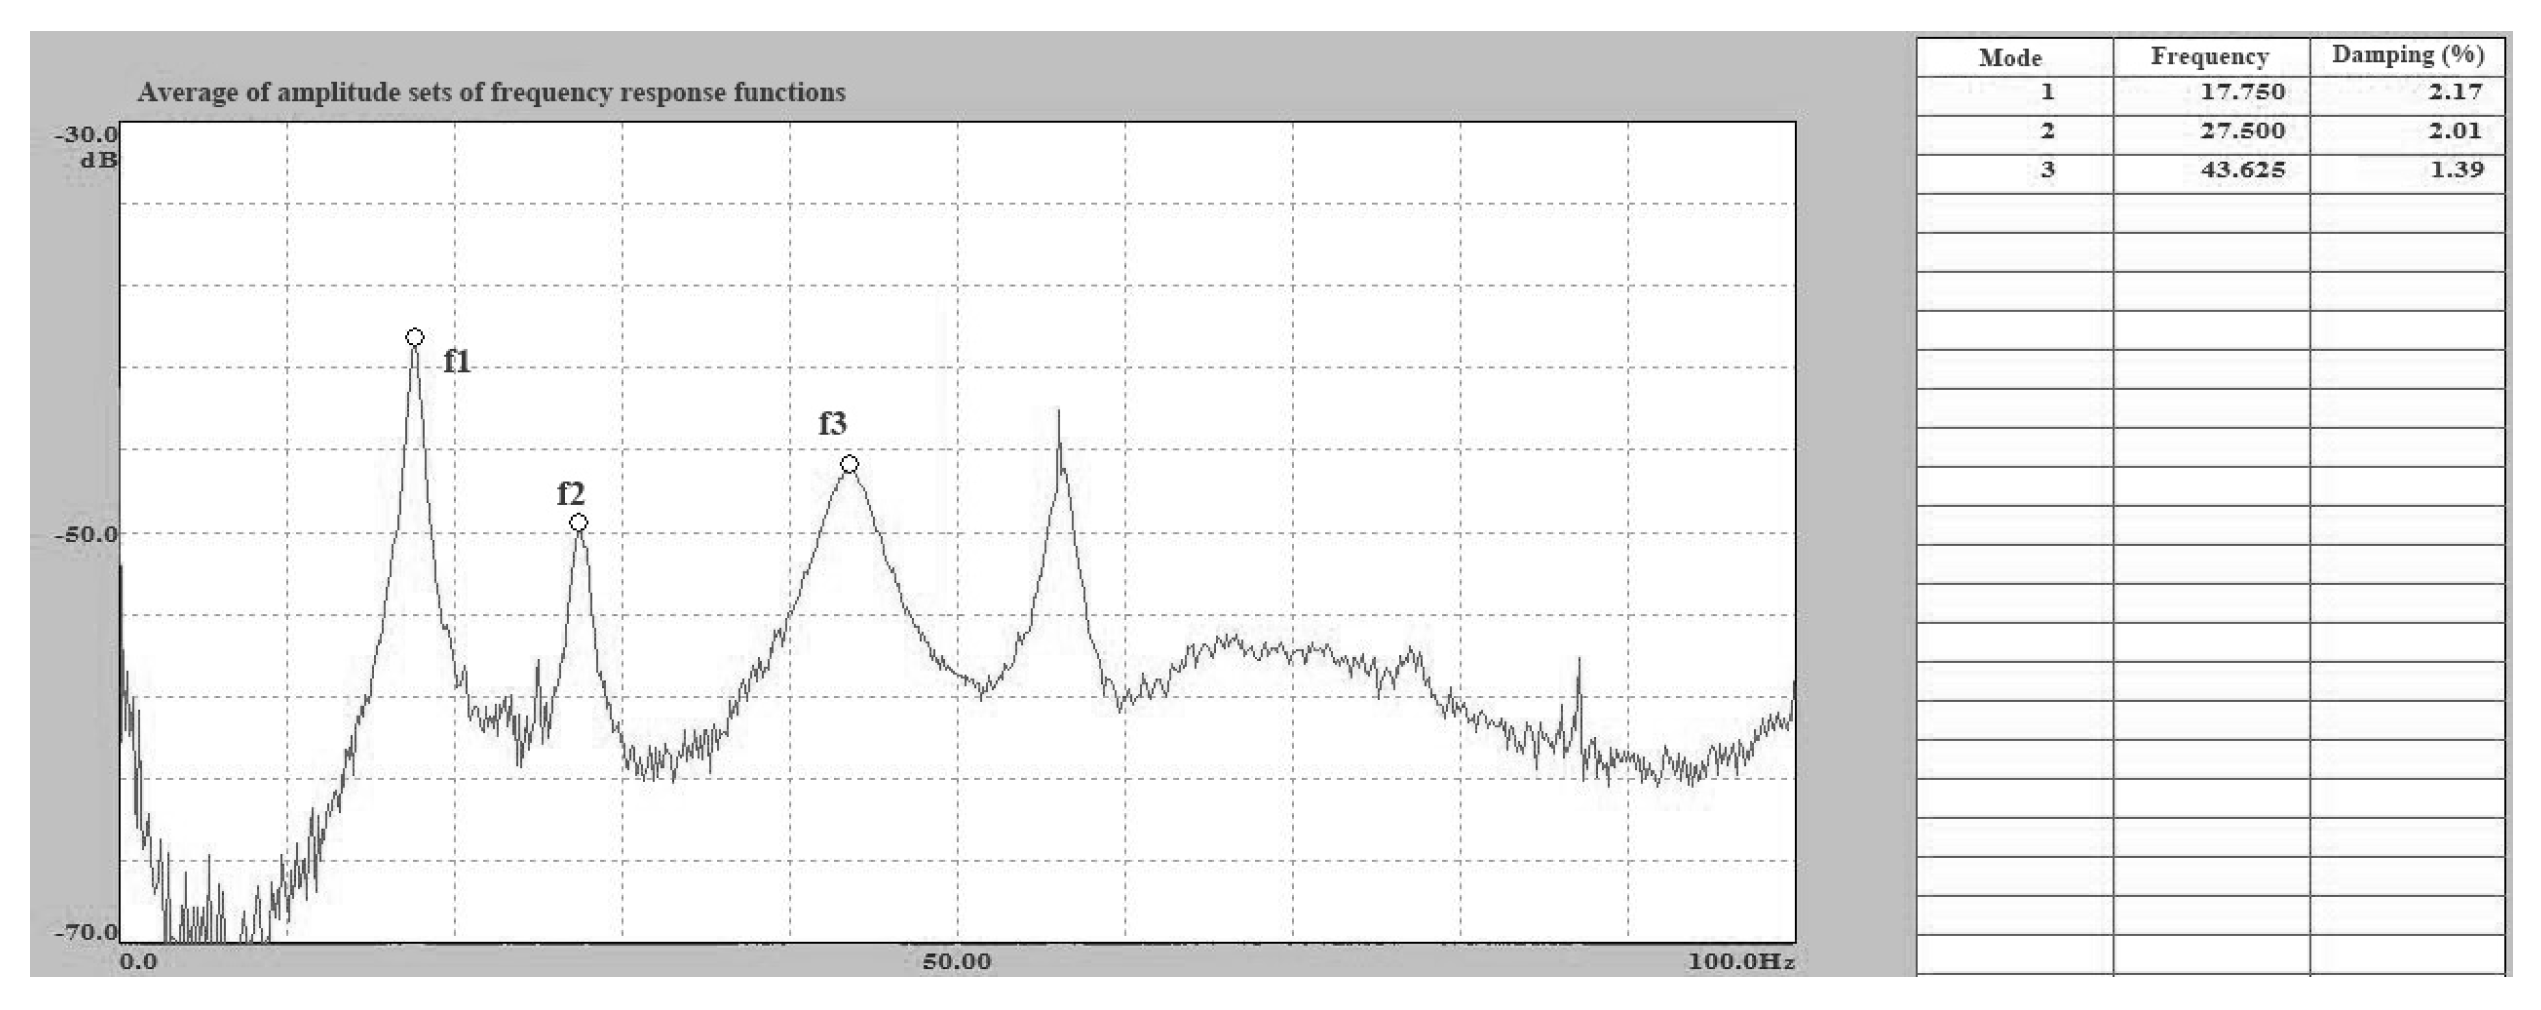
Figure 12.
The natural frequency of the ceramic tile structure obtained from the identification process.
Figure 12.
The natural frequency of the ceramic tile structure obtained from the identification process.
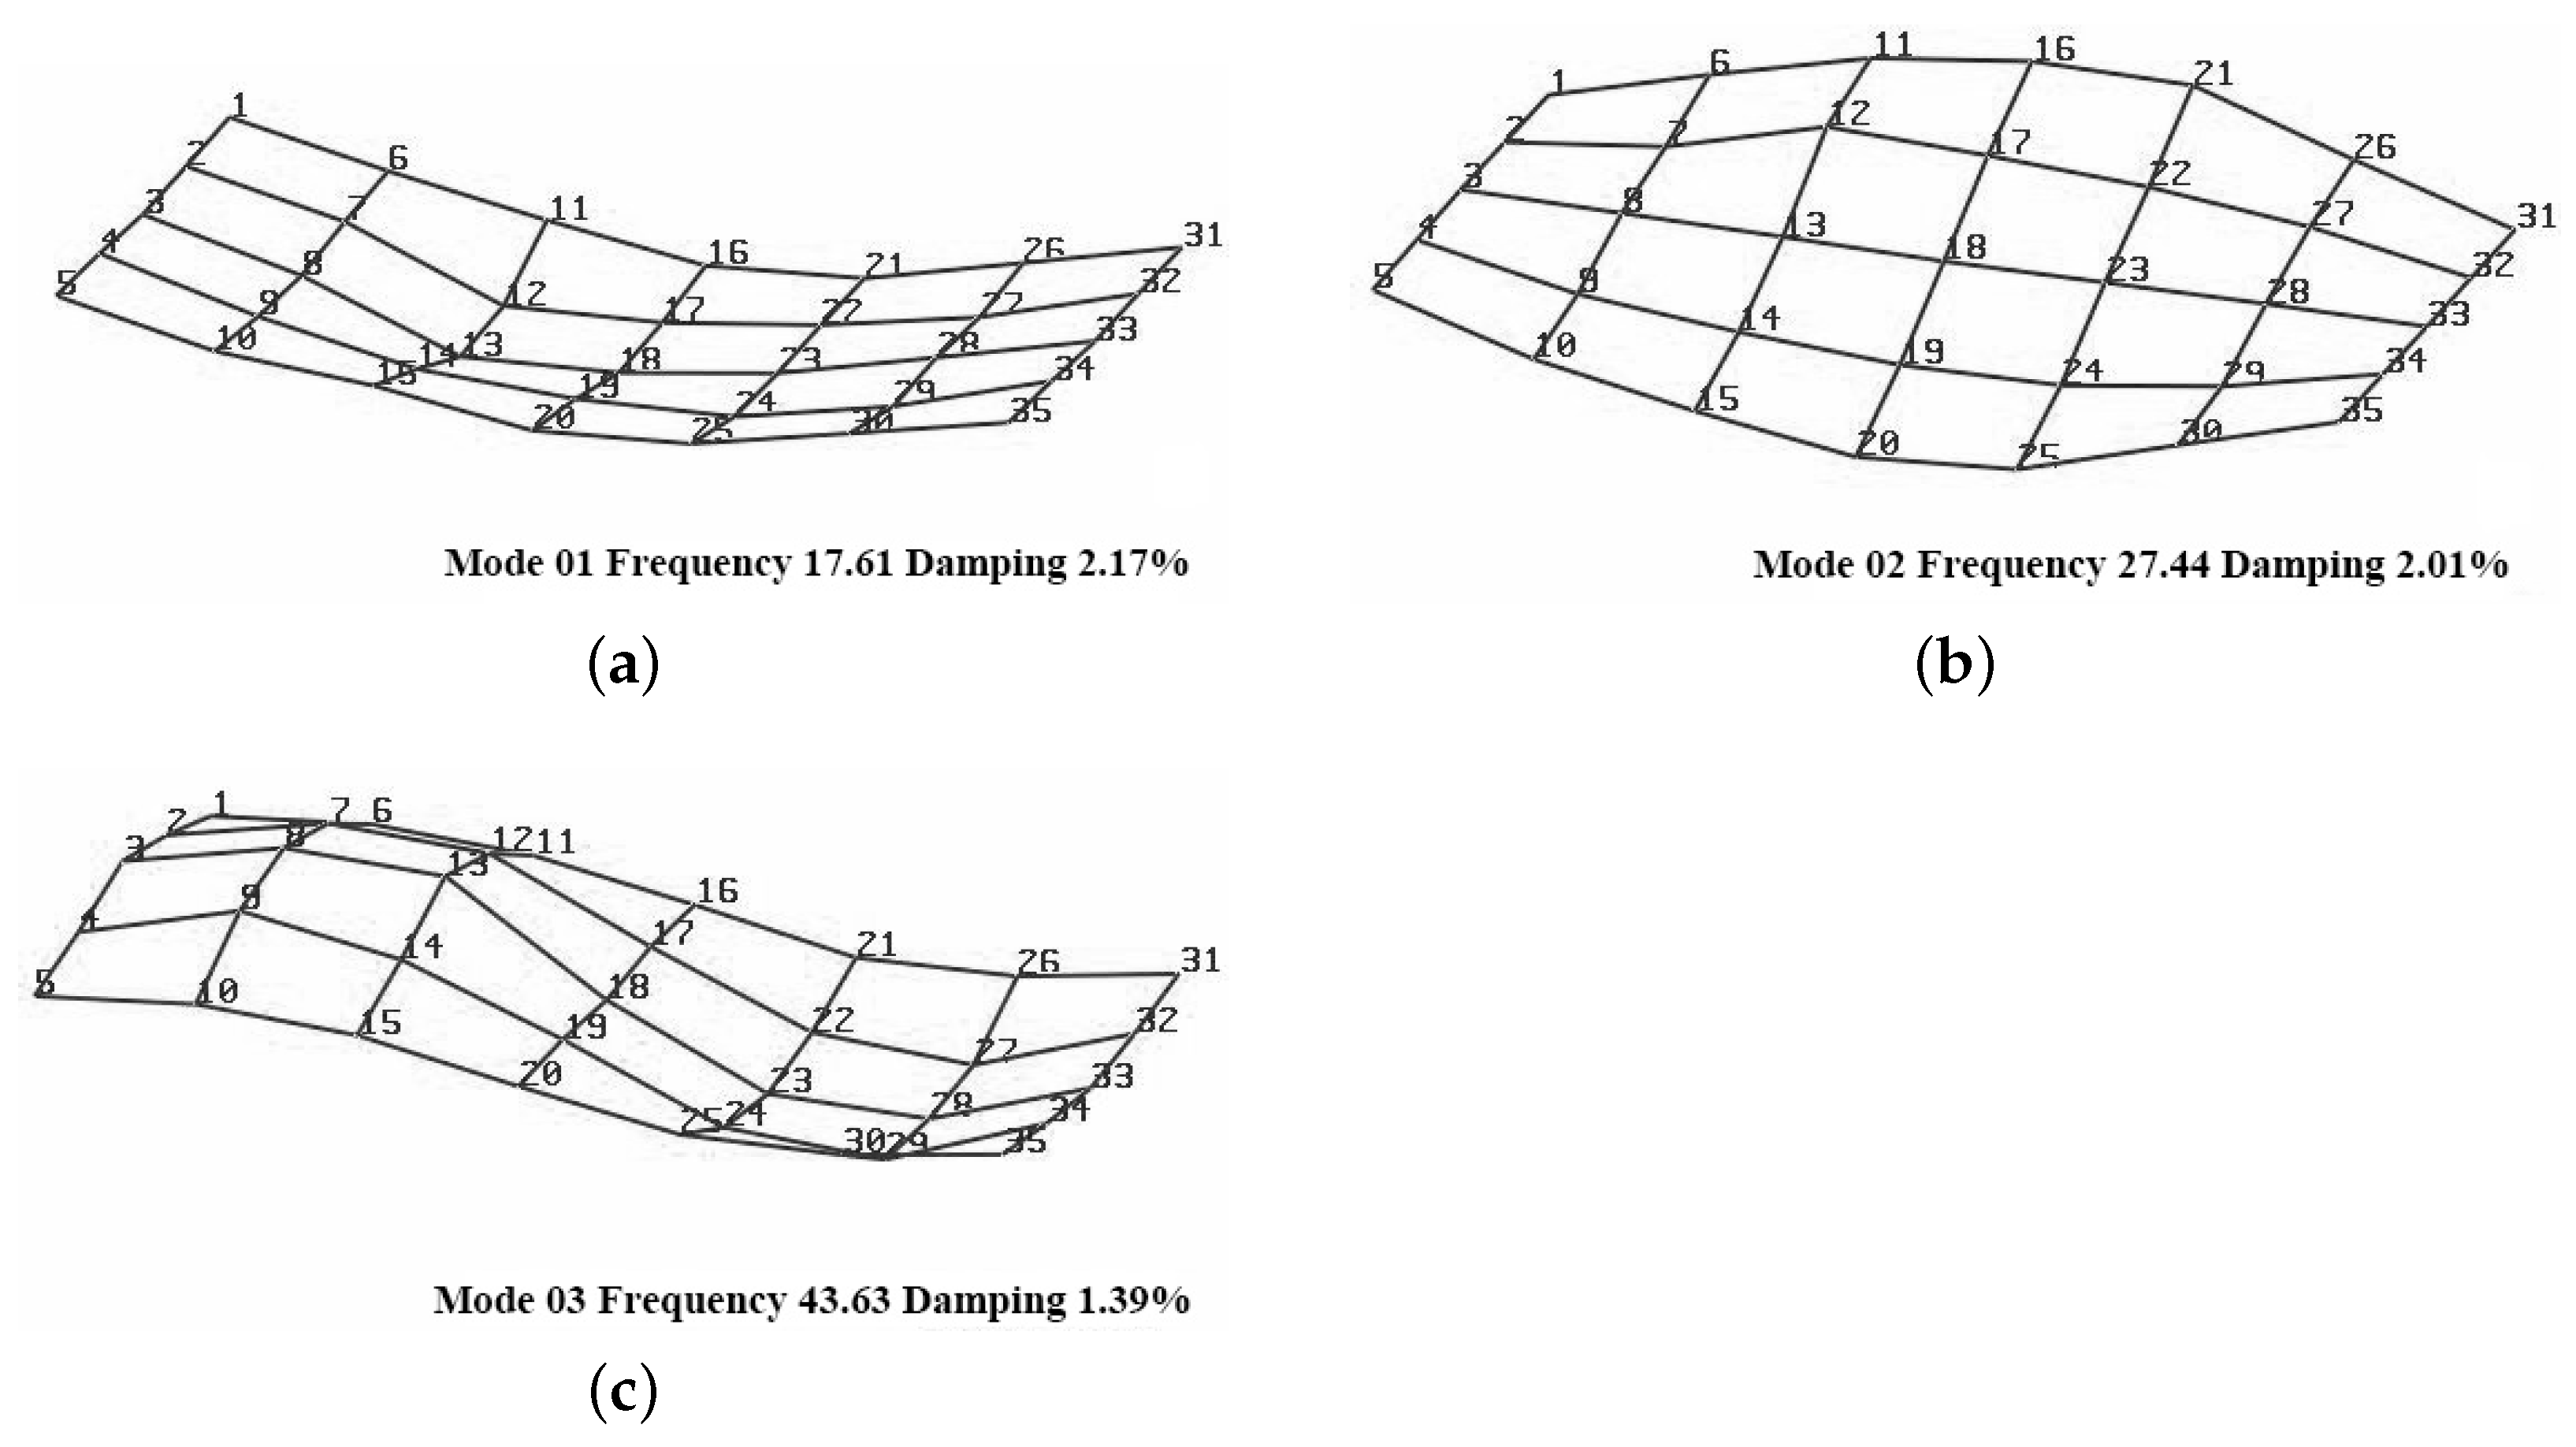
Figure 13.
First third modes and shape function of the original structure in Test 6: (a) first mode, frequency 17.61 Hz, damping ratio 2.17%; (b) second mode, frequency 27.44 Hz, damping ratio 2.01%; and (c) third mode, frequency 43.63 Hz, damping ratio 1.39%.
Figure 13.
First third modes and shape function of the original structure in Test 6: (a) first mode, frequency 17.61 Hz, damping ratio 2.17%; (b) second mode, frequency 27.44 Hz, damping ratio 2.01%; and (c) third mode, frequency 43.63 Hz, damping ratio 1.39%.
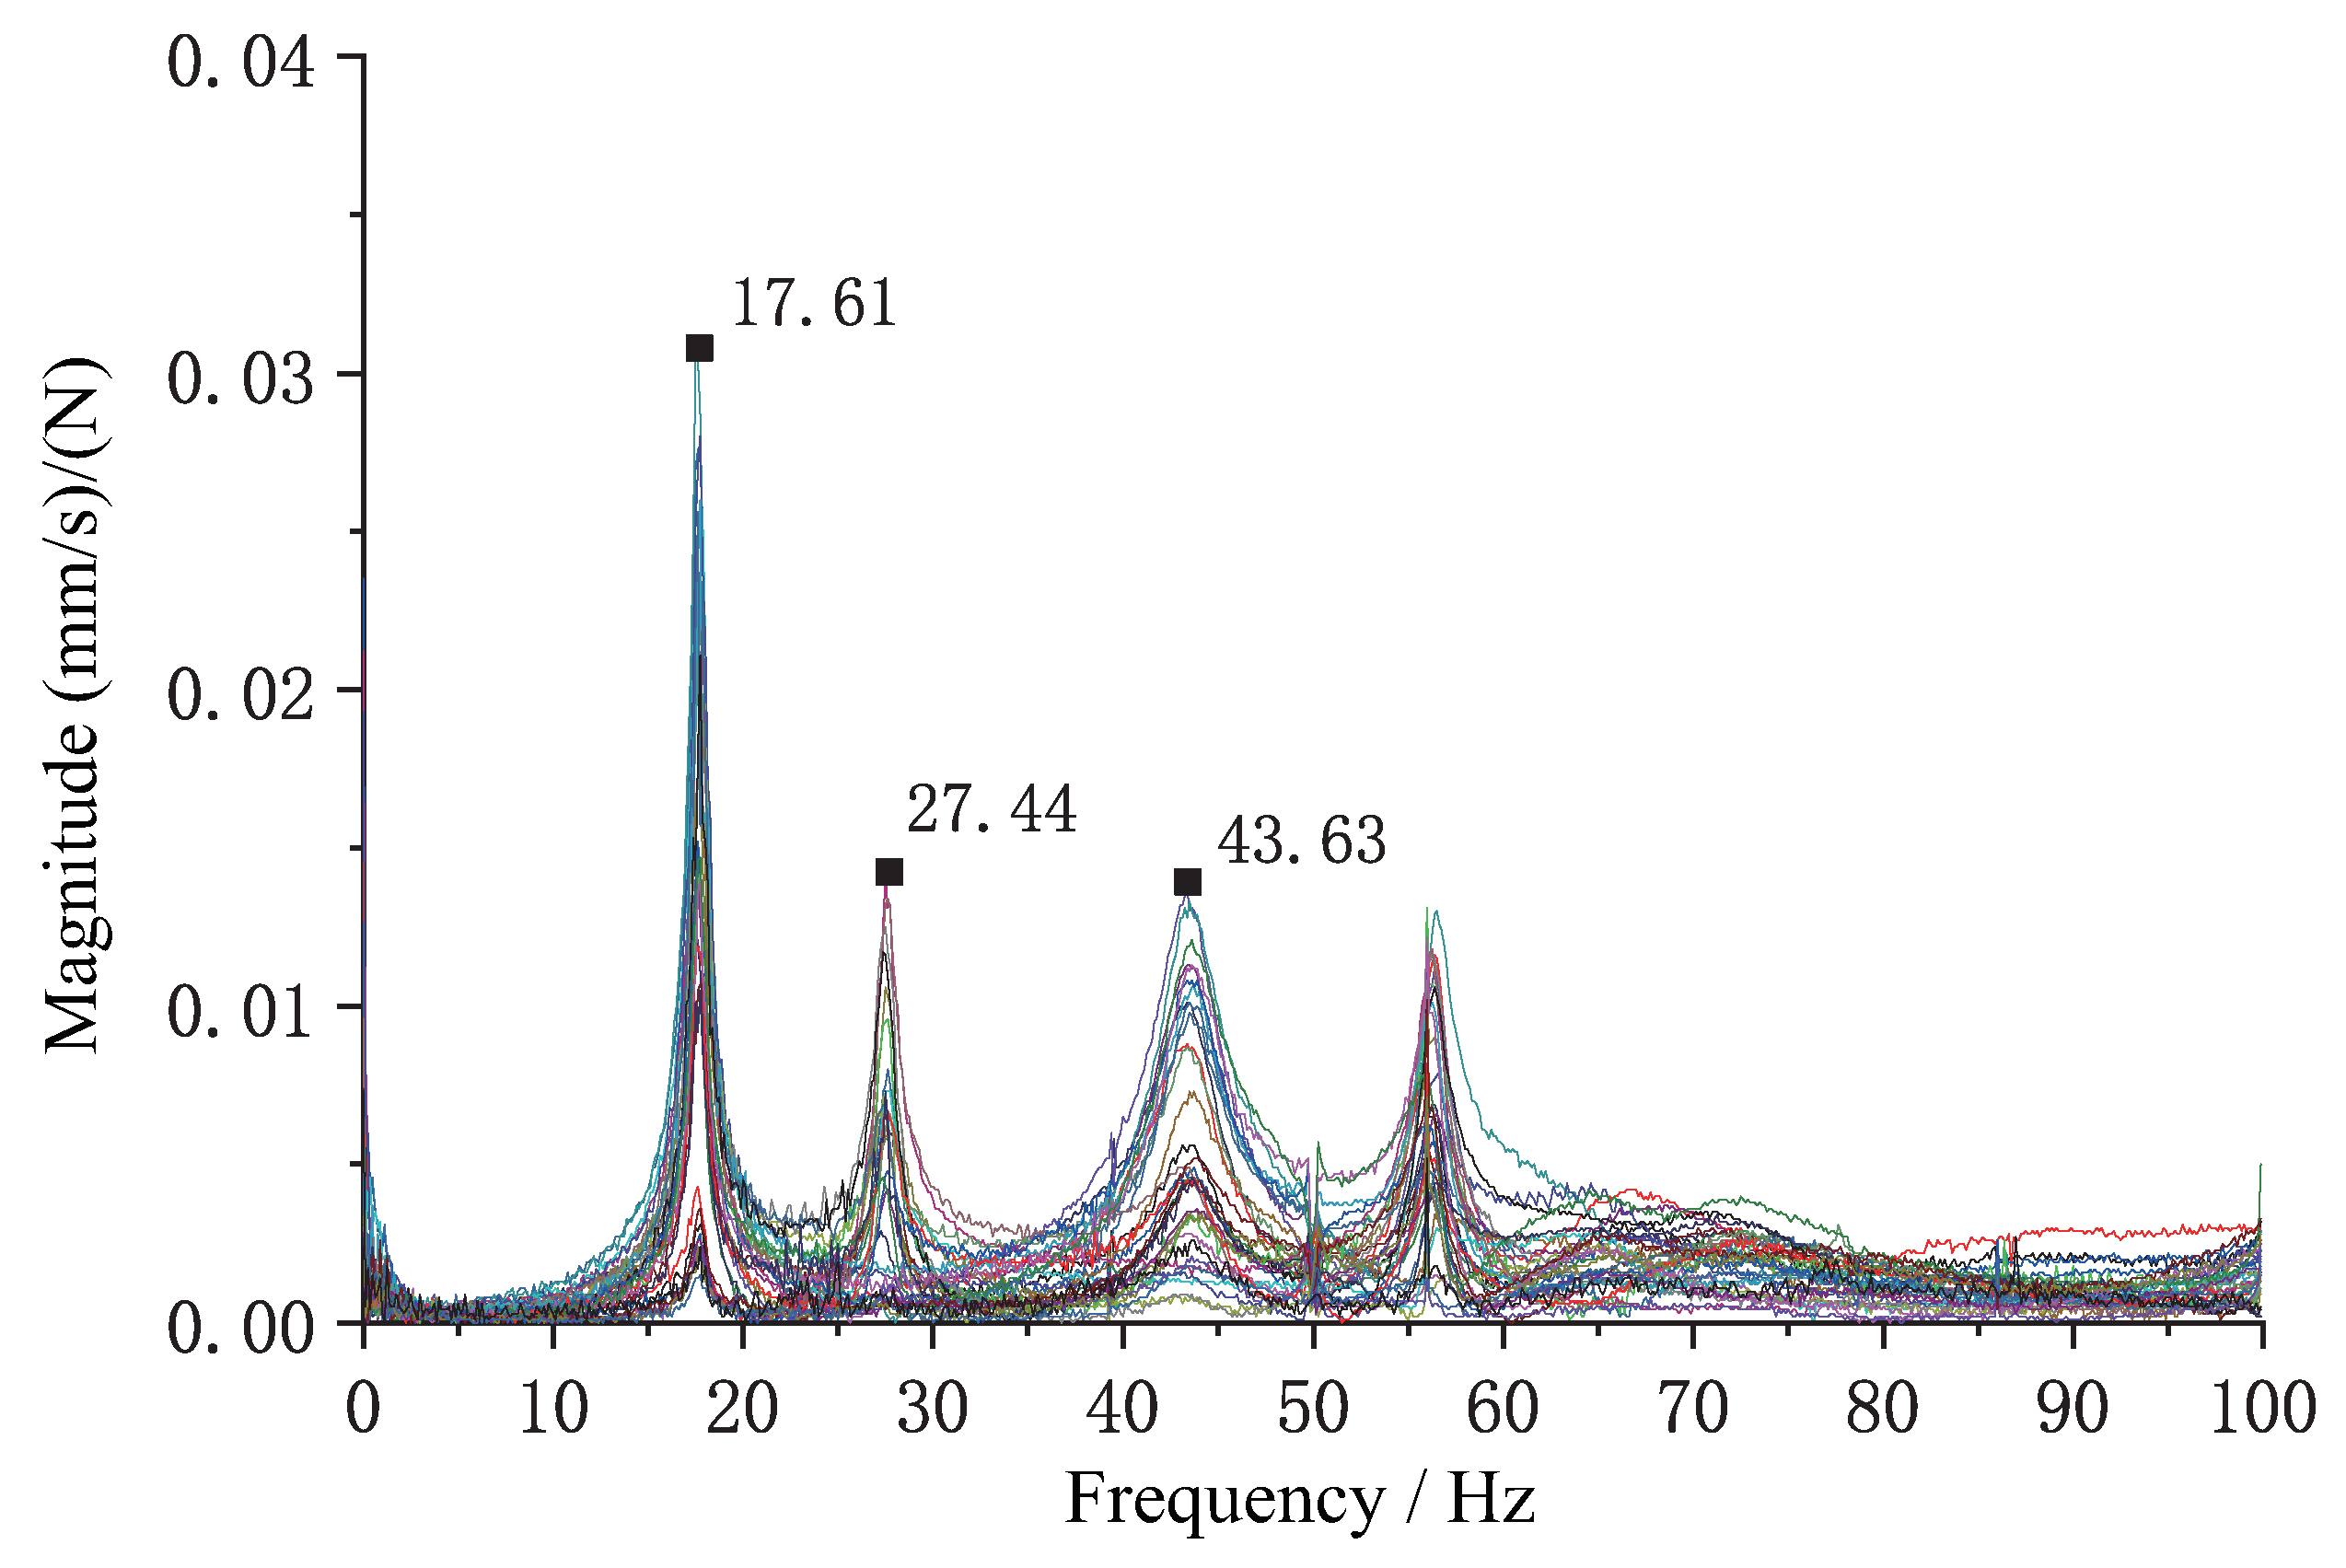
Figure 14.
The set of frequency response functions between the excitation point and the measurement point in Test 6.
Figure 14.
The set of frequency response functions between the excitation point and the measurement point in Test 6.
Figure 15.
The velocity time curve of Measurement Point 18 in Test 12.
Figure 15.
The velocity time curve of Measurement Point 18 in Test 12.
Figure 16.
Velocity power spectrum curve of Point 18 in Test 12.
Figure 16.
Velocity power spectrum curve of Point 18 in Test 12.
Figure 17.
The natural frequency of the terrazzo structure obtained from the identification process.
Figure 17.
The natural frequency of the terrazzo structure obtained from the identification process.
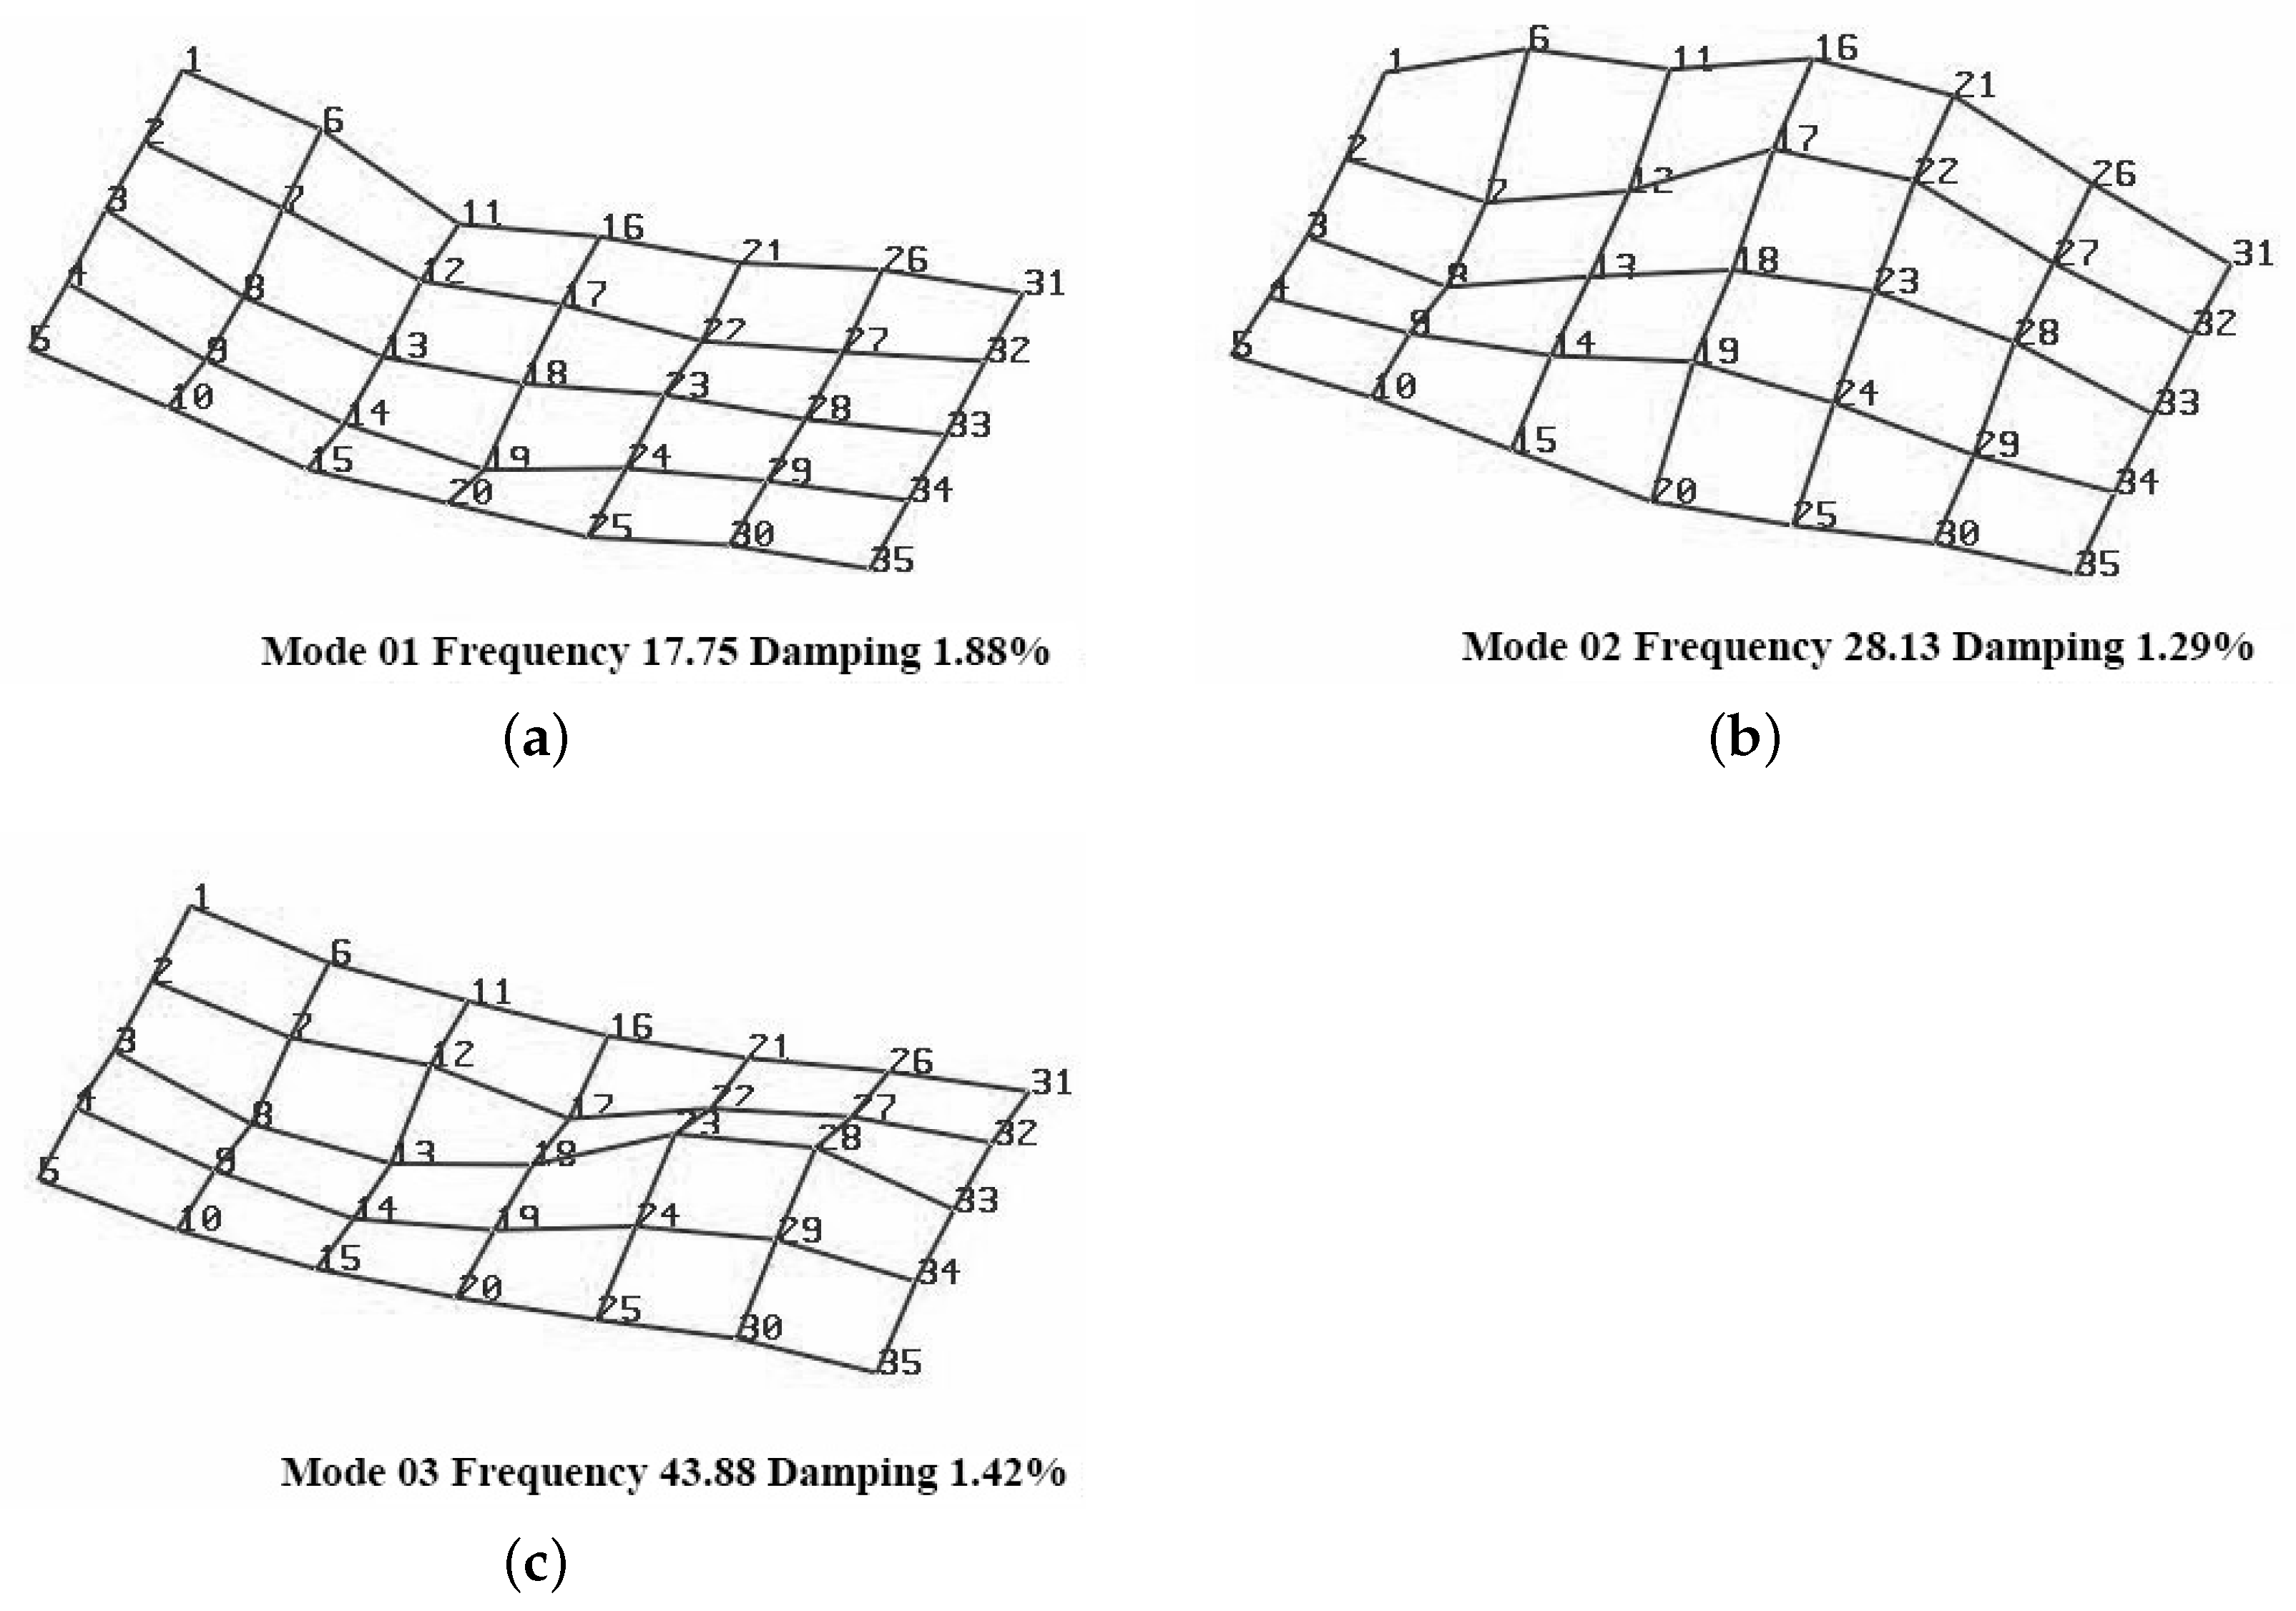
Figure 18.
First third modes and shape function of the original structure in Test 12: (a) first mode, frequency 17.75 Hz, damping ratio 1.88%; (b) second mode, frequency 28.13 Hz, damping ratio 1.29%; and (c) third mode, frequency 43.88 Hz, damping ratio 1.42%.
Figure 18.
First third modes and shape function of the original structure in Test 12: (a) first mode, frequency 17.75 Hz, damping ratio 1.88%; (b) second mode, frequency 28.13 Hz, damping ratio 1.29%; and (c) third mode, frequency 43.88 Hz, damping ratio 1.42%.
Figure 19.
The set of frequency response functions between the excitation point and the measurement point in Test 12.
Figure 19.
The set of frequency response functions between the excitation point and the measurement point in Test 12.
Figure 20.
The velocity time curve of Measurement Point 18 in Test 19.
Figure 20.
The velocity time curve of Measurement Point 18 in Test 19.
Figure 21.
Velocity power spectrum curve of Point 18 in Test 19.
Figure 21.
Velocity power spectrum curve of Point 18 in Test 19.
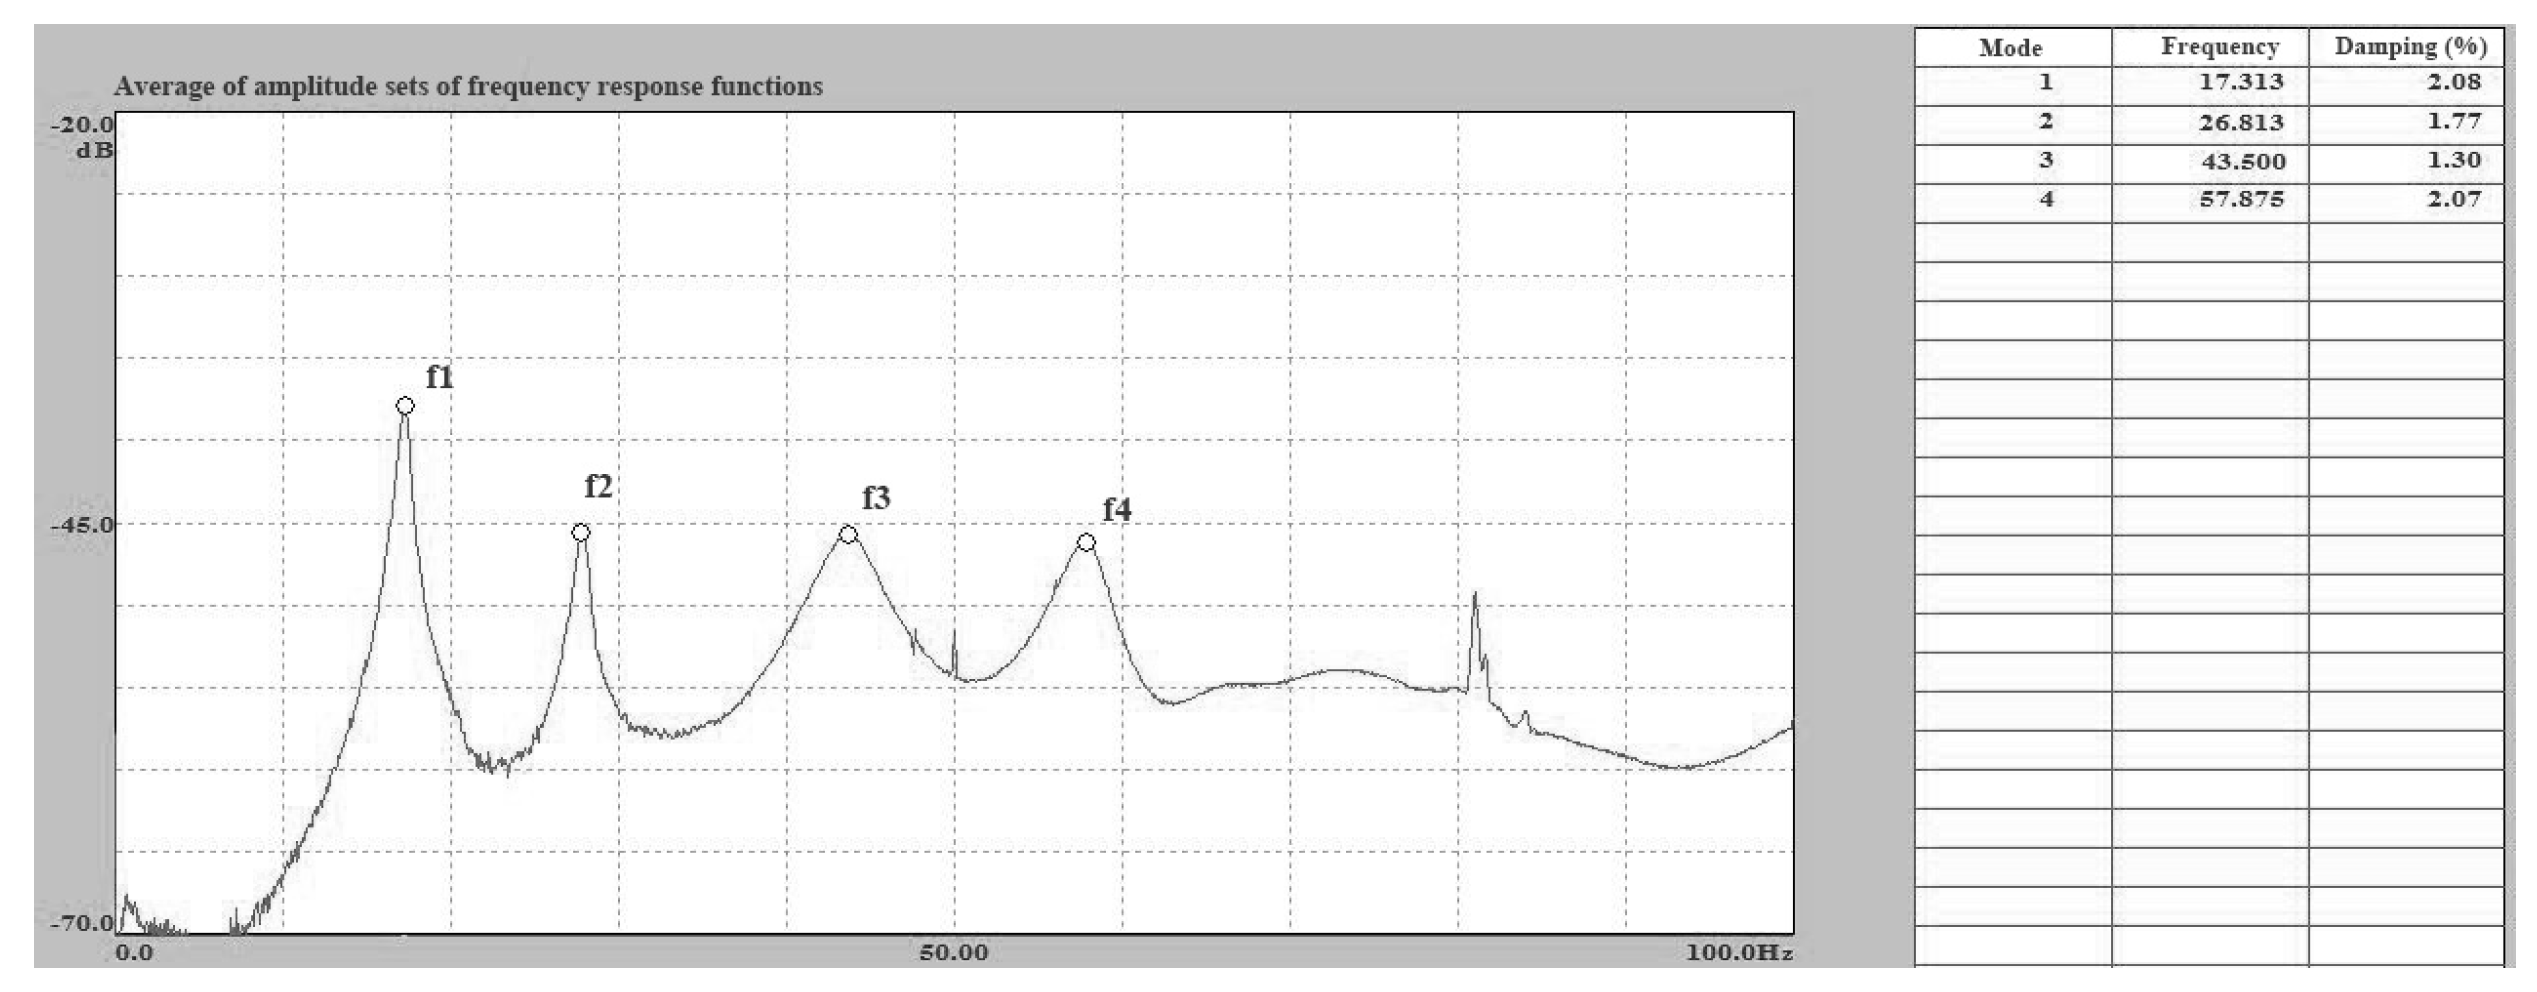
Figure 22.
The natural frequency of the structure with marble surface obtained from the identification process.
Figure 22.
The natural frequency of the structure with marble surface obtained from the identification process.
Figure 23.
First third modes and shape function of the original structure in Test 19: (a) first mode, frequency 17.32 Hz, damping ratio 2.08%; (b) second mode, frequency 26.84 Hz, damping ratio 1.77%; and (c) third mode, frequency 43.50 Hz, damping ratio 1.30%.
Figure 23.
First third modes and shape function of the original structure in Test 19: (a) first mode, frequency 17.32 Hz, damping ratio 2.08%; (b) second mode, frequency 26.84 Hz, damping ratio 1.77%; and (c) third mode, frequency 43.50 Hz, damping ratio 1.30%.
Figure 24.
The set of frequency response functions between the excitation point and the measurement point in Test 19.
Figure 24.
The set of frequency response functions between the excitation point and the measurement point in Test 19.
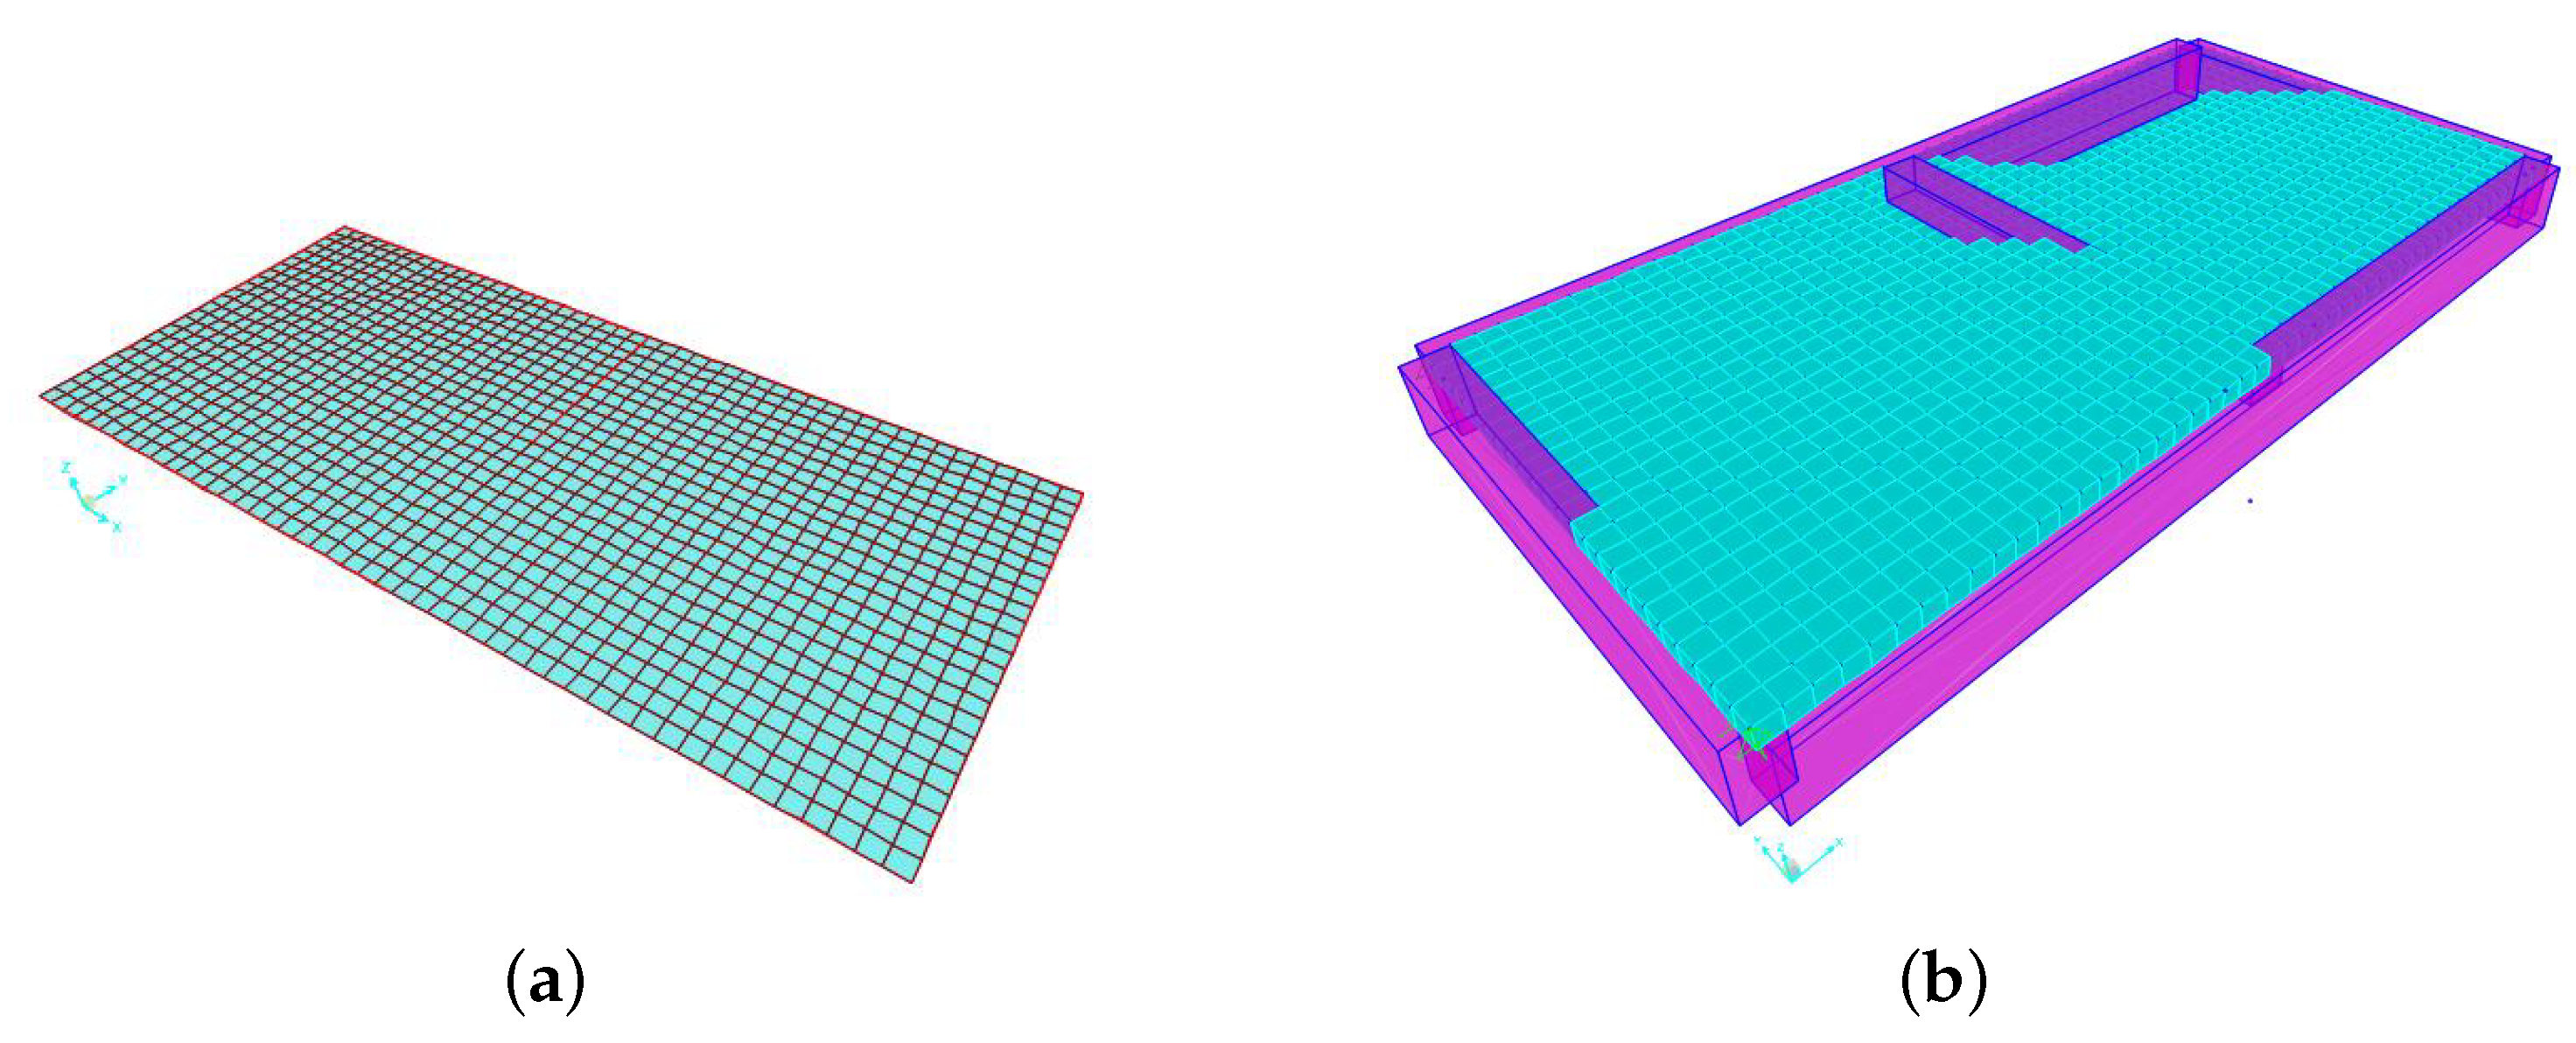
Figure 25.
Finite element model of the plate: (a) the meshing of the plate; and (b) extension view of the plate model.
Figure 25.
Finite element model of the plate: (a) the meshing of the plate; and (b) extension view of the plate model.
Figure 26.
The first fourth order mode of structure obtained from the simulation: (a) first mode; (b) second mode; (c) third mode; and (d) fourth mode.
Figure 26.
The first fourth order mode of structure obtained from the simulation: (a) first mode; (b) second mode; (c) third mode; and (d) fourth mode.
Figure 27.
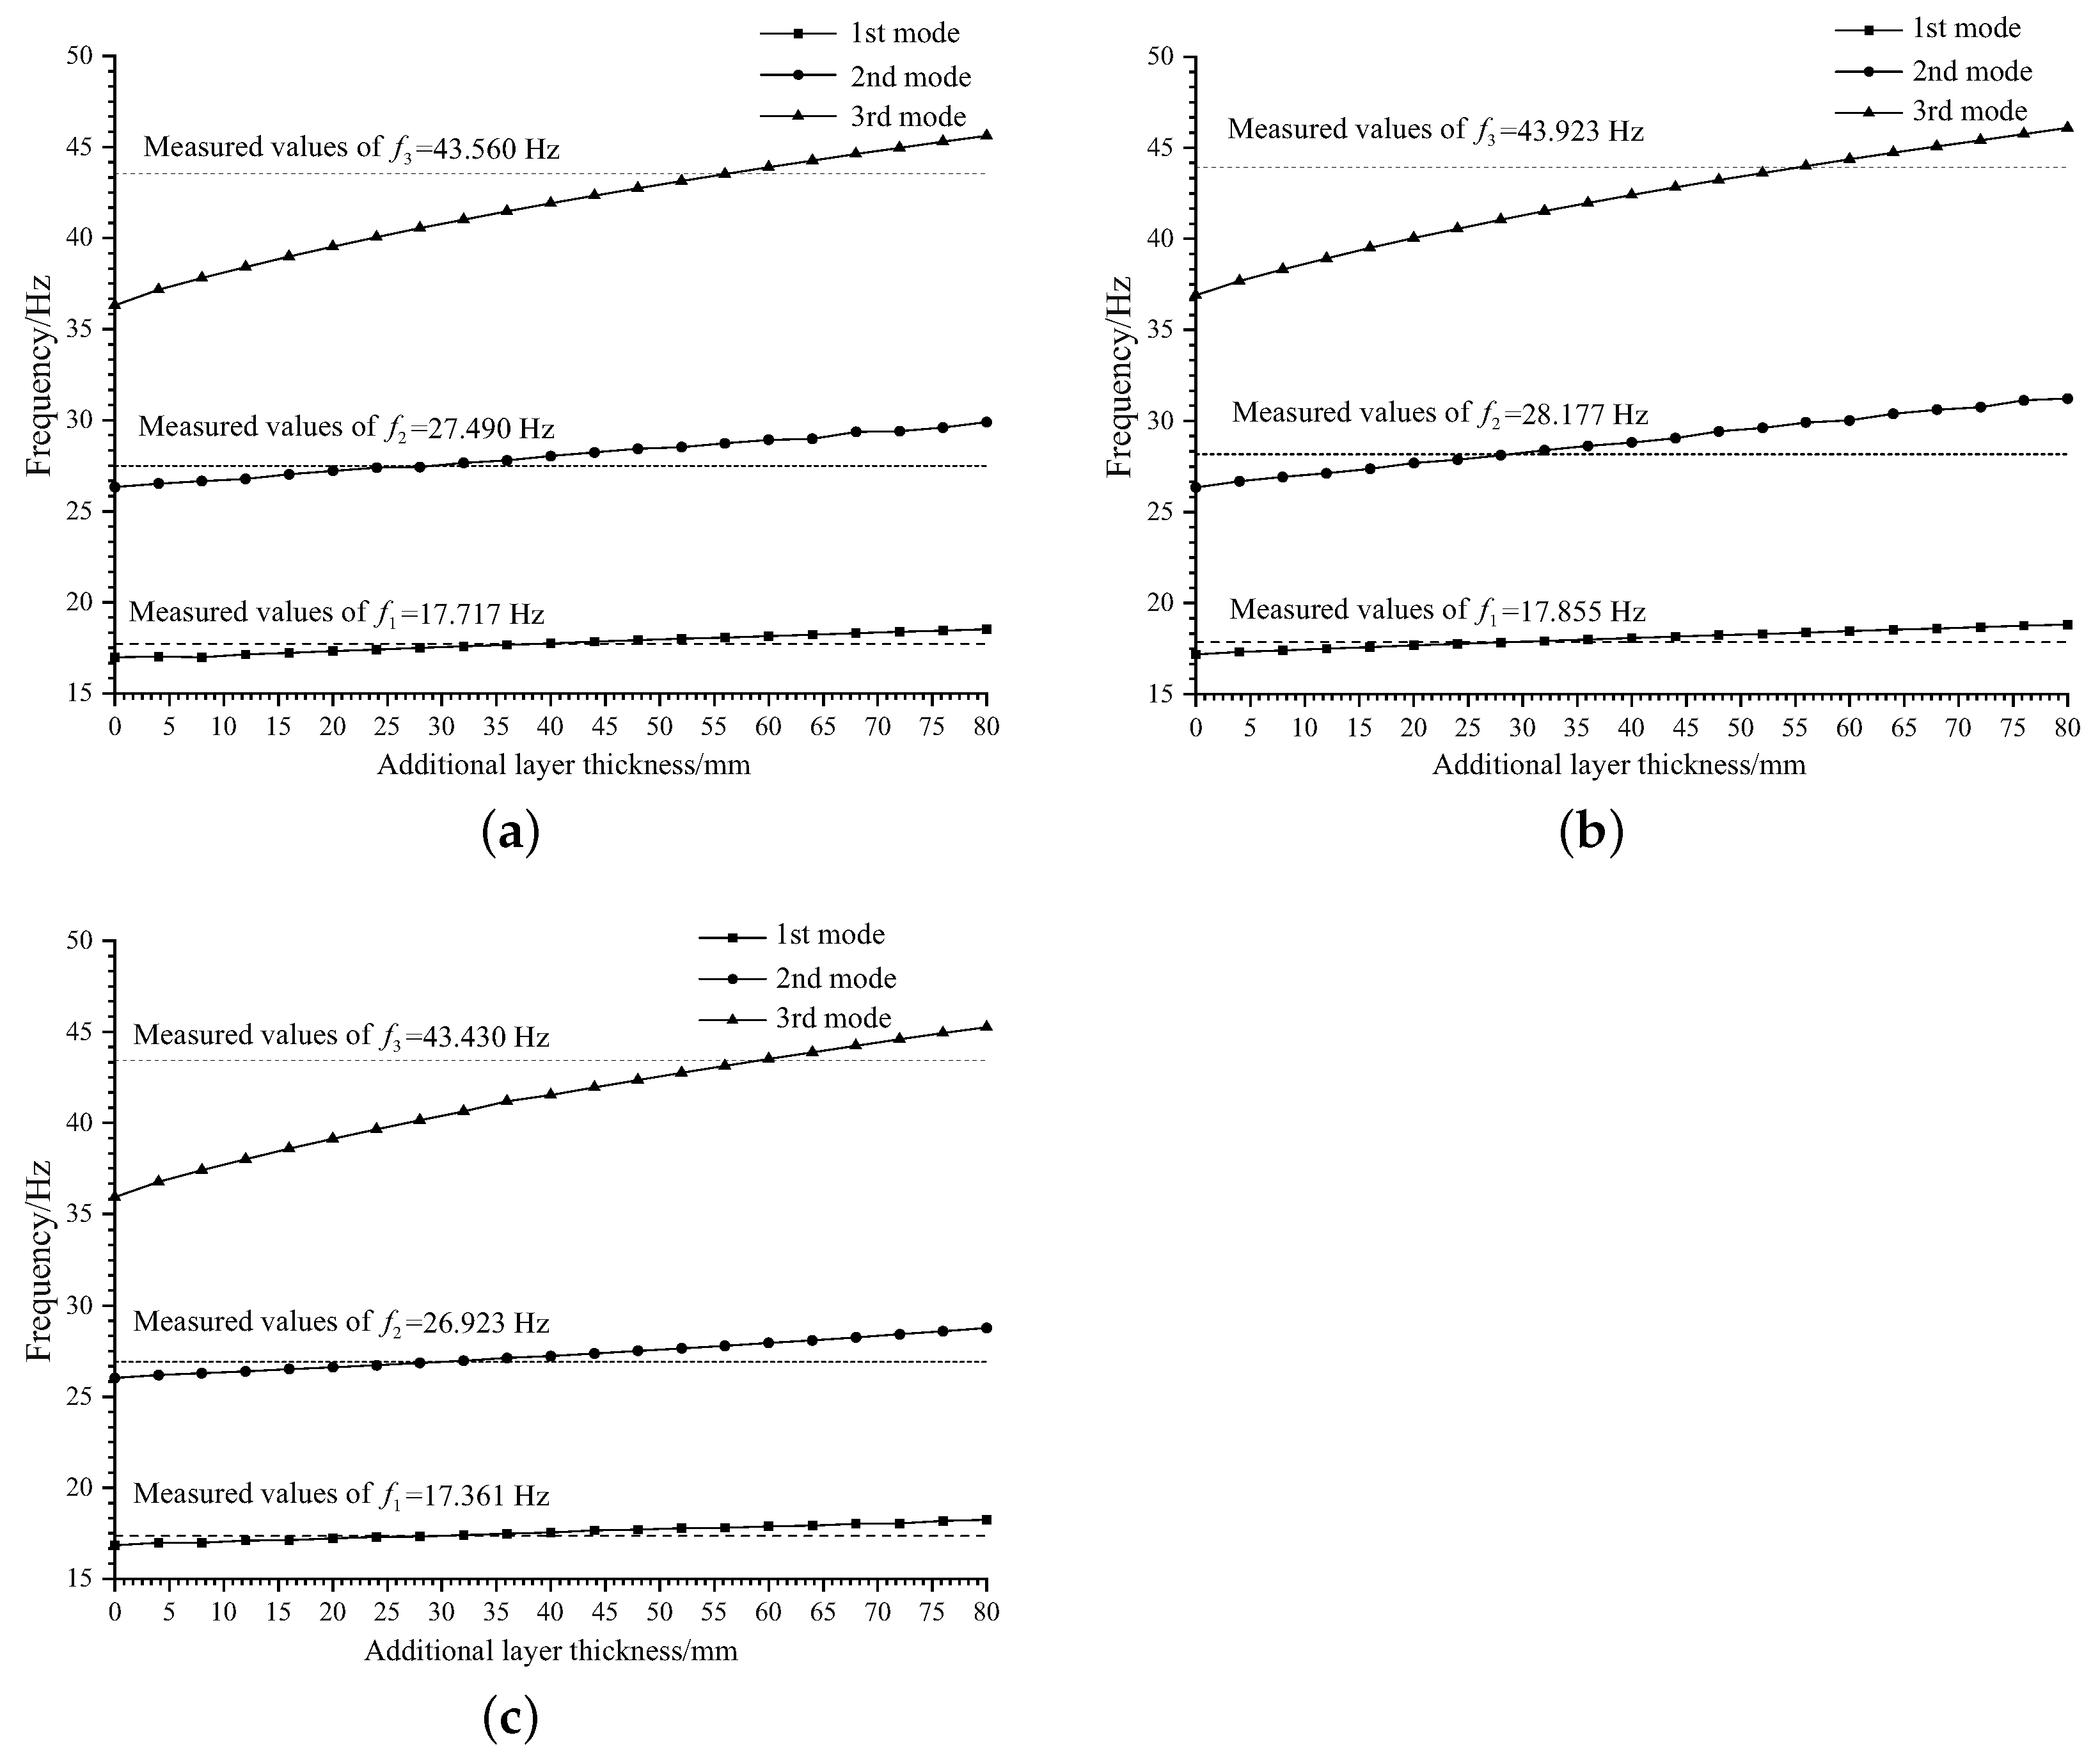
Frequency variation of surface structure with additional layer thickness: (a) structure with ceramic tile surface; (b) structure with ceramic terrazzo surface; and (c) structure with ceramic marble surface.
Figure 27.
Frequency variation of surface structure with additional layer thickness: (a) structure with ceramic tile surface; (b) structure with ceramic terrazzo surface; and (c) structure with ceramic marble surface.
Table 1.
Measured material properties of concrete.
Table 1.
Measured material properties of concrete.
| Maintenance Conditions | Strength Grade | Compressive Strength/MPa |
|---|
| Specimen Value | Representative Value |
|---|
| Outdoors | C30 | 31.4 | 31.87 |
| 32.3 |
| 31.9 |
Table 2.
Average thickness and mass of three types of decorative materials.
Table 2.
Average thickness and mass of three types of decorative materials.
| Types of Material | Measurement Items (Average Values) |
|---|
| Mass | Thickness |
|---|
| Ceramic tile | 1.361 Kg | 7.51 mm |
| Marble | 12.315 Kg | 1.57 mm |
| Terrazzo | —– | 2.89 mm |
Table 3.
Instruments for data acquisition and signal processing.
Table 3.
Instruments for data acquisition and signal processing.
| Instruments | Quantity | Main Technical Specifications |
|---|
| 941-B Ultra Low Frequency Piezoelectric Vibration Pickup | 1 | Passband 0.25 Hz to 80 Hz |
| AZ308 signal acquisition box | 1 | 8 channels |
| AZ804-B Conditioner | 1 | 8 channels |
| AZ_CRAS Dynamic Signal Test and Analysis System | 1 | Version 7.4 |
| Pulse force hammers | 1 | - |
| LK141-43 force sensor | 1 | Sensitivity 4.19 PC/N Range 100 kN |
| Sensor data connection cable | 2 | - |
| Coaxial Cable Data Cable | 3 | - |
| Computer | 1 | - |
| Power supply box | 1 | Voltage 220 V |
Table 4.
Modal test results of Original Structures A–C.
Table 4.
Modal test results of Original Structures A–C.
| Test Structure | Document Number | Hammering Point | Test Number |
|---|
| Original Structure A | A | 7 | 1 |
| B | 7 | 2 |
| C | 7 | 3 |
| D | 9 | 4 |
| E | 9 | 5 |
| Tile structure | F | 7 | 6 |
| G | 7 | 7 |
| H | 7 | 8 |
| Original Structure B | I | 7 | 9 |
| J | 7 | 10 |
| K | 7 | 11 |
| Terrazzo Structure | L | 7 | 12 |
| M | 7 | 13 |
| N | 7 | 14 |
| Original Structure C | O | 7 | 15 |
| P | 7 | 16 |
| Q | 7 | 17 |
| Marble Structure | R | 7 | 18 |
| S | 7 | 19 |
| T | 7 | 20 |
Table 5.
Modal test results of Original Structures A–C.
Table 5.
Modal test results of Original Structures A–C.
| Model Test Results/Hz | Average Value/Hz |
|---|
| Original Structure A | Test order | 1 | 2 | 3 | 4 | 5 | |
| First mode | 17.96 | 17.89 | 17.88 | 17.93 | 17.86 | 17.904 |
| Second mode | 27.05 | 26.98 | 26.97 | 27.02 | 26.95 | 26.994 |
| Third mode | 42.16 | 42.1 | 42.18 | 42.12 | 42.19 | 42.15 |
| Original Structure B | Test order | 9 | 10 | 11 | - | - | - |
| First mode | 17.98 | 17.85 | 17.88 | - | - | 17.903 |
| Second mode | 27.05 | 26.91 | 27.03 | - | - | 26.997 |
| Third mode | 42.25 | 42.10 | 42.12 | - | - | 42.157 |
| Original Structure C | Test order | 15 | 16 | 17 | - | - | - |
| First mode | 17.95 | 17.86 | 17.89 | - | - | 17.900 |
| Second mode | 27.06 | 26.92 | 27.00 | - | - | 26.993 |
| Third mode | 42.11 | 42.15 | 42.20 | - | - | 42.153 |
Table 6.
Modal test results of the ceramic tile structure.
Table 6.
Modal test results of the ceramic tile structure.
| Ceramic Tile Structure | Test Order | 6 | 7 | 8 | Average Value |
| First mode/Hz | 17.61 | 17.82 | 17.72 | 17.717 |
| Second mode/Hz | 27.44 | 27.53 | 27.50 | 27.490 |
| Third mode/Hz | 43.63 | 43.51 | 43.54 | 43.560 |
Table 7.
Modal test results of the plate with terrazzo surfaces.
Table 7.
Modal test results of the plate with terrazzo surfaces.
| Terrazzo Structure | Test Order | 12 | 13 | 14 | Average Value |
| First mode/Hz | 17.750 | 17.940 | 17.875 | 17.855 |
| Second mode/Hz | 28.125 | 28.225 | 28.180 | 28.177 |
| Third mode/Hz | 43.875 | 43.940 | 43.955 | 43.923 |
Table 8.
Modal test results of the plate with marble surfaces.
Table 8.
Modal test results of the plate with marble surfaces.
| Marble Structure | Test order | 18 | 19 | 20 | Average Value |
| First mode/Hz | 17.360 | 17.313 | 17.410 | 17.361 |
| Second mode/Hz | 26.950 | 26.840 | 26.980 | 26.923 |
| Third mode/Hz | 43.370 | 43.500 | 43.420 | 43.430 |
Table 9.
Summary of modal test results.
Table 9.
Summary of modal test results.
| Mode Order | Natural Frequency/Hz (Difference #) |
|---|
| Original Structure | Ceramic Tile Layer | Terrazzo Layer | Marble Layer |
|---|
| First mode | 17.900 | 17.717 (−1.02%) | 17.855 (−0.25%) | 17.361 (−3.01%) |
| Second mode | 26.990 | 27.490 (1.85%) | 28.177 (4.40%) | 26.923 (−2.48%) |
| Third mode | 42.150 | 43.560 (3.35%) | 43.923 (4.21%) | 43.430 (3.04%) |
Table 10.
Comparison between numerical simulation and experimental results.
Table 10.
Comparison between numerical simulation and experimental results.
| Mode Order | Measured Value/Hz | Simulation Results/Hz | Difference # |
|---|
| First mode | 17.900 | 17.929 | 0.162% |
| Second mode | 26.990 | 26.986 | −0.015% |
| Third mode | 42.150 | 39.035 | −7.391% |
Table 11.
Results of natural mode of numerical model and comparison with measured values for additional layer thickness of 29–31 mm.
Table 11.
Results of natural mode of numerical model and comparison with measured values for additional layer thickness of 29–31 mm.
| Structure with ceramic tile | Thickness of the Additional Layer | 29 mm | 30 mm | 31 mm |
| Simulation | Differnece # | Simulation | Difference | Simulation | Difference |
| First mode | 17.692 | −0.14% | 17.738 | 0.12% | 17.736 | 0.11% |
| Second mode | 26.985 | −1.87% | 27.380 | −0.40% | 27.781 | 1.05% |
| Third mode | 40.763 | −6.86% | 40.935 | −6.41% | 41.082 | −6.03% |
| Structure with Terrazzo Surface | Thickness of the Additional Layer | 29 mm | 30 mm | 31 mm |
| Simulation | Difference | Simulation | Difference | Simulation | Difference |
| First mode | 17.877 | 0.13% | 17.916 | 0.34% | 17.958 | 0.57% |
| Second mode | 28.190 | 0.05% | 28.297 | 0.42% | 28.380 | 0.72% |
| Third mode | 41.284 | −6.39% | 41.453 | −5.96% | 41.602 | −5.58% |
| Structure with marble surface | Thickness of the Additional Layer | 29 mm | 30 mm | 31 mm |
| Simulation | Difference | Simulation | Difference | Simulation | Difference |
| First mode | 17.356 | −0.03% | 17.376 | 0.08% | 17.426 | 0.37% |
| Second mode | 26.921 | −0.01% | 26.956 | 0.12% | 27.005 | 0.30% |
| Third mode | 40.333 | −7.68% | 40.563 | −7.07% | 40.688 | −6.74% |


