Abstract
Stress arching effect during the excavation of broken surrounding rock in underground engineering has an important influence on the stability of surrounding rock after underground excavation. To determine the stress arching effect in horizontally layered jointed rock mass, the stress arching characteristics of surrounding rock mass after excavation is analyzed in this study by using a series of numerical tests. The formation mechanism of stress arch is revealed through a comparison of the stress characteristics of a voussoir beam structure and theoretical analysis of multi-block mechanical relationship of jointed rock mass. The method for determining the boundaries of a stress arching zone is proposed, and the influence of various factors on a stress arch is further discussed. Results show that after the excavation of horizontally layered jointed rock mass, the stress arch bunch (SAB) is formed in the lower strata above the cavern, and the global stress arch (GSA) is formed in the higher strata, both of which are symmetrical arch stress patterns. The SAB is the mechanical manifestation of the voussoir beam structure formed by several low-level sandstone layers, and the GSA is caused by the uneven displacement between blocks. Compared with the GSA, the SAB is more sensitive to various influencing factors. The extent of stress arching zone decreases with the increase of an internal friction angle of the joint, lateral pressure coefficient, and overburden depth. In addition, the joint spacing of rock strata is conducive to the development of a stress arch. Results can provide technical support for deformation control and the stability analysis of broken surrounding rock in underground engineering.
1. Introduction
Layered rock mass is one of the most common types of rock mass in underground engineering. Owing to the long process of sedimentary diagenesis and geological tectonic action, layered rock mass develops near-horizontal bedding planes and is accompanied by a large number of joints and fissures perpendicular to the bedding plane [1]. The structural plane of rock mass often affects its mechanical behavior, such as discontinuity of rock mass caused by joints, which leads to deformation and strength anisotropy of rock mass [2]. Therefore, the stress arching effect formed in the process of stress adjustment of disturbed surrounding rock tending to new equilibrium must be different from that of other rock masses when excavating a cavern in a horizontally-layered jointed rock mass with a layered and highly discrete structure. The stress arching of surrounding rock in underground excavation fully mobilizes its self-stabilization ability, makes the stress redistribution of surrounding rock reasonable, and plays an important role in the stability of a cavern [3]. Considering the increasing number of tunnels and mining projects that have encountered horizontally-layered jointed rock mass, studying the stress arching effect of this type of rock mass with special joint distribution is of great engineering significance.
In view of the stress arching effect of rock and soil, several theories have been formed to promote the development of stress arch theory. Examples of these theories are Platts pressure arch theory for broken rock mass [4], Terzaghi soil arching theory for sand [5], and voussoir beam structure theory for blocky rock mass [6,7]. The research on stress arch by using an indoor model test is favored by many scholars. Aiming to determine the stress arching effect in sandy soil, Pardo et al. [8], Ahmadi et al. [9], and Bi et al. [10] used the trap door test, whereas Lee et al. [11] used the centrifugal model test to explore the stress response characteristics and stress arch zone morphology of soil after opening. Regarding the stress arching effect in jointed rock masses, Murayama and Matsuoka [12] and Wu et al. [13] used aluminum rods and blocks in the trap door test to study the stress changes and the evolution law of the arching zone during tunnel excavation. In addition, the numerical simulation method has been widely used because of its obvious advantages in stress field visualization and parameter sensitivity analysis. For example, the numerical method based on a continuous medium is used to study the influence of rock mass strength, in situ stress, and excavation span on the formation of a stress arch [14,15,16,17]. Considering the discontinuity of rock mass, the formation mechanism of surrounding rock stress arch and its influencing factors are analyzed by using discrete element analysis [18,19,20]. The characteristics of particle displacement and load transfer when soil arching effect occurs in geotechnical materials are studied from the granular and mesoscopic perspectives by using the particle discrete element method [21].
The stress arching zone is an important content in quantifying the stress arching effect. At present, the determination of its scope depends on the analysis of stress redistribution. Scholars define the area where the horizontal stress/vertical stress of surrounding rock is greater than the lateral pressure coefficient [22], the tangential stress increasing area [23], and the maximum principal stress increasing area [17] after excavation as the extent of stress arch. Lee et al. [11] pointed out that the area between the outer boundary of the plastic zone and the boundary of a unit arching ratio (the ratio of the vertical stress change above the arching line to the total overburden pressure) greater than 1% is regarded as the arching zone. Chen et al. [14] suggested that the shift of the inflection points of vertical stress-depth curves above the tunnel roof during tunneling can be a reliable index to show the development of ground arching. Yang et al. [24] determined the location of the pressure arch between the inner boundary line where the curve was connected to the peak points of the maximum principal stress of the surrounding rock and the outer boundary line connecting the points where the stress variable was equal to 10%. Kong et al. [16] proposed that the inner and outer boundaries of arching zone are determined as the principal stress trajectories through the inflection points of the principal stress-depth curves on the central line of caverns.
Although the stress arching effect is common in underground excavation, its formation mechanism is closely related to the properties of geotechnical materials. The stress arching effect is different in rock and soil with different properties, and the description indexes of arching zone obtained by stress redistribution analysis are naturally different. In terms of the research on the stress arching effect of jointed rock mass, the current analysis on the stress redistribution of discontinuous rock mass is insufficient. Moreover, research on the formation mechanism of stressing arch is not in-depth, which limits further research on the shape description of the stress arch area and the stability mechanism of the stress arch structure. Therefore, this study aims to deeply understand the stress arching effect in horizontally-layered jointed rock mass through numerical simulation and theoretical analysis. The characteristics of stress redistribution of surrounding rock after excavation are analyzed using discrete element numerical software. The formation mechanism of the stress arch is discussed according to voussoir beam and rock bending theory. On this basis, the determination method and zoning index of a stress arching zone are proposed, and the influence of various factors on the formation of a stress arch is discussed.
2. UDEC Model
To gain a clear understanding of the formation process of a stress arch in horizontally-layered jointed rock masses, a series of numerical experiments considering different parameters was carried out using the two-dimensional discrete element program (UDEC) [25]. The near-horizontal sandstone intercalated with mudstone developed by joints in the Ordos Basin is selected as the numerical simulation prototype. The bedding plane of the rock mass is assumed to be continuous in the horizontal direction, whereas the joints are discontinuous in the layered direction. The multi-layered sandstone and mudstone layers have the same thickness and mechanical properties, respectively.
The dimensions of the UDEC model are 60 m in width and 59 m in height, and the grid division of the model is shown in Figure 1. In the model, sandstone and mudstone are interbedded. A single sandstone layer is 1 m thick, and a single mudstone layer is 0.3 m thick. Each rock layer is horizontal. The spacing of joints perpendicular to the rock layer is fixed at 0.25 m in mudstone, whereas it is a variable parameter Sj in sandstone. The joint group offset between sandstone layers is Sj/2. The rectangular 8 m × 4 m cavity is located 36.9 m below the model surface, and the roof excavation line coincides with the bedding surface. The excavation is realized by deleting blocks in the cavity area at one time. The bottom boundary of the model was fixed, and the lateral boundaries of the model were fixed in the horizontal direction. The upper boundary of the model was constrained by the stress boundary. A uniform load is needed to be applied to the upper surface of the model, the value of which is equal to the weight of the rock layer of the difference between the in-situ depth of the cavern and the depth of the model.
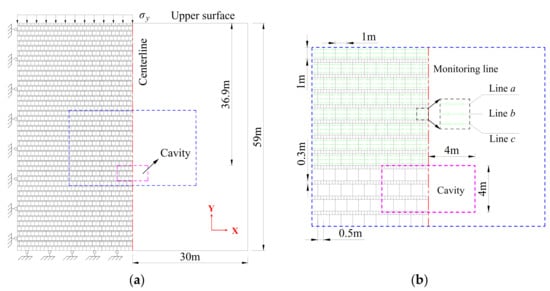
Figure 1.
UDEC model: (a) Numerical grid division and boundary constraint and (b) layout of survey lines in a monitoring area.
The rock material is assumed to be an elastic-plastic continuum, and a strain-softening constitutive model that can reflect the softening characteristics of the material after yielding is adopted. The bedding and joints follow the Coulomb-slip model. Table 1 shows the physical and mechanical parameters of rocks and discontinuities. The initial in situ stress is assumed to be uniformly distributed in the calculation area, and the two principal stress components act on the x and y axes. The initial in situ stress value is applied in a manner that linearly increases with the buried depth, the horizontal in situ stress is proportional to the vertical in situ stress, and ratio λ is the lateral pressure coefficient of the in-situ stress. The overburden depth from the ground surface to the roof of the cavern is H (H > 36.9 m), and the uniform load σy of the weight of H-36.9 m thick strata should be applied on the upper surface of the model.

Table 1.
Physical and mechanical parameters of rock mass.
The mechanical response of layered jointed rock mass may have structural mechanical characteristics and computational efficiency problems caused by a high grid density. Hence, to conveniently analyze the stress and displacement distribution in the roof strata, a horizontal monitoring line was laid out at each part of the upper part (0.1 m from the upper surface, line a), the middle part (0.5 m from the upper surface, line b), and the lower part (0.1 m from the lower surface, line c) in each sandstone layer above the cave in a certain height range, as shown in Figure 1b.
Table 2 shows the four series of numerical experiments designed by using the controlled variable method to study the effects of joint internal friction angle φ, sandstone joint spacing Sj, lateral pressure coefficient λ, and overburden depth H on the formation of stress arch. Series A focuses on the effect of joint internal friction angle φ. Joint internal friction angle φ varies as 10°, 20°, 25°, and 30°. The other parameters are fixed: Sj = 1 m, λ = 0.25, and H = 60 m. Series B considers the effect of sandstone joint spacing Sj, which takes the value of 0.5 m, 1.0 m, 1.5 m, and 2.0 m. The other parameters remain unchanged: φ = 25°, λ = 0.5, and H = 60 m. Series C is designed to examine the influence of lateral pressure coefficient λ, which varies as 0.25, 0.5, 1.0, and 2.0. The other parameters are assumed as: Sj = 1.0 m, φ = 20°, and H = 40 m. Similarly, series D is planned to investigate the influence of overburden depth H, which ranges from 40 m to 100 m with an interval of 20 m. The other parameters are kept constant: Sj = 2.0 m, φ = 25°, and λ = 0.25.
Table 2.
Parameters of various numerical models.
3. Simulation Results and Discussion
The stress arching effect is the phenomenon of stress redistribution in surrounding rock to achieve self-stabilization after cavern excavation. A comprehensive analysis of the stress redistribution of surrounding rock is important to understand the stress arching mechanism and indirectly describe the stress arch area.
3.1. Arching Characteristics of Principal Stress of Surrounding Rock
For comparison, a case of excavation in intact rock mass is also presented. Parameters used in UDEC simulations are the same as sandstone in Table 1. In UDEC, a crack must intersect the edge of the original block to create new blocks. Thus, one additional crack has to be created to retain the cavity in calculation procedure, as shown in Figure 2. It is observed that the stress within a certain zone in the vicinity of the excavation is disturbed. The rock mass stabilizes itself through forming an arch-shaped structure of the major principal stress above the opening. Beneath the arch-shaped structure is the distressed zone. Observed from the principal stress vector plot, the vertical stresses are almost zero and the horizontal stress is tensile stress within this zone.
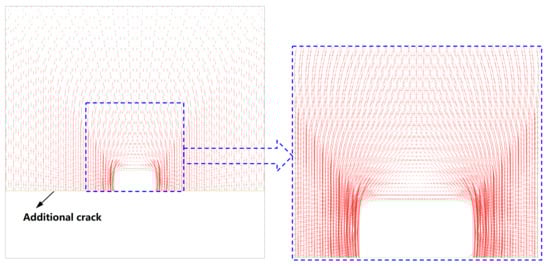
Figure 2.
Distribution of major principal stresses in roof strata of intact rock mass.
Compared with the stress arch in intact rock mass, the stress arch in horizontally-layered jointed rock mass has distinct characteristics. Figure 3 shows the principal stress distribution after the surrounding rock is stabilized (Case C1: Sj = 1.0 m, φ = 20°, λ = 0.25, and H = 40 m). The direction of the principal stress of the roof strata is deflected within a certain range, and the trajectory of the major principal stress is an elliptical shape with an opening downward. These trajectories constitute the overburden stress arching zone with a certain thickness. The overburden stress arch is called the global stress arch (GSA). The major principal stresses in several sandstone layers under its inner boundary are arched independently, and single arches with different rise-span ratios in each layer are stacked to form the stress arch bunch (SAB). Furthermore, the trajectory of the major principal stress in each layer is not a precise arch shape but partially linear in the middle with direction parallel to stratification, and the trajectory of the major principal stress flows into the GSA through the middle and lower parts of the abutment. With the increase of the distance from the roof excavation line, the single arch span decreases, and the arch trajectory of the major principal stress becomes less obvious.
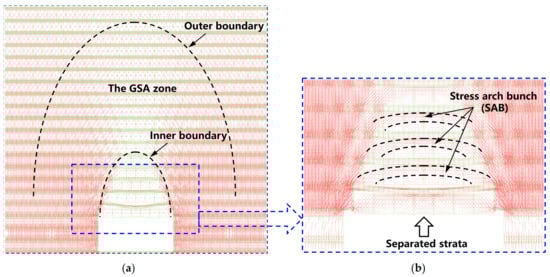
Figure 3.
Distribution of major principal stress in roof strata for case C1: (a) The GSA formed by major principal stress and (b) the SAB in shallow roof strata.
In addition, the sandstone at the bottom of the roof of the cavern has significantly slid downward but has not collapsed. The upper mudstone layer, which is laid on the top after contacting with sandstone, has large bending and subsidence. No serious irregular collapse and blocks fall in the shallow strata of the roof, which is obviously closely related to the formation of the GSA in deep strata and the SAB in shallow strata.
3.2. Horizontal and Vertical Stress Redistribution Characteristics of Surrounding Rock
Unlike continuous homogeneous medium, layered jointed rock mass may show great differences in the magnitude and direction of stress in different strata or at different heights of the same strata due to the existence of a structural plane after disturbance. On the basis of data of the monitoring points in the simulation test, this study analyzed the distribution characteristics of horizontal and vertical stress at different heights in different layers of sandstone along the stratification direction. In the analysis, compressive and tensile stresses are indicated by positive and negative signs, respectively.
In case C1 simulation results, the bottom rock layer of the cavern roof has produced evident slip and settlement, which is regarded as a potential collapse layer beyond the scope of the SAB. Figure 4 shows the stress distribution in the sandstone layer at different heights above the cavern (e.g., the distance between the lower surface of the rock stratum and the excavation line of the roof hb = 1.3 m, 13 m, and 23.4 m). The diagram shows that: (1) The upper part of the low-level sandstone layer is in a high horizontal compressive stress state near the middle line of the cave, and a high horizontal tensile stress state is detected near the square of the cave wall. The distribution of horizontal stress along the stratification direction in the lower part of the rock layer is completely opposite to that in the upper part, and the horizontal stress value in the middle of the rock layer is low. (2) The vertical stress at different heights of the low-level sandstone layer shows roughly the same distribution law in the layered direction. The vertical stress value in a certain span near the central line of the cave is approximately 0, and the peak vertical compressive stress is slightly outside the cave wall. (3) With the increase of the distance from the excavation line of the roof, the stress directions at different heights of the sandstone layer at higher levels are consistent, and the stress value gap is reduced. Horizontal stress is relatively high above the cavern and adjacent areas, and the vertical stress is relatively low in this range.
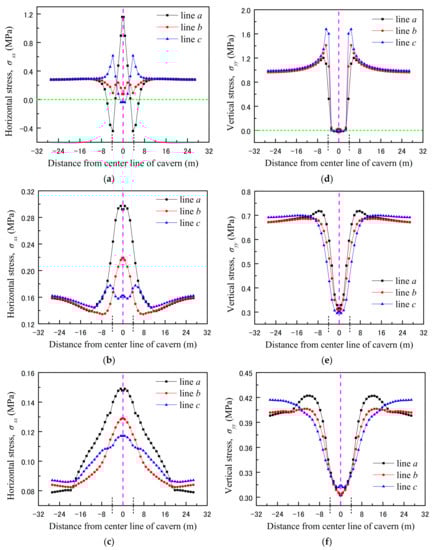
Figure 4.
Distribution of horizontal stress and vertical stress in a sandstone layer of roof for case C1: (a–c) show the horizontal stress distribution (σxx) along the stratification direction (hb = 1.3 m, hb = 13 m, and hb = 23.4 m, respectively); (d–f) show the vertical stress distribution (σyy) along the stratification direction (hb = 1.3 m, hb = 13 m, and hb = 23.4 m, respectively).
3.3. Formation Mechanism of the SAB and Description of the Arching Zone
The horizontal stress redistribution law of the low-level sandstone layer directly above the cavern in the horizontally-layered jointed rock mass is in good agreement with the horizontal stress distribution characteristics of the voussoir beam structure, as shown in Figure 5. After unloading, the low-level jointed sandstone layer forms an upward concave deflection curve under the action of vertical load, and the upper part of the rock layer is compressed whereas the lower part is stretched. The lower part of the rock stratum is opened because the joint surface can hardly resist tension, and the larger displacement extends in the direction of stratification, resulting in concentrated horizontal extrusion force on the lower part of the stable rock stratum on both sides. Under the reaction force, the voussoir beam structure of “exterior is beam and essence is arch” is formed in the low-level jointed sandstone layer. Bending of rock strata and tensile stress in rock mass are the primary reasons for the formation of a voussoir beam [18], and the principal stress arching in the rock stratum is the mechanical mechanism for the stability of the structure. The SAB appearing on the roof of the cavern in the horizontally layered jointed rock mass is the mechanical manifestation of the voussoir beam structure formed by several low-level sandstone layers.
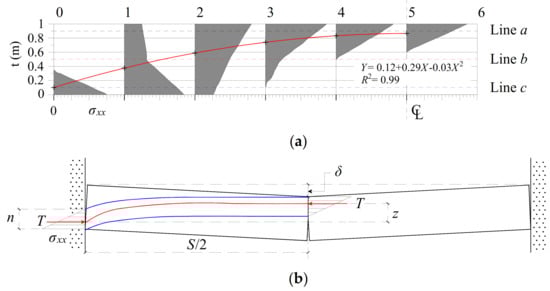
Figure 5.
Mechanical structure and horizontal stress distribution of voussoir beam [1]: (a) Horizontal stress distribution (σxx) along voussoir beam (left abutment to center) with a span of 10 m (joint spacing Sj = 1 m) and (b) sketch of a voussoir beam with two blocks.
Many hypotheses explain the distribution form of horizontal stress acting at abutments of voussoir beam along the depth direction [6,26,27], but the extreme value of horizontal stress is at the lowest position of abutments. On the basis of the characteristics of the formation and stress distribution of voussoir beams, an estimation method describing the extent of SAB of horizontally-layered jointed rock mass is proposed. The inner boundary point of the single arching zone in the SAB is the position where the horizontal stress of the lower part of the sandstone layer transits from tensile stress to compressive stress, and the outer boundary point is the position of the peak value of horizontal stress in the lower part. The height of the critical layer where the stress is not arching (the span of the inner boundary is 0) in a single sandstone layer is the height of the outer boundary of the SAB. The line connecting the outer boundary points of each sandstone layer is the outer boundary of the SAB.
The extent of the SAB of the roof sandstone layer for case C1 is the bell-shaped area delineated by the red dash line as shown in Figure 6. The inner boundary points spacing and outer boundary points spacing of the single arch area in each sandstone layer decrease with the increase of horizon height, and the outer boundary point spacing of the arching zone in the bottom layer is close to the cavern span. The bell-shaped region obtained on the basis of the horizontal stress redistribution in the lower part of the sandstone layer is in good agreement with the morphological characteristics of the SAB zone. This result verifies the applicability of the boundary determination method of the SAB zone.
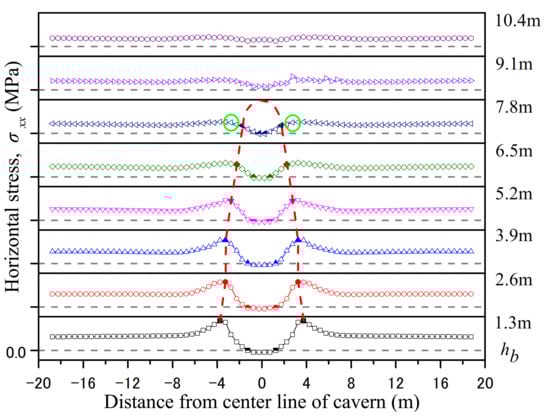
Figure 6.
The SAB zone of roof sandstone layer based on a simulation result of case C1.
In fact, the outer boundary points of the 7.8-m-high (hb) sandstone layer were obtained according to the distribution trend of the outer boundary points of the sandstone layers below it. The peak position of horizontal stress in the lower part of a 7.8-m-high (hb) sandstone layer along the stratification direction is represented by the green circular area in Figure 6, which obviously deviates from the position where the trajectory of the major principal stress in this rock layer flows into the GSA. Two possible reasons can explain this phenomenon: (1) With the increase of the distance from the roof excavation line, the horizontal stress concentration in the abutment block of the sandstone voussoir beam decreases, but the weakening of the looseness between the blocks promotes the transmission of horizontal stress along the stratification direction, resulting in similar stress values of some blocks in the horizontal neighborhood of the abutment block. (2) Given that the horizontal stress component of the rock mass in the GSA zone increases, when the abutment blocks are within the inner boundary of the GSA and its horizontal adjacent blocks are within the GSA zone, the horizontal stress value of the horizontal adjacent blocks of the abutment blocks will increase. Therefore, to determine the outer boundary point of the high-level sandstone layer that remains in the scope of the SAB, the location between the inner boundary point of the GSA in this rock layer and the theoretical outer boundary point of the criterion in this layer is selected. The said location is close to the central line of the cavern.
3.4. Formation Mechanism of the GSA and Description of the Arching Zone
With the increase in distance away from the excavation boundaries, the influence of disturbance on the surrounding rock is gradually weakened, and the structural plane effect in the stress redistribution is alleviated. The high-level sandstone layers above the cavern are in a state of compressive stress, and no voussoir beam structures are formed. However, the disturbed high-level sandstone layers will bend and sink under the action of load, showing uneven displacement along the stratification direction. As shown in Figure 7, as the level of the sandstone layer increases, the maximum vertical displacement located on the central line of the cavern decreases exponentially. Nonetheless, the decline rate of the vertical displacement from the central line of the cavern to the boundaries of the model along the stratification direction slows down. Thus, the bending degree of high-level sandstone layer is small, and the length of bending section is large.
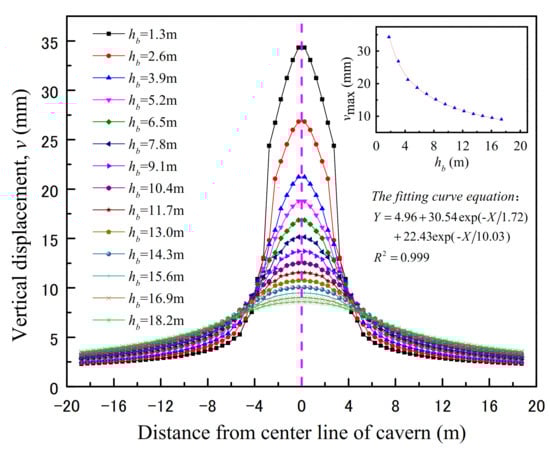
Figure 7.
Vertical displacement distribution in the middle of roof sandstone for case C1.
The rock strata above the cavern are loose due to the excavation of the cavern, and the displacement space of the rock strata near the central line of the cavern is large. According to the theory of foundation beam deformation and load, a certain sandstone layer in the roof is supported by the rock layers below it, which can be simplified as a non-uniform load form as shown in Figure 8. As q > q’x, the blocks in the rock layer rotate and sink. On the one hand, the rock blocks squeeze each other due to the change of spatial position, resulting in the increase of horizontal stress and decrease of vertical stress of rock layers. On the other hand, block A near the central line of the cavern tends to produce a larger settlement than block B near the model boundary. As a result, frictional resistance fab between the two blocks tends to keep rock block A in its original position. Consequently, the vertical stress of the block near the central line of the cavern decreases, and vertical stress of the block with smaller adjacent displacement increases. This phenomenon of stress transfer is the global stress arching effect of a horizontally-layered jointed rock mass, which is consistent with the stress distribution characteristics shown in Figure 4. The uneven displacement of the rock mass caused by cavern excavation is the reason for the formation of the GSA in the layered jointed rock mass, and the transfer of the vertical stress is an objective reflection of the existence of the GSA.
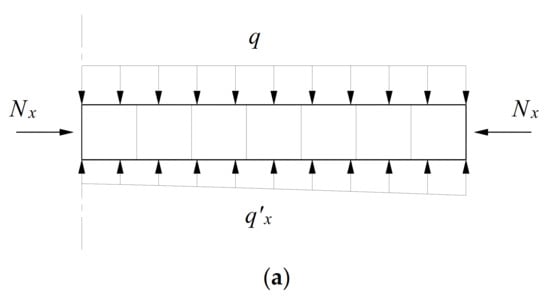
Figure 8.
Mechanical model of jointed rock strata during bending: (a) Simplified model; (b) Block rotation; (c) Interaction between blocks.
On the basis of the nature of vertical stress transfer during the formation of GSA, arch index k is defined to quantitatively describe the GSA zone in horizontally-layered jointed rock mass. Two partition curves are proposed to better describe the stress transfer characteristics. Outside the outer boundary of the GSA is the in-situ stress zone, and inside the inner boundary of the GSA is the tension stress zone and lower pressure zone of the vertical stress. In the GSA zone, the area near the central line of the cavern is in the low pressure zone due to part of the vertical stress being transferred, whereas the areas on both sides far from the central line of the cavern are in the pressure concentration zone due to receiving the load transferred from the middle area. As shown in Figure 9, the outer boundary of the GSA is the line connecting the points with small k value in each sandstone layer (8% in this study), and the inner boundary is the line connecting the points where the k value in each sandstone layer is close to −1 (σyy > 0). The two partition curves are the connections of points with k ≈ 0 and the kmax in each sandstone layer. The inner and outer boundaries of the GSA define the extent of principal stress deflection in roof strata. In the arching zone, part of the load in the area between the k ≈ 0 curves is transferred to both sides and below, the area under the k ≈ 0 curve receives the transferred load, and the vertical stress on the kmax curve is the largest. Arching index k is defined as:
where σyy is the vertical stress in the lower part of sandstone layer after cavern excavation; and σy0 is the in situ vertical stress in the lower part of the sandstone layer before cavern excavation. For k < −1, it was the range of the tensile stress zone, and the lower compressive stress zone when −1 < k < 0 and the pressure stress concentration zone when k > 0.
Figure 9.
The GSA zone and partition based on the arching index.
Figure 10 shows the GSA zone and division of the roof sandstone layer for case C1. The figure shows that: (1) The inner and outer boundary lines of the GSA are elliptical-like segments with an opening downward, and the zone formed between them is similar to the shape of the region formed by the trajectory of the major principal stress of the overburden. (2) The region between curves k ≈ 0 is wide in the upper part and narrow in the lower part, that is, the length of the vertical stress reduction section increases with the increase of strata height, which is consistent with the characteristics of rock bending settlement. (3) The kmax curve is approximately linear, and the deflection of the principal stress in the region below it decreases.
Figure 10.
The GSA zone of roof sandstone layer based on simulation result of case C1.
4. Influence of Different Factors on the Formation of Stress Arch
On the basis of the above-mentioned methods for determining the SAB zone and GSA zone, the influence of joint internal friction angle, sandstone joint spacing, lateral pressure coefficient, and overburden depth on the formation of stress arch in horizontally-layered jointed rock mass is analyzed.
4.1. Effect of Joint Internal Friction Angle
Four cases (Case A1–A4) with joint internal friction angle ranging from 10° to 30° are used to simulate and analyze the influence of stress arch formation. Figure 11 shows a comparison of the stress arching zones for different cases. The joint internal friction angle has a great influence on the formation of the SAB and GSA. When the joint internal friction angle φ increases within the range of 10–30°, the outer boundary height hso of the SAB, the inner boundary height hgi of the GSA, and the outer boundary height hgo of the GSA decreases by 33.9–55.1%, 33.9–55.1%, and 12.5–20.8%, respectively. As the joint internal friction angle increases, the load transfer occurs in the larger range of rock strata in the GSA zone, the proportion of the area receiving the load decreases, and angle θ between the kmax curve and the horizontal direction is reduced from 57° to 45°. With the decrease of the joint internal friction angle, the extent of the SAB zone and GSA zone increases, which is the same as the result of He et al. [19]. The height of the outer boundary of SAB is the same as the height of the inner boundary of GSA. The main reason is that the blocks of sandstone layer are large with 0.3 m of mudstone between the layers, which reduces the accuracy of determining the height of the inner and out boundary of the stress arching zone.
Figure 11.
Effect of joint internal friction angle φ on the arching zone.
4.2. Effect of Sandstone Joint Spacing
Fracture spacing in layered sedimentary rocks is roughly proportional to the thickness of the fractured layer, with the most common reported values of 0.3–1.2 [28]. To investigate the effect of sandstone joint spacing Sj on the stress arching zone, four cases (Case B1–B4) were designed and simulated. The Sj values ranged from 0.5 m to 2.0 m at intervals of 0.5 m. Figure 12 shows the height of the inner and outer boundaries of the stress arching zone and the horizontal angles of the kmax curve in the range of Sj from 0.5 m to 2.0 m. The results show that with the increase of sandstone joint spacing, the extent of SAB and GSA shows an increasing trend. When Sj increases in the range of 0.5–2.0 m, the outer boundary height hso of the SAB, the inner boundary height hgi of the GSA, and the outer boundary height hgo of the GSA increase by an average of 79.6%, 11%, and 3.4%, respectively. Sandstone joint spacing also affects the load transfer in the GSA, but the influence on the horizontal angle of kmax curve has no obvious regularity. The extent of the SAB zone increases significantly with the increase of joint spacing, that is, the larger the span/thickness ratio of blocks in fractured layer is, the easier the lower part of the fractured layer opens along the joint surface, which is consistent with the discovery of Diederichs and Kaiser [29].
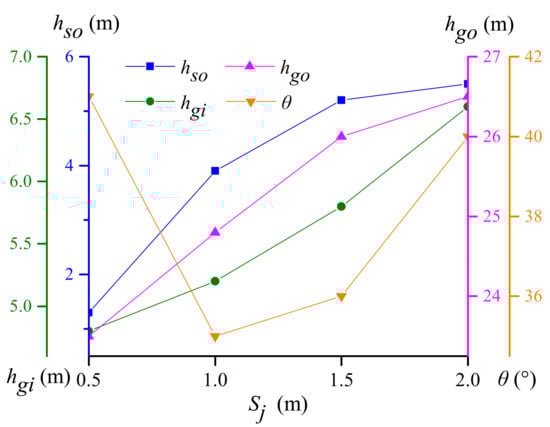
Figure 12.
Effect of sandstone joint spacing Sj on the arching zone.
4.3. Effect of Lateral Pressure Coefficient
Four different values of the 0.25–2.0 lateral pressure coefficient λ (Case C1–C4) are considered to examine the effect of lateral pressure coefficient λ on the characterization index of the stress arching zone. Figure 13 shows the trend of the height of the inner and outer boundary of the stress arching zone and the horizontal angle of the kmax curve with the increase of the lateral pressure coefficient λ. With the increase of the lateral pressure coefficient in the range of 0.25–2.0, the outer boundary height hso of the SAB and the inner boundary height hgi of the GSA are reduced by 16.3% on average with the same value. In addition, the outer boundary height hgo of the GSA is reduced by 10.8% on average, and angle θ between kmax curve and horizontal direction is stable at approximately 40°. Under the same vertical load, the high horizontal stress within a certain range will inhibit the tensile opening of the lower part of the jointed rock stratum and reduce the looseness of the shallow rock mass. This effect causes the small range of load adjustment of the overlying rock, but it does not affect the transfer characteristics of vertical stress in the process of rock load adjustment.
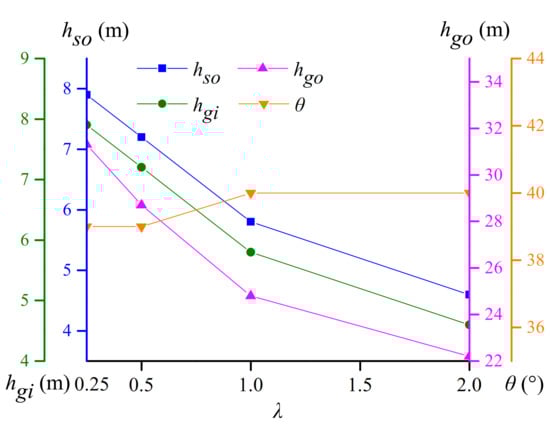
Figure 13.
Effect of lateral pressure coefficient λ on the arching zone.
4.4. Effect of Overburden Depth
Overburden depth H has an important influence on the formation of stress arch. Figure 14 shows index values that characterize the stress arching zone under four overburden depth values (Case D1–D4) in the range of 40–60 m. As the overburden depth H increases by 20 m in the range of 40–100 m, the outer boundary height hgo of the GSA decreases by 13.9% on average. However, the outer boundary height hso of the SAB and the inner boundary height hgi of the GSA are not sensitive to the increase of an overburden depth of 20 m. When the overburden depth increases by 40 m, the two decrease by 19.7% on average with the same value. The extent of the stress arching zone decreases with the increase of the overburden depth, which is the same as the findings of He et al. [19]. Overburden depth H does not affect the stress transfer characteristics in the GSA zone. When its value changes, angle θ between the kmax curve and the horizontal direction fluctuates slightly at 48°.
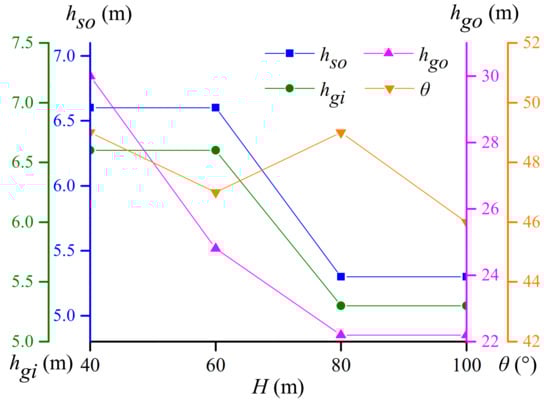
Figure 14.
Effect of overburden depth H on the arching zone.
5. Conclusions
Through the discrete element numerical simulation method, the principal stress arching characteristics and vertical and horizontal stress redistribution laws of the roof of the cavern after excavation in the horizontally layered jointed rock mass were analyzed. Combining the stress characteristics of the voussoir beam structure and the multi-block mechanical model of the jointed rock stratum, the study explored the formation mechanism of a stress arch. Moreover, the determination method of the boundaries of stress arching zone was proposed, and the sensitivity analysis of the relevant parameters was carried out. The main conclusions are as follows:
- (1)
- After the excavation of a horizontally-layered jointed rock mass, the SAB was formed in the lower strata above the cavern, and the GSA was formed in the higher strata, both of which are symmetrical arch stress patterns. The GSA transfers part of the vertical load in the area near the central line of the cavern to the stable surrounding rock on both sides, and the SAB marks the formation of the self-stable structure of the low-level strata;
- (2)
- The SAB could be regarded as the mechanical manifestation of the voussoir beam structure formed by several low-level sandstone layers. The inner boundary point of the single arching zone in the SAB is the position where the horizontal stress of the lower part of the sandstone layer transits from tensile stress to compressive stress, and the outer boundary point is the position of the peak value of horizontal stress in the lower part;
- (3)
- The GSA was caused by the uneven displacement between blocks, reflecting the characteristics of vertical stress transfer. The GSA zone was quantitatively described by arching index k, and curves k ≈ 0 and kmax could describe the stress transfer characteristics in the arching zone;
- (4)
- Compared with the GSA, the SAB is more sensitive to various influencing factors. Within a certain range, the increase of joint internal friction angle, lateral pressure coefficient, and overburden depth will inhibit the development of stress arching zone, and the joint spacing of rock strata is conducive to the expansion of stress arching zone. The kmax curve in the GSA zone is approximately linear, which is only related to the properties of rock mass;
- (5)
- The arching effect of the underground chamber was different with the size of block and mechanical properties of rock mass. However, it was obvious that the stress arching area was symmetrically distributed on the left and right sides of the center line of the tunnel, so the symmetrical layout could be used in the theoretical analysis and support design.
Author Contributions
Conceptualization, X.H. and H.R.; Funding acquisition, C.S.; Investigation, X.H.; Software, X.H. and C.S.; Supervision, H.R.; Validation, X.H.; Visualization, X.H.; Writing—original draft, X.H.; Writing—review & editing, X.H. and Y.K. All authors have read and agreed to the published version of the manuscript.
Funding
The work presented in this paper was financially supported by the National Natural Science Foundation of China (grants nos. 41831278, 51679071).
Institutional Review Board Statement
Not applicable.
Informed Consent Statement
Not applicable.
Data Availability Statement
Not applicable.
Conflicts of Interest
The authors declare no conflict of interest.
References
- Tsesarsky, M. Deformation mechanisms and stability analysis of undermined sedimentary rocks in the shallow subsurface. Eng. Geol. 2012, 133, 16–29. [Google Scholar] [CrossRef]
- Muralha, J.; Grasselli, G.; Tatone, B.; Blümel, M.; Chryssanthakis, P.; Yujing, J. ISRM suggested method for laboratory determination of the shear strength of rock joints: Revised version. Rock Mech. Rock Eng. 2014, 47, 291–302. [Google Scholar] [CrossRef]
- Kong, X.X.; Liu, Q.S.; Pan, Y.C.; Liu, J.P. Stress redistribution and formation of the pressure arch above underground excavation in rock mass. Eur. J. Environ. Civ. Eng. 2021, 25, 722–736. [Google Scholar] [CrossRef]
- Cai, M.F. Rock Mechanics and Engineering; Science Press: Beijing, China, 2002. [Google Scholar]
- Terzaghi, K. Theoretical Soil Mechanics; John Wiley & Sons, Inc.: New York, NY, USA, 1943. [Google Scholar]
- Evans, W.H. The strength of undermined strata. Transa. Inst. Min. Metal. 1941, 50, 475–500. [Google Scholar]
- Huang, Z.P.; Broch, E.; Lu, M. Cavern roof stability—mechanism of arching and stabilization by rockbolting. Tunn. Undergr. Space Technol. 2002, 17, 249–261. [Google Scholar] [CrossRef]
- Pardo, G.S.; Sáez, E. Experimental and numerical study of arching soil effect in coarse sand. Comput. Geotech. 2014, 57, 75–84. [Google Scholar] [CrossRef]
- Ahmadi, A.; Hosseininia, E.S. An experimental investigation on stable arch formation in cohesionless granular materials using developed trapdoor test. Powder Technol. 2018, 330, 137–146. [Google Scholar] [CrossRef]
- Bi, Z.Q.; Gong, Q.M.; Guo, P.J.; Cheng, Q. Experimental study of the evolution of soil arching effect under cyclic loading based on trapdoor test and particle image velocimetry. Can. Geotech. J. 2020, 57, 903–920. [Google Scholar] [CrossRef]
- Lee, C.J.; Wu, B.R.; Chen, H.T.; Chiang, K.H. Tunnel stability and arching effects during tunneling in soft clayey soil. Tunn. Undergr. Space Technol. 2006, 21, 119–132. [Google Scholar] [CrossRef]
- Murayama, S.; Matsuoka, H. On the settlement of granular media caused by the local yielding in the media. Dobo. Gakk. Ron. 2010, 1969, 31–41. [Google Scholar] [CrossRef]
- Wu, J.H.; Ohnishi, Y.; Nishiyama, S. Simulation of the mechanical behavior of inclined jointed rock masses during tunnel construction using discontinuous deformation analysis (DDA). Int. J. Rock Mech. Min. Sci. 2004, 41, 731–743. [Google Scholar] [CrossRef]
- Chen, C.N.; Huang, W.Y.; Tseng, C.T. Stress redistribution and ground arch development during tunneling. Tunn. Undergr. Space Technol. 2011, 26, 228–235. [Google Scholar] [CrossRef]
- Niu, X.Q.; Ding, X.L. Bearing mechanism of top arch and stable arch design method for surrounding rock of underground caverns. Chin. J. Rock Mech. Eng. 2013, 32, 775–786. [Google Scholar] [CrossRef]
- Kong, X.X.; Liu, Q.S.; Zhang, Q.B.; Wu, Y.X.; Zhao, J. A method to estimate the pressure arch formation above underground excavation in rock mass. Tunn. Undergr. Space Technol. 2018, 71, 382–390. [Google Scholar] [CrossRef]
- Wang, S.R.; Wu, X.G.; Zhao, Y.H.; Hagan, P. Mechanical performances of pressure arch in thick bedrock during shallow coal mining. Geofluids 2018, 2018, 2419659. [Google Scholar] [CrossRef]
- Huang, X.; Zhang, Z.X. Stress arch bunch and its formation mechanism in blocky stratified rock masses. J. Rock Mech. Geotech. Eng. 2012, 4, 19–27. [Google Scholar] [CrossRef] [Green Version]
- He, L.; Zhang, Q.B. Numerical investigation of arching mechanism to underground excavation in jointed rock mass. Tunn. Undergr. Space Technol. 2015, 50, 54–67. [Google Scholar] [CrossRef]
- Zhao, Y.H.; Wang, S.R.; Zou, Y.F.; Wang, X.C.; Zhang, X.G. Pressure-arching characteristics of fractured strata structure during shallow horizontal coal mining. Teh. Vjesn. 2018, 25, 1457–1466. [Google Scholar] [CrossRef]
- Sun, X.H.; Miao, L.C.; Lin, H.S.; Tong, T.Z. Soil arch effect analysis of shield tunnel in dry sandy ground. Int. J. Geomech. 2018, 18, 4018057. [Google Scholar] [CrossRef]
- Handy, R.L. The arch in soil arching. J. Geotech. Eng. 1985, 111, 302–318. [Google Scholar] [CrossRef]
- Du, X.L.; Song, H.W.; Chen, J. Laws of formation and evolution of pressure arch in coal mining adjoining rock. Adv. Mater. Res. 2011, 243–249, 2596–2600. [Google Scholar] [CrossRef]
- Yang, J.H.; Wang, Y.G.; Li, C.L. Analysis of arching mechanism and evolution characteristics of tunnel pressure arch. Jordan J. Civ. Eng. 2015, 9, 125–132. [Google Scholar]
- Cundall, P.A. A computer model for simulating progressive large scale movements in blocky rock systems. In Proceedings of the Symposium of the International Society for Rock Mechanics, Society for Rock Mechanics (ISRM), Nancy, France, 4–6 October 1971. [Google Scholar]
- Sterling, R.L. Roof Design for Underground Openings in Near-Surface Bedded Rock Formations. Ph.D. Thesis, University of Minnesota, Apollis, MN, USA, 1997. [Google Scholar]
- Brady, B.H.G.; Brown, E.T. Rock Mechanics for Underground Mining; George Allen & Unwin: London, UK, 1985. [Google Scholar]
- Bai, T.X.; Pollard, D.D. Fracture spacing in layered rocks: A new explanation based on the stress transition. J. Struct. Geol. 2000, 22, 43–57. [Google Scholar] [CrossRef]
- Diederichs, M.S.; Kaiser, P.K. Stability of large excavations in laminated hard rock masses: The voussoir analogue revisited. Int. J. Rock Mech. Min. Sci. 1999, 36, 97–117. [Google Scholar] [CrossRef]
Publisher’s Note: MDPI stays neutral with regard to jurisdictional claims in published maps and institutional affiliations. |
© 2021 by the authors. Licensee MDPI, Basel, Switzerland. This article is an open access article distributed under the terms and conditions of the Creative Commons Attribution (CC BY) license (https://creativecommons.org/licenses/by/4.0/).