Abstract
There is a symmetrical relationship between safety management and production efficiency of an offshore drilling platform. The development of artificial intelligence makes people pay more attention to intelligent security management. It is extremely important to reinforce workplace safety management by monitoring protective equipment wearing using artificial intelligence, such as safety helmets and workwear uniforms. The working environment of the offshore drilling platforms is particularly complex due to small-scale subjects, flexible human postures, oil and gas pipeline occlusions, etc. To automatically monitor and report misconduct that violates safety measures, this paper proposes a personal protective equipment detection method based on deep learning. On the basis of improving YOLOv3, the proposed method detects on-site workers and obtains the bounding box of personnel. The result of candidate detection is used as the input of gesture recognition to detect human body key points. Based on the detected key points, the area of interest (head area and workwear uniform area) is located based on the spatial relations among the human body key points. The safety helmets are recognized using the deep transfer learning based on improved ResNet50, according to the symmetry between the helmets and the workwear uniforms, the same method is used to recognize the workwear uniforms to realize the identification of protective equipment. Experiments show that the proposed method achieves a higher accuracy in the protective equipment detection on offshore drilling platforms compared with other deep learning models. The detection accuracies of the proposed method for helmets and workwear uniforms are 94.8% and 95.4%, respectively.
1. Introduction
Injury caused by falling objects is a common concern of all industrial departments. In order to protect workers or visitors from falling objects, a safety helmet is an effective safety measure. Therefore, it is required to wear safety helmets in some construction and manufacturing industries, oil fields, refineries and chemical plants. Nowadays, there is an implementation of unified clothing management in enterprises; that is, people should wear work clothes in line with the attributes of the enterprise. Unified clothing not only makes the enterprise look more formal but can also effectively and quickly distinguish foreign personnel, which plays an important role in preventing the invasion of foreign personnel. However, due to personal reasons, some workers did not comply with the regulations. It was reported that 47.3% of the victims did not wear personal protective equipment or did not wear it correctly at the time of danger []. Therefore, it is necessary to detect the wearing of personal protective equipment and study the activity of workers [].
With the rapid development of offshore petroleum production, the management of offshore drilling platforms has come into focus. The working conditions on the drilling platforms are extremely complex, with overlapping oil and gas pipelines. Offshore platform workers also face other potential hazards, such as falling into the sea, equipment collapse, and parts falling. Securing workplace safety is among the top priorities of offshore platform petroleum production. In this scenario, helmets and workwear uniforms play a crucial role in safety management. Wearing a safety helmet can be an intervention for protecting against fall-related brain injury. Furthermore, workwear uniforms are also beneficial for staff management, e.g., we can easily differentiate between on-site personnel and outsiders to prevent unauthorized access. Personnel detection and their protective equipment detection from surveillance videos is a natural, non-invasive solution. At present, safety measure detection in industrial production and construction sites usually uses surveillance cameras to collect data, and then safety violations are reported manually. Manual supervision requires a huge amount of workforce and can be subjective. Therefore, automated protective equipment detection is of great significance to efficient safety management.
With the development of machine learning methods, researchers resort to various algorithms to automatically obtain, analyze and detect worker’s protective equipment [,,,,,,,,,,,,,,,]. In recent years, the related works on personal protective equipment detection are mainly divided into two categories. In the first category, areas of interest are detected, and then these areas are further processed to identify protective equipment. For example, authors in [] propose a helmet recognition based on face recognition and bounding box regression, others propose to locate the head area based on the spatial relations of the human body parts, and then using the color characteristics to determine whether the worker is wearing a helmet [,], and authors in [] propose to calculate color histograms in HSV color space and utilize a KNN for classification. In the second category, candidate detection methods are utilized to detect safety gear. For example, some works [,] exploit modifying the network structure of YOLOv3 [] to detect the helmets of workers on the construction site, which greatly improved the accuracy and real-time performance. Although the existing protective equipment detection methods achieved high accuracies in specific scenarios, they still have problems. For example, the method proposed in [] is unable to judge whether workers whose faces are blocked or not showing are wearing safety helmets, the methods proposed in [,] are only suitable for scenes with upright pedestrians and simple backgrounds, the method proposed in [] is easily affected by lighting conditions, and the methods proposed in [,] are unable to determine whether the helmet is worn on the head, etc.
The working environment of the offshore drilling platforms is complex, and there are scenarios in which general-purpose protective equipment detection methods can fail. For example, the postures of the workers are flexible (such as, bending down, squatting), the workers captured in the remote surveillance videos are of low pixel resolution, the workers are blocked by dense pipelines, the color of the pipelines is similar to the color of the workwear uniforms, and the weather at sea is constantly changing. Under the monitoring of an offshore drilling platform, the range of activities of workers is large. Some workers are close to the camera, which leads to big-scale personnel. Some workers are far away from the camera, which leads to small-scale personnel. The above problems make the protective equipment detection problem very difficult, and the current model is not an exception.
In order to solve the problem of protective equipment detection on offshore drilling platforms, we propose a personal protective equipment detection (PPED) method based on deep learning. We collected 25,000 images containing platform workers from surveillance videos of offshore drilling platforms, and we named the dataset offshore drilling platform dataset (ODPD). Then, we used a deep-learning-based method to detect protective equipment and issued timely warnings for violating safety rules. The proposed method first uses improved YOLOv3 to detect workers, then uses the regional multi-person pose estimation (RMPE) [] to extract the human body key points, locate the area of interest (head area and workwear uniform area) with the detected key points, and finally uses deep transfer learning based on improved ResNet50 [] to identify the protective equipment. This work focuses on applying deep learning to solve the problem of protective equipment detection of offshore drilling platform workers. The innovations and contributions are as follows.
- With the complex background of offshore drilling platforms, we modify the YOLOv3 algorithm and use random erasing [] for data augmentation to ease the problem of a lack of occluded workers. This improves the recognition accuracy for small-scale personnel and occluded personnel.
- We use a pose estimation algorithm to obtain the key points of the human body and locate the area of interest (head area and workwear uniform area) based on the spatial relations among the key points.
- A deep transfer learning method based on modified ResNet50 is introduced to train the protection equipment recognition model, which can effectively avoid the impact of network training caused by an insufficient sample size of protective equipment images.
2. Related Works
Safety helmet detection in surveillance videos is an important application on high-risk work sites (such as coal mines, electrical substations, and construction sites) to ensure safety protocols. Related works on safety helmet detection can be divided into two categories: feature plus classifiers/detectors and deep-learning-based methods.
In the first category, researchers utilize traditional human-selected features. In 2004, Wen et al. [] first proposed an improved hough transform, which uses geometric features to detect whether there is a helmet in the arc set so as to recognize the helmet in the ATM monitoring system. Chiverton et al. [] exploited a method based on Histogram of Gradients (HOG) and Support Vector Machine (SVM), which applied image recognition to helmet recognition and achieved an accuracy of 85%. Waranusat et al. [] used a KNN to classify shape and color information extracted from images, and achieved an accuracy of 74%. Dahiya et al. [] first detected pedestrians, then located the head area, and compared three feature descriptors of HOG, scale invariant feature transformation (SIFT), and local binary pattern (LBP) using an SVM classifier to detect the helmets of bicycle riders. The generalization ability of these methods is insufficient due to large amount of calculations, so it is difficult to apply the protective equipment detection methods to complex scenarios.
With the development of deep learning, many researchers apply deep learning methods to detect safety helmets. Bo et al. [] used the YOLOv3 model to identify the helmets on a construction site with an accuracy rate of 95%. Fang et al. [] proposed an on-site safety helmet detection method based on Faster R-CNN for construction automation, and solved the problem of worker identification without helmets in remote monitoring scenarios. Nath et al. [] utilized three deep learning models for detection. The above method applies deep learning to extract features for helmet recognition, which has improved accuracy and efficiency, but the scenario is relatively simple, so they are applicable in a confined scope.
There are relatively few works on workwear uniform recognition compared with helmet detection. Most of the methods segment and recognize pedestrian clothing from street photos. The current method of identifying individual clothing is usually divided into two stages. The first stage is clothing segmentation, and the second stage is the feature recognition of the clothing area.
General-purpose image segmentation methods are usually used for clothing segmentation. Hu et al. [] segmented the human body with the graph cuts algorithm, used face detection and skin color detection algorithms to remove the skin color area, established a Gaussian mixture model using background and foreground information, used the constrained Delaunay triangulation (CDT) algorithm to filter the noise in the model, and finally, segmented the clothing area. Gallagher et al. [] pre-learned multiple images of a person, built a clothing model from them, and then used Graph cuts images to segment the clothing area in each image based on the clothing model.
In the second stage of the feature recognition, three global features (color, shape, and texture) are extracted. Color is the most significant feature and is also a crucial cue of the human vision system. Common color feature descriptors are color moments, color histograms, and aggregation vectors, etc. Strieker et al. [] proposed a block color moment feature extraction method to improve feature extraction. Li et al. [] proposed a retrieval method based on a block color histogram. Yang et al. [] used a multi-image iterative optimization segmentation algorithm to segment the pedestrian clothing, constructed a multi-image model using the statistical information, and optimized the labeling results. Yamaguchi et al. [] proposed a method specifically for clothing recognition in fashion photos, which recognized clothing by estimating the human pose. The above methods can achieve good recognition accuracies, but with low efficiency, and the input images must be clear with a simple background. There are also studies working on improving the accuracy of clothing recognition by introducing human models [].
3. The Proposed PPED Method
Currently, there is a lack of publicly available video data sets of human activity on offshore drilling platforms. In this work, we collected our own data from a video surveillance system on an offshore drilling platform. For data augmentation, we use random erasure [] to increase the number of samples with occlusion. We use the improved YOLOv3 to train the worker detection model. The detected candidate in the form of bounding boxes are sent into RMPE, where the human body key points are extracted, and the head region and workwear uniform region are located accordingly. Transfer learning techniques based on improved ResNet50 are used to detect the head area and the workwear uniform area to detect the protective equipment. The overall pipeline of the method proposed in this paper is illustrated in Figure 1.
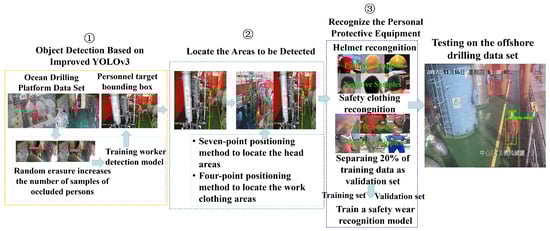
Figure 1.
The overall pipeline of the personal protective equipment detection method on an offshore drilling platform.
Based on the PPED method, the process of detecting offshore drilling platform protection equipment is as follows: (1) The improved YOLOv3 was used to detect the bounding boxes of workers in the images. (2) Taking bounding boxes as input, 17 key-points coordinates of workers are obtained by RMPE. (3) According to the coordinates of key-points, the areas of interest are obtained by using a seven-point positioning method and a four-point positioning method. (4) The areas of interest are detected by using the helmet recognition model and the work clothes recognition model. The detection results are the output. Details are given in Algorithm 1.
| Algorithm 1 Detecting the personal protective equipment of an offshore drilling platform. |
| Input:M: Image containing workers of offshore drilling platform; Using improved YOLOv3 to get the worker’s bounding box:; Taking P as the input of RMPE, the coordinates of 17 key-points are obtained: ; Taking K as the input and using the seven-positioning method to locate the head area: H; Taking K as the input and using the four-positioning method to locate the work clothing area: W; Taking H as the input to the helmet recognition method to get the result: helmet or no helmet; Taking W as the input to the safety clothing recognition method to get the result: safety clothing or no safety clothing; if helmet and safety clothing then the worker wears helmet and safety clothing end if if helmet and no safety clothing then the worker wears helmet but no safety clothing end if if no helmet and safety clothing then the worker wears no helmet but safety clothing end if if no helmet and safety clothing then the worker wears helmet but no safety clothing end if if no helmet and safety clothing then the worker wears no helmet and no safety clothing end if Output: |
3.1. Improving YOLOv3 for Candidate Detection
The current object detection technology can be divided into two categories: one is a two-stage detection method based on the candidate region, the other is a one-stage detection method based on regression. Generally, although the two-stage object detection algorithm has high detection accuracy, the network structure is complex and the detection speed is slow, so it is difficult to meet the real-time requirements in industry. The one-stage object detection algorithm [] can complete the task of target classification and location at one time, and the detection speed is faster, which can better meet the real-time requirements of industrial production. However, the working environment of an offshore drilling platform is complex, the scale of workers changes greatly, and there are a large number of small-scale personnel. The existing single-stage target detection algorithm can not accurately detect the target personnel.
In order to detect the workers of the offshore drilling platform accurately, we improved YOLOv3 to adapt to the environment of the offshore drilling platform. In the feature fusion stage of the consecutive layers of YOLOv3, we introduce a fusion factor [] calculated using the proportion of the candidate number between the adjacent layers. Fusion factor is a weighted coefficient in the deeper layer when fusing the features of two adjacent layers of YOLOv3. Meanwhile, the inconsistency across different features is a primary limitation for YOLOv3. Adaptive spatial feature fusion (ASFF) [] was introduced to improve the scale invariance of features. ASFF can reduce the cost of reasoning and makes full use of features of different scales.
Figure 2 illustrates the feature fusion mechanism of the YOLOv3. YOLOv3 incorporates up-sampling, feature fusion on three scales (, , and ), and detects independently on the fusion feature map on multiple scales. Feature is processed by five convolutional layers and then followed by one convolutional layer of size to compute feature . Feature is processed by a convolutional layer of size and up-sampled twice, and then it is fused with the feature using concatenation. Afterward, feature is computed after a series of convolutions, and feature is calculated in the same way.
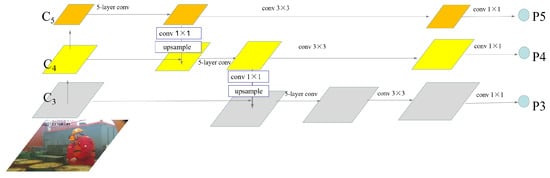
Figure 2.
Feature fusion mechanism of the YOLOv3. , and are the three different scale feature maps output by YOLOv3 through the backbone network. , and are the feature maps used for detection after feature fusion.
Figure 3 shows the diagram of the improved YOLOv3 model. We introduced a fusion factor module before fusing features from two data streams. After the last convolution operator, feature maps of three scales (level 1–3) are obtained. In order to make full use of all the features, ASFF is introduced for further feature fusion. ASFF is divided into two stages. The first stage is a feature resizing module, in which the features from the three streams are processed to the same resolutions and channel numbers. The second stage is an adaptive fusion module, in which the three feature maps are fused into three corresponding feature maps and fused with adaptively adjusted weights.
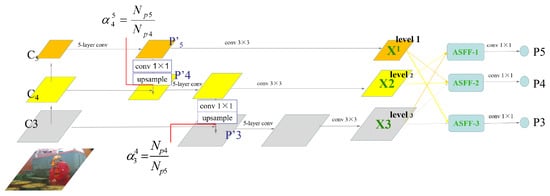
Figure 3.
The diagram of the proposed improved YOLOv3 model. , and are the three different scale feature maps outputs through the backbone network. ASFF-1, ASFF-2 and ASFF-3 are new feature maps obtained by adaptive spatial feature fusion. , and are the feature maps used for detection.
3.1.1. Fusion Factors Calculation
We use the S- method [] to calculate the fusion factor as the following:
where and represent the number of detected candidates of the and data streams.
Suppose the is obtained by after five convolution operations, then can be obtained by fusing and in the following manner:
where denotes the convolution operation and the upsampling operation. is defined likewise.
3.1.2. Feature Reshaping
We donate the features calculated after the convolution operation as for each data stream l (l) as shown in Figure 3. For the l-th data stream, we resize the features ( and ) of the other two data streams so that and are of the same size. Since the features of the three levels have different resolutions and channel numbers, we modify the up-sampling and down-sampling strategies of each data stream so that the features are consistent. For the features obtained by up-sampling, we use a convolutional layer to compress feature channel dimensions of the l-th data stream and then interpolate to get higher resolutions. For down-sampling with the sampling ratio equal to , we use a convolutional layer with stride equals to 2 to modify the channel dimensions and resolutions simultaneously.
3.1.3. Adaptive Fusion
YOLOv3 predicts on three scales respectively. Different from YOLOv3, adaptive fusion multiplies the features of different scales by the weight parameters and adds them to get three new fusion features, and forecasts on the new fusion features, making full use of the features of different scales. We assume that denotes the feature vector at the position (i,j) on the feature maps reshaped from the feature of the n-th data stream to have the same dimensions as those of the l-th data stream. The feature fusion of the l-th data stream is carried out as follows:
where is the ()-th vector of the output feature maps in the channel, and , , and are the weights of the features reshaped from the three data streams to the dimensions of the l-th data stream and they are learned adaptively. Inspired by [], we define the adaptive weight as the following:
where , , , , and are the parameters of the softmax function after a convolutional layer with kernel size of . Weights and are defined likewise. We calculate , and from , and through the convolution layer.
The features of each data stream are fused through adaptive feature fusion, and the output is further processed for candidate detection.
3.2. Areas of Interest Detection
For protective equipment detection on an offshore drilling platform, we incorporate pose estimation to extract the human body key points so as to further locate the head areas and workwear uniform areas accordingly.
3.2.1. Human Body Key Points Extraction
To deal with the problem of complex posture of offshore drilling platform workers and the occlusion problem caused by oil and gas pipelines, we use RMPE to extract the human body key points. RMPE is a top-down pose estimation algorithm and includes three components (as shown in Figure 4): symmetric spatial transformer network (SSTN), parametric pose non-maximum-suppression (NMS), and pose-guided proposals generator (PGPG). The spatial transformation network (STN) can extract high-quality single human target regions from inaccurate candidate bounding box. A single person pose estimator (SPPE) is used to estimate the person’s pose skeleton from the extracted region. The spatial de-transformer network (SDTN) remaps the estimated pose to the image coordinate system. Parametric pose NMS is used to deal with the problem of repeated prediction. PGPG is used to generate images containing various poses to augment the existing training samples.
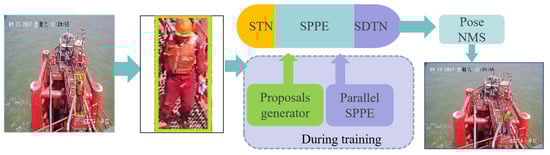
Figure 4.
The pipeline of regional multi-person pose estimation.
We used the pre-trained object detection method to detect the workers on the offshore drilling platform. The output in the form of human bounding boxes is fed into the RMPE, and 17 human body key points are extracted. Figure 5 illustrates the 17 key points of the human body: left eye, right eye, left ear, right ear, left shoulder, right shoulder, left elbow, right elbow, left wrist, right wrist, left hip, right hip, left knee, right knee, left ankle, and right ankle.
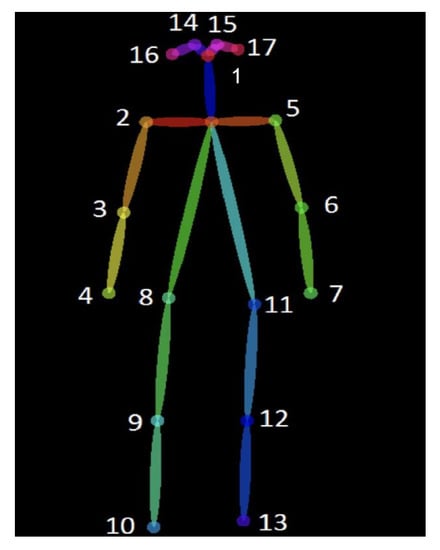
Figure 5.
The human body model with 17 key points.
3.2.2. Head Area Detection
In this work, a seven-point localization method (SPLM) is proposed to identify the head areas of workers based on the seven human body key points. First, we connect the left shoulder with the right ear, and connect the left ear with the right shoulder, respectively. Then we compute the lengths and the intersection of the two lines and use them to determine the head position displacement. We place the origin horizontally at the intersection point and vertically at a point that has the smallest vertical coordinates among the left eye, the right eye, the nose, the left ear, and the right ear. We draw a circle centering the origin of radius r, where , and is the maximum length of the two connected lines. The circle denotes the head area location.
Suppose the coordinates of the left ear, right ear, the left shoulder and the right shoulder as , , , and , and the distance between the left ear and the right shoulder can be computed as the following:
The line connecting the right ear and the left shoulder is denoted as:
and its length is calculated as the following:
The line connecting the right ear and the left shoulder is denoted as:
Compute the point of intersection of the line and , where is the head offset and is equal to the horizontal coordinate of the center point of the head. Denote the coordinates of the left eye, the right eye, and the nose by , , and , respectively. The helmet should sit on the head, so we denote the highest key point by , where . We take the vertical coordinate of the highest key point and assign it to the vertical coordinate of the head center. Thus, the head center point is denoted by , where , and . We draw a circle centering of radius , and obtain its circumscribed square S, which is the head area, as illustrated in Figure 6.
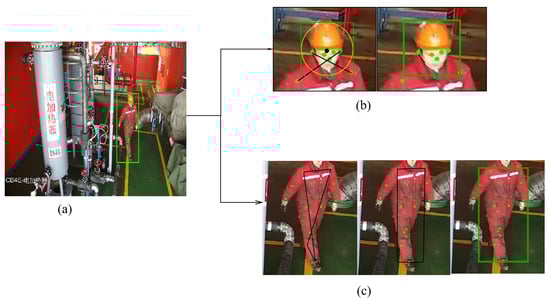
Figure 6.
Locate the area to be detected (head and workwear uniform): (a) the key points of the human body; (b) locate the head area; (c) locate the workwear uniform area.
3.2.3. Work Wear Uniform Areas Detection
Considering the working environment of the offshore drilling platforms, this work proposes a four-point localization method (FPLM) to detect the workwear uniform areas. The workwear uniform areas are usually below the neck and above the ankle, so the workwear uniform areas are localized using four human body key points: the left shoulder, the right shoulder, the left ankle, and the right ankle. We connect the left shoulder with the left ankle, the right shoulder with the right ankle, the left ankle with the right ankle, and the left shoulder with the right shoulder to form an irregular quadrilateral bounding box. The irregular quadrilateral bounding box is transformed into a rectangular box according to the maximum edge principle. Since we only consider four key points (the left shoulder, the right shoulder, the left ankle, and the right ankle) and ignore the key points on arms, we enlarge the initially detected area by a scale factor of to get the final workwear uniform area detection.
Denote the coordinates of the left shoulder, the right shoulder, the left ankle, and the right ankle using , , and , then the distance between the left shoulder and the left ankle is calculated as the following:
the distance between the right shoulder and the right ankle is calculated as the following:
the distance between left shoulder and right shoulder is computed as the following:
and the distance between the left ankle and the right ankle is calculated as the following:
Let , and , and use as the initial point and expand vertically to the length of and horizontally to the length of . Expand to form a rectangle using the symmetry principle. The rectangle is the initial workwear uniforms area. We enlarge the initially detected area by a scale factor of to get the final workwear uniform area detection, as illustrated in Figure 6.
3.3. Personal Protective Equipment Recognition
Currently, there is no publicly available data set of personal protective equipment of offshore drilling platforms. In this work, we collected our own dataset using surveillance videos of the offshore drilling platform. Each video is then used to extract a number of frames containing the staff to form the data set of protection equipment recognition. It is a tremendous amount of manual work to collect and label millions of helmet/workwear uniform images, so we use a transfer learning method based on improved ResNet50 to recognize the protective equipment. We feed the dataset to the improved ResNet50 model, employ the convolution layer and the pooling layer for feature extraction, and train the parameters of the fully connected layer, and finally implement the classification and recognition of protective equipment (as illustrated in Figure 7).
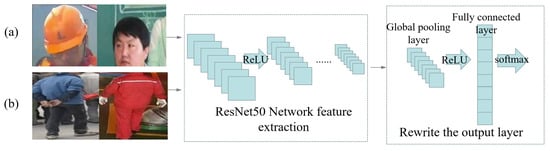
Figure 7.
Identification of protective equipment based on improved ResNet50. (a) Training workwear uniforms recognition model; (b) training helmet recognition model.
In the original network, the parameters of the full connection layer are too large, which reduces the training speed and easily leads to overfitting. Therefore, we modify the original ResNet50 and make the following improvements: the feature extraction layer of the original network is retained to extract image features, the original output layer of the network is removed, a global pooling layer and a fully connected layer are added, the output is processed by a softmax function, and the Stochastic Gradient Descent (SGD) method is used to optimize the network parameters.
4. Experimental Results
The experiments are conducted on a desktop computer. The configuration of the computer is specified as follows:
- CPU: Intel E5-2609 v2, 8 processors;
- Clock frequency: 2.5 GHz;
- Memory: 32 GB;
- Graphics card: Nvidia GTX 1080 Ti, 2 cards.
The software development environment is as follows:
- Windows 10 operating system;
- Pycharm software development platform;
- Pytorch deep-learning framework.
The experiments are comprised of three parts: candidate detection, area of interest detection, and protective equipment detection. The surveillance cameras on each offshore platform are static. Real-time surveillance videos are transmitted to and stored on the streaming media server of the offshore oil platform, where training and testing data are collected.
We extract key frames [] from the collected surveillance videos to form the ODPD containing 25,000 images. Then the images are manually annotated for candidate detection, and 22,000 target images with image labels and object locations are produced. The protective equipment detection dataset is comprised of four categories (helmet, non-helmet, workwear uniforms, and non-workwear uniforms). Each category has around 4000 images. The human body key point annotations contain the specifications of the 17 human body key points and positions of the detected human body key points for each image.
4.1. Candidate Person Detection
The workers in the offshore oil platform are small and may be occluded by pipelines, thus leading to possible missing candidate person detections. To solve this problem, we propose an improved YOLOv3 method for candidate person detection, tailored to the condition of the problem.
To verify the effectiveness of the proposed method, we conduct comparative experiments between the YOLOv3 method and the improved YOLOv3 method. The results are illustrated in Table 1. The table shows that: the proposed improved YOLOv3 method outperforms the original YOLOv3 method on the same data-scale verification experiment. When we expand the scale of the dataset, the accuracy of our method is much higher than that of the original YOLOv3 method, which shows that our method can improve the accuracy of object detection.

Table 1.
Performances of candidate person detection on offshore drilling platforms.
Figure 8 and Figure 9 display exemplar detection results for the YOLOv3 and the improved YOLOv3 method, respectively.
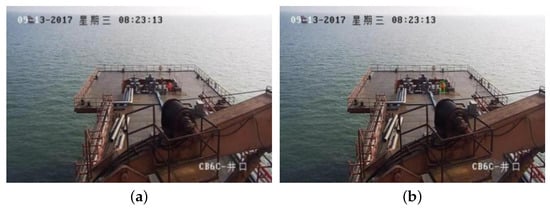
Figure 8.
Exemplar detection results for the YOLOv3 and the improved YOLOv3 method in the case of small objects. The upper left corner of subgraphs (a,b) is the time information: 8:23:13 a.m. on Wednesday, 13 September 2017. And the lower right corner is the location: CB6C-wellhead.
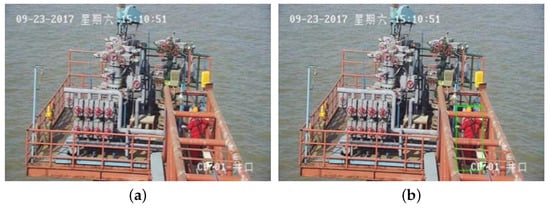
Figure 9.
Exemplar detection results for the YOLOv3 and the improved YOLOv3 method in the case of occlusions. The upper left corner of subgraphs (a,b) is the time information: 3:10:51 p.m. on Saturday, 23 September 2017. And the lower right corner is the location: CB-01-wellhead.
Figure 8 shows the detection results when the target is small. Subfigure (a) displays the detection result for the YOLOv3 method, in which the target is not detected; while subfigure (b) displays the detection result of the improved YOLOv3 method, in which the method accurately detects the target. Figure 9 shows the detection result under occlusions. Subfigure (a) displays the detection result for the YOLOv3 method, in which the occluded worker is not detected; while subfigure (b) is the detection result of the improved YOLOv3 method, in which the occluded target is successfully localized. The experimental results show that the improved YOLOv3 method can effectively deal with small targets and occluded personnel on an offshore drilling platform.
4.2. Area of Interest Detection
The detected human objects from the above-mentioned method are fed into RMPE to extract human body key points. The coordinates of the 17 human body key points (the head, the left eye, the right eye, the left ear, the right ear, the left shoulder, the right shoulder, the left elbow, the right elbow, the left wrist, the right wrist, the left hip, the right hip, the left knee, the right knee, the left ankle, and the right ankle) are computed. Then the head area is localized using the SPLM, and the workwear uniforms areas are localized by the FPLM. We utilize the Intersection-over-Union (IoU) to evaluate the effectiveness of the detection. The IoU measures the intersections of the helmet or workwear uniforms between the detection and the ground truth. If the value of the IoU is below a certain threshold, the helmet or the workwear uniform detection will be identified as “missed”; otherwise, it will be marked as “successfully detected”. Usually, the threshold is set to “0.5” [,].
We evaluate the proposed SPLM by comparing with the safety helmet localization methods of Shen et al. [] and Jie, L. et al. []. We selected 1500 images from the ODPD, containing workers with complex poses and those whose faces are occluded. The detection results are illustrated in Figure 10. We calculated the number of safety helmet bounding boxes, standard deviation, and the IoU value with the largest number of bounding boxes when the IoU in Figure 10. Using the method by Shen et al. [], the number of images successfully detected is 982, the probability of successfully detecting the safety helmet is 65.5%, the standard deviation is 101.4, and the IoU value with the largest number of bounding boxes is 0.5–0.6, mainly because many workers on the offshore platform are working with their backs to the camera. Using the method by Jie, L. et al. [], the number of images successfully detected is 780, the probability of successfully detecting the safety helmet is 52%. The standard deviation is 159.2, and the IoU value with the largest number of bounding boxes is 0.5–0.6. This is due to the fact that the method [] focuses on detecting safety helmets of workers in an electricity substation. The method only extracts one-fifth of the upper body and can only deal with an upright standing person, so it is not capable of dealing with the complex human postures on offshore platforms.
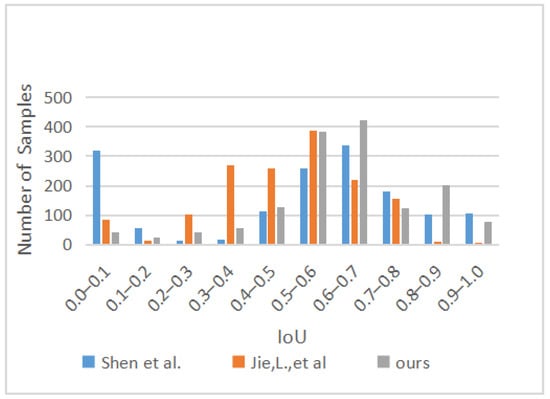
Figure 10.
Comparative results of IOU in helmet region localizations.
Using the proposed method, the number of images successfully detected is 1209, the probability of successfully detecting the safety helmet is 80.6%, the standard deviation is 153.5, and the IoU value with the largest number of bounding boxes is 0.6–0.7. It can be seen from the results of statistical analysis that our method can better locate the safety helmet areas, and the stability of the method is satisfactory.
Figure 11 displays results of the safety helmet detection. Subfigure (a), (d) and (g) show the safety helmet detection results using the method by Jie, L. et al. [], subfigure (b), (e) and (h) show the safety helmet detection results using the method by Shen et al. [], and subfigure (c), (f) and (i) show the safety helmet detection result using the proposed method in this work. The figure shows that in the case of an upright human, both methods from [,] and our method locate the safety helmet successfully, but the method by Shen et al. [] is the most accurate. In the case of complex human posture, the method by Jie, L. et al. [] and our method are capable of localizing the safety helmet, but the method by Jie, L. et al. can only locate a portion of the safety helmet. When the workers’ faces are occluded, the method by Shen et al. [] cannot recognize the face and locate the safety helmet. The proposed method is capable of localizing the safety helmet accurately.
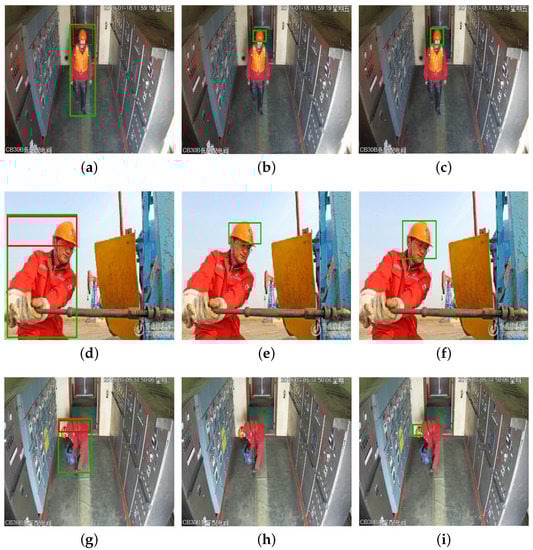
Figure 11.
Exemplar results of the safety helmet detection. The upper right corner of subgraphs (a–c) is the time information: 11:59:19 a.m. on Friday, 18 January 2019. And the lower left corner is the location information: CB30B low voltage distribution room. The lower right corner of subgraphs (d–f) is the picture source: Qilu photo group. The upper right corner of subgraphs (g–i) is the time information: 2:50:06 p.m. on Tuesday, 5 March 2019. And the lower left corner is the location information: CB30B low voltage distribution room.
We selected 1000 images from the ODPD containing workers with workwear uniforms and complex poses, and then we evaluated the workwear uniform areas detection method using the proposed method. Figure 12 gives the statistical result of the IOU values of the workwear uniforms areas. We calculated the number of workwear uniforms bounding boxes, standard deviation, and the IoU value with the largest number of bounding boxes when the IoU in Figure 12. The number of images successfully detected is 720, the probability of the workwear uniforms areas being successfully detected by the proposed method is 84.2%, the standard deviation is 78.6, and the IoU value with the largest number of bounding boxes is 0.6–0.7. It can be seen from the results of statistical analysis that our method can better locate the workwear uniforms areas, and the stability of the method is satisfactory. The proposed workwear uniforms areas detection method is tailored to the condition of the offshore oil platform, and there are no related works, so no comparative experiments are carried out.
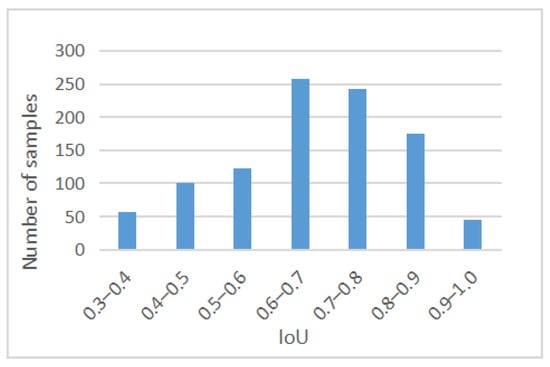
Figure 12.
Results of IOU in work clothes region localization experiment based on our method.
4.3. Protective Equipment Detection
We used 8000 images for training helmet detection and workwear uniforms detection. A total of 6000 images were used for training, and 2000 images were used for testing. We further split the training set by randomly selecting 20% as the validation set and the rest as the training set and use the random gradient descent (SGD) method to optimize the network, with the momentum set to 0.9, the initial learning rate set to 0.01, and the batch number set to 4. We use flipping and zooming for data augmentation and employ normalization using ImageNet mean and standard deviation. Figure 13a visualizes the loss curve for training the helmet detection model, and Figure 13b visualizes the loss curve for training the workwear uniforms detection model. The figure shows the loss curve for the training set decreases rapidly at the beginning and converges gradually as the number of epochs further increases. The final test accuracy of the helmet detection achieves an accuracy of 94.3%, and the final workwear uniforms detection accuracy achieves an accuracy of 95.6% for the test data.
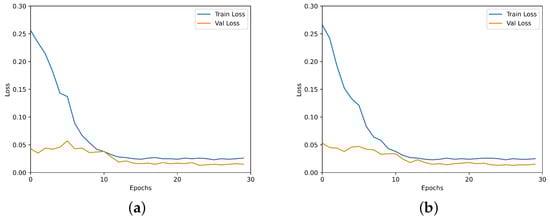
Figure 13.
Losses function visualizations on the training set. (a) The loss curve for training the helmet detection model; (b) the loss curve for training workwear uniforms detection model.
4.4. Comparison with Related Methods
Most of the existing methods only detect the safety helmet or workwear uniforms, so we carry out comparative experiments on safety helmet detection and workwear uniforms detection, respectively. We compare our method with the methods proposed by Jie, L. et al. [], Shen et al. [], and Park et al. []. Among them, the method by Jie, L. et al. [] and the method by Shen et al. [] only detect safety helmets, and the method by Park et al. [] only detect workwear uniforms. A total of 2000 images were selected from the ODPD, including 1500 images conforming to safety regulations and 500 images violating. The second category has fewer images because there are relatively fewer cases violating safety equipment wearing regulations on the offshore drilling platform. In the selected images, some of the workers’ bodies or faces are occluded by pipes, and some have complicated postures. The comparison results on helmet detection are illustrated in Table 2, and the comparison results on workwear uniforms detection are shown in Table 3.
Table 2.
Comparisons on safety helmet detection.
Table 3.
Comparisons on workwear uniforms detection.
It can be seen from Table 2 that the proposed method achieves the highest accuracy. The method by Jie, L. et al. [] utilize a “Visual Background extractor(ViBe)+HOG+SVM” method to detect the targets and decide whether the target is wearing a helmet according to the color feature of the head area, but factors such as the occlusions and the lighting deteriorate the performances. The method by Shen et al. [] locates the head area based on the face while many workers on the offshore drilling platform are turning their backs to the camera or their faces are occluded, so the accuracy is much lower than the proposed method.
Table 3 shows that the accuracy of the proposed method outperforms its counterpart. The complex environment of the offshore drilling platforms results in the low accuracy of the method by Park et al. []. Our method is capable of localizing the safety helmet and workwear uniforms even when the workers’ bodies or faces are occluded. Furthermore, the improved ResNet50 model based protective equipment detection method is not affected by lighting, so it achieves higher accuracy on the protective equipment detection of the offshore oil drilling platform.
Our method can locate the safety helmet and work clothes of the workers who are sheltered or not exposed, and the identification method of protective equipment based on improved ResNet50 is not affected by light, so it has higher accuracy in the detection of protective equipment of the offshore drilling platform.
Exemplar protective equipment detections of offshore drilling platforms are shown in Figure 14, Figure 15, Figure 16, Figure 17 and Figure 18.
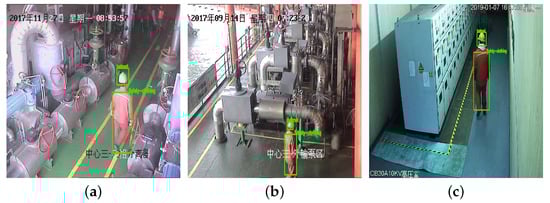
Figure 14.
Exemplar detections of protective equipment for offshore drilling platform (conforming to protective equipment wearing regulations). The upper left corner of subgraph (a) is the time information: Monday, 27 November 2017, 8:53:57 a.m. And the lower right corner is the location information: the center three-phase separator. The upper left corner of subgraph (b) is the time information: Thursday, 14 September 2017, 7:23:20 a.m. And the lower right corner is the location information: the center three-export pump area. The upper right corner of subgraph (c) is the time information: Monday, 7 January 2019, 4:47:55 p.m. And the lower left corner is the location information: the CB30A10KV high pressure chamber.
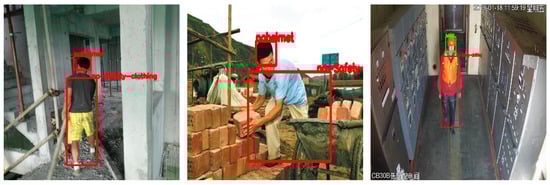
Figure 15.
Exemplar detections of protective equipment for offshore drilling platform (violating protective equipment wearing regulations). The upper right corner of subgraph (the rightmost picture) is the time information: Friday, 18 January 2019, 11:59:19 a.m. And the lower right corner is the location information: CB30B low voltage distribution room.
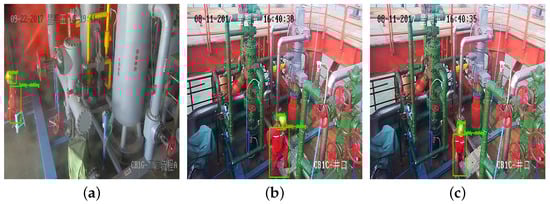
Figure 16.
Exemplar detections of protective equipment with complex human postures. The upper left corner of subgraph (a) is the time information: Friday, 22 September 2017, 3:19:41 p.m. And the lower right corner is the location information: CB1G-technological process. The upper left corner of subgraph (b) is the time information: Friday, 11 August 2017, 4:48:30 p.m. And the lower right corner is the location information: CB1C-wellhead. The upper right corner of subgraph (c) is the time information: Friday, 11 August 2017, 4:40:35 p.m. And the lower left corner is the location information: CB1C-wellhead.
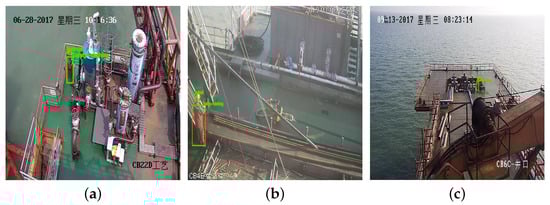
Figure 17.
Detection results of protective equipment for small workers. The upper left corner of subgraph (a) is the time information: Wednesday, 28 June 2017, 10:16:36 a.m. And the lower right corner is the location information: CB22D technology. The upper right corner of subgraph (b) is the time information: 7 March 2019, 7:55:23 a.m. And the lower right corner is the location information: CB4E-side A of living roof. The upper left corner of subgraph (c) is the time information: Wednesday, 13 September 2017, 8:23:14 a.m. And the lower left corner is the location information: CB6C-wellhead.
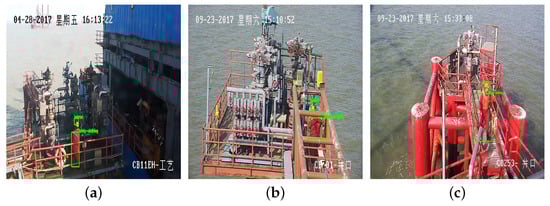
Figure 18.
Exemplar detections of protective equipment with occlusions. The upper left corner of subgraph (a) is the time information: Friday, 28 April 2017, 4:13:22 p.m. And the lower right corner is the location information: CB11EH technology. The upper right corner of subgraph (b) is the time information: 23 September 2017, 3:10:52 p.m. And the lower right corner is the location information: CB-01-wellhead. The upper left corner of subgraph (c) is the time information: Saturday, 23 September 2017, 3:33:08 p.m. And the lower left corner is the location information: CB253-wellhead.
The proposed method can not only realize the detection of safety helmets but also realize the detection of workwear uniforms. Figure 15 is the detection result of protective equipment for workers with complex posture. It can be seen that our method can accurately detect the wearing condition of protective equipment for workers with complex posture. Our method can accurately identify small-scale workers and detect their wearing of protective equipment, as shown in Figure 16. Most of the workers on offshore drilling platforms are small-scale, and our method can solve this problem very well. In the offshore drilling platform, many workers are covered by dense pipelines, and the color of pipelines is close to the color of workers’ workwear uniform. Figure 18 is the detection result of protective equipment when workers are covered. It can be seen from the results that the proposed method successfully detects protective equipment in the complex scenes of offshore drilling platforms.
5. Conclusions
We propose a novel method based on deep learning to realize intelligent detection of offshore drilling platform protection equipment. According to the symmetrical relationship between production benefit and safety management, intelligent safety management can improve the production benefit of the offshore drilling platform. We improve the feature fusion process of YOLOv3; the fusion factors are used to control the information from the deep layer to the shallow layer and make it more suitable for the detection of small objects, and the ASFF is used to make full use of the characteristics of different scales. At the same time, we use the random erasure method to increase the number of occluded workers samples, and the final worker target detection model has a high accuracy in the detection of small-scale workers and occluded workers. We fuse object detection and the RMPE method, fuse the candidate person detection and human body key point detection, and use the detected key point to locate the region of interest in the case of complex posture. We employ a convolutional neural network and transfer learning to implement the protective equipment detection. The accuracies of the safety helmet detection and the workwear uniform detection of the offshore drilling platform achieves 94.8% and 95.4%, respectively. As far as we know, this is the first attempt to use deep learning models for protective equipment detection of offshore drilling platforms. Currently, the proposed method is dedicated to safety helmet detection and workwear uniforms detection. In the future, we will improve the detection of the areas of interest and the identification of protective equipment in this paper so as to apply to more kinds of protective equipment detection according to the symmetry relationship between protective equipment, such as the detection of workers’ safety belts and gloves.
Author Contributions
Conceptualization, F.G.; Data curation, X.Y. and C.G.; Writing–original draft, X.J.; Writing–review & editing, W.G. All authors contributed equally to this work. All authors have read and agreed to the published version of the manuscript.
Funding
This research received no external funding.
Institutional Review Board Statement
Not applicable.
Informed Consent Statement
Informed consent was obtained from all subjects involved in the study.
Data Availability Statement
Not applicable.
Conflicts of Interest
The authors declare no conflict of interest.
References
- Rubaiyat, A.H.M.; Toma, T.T.; Kalantari-Khandani, M.; Rahman, S.A.; Chen, L.; Ye, Y.; Pan, C.S. Automatic detection of helmet uses for construction safety. In Proceedings of the 2016 IEEE/WIC/ACM International Conference on Web Intelligence Workshops (WIW), Omaha, NE, USA, 13–16 October 2016; pp. 135–142. [Google Scholar]
- Luo, X.; Li, H.; Yang, X.; Yu, Y.; Cao, D. Capturing and understanding workers’ activities in far-field surveillance videos with deep action recognition and bayesian nonparametric learning. Comput. Aided Civ. Infrastruct. Eng. 2019, 34, 333–351. [Google Scholar] [CrossRef]
- Shen, J.; Xiong, X.; Li, Y.; He, W.; Li, P.; Zheng, X. Detecting safety helmet wearing on construction sites with bounding-box regression and deep transfer learning. Comput. Aided Civ. Infrastruct. Eng. 2021, 36, 180–196. [Google Scholar] [CrossRef]
- Wang, H.; Hu, Z.; Guo, Y.; Yang, Z.; Zhou, F.; Xu, P. A real-time safety helmet wearing detection approach based on csyolov3. Appl. Sci. 2020, 10, 6732. [Google Scholar] [CrossRef]
- Long, X.; Cui, W.; Zheng, Z. Safety helmet wearing detection based on deep learning. In Proceedings of the 2019 IEEE 3rd Information Technology, Networking, Electronic and Automation Control Conference (ITNEC), Chengdu, China, 15–17 March 2019; pp. 2495–2499. [Google Scholar]
- Wu, H.; Zhao, J. An intelligent vision-based approach for helmet identification for work safety. Comput. Ind. 2018, 100, 267–277. [Google Scholar] [CrossRef]
- Park, M.-W.; Brilakis, I. Construction worker detection in video frames for initializing vision trackers. Autom. Constr. 2012, 28, 15–25. [Google Scholar] [CrossRef]
- Siebert, F.W.; Lin, H. Detecting motorcycle helmet use with deep learning. Accid. Anal. Prev. 2020, 134, 105319. [Google Scholar] [CrossRef] [PubMed]
- Vishnu, C.; Singh, D.; Mohan, C.K.; Babu, S. Detection of motorcyclists without helmet in videos using convolutional neural network. In Proceedings of the 2017 International Joint Conference on Neural Networks (IJCNN), Anchorage, AK, USA, 14–19 May 2017; pp. 3036–3041. [Google Scholar]
- Doungmala, P.; Klubsuwan, K. Helmet wearing detection in thailand using haar like feature and circle hough transform on image processing. In Proceedings of the 2016 IEEE International Conference on Computer and Information Technology (CIT), Nadi, Fiji, 8–10 December 2016; pp. 611–614. [Google Scholar]
- Li, J.; Liu, H.; Wang, T.; Jiang, M.; Wang, S.; Li, K.; Zhao, X. Safety helmet wearing detection based on image processing and machine learning. In Proceedings of the 2017 Ninth International Conference on Advanced Computational Intelligence (ICACI), Doha, Qatar, 4–6 February 2017; pp. 201–205. [Google Scholar]
- Wen, C.-Y. The safety helmet detection technology and its application to the surveillance system. J. Forensic Sci. 2004, 49, 1–11. [Google Scholar] [CrossRef]
- Chiverton, J. Helmet presence classification with motorcycle detection and tracking. IET Intell. Transp. Syst. 2012, 6, 259–269. [Google Scholar] [CrossRef]
- Waranusast, R.; Bundon, N.; Timtong, V.; Tangnoi, C.; Pattanathaburt, P. Machine vision techniques for motorcycle safety helmet detection. In Proceedings of the 2013 28th International Conference on Image and Vision Computing New Zealand (IVCNZ 2013), Wellington, New Zealand, 27–29 November 2013; pp. 35–40. [Google Scholar]
- Dahiya, K.; Singh, D.; Mohan, C.K. Automatic detection of bike-riders without helmet using surveillance videos in real-time. In Proceedings of the 2016 International Joint Conference on Neural Networks (IJCNN), Vancouver, BC, Canada, 24–29 July 2016; pp. 3046–3051. [Google Scholar]
- Bo, Y.; Huan, Q.; Huan, X.; Rong, Z.; Hongbin, L.; Kebin, M.; Weizhong, Z.; Lei, Z. Helmet detection under the power construction scene based on image analysis. In Proceedings of the 2019 IEEE 7th International Conference on Computer Science and Network Technology (ICCSNT), Dalian, China, 19–20 October 2019; pp. 67–71. [Google Scholar]
- Fang, Q.; Li, H.; Luo, X.; Ding, L.; Luo, H.; Rose, T.M.; An, W. Detecting non-hardhat-use by a deep learning method from far-field surveillance videos. Autom. Constr. 2018, 85, 1–9. [Google Scholar] [CrossRef]
- Nath, N.D.; Behzadan, A.H.; Paal, S.G. Deep learning for site safety: Real-time detection of personal protective equipment. Autom. Constr. 2020, 112, 103085. [Google Scholar] [CrossRef]
- Redmon, J.; Farhadi, A. Yolov3: An incremental improvement. arXiv 2018, arXiv:1804.02767. [Google Scholar]
- Fang, H.-S.; Xie, S.; Tai, Y.-W.; Lu, C. Rmpe: Regional multi-person pose estimation. In Proceedings of the IEEE International Conference on Computer Vision, Venice, Italy, 22–29 October 2017; pp. 2334–2343. [Google Scholar]
- He, K.; Zhang, X.; Ren, S.; Sun, J. Deep residual learning for image recognition. In Proceedings of the IEEE Conference on Computer Vision and Pattern Recognition, Las Vegas, NV, USA, 26 June–1 July 2016; pp. 770–778. [Google Scholar]
- Zhong, Z.; Zheng, L.; Kang, G.; Li, S.; Yang, Y. Random erasing data augmentation. In Proceedings of the AAAI Conference on Artificial Intelligence, New York, NY, USA, 7–12 February 2020; Volume 34, pp. 13001–13008. [Google Scholar]
- Hu, Z.; Yan, H.; Lin, X. Clothing segmentation using foreground and background estimation based on the constrained delaunay triangulation. Pattern Recognit. 2008, 41, 1581–1592. [Google Scholar] [CrossRef]
- Gallagher, A.C.; Chen, T. Clothing cosegmentation for recognizing people. In Proceedings of the 2008 IEEE Conference on Computer Vision and Pattern Recognition, Anchorage, AK, USA, 23–28 June 2008; pp. 1–8. [Google Scholar]
- Stricker, M.; Dimai, A. Spectral covariance and fuzzy regions for image indexing. Mach. Vis. Appl. 1997, 10, 66–73. [Google Scholar] [CrossRef]
- Li, X. Image retrieval based on perceptive weighted color blocks. Pattern Recognit. Lett. 2003, 24, 1935–1941. [Google Scholar] [CrossRef]
- Yang, W.; Luo, P.; Lin, L. Clothing co-parsing by joint image segmentation and labeling. In Proceedings of the IEEE Conference on Computer Vision and Pattern Recognition, Columbus, OH, USA, 24–27 June 2014; pp. 3182–3189. [Google Scholar]
- Yamaguchi, K.; Kiapour, M.H.; Ortiz, L.E.; Berg, T.L. Parsing clothing in fashion photographs. In Proceedings of the 2012 IEEE Conference on Computer Vision and Pattern Recognition, Providence, RI, USA, 16–21 June 2012; pp. 3570–3577. [Google Scholar]
- Bo, Y.; Fowlkes, C.C. Shape-based pedestrian parsing. In Proceedings of the CVPR 2011, Colorado Springs, CO, USA, 20–25 June 2011; pp. 2265–2272. [Google Scholar]
- Jin, L.; Liu, G. An approach on image processing of deep learning based on improved ssd. Symmetry 2021, 13, 495. [Google Scholar] [CrossRef]
- Gong, Y.; Yu, X.; Ding, Y.; Peng, X.; Zhao, J.; Han, Z. Effective fusion factor in fpn for tiny object detection. In Proceedings of the IEEE/CVF Winter Conference on Applications of Computer Vision, Virtual Conference, 5–9 January 2021; pp. 1160–1168. [Google Scholar]
- Liu, S.; Huang, D.; Wang, Y. Learning spatial fusion for single-shot object detection. arXiv 2019, arXiv:1911.09516. [Google Scholar]
- Wang, G.; Wang, K.; Lin, L. Adaptively connected neural networks. In Proceedings of the IEEE/CVF Conference on Computer Vision and Pattern Recognition, Long Beach, CA, USA, 15–20 June 2019; pp. 1781–1790. [Google Scholar]
- Qiang, Z.; Yao, Y.; Zhou, D.; Liu, R. Motion key-frame extraction by using optimized t-stochastic neighbor embedding. Symmetry 2015, 7, 395–411. [Google Scholar]
- He, Y.; Zhu, C.; Wang, J.; Savvides, M.; Zhang, X. Bounding box regression with uncertainty for accurate object detection. In Proceedings of the IEEE/CVF Conference on Computer Vision and Pattern Recognition, Long Beach, CA, USA, 15–20 June 2019; pp. 2888–2897. [Google Scholar]
- Zou, Z.; Shi, Z.; Guo, Y.; Ye, J. Object detection in 20 years: A survey. arXiv 2019, arXiv:1905.05055. [Google Scholar]
Publisher’s Note: MDPI stays neutral with regard to jurisdictional claims in published maps and institutional affiliations. |
© 2021 by the authors. Licensee MDPI, Basel, Switzerland. This article is an open access article distributed under the terms and conditions of the Creative Commons Attribution (CC BY) license (https://creativecommons.org/licenses/by/4.0/).