
Generalizing Normality: Different Estimation Methods for Skewed Information

 ,
,  ,
, 

Abstract
1. Introduction
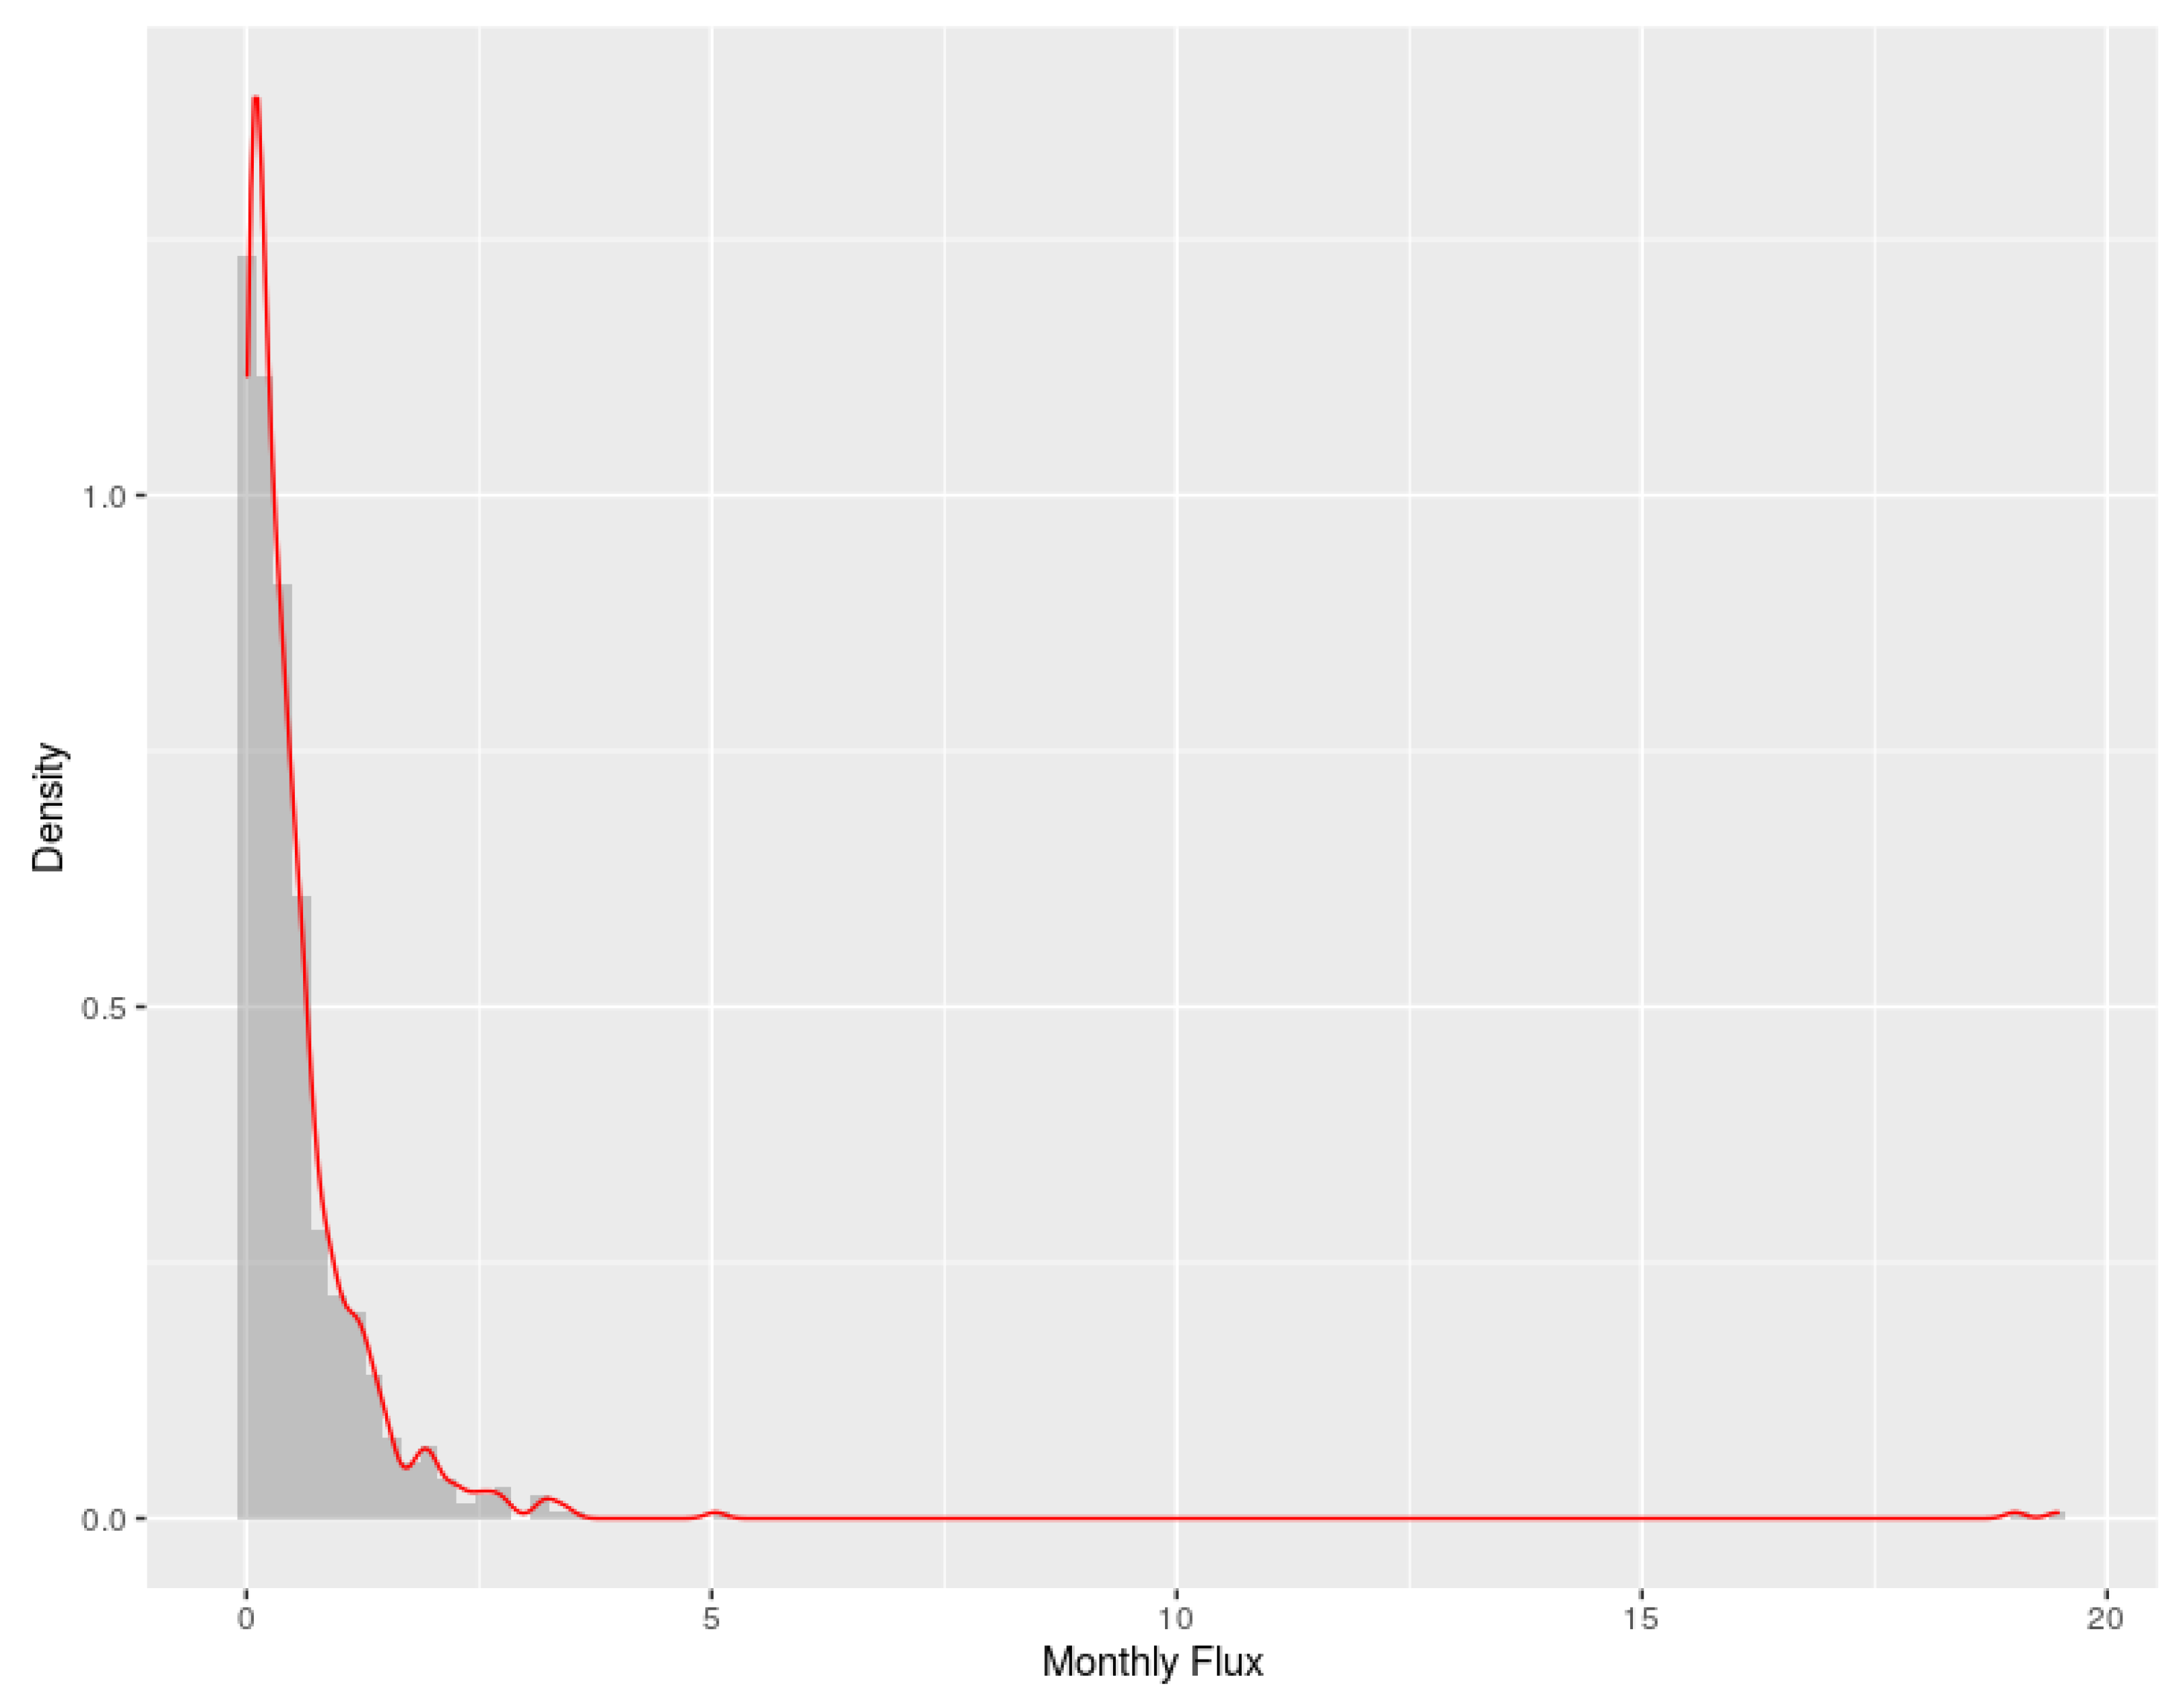
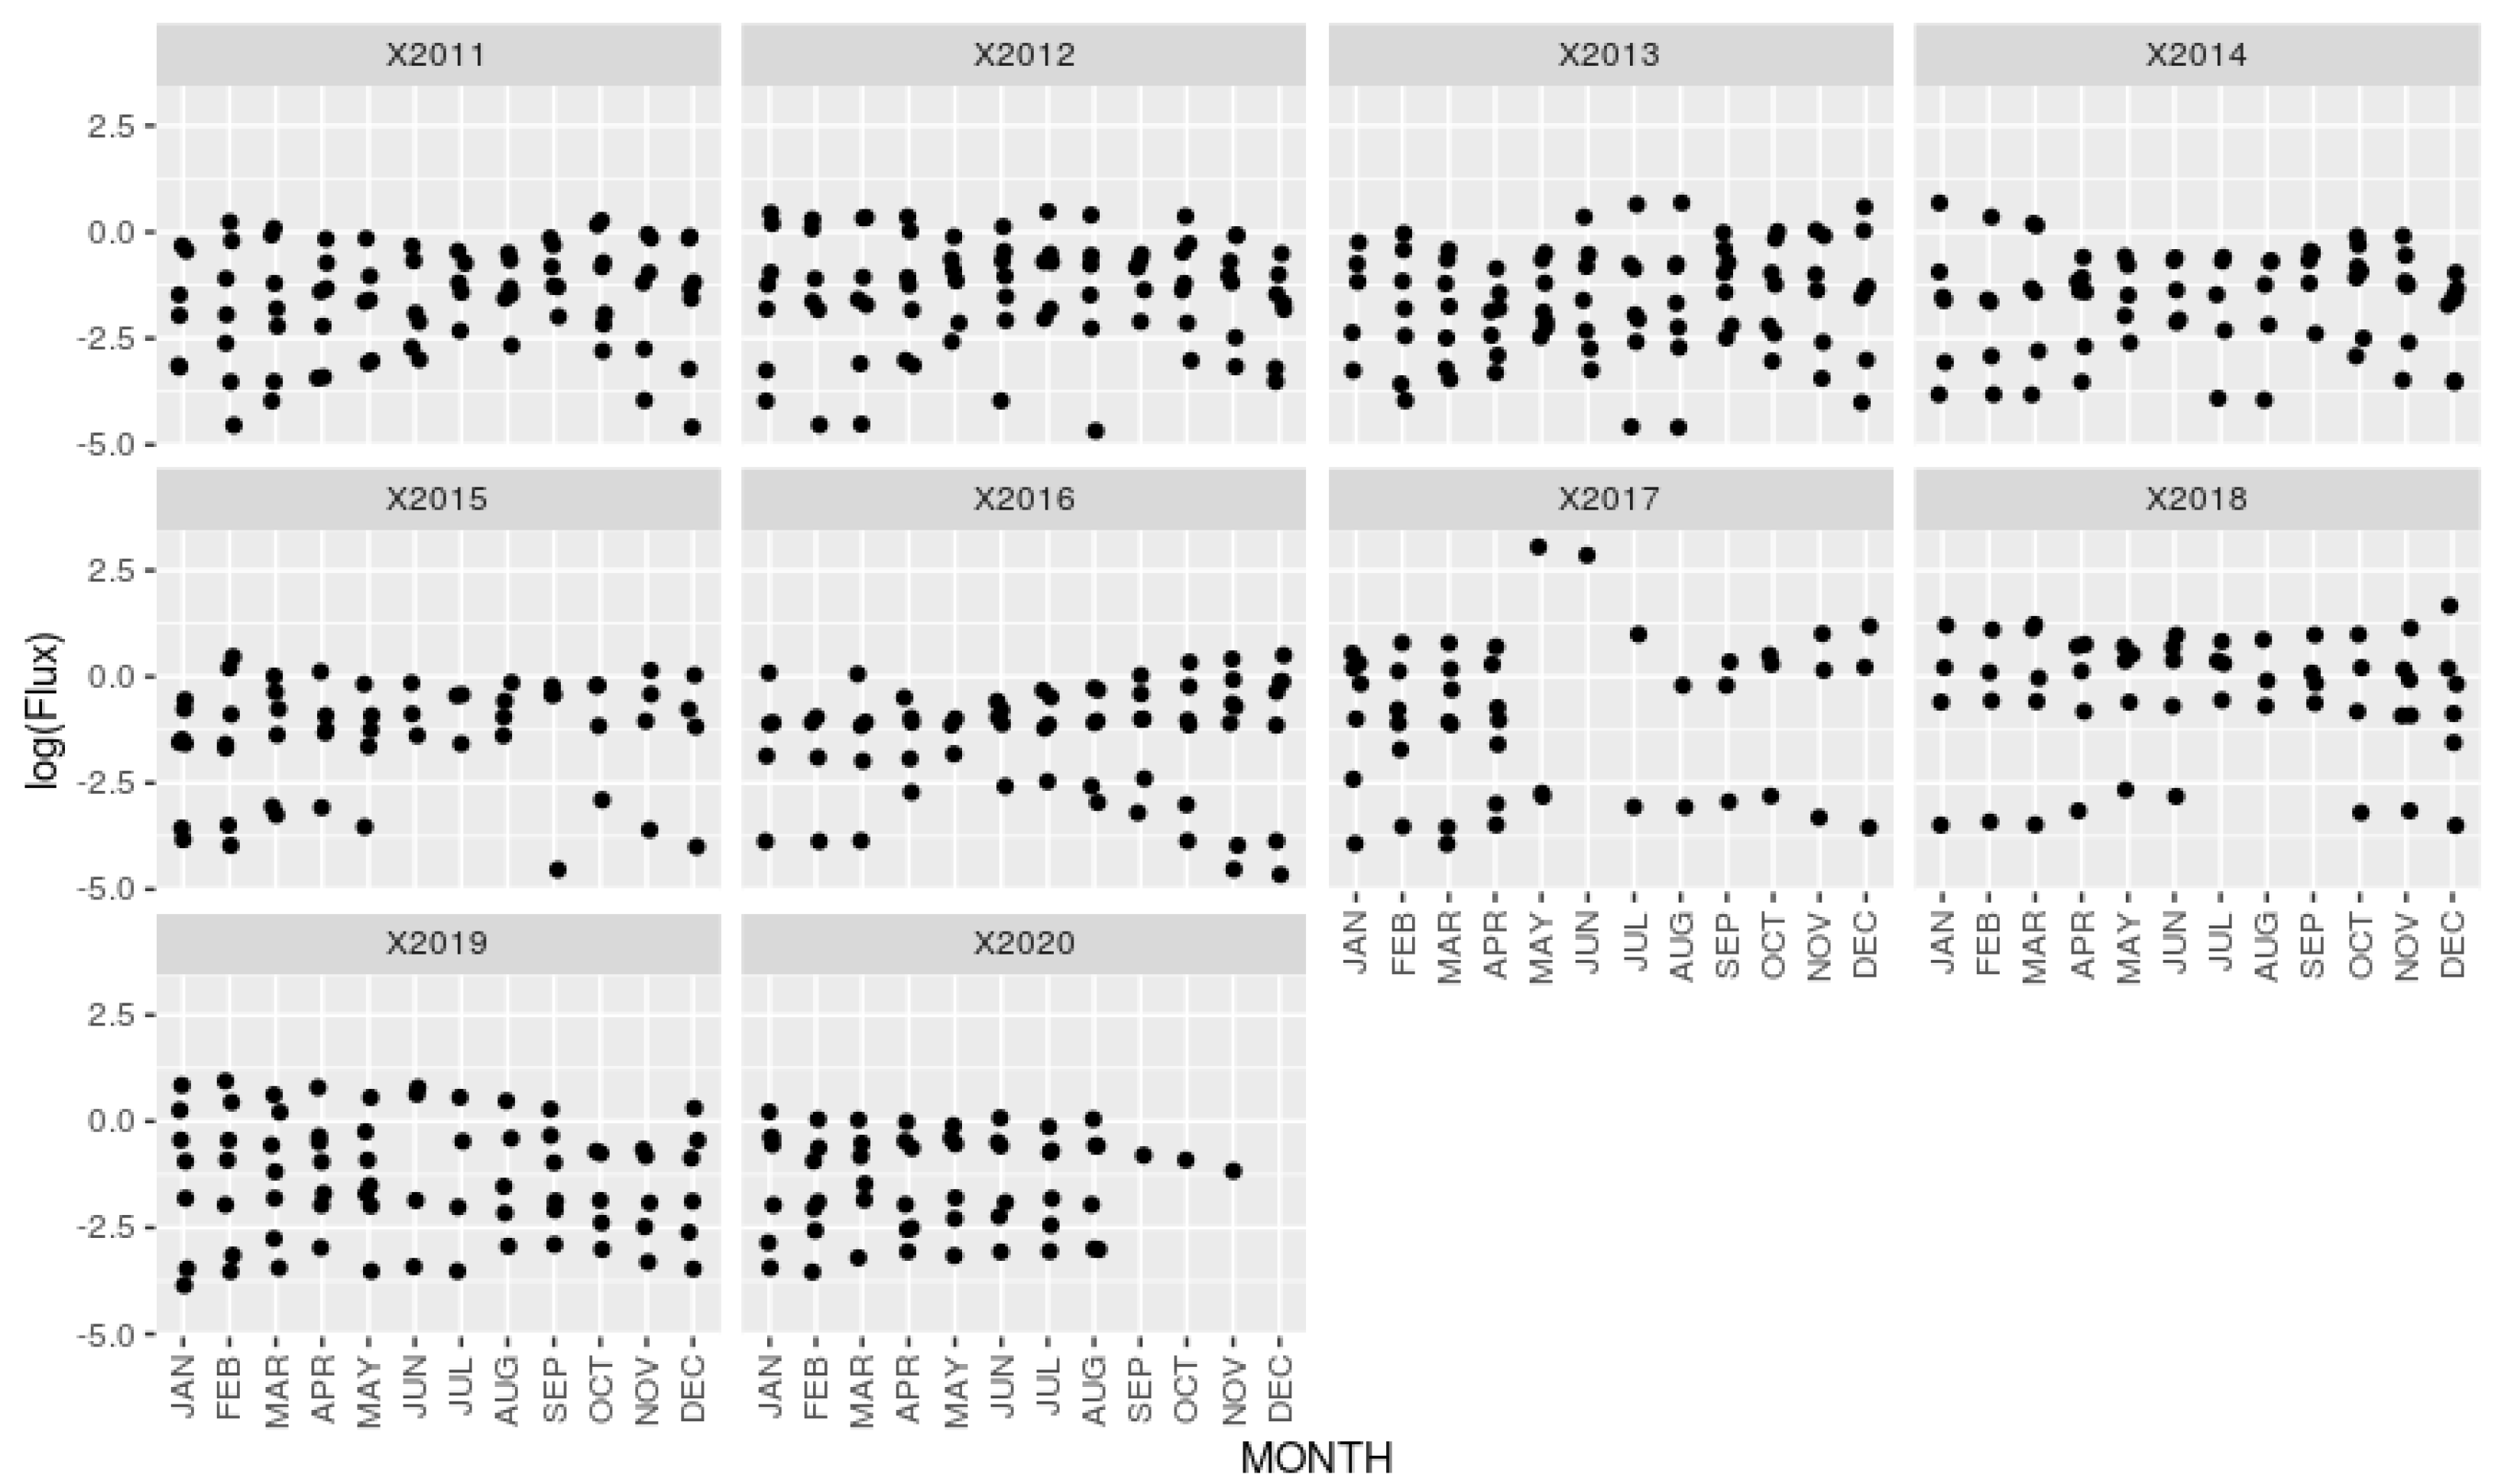
2. The Data
3. Statistical Inference Elements
3.1. Alpha-Skew-Normal (ASN) Distribution
3.2. Different Estimation Methods for the ASN Distribution
3.2.1. Maximum Likelihood Estimation
3.2.2. Ordinary and Weighted Least-Square Estimates
3.2.3. Method of the Maximum Product of Spacings
3.2.4. The Cramer–von Mises Minimum Distance Estimators
3.2.5. The Anderson–Darling and Right-Tail Anderson–Darling Estimators
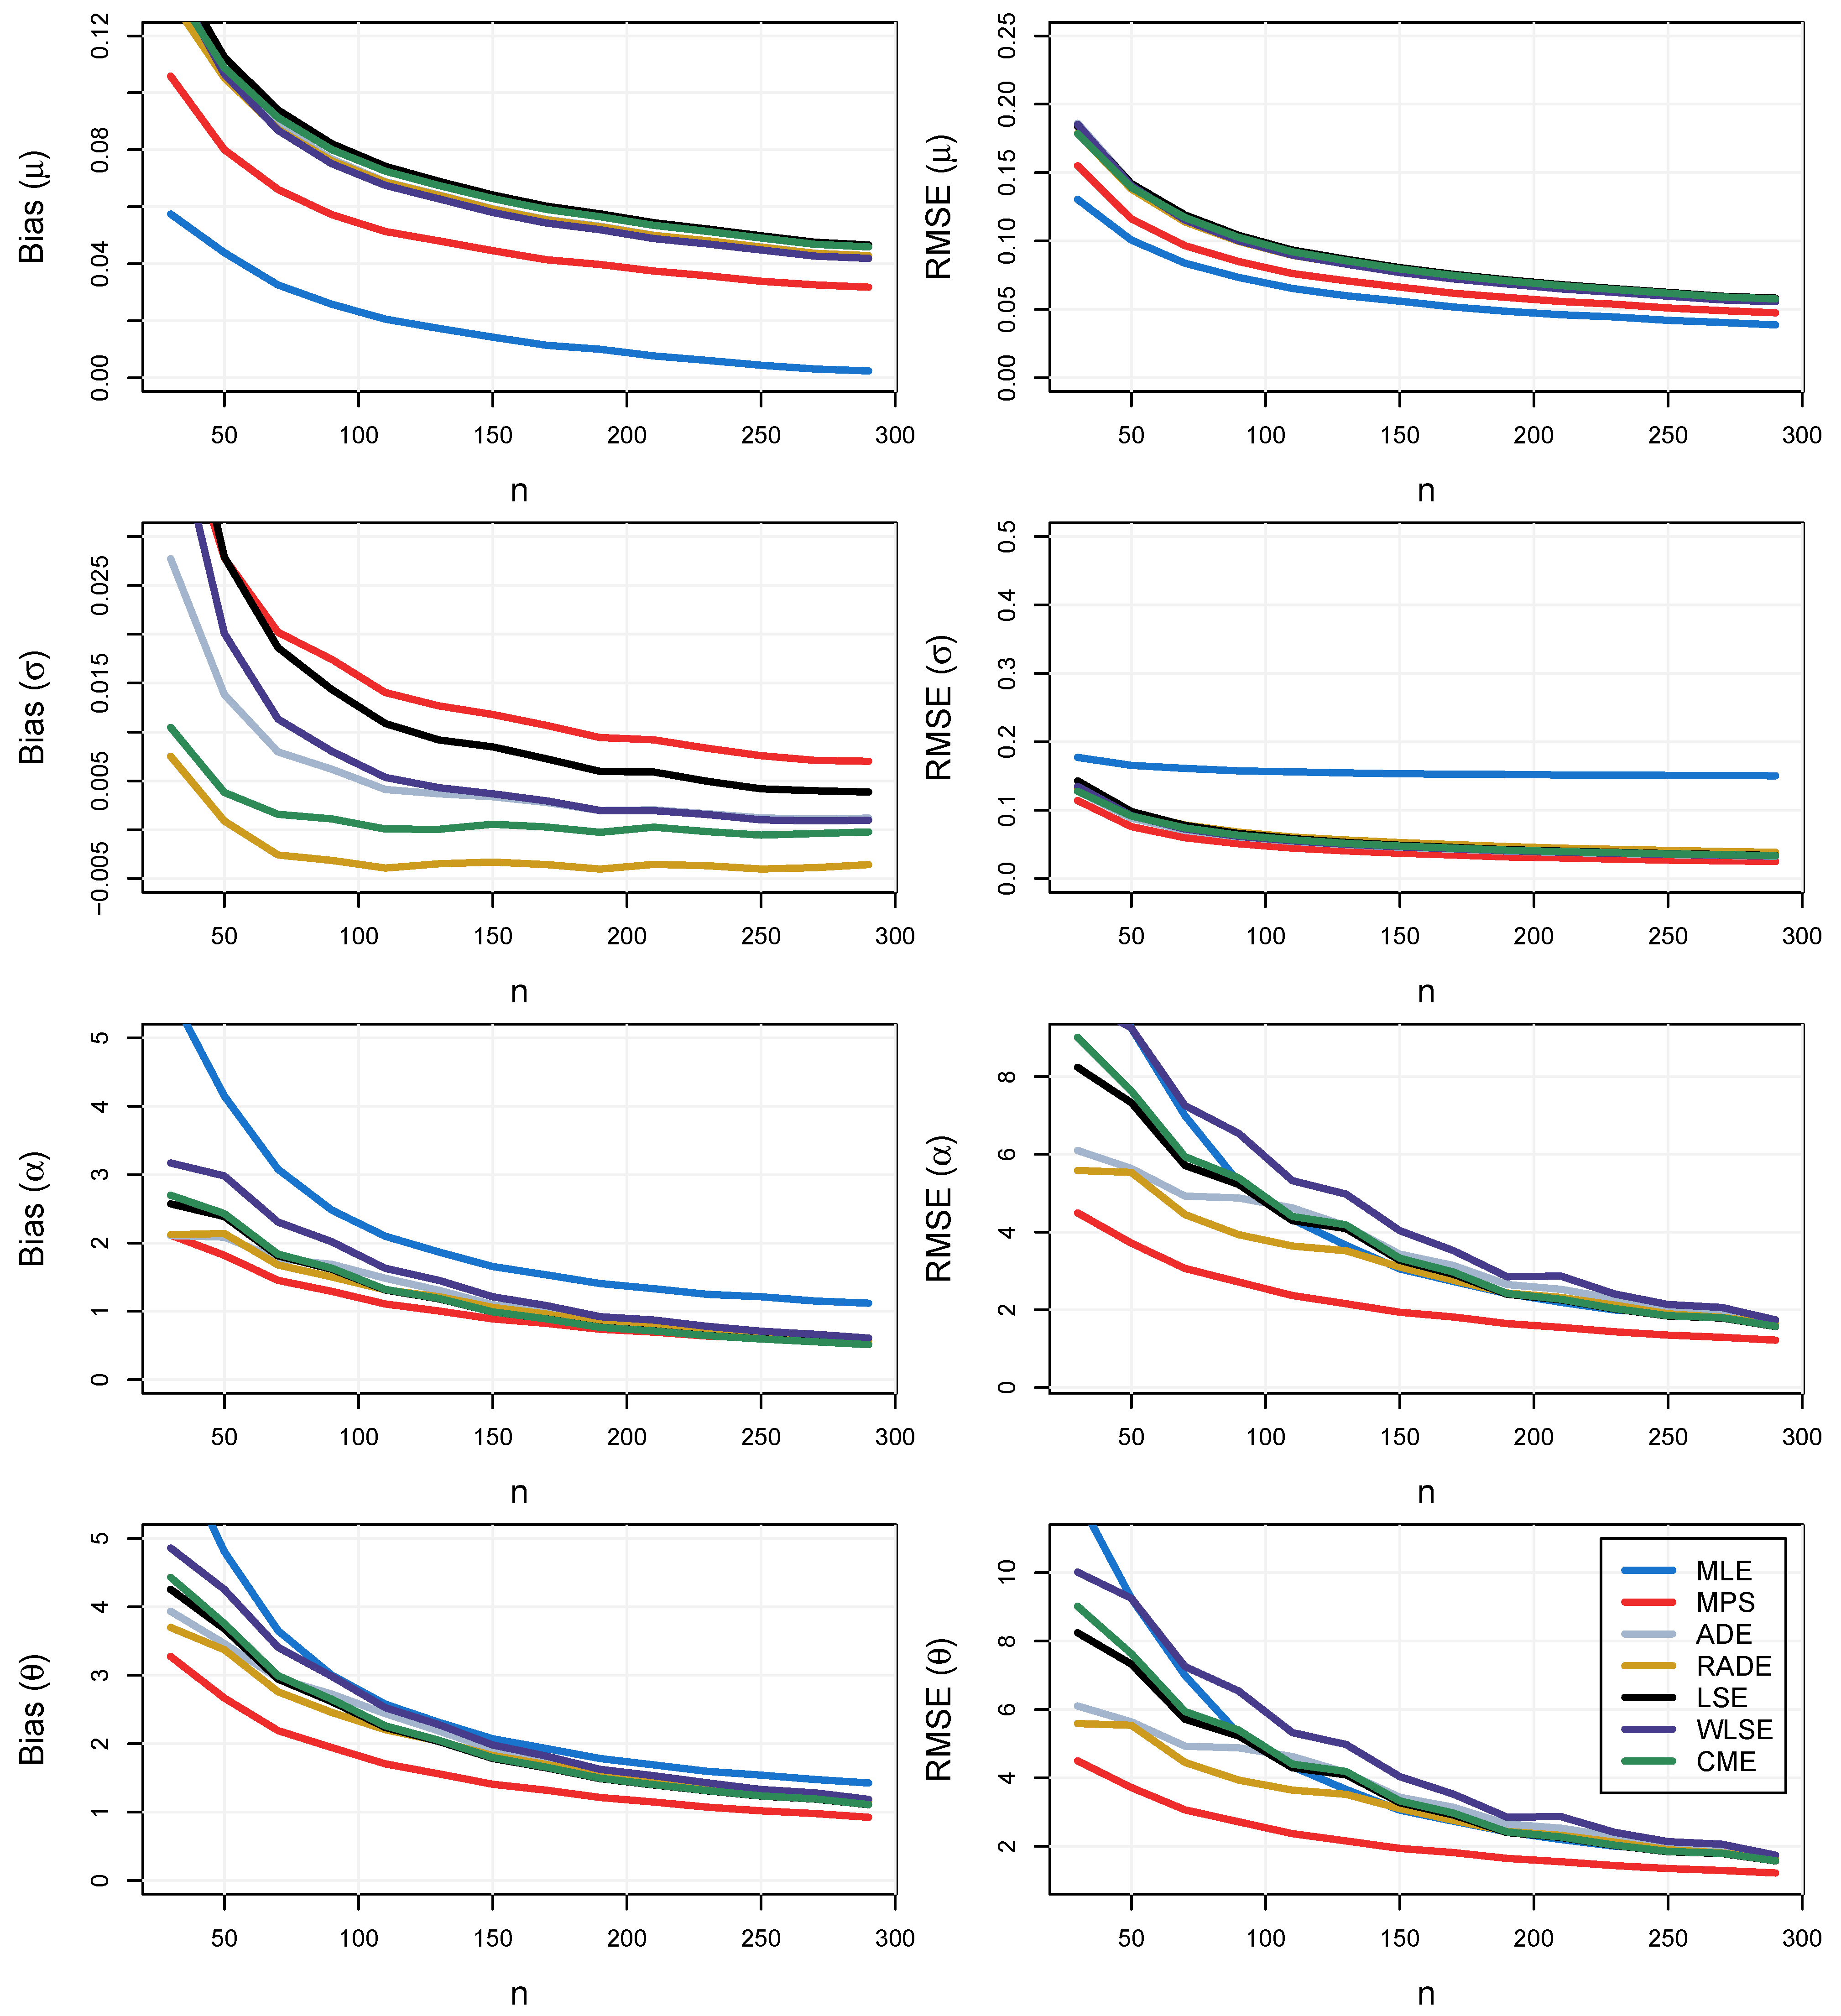
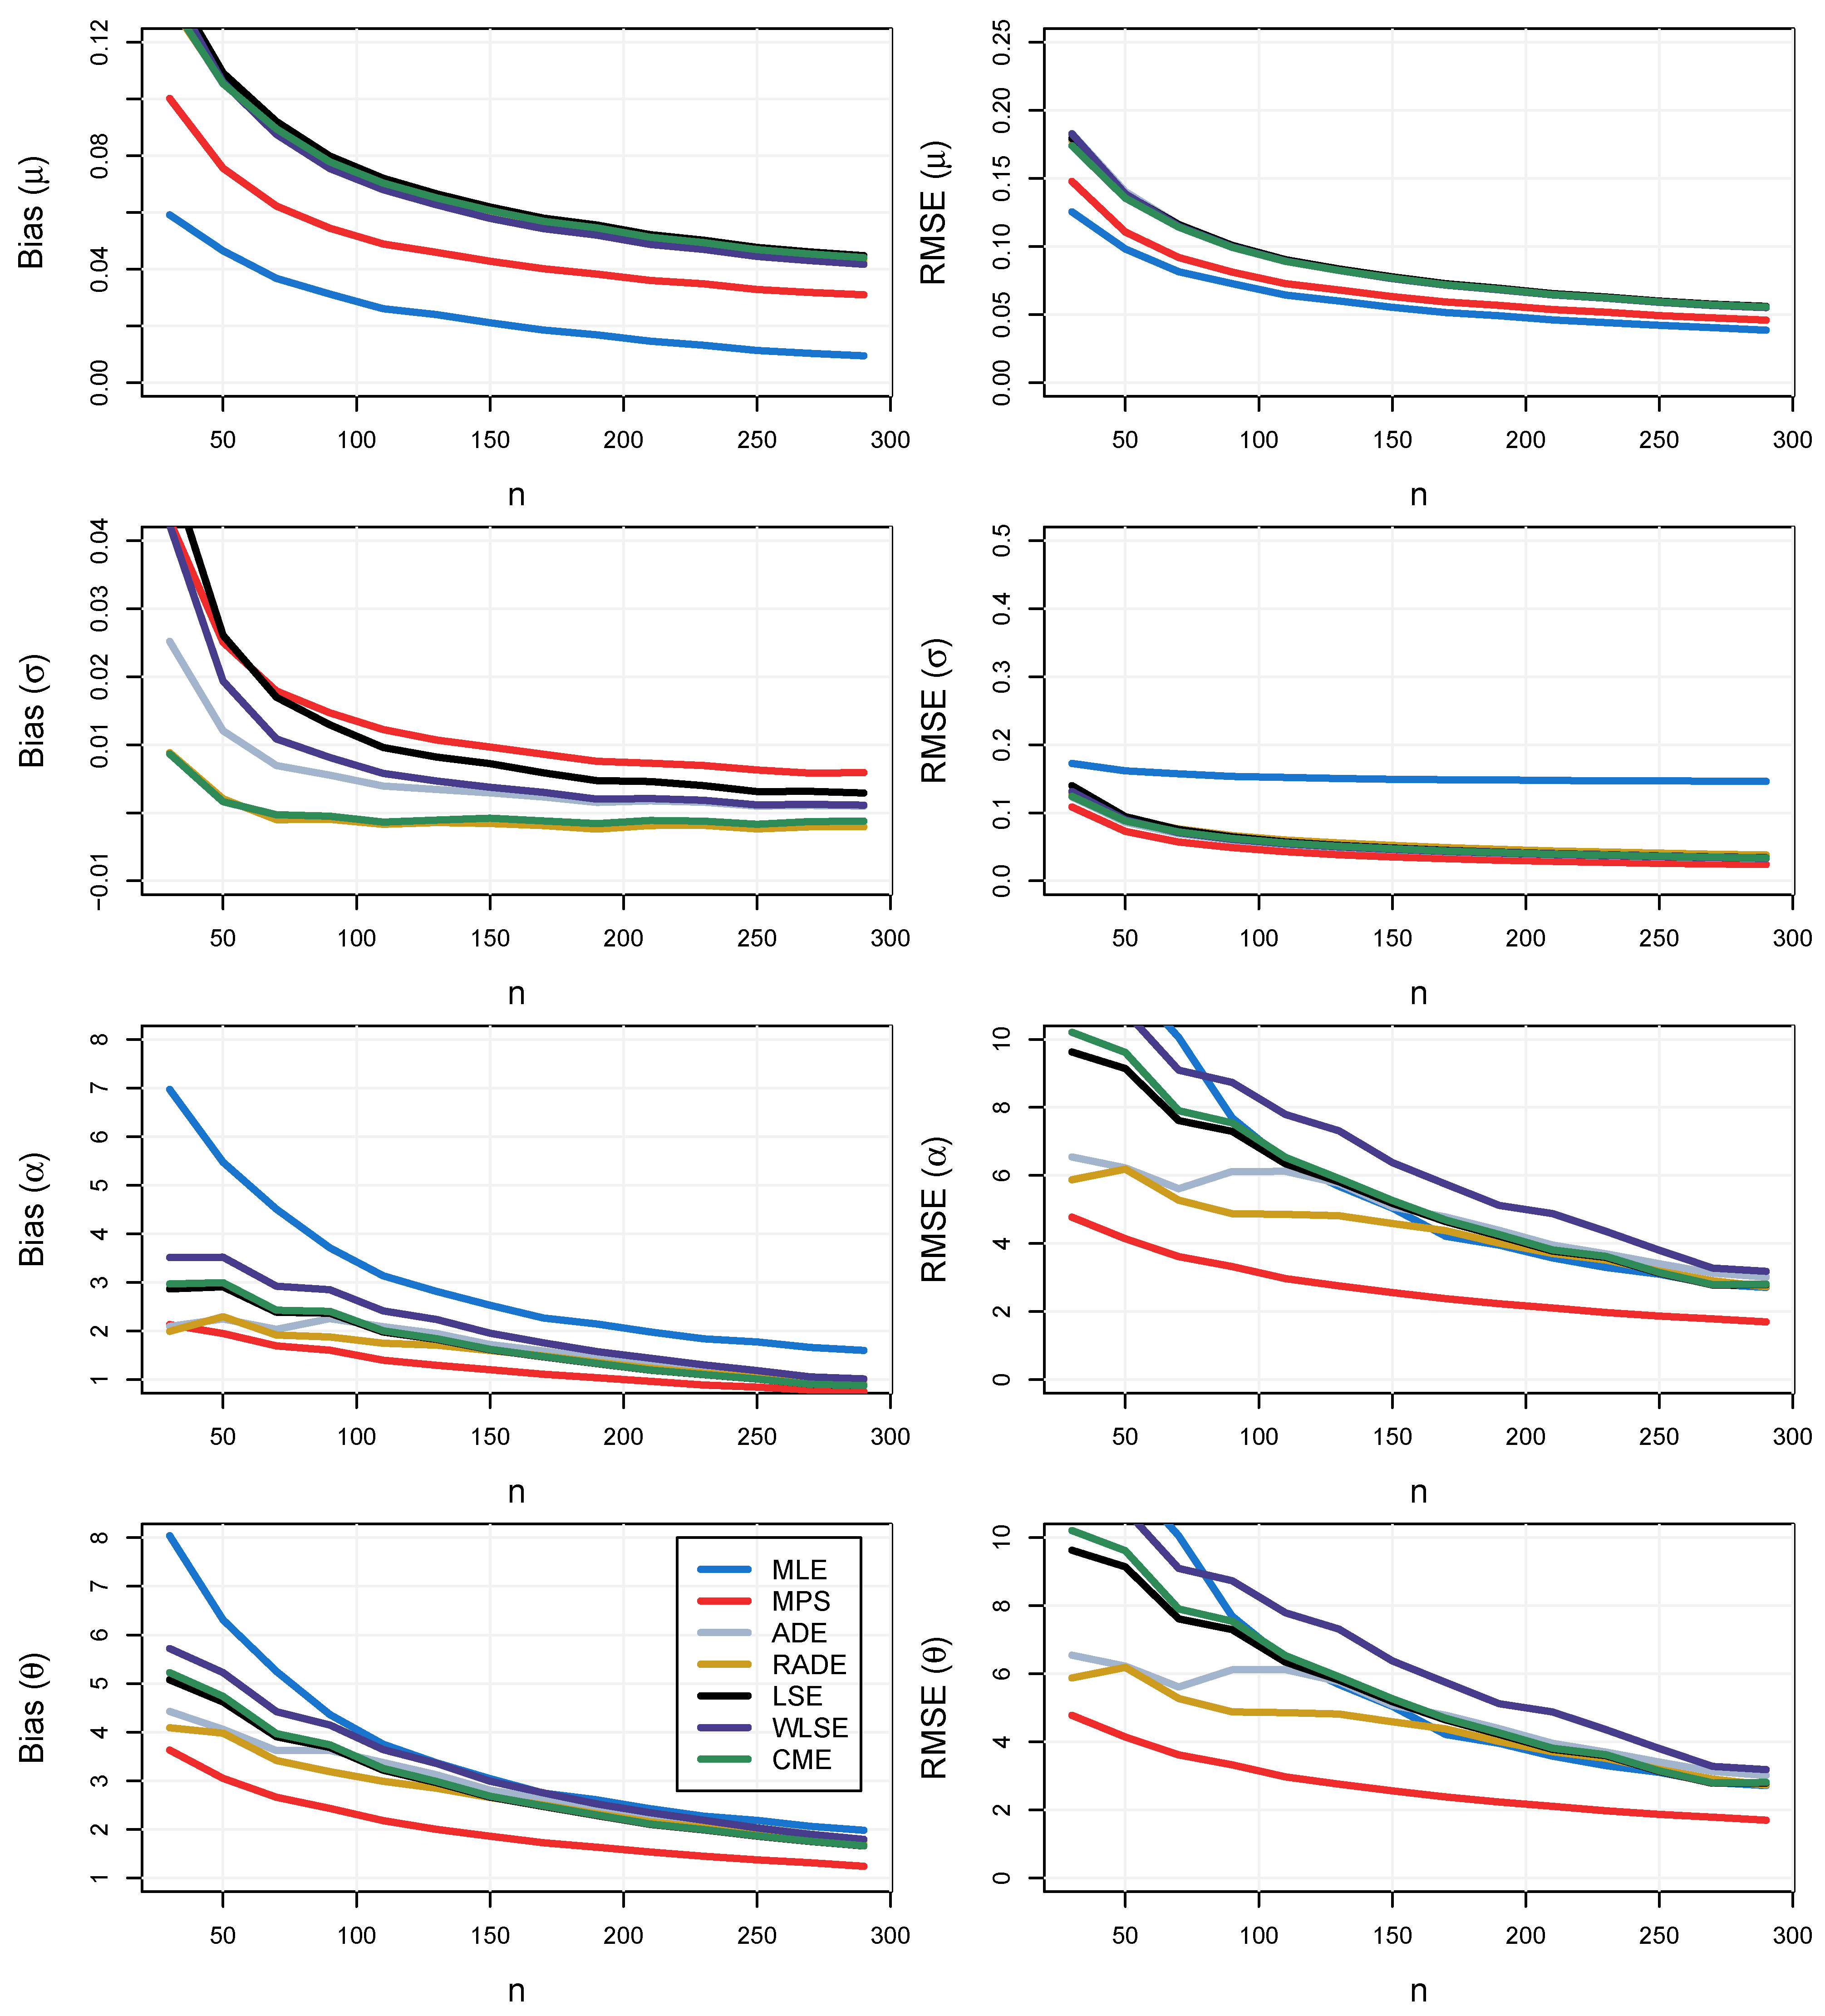
4. Numerical Analysis
- Given a set of parameters from the distribution, N samples of size n were generated;
- For each generated set, based on the estimation methods (MLE, LSQ, WLQ, MPS, CME, ADE, and RADE), estimates of the parameters (, , and ) were calculated;
- Then, considering and , the bias and mean squared error (MSE) of , which were given, respectively, by and for (each parameter), were computed. denotes the estimate of obtained from sample k for .
- The overall bias and the overall MSE were computed with and .
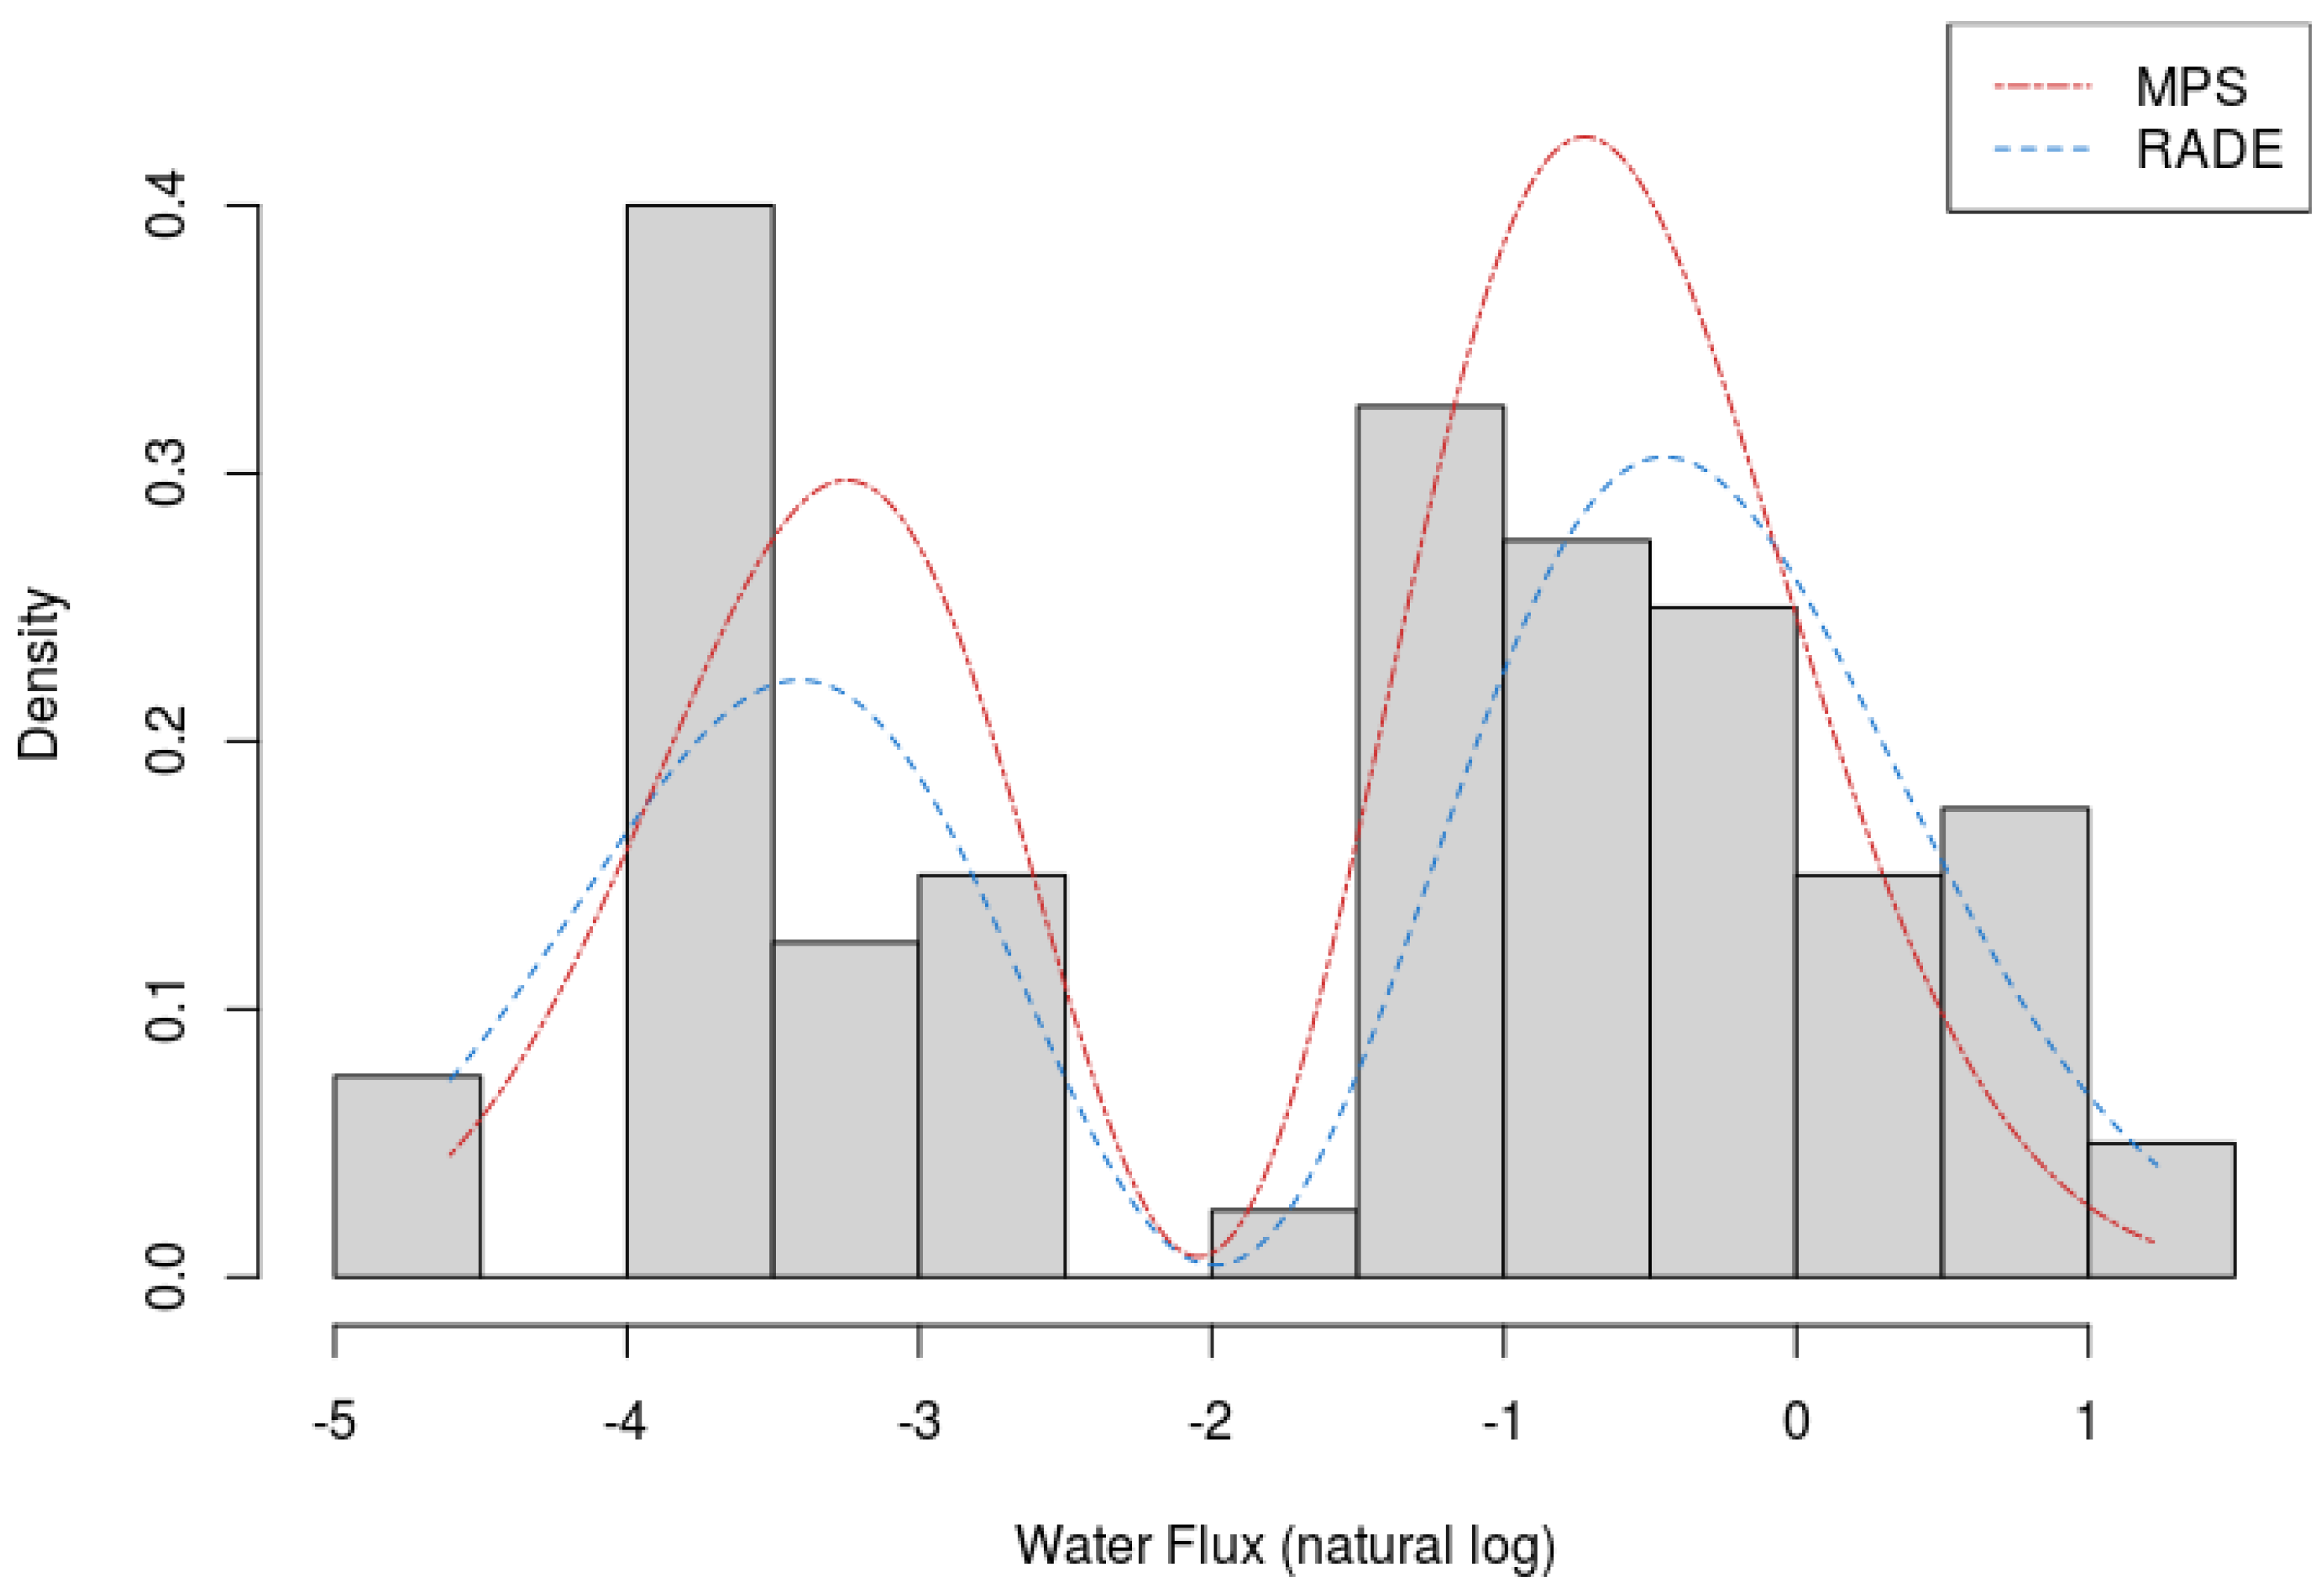
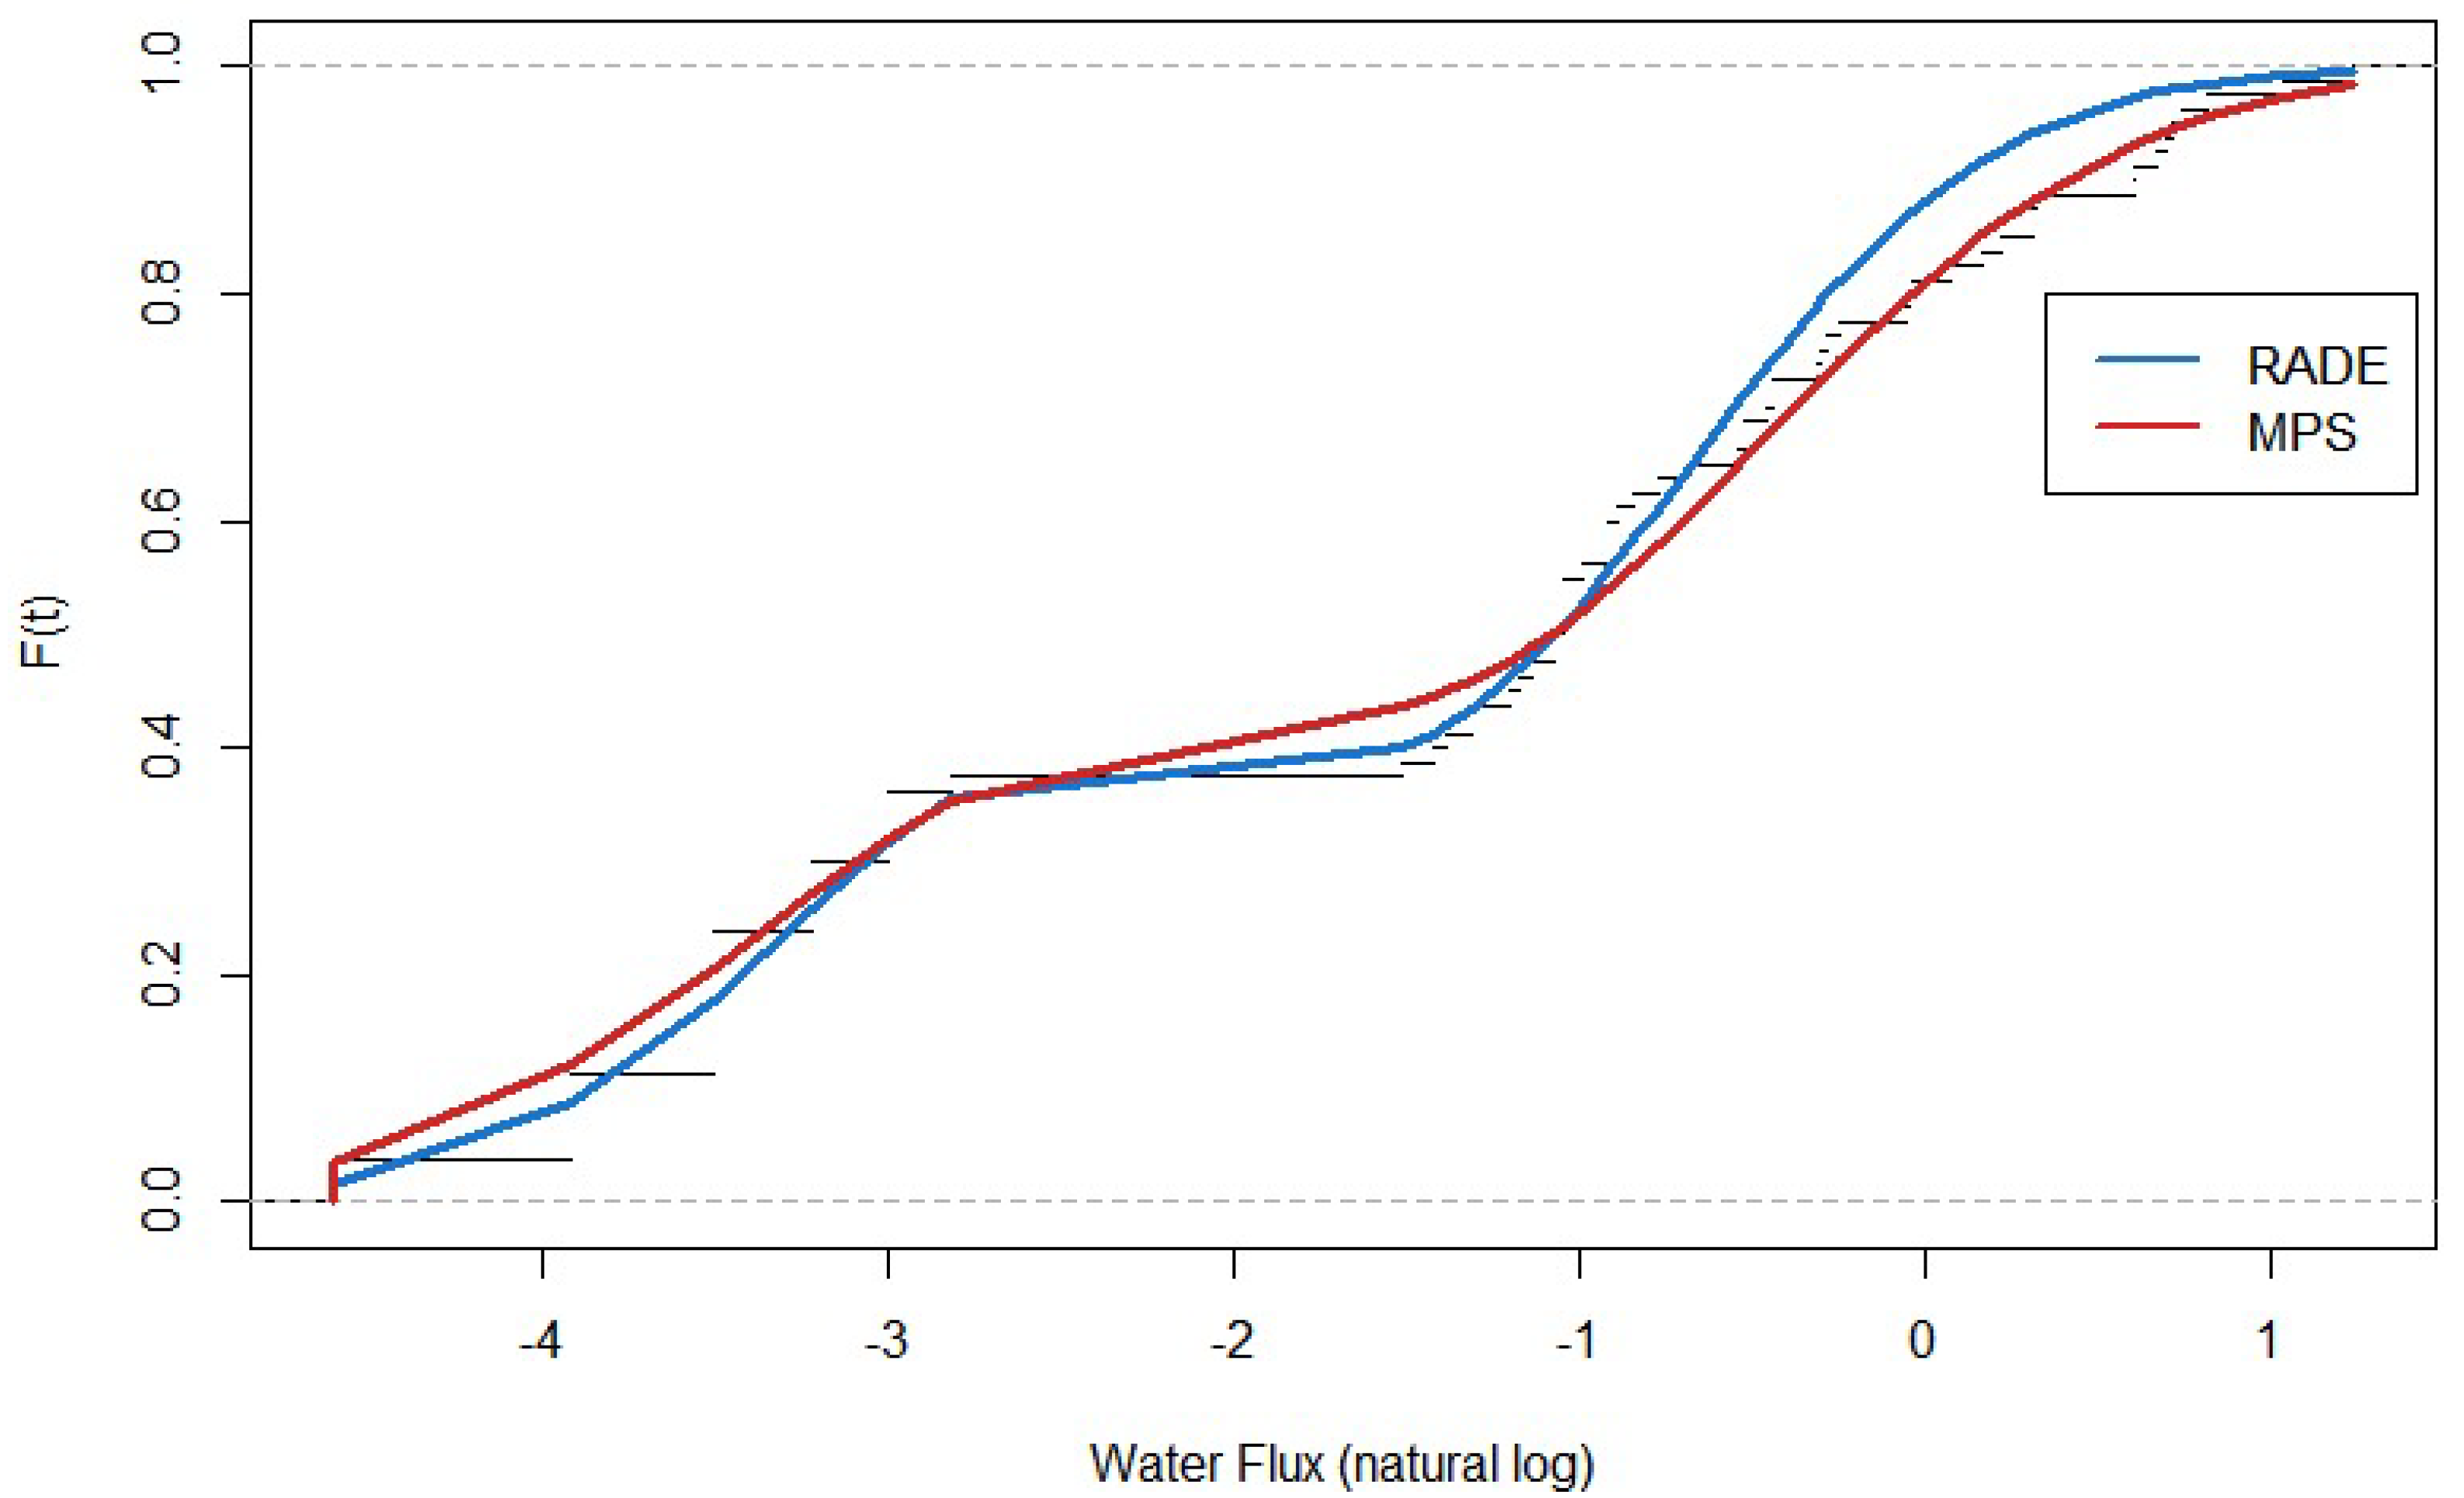
5. Results
6. Conclusions
Author Contributions
Funding
Institutional Review Board Statement
Informed Consent Statement
Data Availability Statement
Conflicts of Interest
References
- Cox, D.; Kartsonaki, C.; Keogh, R.H. Big data: Some statistical issues. Stat. Probab. Lett. 2018, 136, 111–115. [Google Scholar] [CrossRef]
- Efron, B.; Hastie, T. Computer Age Statistical Inference; Cambridge University Press: Cambridge, UK, 2016; Volume 5. [Google Scholar]
- Smith, J.Q. Decision Analysis: A Bayesian Approach; Chapman & Hall, Ltd.: London, UK, 1987. [Google Scholar]
- Leonelli, M.; Riccomagno, E.; Smith, J.Q. Coherent combination of probabilistic outputs for group decision making: An algebraic approach. OR Spectr. 2020, 42, 499–528. [Google Scholar] [CrossRef]
- Swain, J.J.; Venkatraman, S.; Wilson, J.R. Least-squares estimation of distribution functions in johnson’s translation system. J. Stat. Comput. Simul. 1988, 29, 271–297. [Google Scholar] [CrossRef]
- Cheng, R.; Amin, N. Maximum product of spacings estimation with application to the lognormal distribution. Math. Rep. 1979, 79, 1. [Google Scholar]
- Ranneby, B. The maximum spacing method. an estimation method related to the maximum likelihood method. Scand. J. Stat. 1984, 11, 93–112. [Google Scholar]
- Luceño, A. Fitting the generalized pareto distribution to data using maximum goodness-of-fit estimators. Comput. Stat. Data Anal. 2006, 51, 904–917. [Google Scholar] [CrossRef]
- Louzada, F.; Ramos, P.L.; Ferreira, P.H. Exponential-poisson distribution: Estimation and applications to rainfall and aircraft data with zero occurrence. Commun. Stat. Simul. Comput. 2020, 49, 1024–1043. [Google Scholar] [CrossRef]
- Ramos, P.L.; Nascimento, D.C.; Ferreira, P.H.; Weber, K.T.; Santos, T.E.; Louzada, F. Modeling traumatic brain injury lifetime data: Improved estimators for the generalized gamma distribution under small samples. PLoS ONE 2019, 14, e0221332. [Google Scholar] [CrossRef]
- Bonnail, E.; Lima, R.C.; Turrieta, G.M. Trapping fresh sea breeze in desert? Health status of camanchaca, atacama’s fog. Environ. Sci. Pollut. Res. 2018, 25, 18204–18212. [Google Scholar] [CrossRef]
- Du, H.; Alexander, L.V.; Donat, M.G.; Lippmann, T.; Srivastava, A.; Salinger, J.; Kruger, A.; Choi, G.; He, H.S.; Fujibe, F.; et al. Precipitation from persistent extremes is increasing in most regions and globally. Geophys. Res. Lett. 2019, 46, 6041–6049. [Google Scholar] [CrossRef]
- Lopes, H.F.; Salazar, E.; Gamerman, D. Spatial dynamic factor analysis. Bayesian Anal. 2008, 3, 759–792. [Google Scholar] [CrossRef]
- Mutti, P.R.; Lúcio, P.S.; Dubreuil, V.; Bezerra, B.G. Ndvi time series stochastic models for the forecast of vegetation dynamics over desertification hotspots. Int. J. Remote Sens. 2020, 41, 2759–2788. [Google Scholar] [CrossRef]
- Dutfoy, A.; Parey, S.; Roche, N. Multivariate extreme value theory-a tutorial with applications to hydrology and meteorology. Depend. Model. 2014, 2. [Google Scholar] [CrossRef]
- Ramos, P.; Louzada, F. The generalized weighted lindley distribution: Properties, estimation and applications. Cogent Math. 2016, 3, 1256022. [Google Scholar] [CrossRef]
- Rodrigues, G.C.; Louzada, F.; Ramos, P.L. Poisson—Exponential distribution: Different methods of estimation. J. Appl. Stat. 2018, 45, 128–144. [Google Scholar] [CrossRef]
- Elal-Olivero, D. Alpha-skew-normal distribution. Proyecciones 2010, 29, 224–240. [Google Scholar] [CrossRef]
- Tarnopolski, M. Analysis of gamma-ray burst duration distribution using mixtures of skewed distributions. Mon. Not. R. Astron. Soc. 2016, 458, 2024–2031. [Google Scholar] [CrossRef]
- Yang, K.; Aziz, M. Modeling Wind Speed Distributions Using Skewed Probability Functions: A Monte Carlo Simulation with Applications to Real Wind Speed Data. Available online: https://minds.wisconsin.edu/handle/1793/79304 (accessed on 4 May 2021).
- Ara, A.; Louzada, F. The multivariate alpha skew gaussian distribution. Bull. Braz. Math. Soc. New Ser. 2019, 50, 823–843. [Google Scholar] [CrossRef]
- Dey, S.; Kumar, D.; Ramos, P.L.; Louzada, F. Exponentiated chen distribution: Properties and estimation. Commun. Stat. Simul. Comput. 2017, 46, 8118–8139. [Google Scholar] [CrossRef]
- Ramos, P.L.; Louzada, F.; Shimizu, T.K.; Luiz, A.O. The inverse weighted lindley distribution: Properties, estimation and an application on a failure time data. Commun. Stat. Theory Methods 2018, 99, 1–20. [Google Scholar] [CrossRef]
- Teimouri, M.; Hoseini, S.M.; Nadarajah, S. Comparison of estimation methods for the Weibull distribution. Statistics 2013, 47, 93–109. [Google Scholar] [CrossRef]
- Fisher, R.A. On the mathematical foundations of theoretical statistics. Philos. Trans. R. Soc. Lond. Ser. Contain. Pap. Math. Phys. Character 1922, 222, 309–368. [Google Scholar]
- Macdonald, P. An estimation procedure for mixtures of distribution. J. R. Stat. Soc. Ser. B 1971, 33, 326–329. [Google Scholar]
- Boos, D.D. Minimum anderson-darling estimation. Commun. Stat. Theory Methods 1982, 11, 2747–2774. [Google Scholar] [CrossRef]
- Stigler, S.M. The epic story of maximum likelihood. Stat. Sci. 2007, 22, 598–620. [Google Scholar] [CrossRef]
- Wolfowitz, J. The minimum distance method. Ann. Math. Stat. 1957, 28, 75–88. [Google Scholar] [CrossRef]
- Cheng, R.; Amin, N. Estimating parameters in continuous univariate distributions with a shifted origin. J. R. Stat. Soc. Ser. B 1983, 45, 394–403. [Google Scholar] [CrossRef]
- Cramér, H. On the composition of elementary errors: First paper: Mathematical deductions. Scand. Actuar. J. 1928, 1928, 13–74. [Google Scholar] [CrossRef]
- Von Mises, R. Statistik und Wahrheit; Julius Springer: Berlin/Heidelberg, Germany, 1928; Volume 20. [Google Scholar]
- Ye, Y.; Lu, G.; Li, Y.; Jin, M. Unilateral right-tail anderson-darling test based spectrum sensing for cognitive radio. Electron. Lett. 2017, 53, 1256–1258. [Google Scholar] [CrossRef]
- R Core Team. R: A Language and Environment for Statistical Computing. (Version 3.3.1); R Foundation for Statistical Computing: Vienna, Austria, 2014. [Google Scholar]
- Henningsen, A.; Toomet, O. Maxlik: A package for maximum likelihood estimation in r. Comput. Stat. 2011, 26, 443–458. [Google Scholar] [CrossRef]
- Finney, D. On the distribution of a variate whose logarithm is normally distributed. Suppl. J. R. Stat. Soc. 1941, 7, 155–161. [Google Scholar] [CrossRef]
- Kahneman, D.; Tversky, A. Variants of uncertainty. Cognition 1982, 11, 143–157. [Google Scholar] [CrossRef]
- Södergren, K.; Palm, J. How organization models impact the governing of industrial symbiosis in public wastewater management. an explorative study in sweden. Water 2021, 13, 824. [Google Scholar] [CrossRef]
- Jain, A.; Ormsbee, L.E. Short-term water demand forecast modeling techniques—Conventional methods versus ai. J. Am. Water Work. Assoc. 2002, 94, 64–72. [Google Scholar] [CrossRef]
- Tu, Z.; Gao, X.; Xu, J.; Sun, W.; Sun, Y.; Su, D. A novel method for regional short-term forecasting of water level. Water 2021, 13, 820. [Google Scholar] [CrossRef]
- Bull, A.T.; Andrews, B.A.; Dorador, C.; Goodfellow, M. Introducing the Atacama Desert; Springer: Berlin/Heidelberg, Germany, 2018. [Google Scholar]
- Grosjean, M.; Veit, H. Water Resources in the Arid Mountains of the Atacama Desert (Northern Chile): Past Climate Changes and Modern Conflicts; Springer: Dordrecht, The Netherlands, 2005. [Google Scholar]
- Donoso, G.; Lictevout, E.; Rinaudo, J.-D. Groundwater management lessons from Chile. In Sustainable Groundwater Management; Springer: Berlin/Heidelberg, Germany, 2020. [Google Scholar]
- Suárez, F.; Muñoz, J.; Fernández, B.; Dorsaz, J.-M.; Hunter, C.K.; Karavitis, C.A.; Gironás, J. Integrated water resource management and energy requirements for water supply in the Copiapó river basin, Chile. Water 2020, 6, 2590. [Google Scholar] [CrossRef]


| Estimation Method | Abbreviation | Created by |
|---|---|---|
| Maximum Likelihood Estimation | MLE | Fisher [25] |
| Ordinary Least-Square Estimate | LSQ | Swain et al. [5] |
| Weighted Least-Square Estimate | WLQ | Swain et al. [5] |
| Maximum Product of Spacings | MPS | Cheng & Amin [6] |
| Cramer–von Mises Estimators | CME | Macdonald [26] |
| Anderson–Darling Estimator | ADE | Boos [27] |
| Right-Tail Anderson–Darling Estimator | RADE | Luceno [8] |
| Month | Min. | 1st Qu. | Median | Mean | 3rd Qu. | Max. | NA’s |
|---|---|---|---|---|---|---|---|
| JAN | 0.02 | 0.06 | 0.31 | 0.5374 | 0.68 | 3.45 | 39 |
| FEB | 0.01 | 0.065 | 0.2 | 0.5165 | 0.6875 | 3.15 | 40 |
| MAR | 0.01 | 0.06 | 0.31 | 0.5449 | 0.85 | 3.24 | 37 |
| APR | 0.03 | 0.08 | 0.27 | 0.4494 | 0.5275 | 2.25 | 36 |
| MAY | 0.03 | 0.12 | 0.29 | 0.7859 | 0.55 | 19.47 | 47 |
| JUN | 0.02 | 0.12 | 0.35 | 0.9106 | 0.62 | 19.01 | 51 |
| JUL | 0.01 | 0.14 | 0.46 | 0.5636 | 0.64 | 2.58 | 53 |
| AUG | 0.01 | 0.1125 | 0.33 | 0.4692 | 0.6175 | 2.23 | 50 |
| SEP | 0.01 | 0.2025 | 0.45 | 0.5356 | 0.6775 | 2.66 | 52 |
| OCT | 0.02 | 0.1 | 0.37 | 0.5229 | 0.77 | 2.46 | 49 |
| NOV | 0.01 | 0.0775 | 0.365 | 0.5536 | 0.855 | 3.36 | 48 |
| DEC | 0.01 | 0.055 | 0.265 | 0.5639 | 0.7975 | 5.04 | 46 |
| CUM Prob. | 1% | 10% | 50% | 99% | 99.99% |
| Flux | 0.0059 | 0.0174 | 0.3396 | 1.5068 | 16.281 |
Publisher’s Note: MDPI stays neutral with regard to jurisdictional claims in published maps and institutional affiliations. |
© 2021 by the authors. Licensee MDPI, Basel, Switzerland. This article is an open access article distributed under the terms and conditions of the Creative Commons Attribution (CC BY) license (https://creativecommons.org/licenses/by/4.0/).
Share and Cite
Nascimento, D.C.d.; Ramos, P.L.; Elal-Olivero, D.; Cortes-Araya, M.; Louzada, F. Generalizing Normality: Different Estimation Methods for Skewed Information. Symmetry 2021, 13, 1067. https://doi.org/10.3390/sym13061067
Nascimento DCd, Ramos PL, Elal-Olivero D, Cortes-Araya M, Louzada F. Generalizing Normality: Different Estimation Methods for Skewed Information. Symmetry. 2021; 13(6):1067. https://doi.org/10.3390/sym13061067
Chicago/Turabian StyleNascimento, Diego Carvalho do, Pedro Luiz Ramos, David Elal-Olivero, Milton Cortes-Araya, and Francisco Louzada. 2021. "Generalizing Normality: Different Estimation Methods for Skewed Information" Symmetry 13, no. 6: 1067. https://doi.org/10.3390/sym13061067
APA StyleNascimento, D. C. d., Ramos, P. L., Elal-Olivero, D., Cortes-Araya, M., & Louzada, F. (2021). Generalizing Normality: Different Estimation Methods for Skewed Information. Symmetry, 13(6), 1067. https://doi.org/10.3390/sym13061067