Abstract
The mustached bat (Pteronotus parnellii) is a mammalian model of cortical hemispheric asymmetry. In this species, complex social vocalizations are processed preferentially in the left Doppler-shifted constant frequency (DSCF) subregion of primary auditory cortex. Like hemispheric specializations for speech and music, this bat brain asymmetry differs between sexes (i.e., males>females) and is linked to spectrotemporal processing based on selectivities to frequency modulations (FMs) with rapid rates (>0.5 kHz/ms). Analyzing responses to the long-duration (>10 ms), slow-rate (<0.5 kHz/ms) FMs to which most DSCF neurons respond may reveal additional neural substrates underlying this asymmetry. Here, we bilaterally recorded responses from 176 DSCF neurons in male and female bats that were elicited by upward and downward FMs fixed at 0.04 kHz/ms and presented at 0–90 dB SPL. In females, we found inter-hemispheric latency differences consistent with applying different temporal windows to precisely integrate spectrotemporal information. In males, we found a substrate for asymmetry less related to spectrotemporal processing than to acoustic energy (i.e., amplitude). These results suggest that in the DSCF area, (1) hemispheric differences in spectrotemporal processing manifest differently between sexes, and (2) cortical asymmetry for social communication is driven by spectrotemporal processing differences and neural selectivities for amplitude.
1. Introduction
A left-hemispheric advantage for receptive language in general and especially speech perception [1,2] is characteristic of the human auditory cortex. Numerous studies of healthy [3,4,5,6,7,8,9] and clinical [10,11,12,13,14,15] human populations report that the left auditory cortex (AC) displays high temporal resolution relative to the right. This enhanced temporal resolution enables left AC to better process speech sounds containing rapid formant transitions, which are comparable to frequency modulations (FMs) [16,17]. Conversely, these [6,7,8,14,17] and other [18,19,20,21,22] studies report that the right AC has enhanced spectral resolution relative to the left. The right AC has a greater contribution to pitch discrimination [14,18,19,21] and musical processing [22,23,24,25] along with the detection of speaker identity and prosodic variation [26,27] than the left due to this higher spectral resolution. Multiple domain-general hypotheses [28,29] attribute these findings to the acoustic uncertainty principle, which states that there is an inverse relationship between temporal and spectral resolution governed by the same mathematics underlying Heisenberg’s quantum uncertainty principle [30,31]. Some caveats to these domain-general explanations include: (1) this asymmetry for speech and language processing is often reported to be less pronounced in females than in males [9,32,33,34,35], and (2) these explanations do not preclude additional perceptual underpinnings for this asymmetry.
Hemispheric specialization for speech and language was traditionally considered to be unique either to humans [36] or to mammals with large brains [37]. However, there is substantial evidence of hemispheric specialization for conspecific communication sounds (i.e., social calls) in relatively large and small non-human primates [38,39,40,41,42,43]. Further, the number of studies reporting hemispheric specialization for social calls across avian [44,45,46,47,48,49] and small mammalian [50,51,52,53] species is growing [54,55,56,57]. Indeed, there is evidence that sea lions [58] and frogs [59] display hemispheric specialization for conspecific social calls. There is even evidence that such lateralization can occur for non-conspecific social communication since domesticated dogs display hemispheric biases for processing human speech [60,61]. Studies of dogs and other domesticated animals report that the right and left hemispheres process vocalizations differently based on their emotional valence and their acoustic structure [62,63]. An increasing number of studies also provide evidence for hemispheric differences in temporal and spectral processing in the non-human mammalian auditory cortex [52,53] or its avian homologues [64,65]. There are even reports of a sex-dependent asymmetry for temporal processing in rodents [66] and other mammals [67].
Processing of social calls in the primary AC (A1) of the mustached bat (Pteronotus parnellii) is known to be lateralized to the left side [50]. Previously, we provided evidence for sex-dependent hemispheric asymmetries for processing constant frequencies (CF or tone-bursts) and FMs in the Doppler-shifted constant frequency (DSCF) processing area [67], a subfield encompassing ~46% of mustached bat A1 [68]. These results must be contextualized within the broader scope of mustached bat echolocation and social communication to fully grasp its implications. During echolocation, mustached bats emit biosonar pulses composed of a fundamental CF, a downward frequency modulation (FM), and three harmonics thereof (Figure 1). Subfields of AC in this species have evolved to extract orientation and environmental information from the pulse, echo, CF (CF1–4), and FM (FM1–4) components of these biosonar signals [69]. For example, neurons in the FM-FM processing area use the delay between the pulse-FM1 and echo-FM2–4 to compute the target range [70,71]. In contrast, neurons in the DSCF area compute relative target velocity [68] and/or aid in maintaining distance from background objects during foraging [72] by firing in response to the returning echo-CF2 but remaining unresponsive to the emitted pulse-CF2. DSCF neural responses are facilitated when CFs in the echo-CF2 range (60–63 kHz in P.p. parnellii [68] and 57.5–60 kHz in P.p. rubiginosus [73]) are paired at the onset with CFs in the pulse-FM1 range (23–27 kHz) [74,75]. Interestingly, neurons in these same subfields also process conspecific social calls during communication [76,77,78,79,80]. The conspecific social calls of mustached bats are characterized by a phonetic-like syntax and have high acoustic complexity relative to the calls of most other mammalian species [81]. Despite their long-established specialization for processing echolocation, neurons in the DSCF area, FM-FM area, and other mustached bat auditory cortical subfields are responsive to complete social calls and their acoustic components. Furthermore, cortical FM-FM neurons are selective for the natural phonetic syntax in social calls [76], and DSCF neurons have a directional preference for upward FMs that exist primarily in social calls [80].
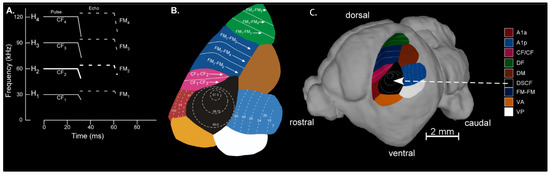
Figure 1.
(A) Schematized spectrogram of the mustached bat’s echolocation signal. H1–4 refers to harmonics 1–4 of the echolocation pulse and/or echo. Note that the H1–4 signal is composed of constant frequency (CF1–4) and frequency-modulated (FM1–4) components present in the pulse and echo (e.g., pulse-FM1 or echo-CF2). (B) The organization of functionally defined subdivisions of the mustached bat auditory cortex. Regions showed here include A1-anterior (A1a), A1-posterior (A1p), CF/CF area, dorsal fringe (DF) area, dorsal medial (DM), Doppler-shifted constant frequency (DSCF), and FM-FM areas. Map of functional areas was adapted from Suga (1985) [69] and Fitzpatrick et al. (1998) [82]. (C) Map of mustached bat auditory cortex superimposed on a lateral view of an MRI-based 3D reconstruction of the bat’s brain. All recordings in the present study were obtained from the DSCF area, which occupies nearly 50% of A1 and represents narrow ranges of frequencies centered around the echo-CF2 (57.5–60 kHz) and pulse-FM1 (23–27 kHz). 3D-rendering adapted from Washington et al. (2018) [83].
Left DSCF neurons are generally more responsive to conspecific mustached bat social calls than those on the right [50]. To understand the neuro-acoustic basis of this finding, we investigated how DSCF neural selectivities for CFs and linear FMs differ between hemispheres, taking into account the sex differences commonly observed in hemispheric asymmetries in songbirds, rodents, and humans [67]. Left DSCF neurons in male bats were generally selective for shorter linear FMs with faster rates and responded to CFs and FMs with shorter latencies than those on the right, suggesting relatively higher temporal resolution amongst left DSCF neurons. Conversely, right DSCF neurons in male bats are selective for FMs with longer durations and relatively narrow bandwidths, suggesting a higher spectral resolution. Left DSCF neurons in female bats selected for shorter FMs and responded to them with shorter latencies than those on the right, but otherwise displayed fewer significant hemispheric differences than males [67]. The evolutionary pressures and underlying mechanisms for this sex difference remain elusive. However, acoustic uncertainty represents a potential evolutionary pressure for the asymmetry amongst DSCF neurons overall [84]. Specifically, the temporal resolution required for DSCF neurons to process mustached bat social calls likely conflicts with the refined spectral resolution they need to calculate Doppler shifts during echolocation. Separating temporally and spectrally refined DSCF neurons into different cerebral hemispheres could alleviate this conflict.
Here, we focus on asymmetrical processing of long, slow (<0.5 kHz/ms) FMs to which neurons in the DSCF areas in both hemispheres are highly responsive [67,80]. These types of FMs are commonly present within CF-like whistling sounds (termed long, quasi-CF or QCFl calls) as well as True CF or TCF call types that are frequently produced by male bats within a colony [81,85]. We, therefore, hypothesized that latencies and other characteristics of DSCF neural responses to slow FMs would differ between hemispheres and/or sexes. To test this hypothesis, we compared DSCF neural responses to linear upward and downward FMs with rates of 0.04 kHz/ms (duration = 131.25 ms; bandwidth = 5.25 kHz) across sound levels (i.e., amplitudes) in both males and females.
2. Methods
2.1. Surgery and Electrophysiological Recordings
The Georgetown University Animal Care and Use Committee (GUACUC Protocol #04-075) approved all methods presented here. These surgical and electrophysiological recording procedures have been described previously [74,79,80]. Six (four male) wild-caught mustached bats (Pteronotus parnellii rubiginosus) were used in these experiments. Bats were housed in one of two humidity (>60%) and temperature (~20–30 °C) controlled flight rooms with dimensions of either 6.6 or 4.3 m2 (ceiling height = 3 m). Bats were fed a daily diet of nutrient-enriched mealworms. Under an anesthesia mixture of isoflurane/air (medical grade, Anaquest, Murray Hill, NJ, USA), we made an incision in the skin along the midline of each bat’s head and glued a 2-mm-diameter metal post caudal to the sagittal-coronal suture intersection. Each bat was allowed >3 days to recover before electrophysiological recordings began. Bats were awake and restrained throughout recordings. Restraints entailed clamping the metal headpost while allowing the body to hang in a Styrofoam mold stabilized by rubber bands in a sound-proof and echo-attenuated chamber (IAC 400A) heated to 31 °C. Bats sat undisturbed in this recording set up for a day or two prior to recording so that they could be acclimated to the experimental environment. Careful to avoid the recording site, we treated the skin and muscle of the wound area with medetomidine (Domitor) during the acclimation period and in subsequent experiments. We used sharpened, vinyl-coated tungsten-microelectrodes (>1 MΩ) to perform electrophysiological recordings from the AC at a depth of 300–650 µm through a small (50µm) hole bored into the skull. We placed another microelectrode (< 1 MΩ) onto the dura mater of a non-auditory region of the cortex to establish a reference for differential recording. Electric signals acquired through the recording electrode were then amplified and band-pass filtered between 300 and 3000 Hz before being converted to digital format via SciWorks 3.0 software (Data Wave, Sequim, WA, USA).
2.2. Acoustic Stimuli
We used constant frequencies (CFs or “tone burst”) and frequency modulations (FMs) to study neural responses within the DSCF processing area of the mustached bat primary auditory cortex (A1). CFs were created using analog function generators. A customized SIGNAL 3.0 script (Engineering Design) was used to generate FMs [86]. All CFs were 30 ms in duration and tapered (0.5 ms) at both ends. FM duration ranged between 0.4 and 131.5 ms and was tapered only when their durations were greater than 2 ms. CFs were presented via loudspeaker, and FMs were presented via the leaf-tweeter speaker.
Constant Frequencies: We first presented CFs to determine the frequencies that elicited peak responses from each neuron in order (A) to determine if the neuron was a DSCF neuron and (B) to determine the best frequency on which to center FMs. We classified a neuron as a “DSCF neuron” if it had a peak response to a CF between 57.5 and 60 kHz (best high frequency, or BFhigh, within the echo-CF2 range), and this peak response was facilitated when paired at the onset with a CF between 23 and 28 kHz (best low frequency, or BFlow, within the pulse-FM1 range). Neurons generally showed only a small response to CFs at BFlow alone, and the facilitation criteria were as described previously [74,75]. CFs in the 57.5–60 kHz ranged paired with those in the 23–28 kHz were presented to facilitate responses per established DSCF neural tuning properties [74,75]. Amplitudes of CFs were also adjusted to obtain the best frequencies at their best amplitudes (BA).
Frequency Modulations: FMs were linear modulations of frequency (f) in the echo-CF2 (57.5–60 kHz) range. We detailed the procedure for studying FM response characteristics elsewhere [80]. Linear FMs are defined by the following four parameters: duration (Δt) in ms, bandwidth (Δf) in kHz, rate of modulation (Δƒ/Δt) in kHz/ms, and the central frequency (f) of an FM in kHz. We generated 14 FM stimuli (or an FM rate array), changed the rates of those FMs between 0.04 and 4.0 kHz/ms, kept FM bandwidth constant at 5.25 kHz, and allowed FM duration to co-vary with rate. Each FM rate array was presented 100 times and had its amplitude decreased by 10 dB SPL every 10 repetitions (i.e., from 90 to 0 dB SPL). All FMs in the rate arrays were paired at the onset with a CF at BFlow in order to facilitate response magnitude. We presented two types of FM arrays, one where all the FMs were upward and a second where all FMs were downward, to determine the FM directional preference for each neuron [86]. The magnitudes of peak responses (10 ms bin) to FMs in the rate array were used as the criterion for determining the “best-FM rate” for a given neuron. Other arrays were generated to assess the “best-FM bandwidth” and “best-FM central frequency” for each neuron [67,80].
The present study focuses primarily on the responses of 176 DSCF neurons (Left Male = 43; Left Female = 40; Right Male = 35; Right Female = 58) to upward and downward FMs within the FM rate array modulated at 0.04 kHz/ms, repeated 100 times, from 0–90 dB SPL. Neural responses of 64 DSCF neurons to 200 repetitions of FMs modulated at 0.04 kHz/ms were also measured. These 64 neurons (Left Male = 4; Left Female = 10; Right Male = 17; Right Female = 33) all had best-FM rates equal to 0.04 kHz/ms and were presented at their respective BAs, best-FM bandwidths, best-FM central frequencies, and best-FM directions. These “best-FMs” were paired at the onset with a 30 ms CF at the BFlow of the respective neuron.
2.3. Data Analysis
Each FM rate array was a series of 14 FM stimuli totaling 3750 ms in duration. Specifically, the FM rate arrays were composed of an initial 250 ms period without a stimulus (“null” stimulus period) in the echo-CF2 range followed by 14 linear FMs (presentation rate 4/s or one presentation every 250 ms) centered on the BFhigh of the neuron under study and increasing in modulation rate from 0.04–4.0 kHz/ms. Here, we extracted and analyzed only neural responses to the 250–500 ms section of each FM rate array. This 250–500 ms section corresponded to the presentation of FMs with modulation rates of 0.04 kHz/ms. Sound-level (i.e., amplitude) decreased by 10 dB SPL every 10 trials (100 trials total). All stimuli in the FM rate array were paired at the onset with a 30 ms CF at the BFlow of the neuron under study. An example of a DSCF neuron’s responses to the14 FM stimuli is provided in Figure 2A. Data corresponding to 0.04 kHz/ms (250–500 ms range) are highlighted to emphasize that this is the focus of the present study. Note that in the expanded view of this range in Figure 2B, the example neuron’s response latency increases as the sound level decreases, a typical “latency shift” common to most auditory neurons [87].
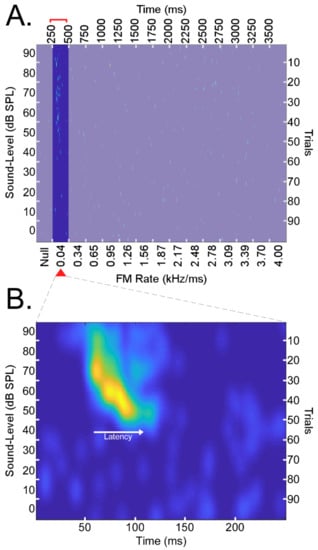
Figure 2.
(A) A matrix of responses to an array of 14 linear FMs presented for 100 trials each (right vertical axis). The presentation rate was 4/s or one presentation every 250 ms for a total of 3750 ms (top horizontal axis). FMs had bandwidths of 5.25 kHz, durations of 131.25 ms, and increased in rate from 0.04 to 4.0 kHz/ms (bottom horizontal axis). The sound level (i.e., amplitude) decreased by 10 dB SPL every 10 trials from 90 to 0 dB SPL (left vertical axis). A 250 ms period with no stimulus (“null”) preceded the presentation of the 14 FM for a series of 15 stimuli total. Presentations of linear FMs were performed in the upward and downward directions such that, for each neuron, there was a matrix of responses to 14 upward FMs and another to 14 downward FMs, both sets repeated 100 times at different sound levels. Rasters shown above correspond to the responses of a right-hemispheric DSCF neuron from a male bat elicited by a series of 14 upward FMs. Above, the 0–250 ms and 500–3750 ms time periods corresponding to the presentation of a “null” stimulus control and FMs with rates >0.04 kHz/ms are deemphasized to highlight this study’s focus on neural responses to the 0.04 kHz/ms FMs presented during the 250–500 ms time period. (B) Spike density function generated by performing a 2D convolution between the 250–500 ms time period of the response matrix in “A” with a rotationally symmetric Gaussian lowpass filter (size = 25 × 25, sigma = 5). Spike density functions were generated for the 250–500 ms time periods for upward and downward FM rate arrays of each of 176 neurons. Spike density functions were then grouped as upward (N = 176), downward (N = 176), left (N = 93), right (N = 83), male (N = 78), and female (N = 98) prior to any analyses.
Single unit recording data were converted from SciWorks to MATLAB format and then sorted into matrices corresponding to responses elicited by either upward or downward FMs (i.e., upward and downward response matrices). Response matrix dimensions were 100 × 250 × 176, corresponding to “number of trials” × “duration in ms” × “number of neurons.” Every 10 trials corresponded to the same sound level, so we grouped the 100 trials into 10 bins corresponding to 10 sound levels (10 × 250 × 176 = sound level × duration × neuron). We generated a rotationally symmetric Gaussian lowpass filter (size = 25 × 25, sigma = 5) and then performed a 2D convolution between the Gaussian filter and the response matrices of each neuron. Convolved response matrices (i.e., spike density functions) were then grouped by hemisphere and sex (Left Male, Left Female, Right Male, and Right Female) and statistically compared via two-sample Kolmogorov–Smirnov goodness-of-fit tests. Absolute maxima in the spike density functions were used to find peak response latencies (duration/time axis), best amplitude (sound level), and response magnitude (firing intensity). Effect sizes for significant findings were assessed using Cohen’s d, which we symbolize here with “|d|” because the directionality of the Cohen’s d statistic is irrelevant for our purposes.
Peak response magnitudes and latencies of DSCF neural responses to “best FMs” were elicited by CFs at BFlow, and best FMs paired at onset (BFlow + best FM) and presented 200 times at BA. Responses to these 200 repetitions of BFlow + best FM were recorded in the form of peri-stimulus time histograms (PSTHs). These histograms, calculated online by summation of spike trains over repeated trials, were used to measure the neuronal response that represents a stimulus-locked change in peak response magnitude and latency. Here, we selected 64 neurons that had best-FMs rates of 0.04 kHz/ms.
3. Results
The data presented here are a reanalyzed subset of previously reported data [67,80]. Our previous results demonstrated that there are sex-dependent hemispheric differences for processing FMs in the DSCF neural population [67]. Thus, we organized our data into four groups (Left Male, Right Male, Left Female, and Right Female) to test a prior hypothesis based on the sex-dependent asymmetries and combined these groups whenever the need to test other related hypotheses arose. Responses to downward and upward FMs were analyzed separately before being analyzed in their “best directions” (i.e., the direction of the FM that elicited the greatest neural response magnitude). Figure 3 displays mean spike density functions for DSCF neural responses elicited by FMs with rates of 0.04 kHz/ms in the upward and downward FM directions in male bats. Figure 4 displays the corresponding data in female bats.
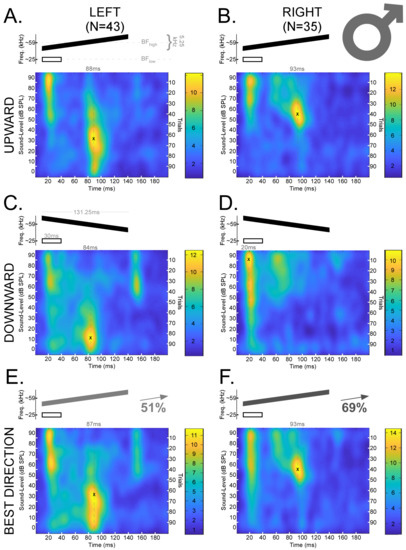
Figure 3.
Mean spike density functions based on DSCF neural responses elicited by 100 trials of FMs with rates of 0.04 kHz/ms presented at 0–90 dB SPL and recorded from male mustached bats. (A) Top: Schematic of an upward FM (black) paired at the onset with a 30 ms CF (white) at BFlow (23–27 kHz). The upward FM had a bandwidth of 5.25 kHz, a duration of 131.25 ms, and a central frequency equal to the BFhigh (57.5–60 kHz) of the individual DSCF neuron under study. The FM and CF had an onset delay of 10 ms. Bottom left: Mean spike density function of DSCF neural responses to FMs with rates of 0.04 kHz/ms in the left hemispheres of male bats (N = 43). “X” marks the location of peak firing (88 ms, 30 dB SPL) in the spike density function, and the hatched line corresponds to the horizontal coordinate. Bottom right: Color bar encoding the firing rate intensity in the spike density function at left. (B) Top: Schematic of a CF and upward FM identical to those depicted in “A.” Bottom left: Mean spike density function of DSCF neural responses to upward FMs with rates of 0.04 kHz/ms in the right hemispheres of male bats (N = 35). “X” marks the location of peak firing (93 ms, 50–60 dB SPL) in the spike density function, and the hatched line corresponds to the horizontal coordinate. Bottom right: Color bar encoding the firing rate intensity in the spike density function at left. (C) Top: Schematic of a downward FM (black) paired at the onset with a 30 ms CF at BFlow (white). All other parameters identical to “A.” Bottom left: Mean spike density function of DSCF neural responses to downward FMs with rates of 0.04 kHz/ms in the left hemispheres of male bats (N = 43). “X” marks the location of peak firing (84 ms, 10 dB SPL) in the spike density function, and the hatched line corresponds to the horizontal coordinate. Bottom right: Color bar encoding the firing rate intensity in the spike density function at left. (D) Top: Schematic of a CF and downward FM identical to those depicted in “C.” Bottom left: Mean spike density function of DSCF neural responses to downward FMs with rates of 0.04 kHz/ms in the right hemispheres of male bats (N = 35). “X” marks the location of peak firing (20 ms, 80–90 dB SPL) in the spike density function, and the hatched line corresponds to the horizontal coordinate. Bottom right: Color bar encoding the firing rate intensity in the spike density function at left. (E) Top: Schematic of an FM (gray or black at 51% opacity) paired at the onset with a 30 ms CF (white) at BFlow (23–27 kHz). Opacity denotes that the “best direction” for 51% of the neurons in this sample (22/43) was upward. Otherwise, stimuli are identical to those depicted in “A” and “C.” Bottom left: Mean spike density function of DSCF neural responses to 0.04 kHz/ms FMs modulated in the “best directions” of each neuron in the left hemispheres of male bats. “X” marks the location of peak firing (87 ms, 30 dB SPL) in the spike density function, and the hatched line corresponds to the horizontal coordinate. Bottom right: Color bar encoding the firing rate intensity in the spike density function at left. (F) Top: Schematic of an FM (gray or black at 69% opacity) paired at the onset with a 30 ms CF (white) at BFlow (23–27 kHz). Opacity denotes that the “best direction” for 69% of the neurons in this sample (24/35) was upward. Otherwise, stimuli are identical to those depicted in “A” and “C.” Bottom left: Mean spike density function of DSCF neural responses to 0.04 kHz/ms FMs modulated in the “best directions” of each neuron in the right hemispheres of male bats. “X” marks the location of peak firing (93 ms, 50–60 dB SPL) in the spike density function, and the hatched line corresponds to the horizontal coordinate. Bottom right: Color bar encoding the firing rate intensity in the spike density function at left. No responses occur in the last 50 ms, so they are omitted to provide greater detail.
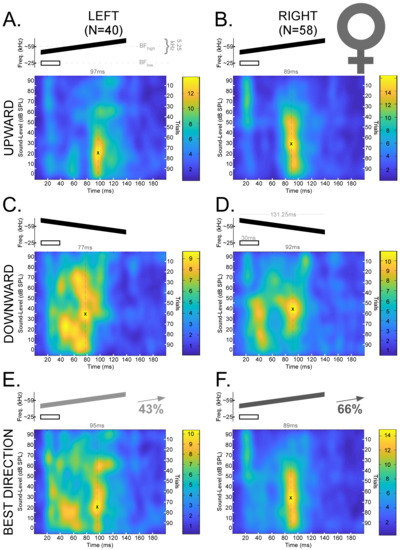
Figure 4.
Mean spike density functions based on DSCF neural responses elicited by 100 trials of FMs with rates of 0.04 kHz/ms presented at 0–90 dB SPL and recorded from female mustached bats. (A) Top: Schematic of an upward FM (black) paired at the onset with a 30 ms CF (white) at BFlow (23–27 kHz). The upward FM had a bandwidth of 5.25 kHz, a duration of 131.25 ms, and a central frequency equal to the BFhigh (57.5–60 kHz) of the individual DSCF neuron under study. The FM and CF had an onset delay of 10 ms. Bottom left: Mean spike density function of DSCF neural responses to FMs with rates of 0.04 kHz/ms in the left hemispheres of female bats (N = 40). “X” marks the location of peak firing (97 ms, 20 dB SPL) in the spike density function, and the hatched line corresponds to the horizontal coordinate. Bottom right: Color bar encoding the firing rate intensity in the spike density function at left. (B) Top: Schematic of a CF and upward FM identical to those depicted in “A.” Bottom left: Mean spike density function of DSCF neural responses to upward FMs with rates of 0.04 kHz/ms in the right hemispheres of female bats (N = 58). “X” marks the location of peak firing (89 ms, 30 dB SPL) in the spike density function, and the hatched line corresponds to the horizontal coordinate. Bottom right: Color bar encoding the firing rate intensity in the spike density function at left. (C) Top: Schematic of a downward FM (black) paired at the onset with a 30 ms CF at BFlow (white). All other parameters identical to “A.” Bottom left: Mean spike density function of DSCF neural responses to downward FMs with rates of 0.04 kHz/ms in the left hemispheres of female bats (N = 40). “X” marks the location of peak firing (77 ms, 30–40 dB SPL) in the spike density function, and the hatched line corresponds to the horizontal coordinate. Bottom right: Color bar encoding the firing rate intensity in the spike density function at left. (D) Top: Schematic of a CF and downward FM identical to those depicted in “C.” Bottom left: Mean spike density function of DSCF neural responses to downward FMs with rates of 0.04 kHz/ms in the right hemispheres of female bats (N = 58). “X” marks the location of peak firing (92 ms, 40 dB SPL) in the spike density function, and the hatched line corresponds to the horizontal coordinate. Bottom right: Color bar encoding the firing rate intensity in the spike density function at left. (E) Top: Schematic of an FM (gray or black at 43% opacity) paired at the onset with a 30 ms CF (white) at BFlow (23–27 kHz). Opacity denotes that the “best direction” for 43% of the neurons in this sample (17/40) was upward. Otherwise, stimuli are identical to those depicted in “A” and “C.” Bottom left: Mean spike density function of DSCF neural responses to 0.04 kHz/ms FMs modulated in the “best directions” of each neuron in the left hemispheres of female bats. “X” marks the location of peak firing (95 ms, 20 dB SPL) in the spike density function, and the hatched line corresponds to the horizontal coordinate. Bottom right: Color bar encoding the firing rate intensity in the spike density function at left. (F) Top: Schematic of an FM (gray or black at 66% opacity) paired at the onset with a 30 ms CF (white) at BFlow (23–27 kHz). Opacity denotes that the “best direction” for 66% of the neurons in this sample (38/58) was upward. Otherwise, stimuli are identical to those depicted in “B” and “D.” Bottom left: Mean spike density function of DSCF neural responses to 0.04 kHz/ms FMs modulated in the “best directions” of each neuron in the right hemispheres of female bats. “X” marks the location of peak firing (89 ms, 30 dB SPL) in the spike density function, and the hatched line corresponds to the horizontal coordinate. Bottom right: Color bar encoding the firing rate intensity in the spike density function at left. No responses occur in the last 50 ms, so they are omitted to provide greater detail.
There were highly sex dependent hemispheric differences in peak response latency. In males, there were no significant hemispheric differences in peak response latency in the upward (D (43,35) = 0.1495, p = n.s.), downward (D (43,35) = 0.1814, p = n.s.), or best (D (43,35) = 0.1761, p = n.s.) FM directions. Likewise, peak response latencies were similar between hemispheres in the downward (D (40,58) = 0.1250, p = n.s.) and best (D (40,58) = 0.2414, p = n.s.) FM directions in females. However, peak response latencies differed between hemispheres in the upward (D (40,58) = 0.3543, p = 0.0037; |d| = 0.5221, medium effect) FM direction in females, such that latencies of responses to upward FMs were shorter on the left (mean ± s.e.m.: 64.37 ms ± 7.45) than on the right (89.94 ms ± 6.59). Across sexes overall, latencies differed between hemispheres in the upward (D (83,93) = 0.2493, p = 0.0068, |d| = 0.3579, small-to-medium effect) but not downward (D (83,93) = 0.0963, p = n.s.) FM direction, such that responses to upward FMs had shorter latencies on the left (57.04 ms ± 4.96) than on the right (74.71 ms ± 5.48). There was a trend toward interhemispheric latency differences for the best FM direction across sexes (D (83,93) = 0.1929, p = 0.0667).
Further, latencies generally differed between sexes. Specifically, latencies of responses in the left hemisphere were shorter in males (48.11 ms ± 5.72) than in females (66.94 ms ± 7.05) in the downward (D (43,40) = 0.3366, p = 0.0135, |d| = 0.4587, small-to-medium effect) FM direction. There was a similar trend in the left hemisphere for the upward (D (43,40) = 0.2640, p = 0.0925) FM direction, indicating a tendency towards shorter latencies in males (50.22 ms ± 6.51) than in females (64.37 ms ± 7.45). Interestingly, there was neither a difference nor a trend for the best (D (43,40) = 0.2355, p = n.s.) FM direction between males (49.38 ms ± 5.74) and females (61.82 ms ± 6.60) in the left hemisphere. In the right hemisphere, there was a trend for the downward (D (43,40) = 0.2714, p = 0.0656) FM direction that likewise indicated a tendency towards shorter latencies in males (58.93 ms ± 8.34) than in females (68.84 ms ± 6.76). However, latencies of responses to upward FMs in the right hemisphere were substantially different between sexes (D (43,40) = 0.5650, p = 7.42 × 10⁻⁷, |d| = 0.8214, large effect), again driven by shorter latencies in males (49.46 ms ± 8.06) than in females (89.94 ms ± 6.59). Likewise, responses to FMs modulated in the neuron’s best (D (43,40) = 0.3414, p = 0.0090, |d| = 0.4666, small-to-medium effect) direction differed in latency between males (55.05 ms ± 8.39) and females (78.38 ms ± 6.59) in the right hemisphere. Overall, latencies differed between sexes in the upward (D (78,98) = 0.4063, p = 6.48 × 10⁻⁷, |d| = 0.6180, medium effect), downward (D (78,98) = 0.2700, p = 0.0027, |d| = 0.3262, small-to-medium effect), and best (D (78,98) = 0.2889, p = 0.0011; |d| = 0.4301, small-to-medium effect) FM directions. These differences were due to males (49.88 ms ± 5.06) having shorter latencies to upward FMs than females (79.50 ms ± 5.08), and males (52.96 ms ± 4.90) likewise had shorter latencies to downward FMs than females (68.06 ms ± 4.91).
There were highly sex dependent hemispheric differences in best amplitude (BA). In males, there were hemispheric differences in BA that were more marked in the upward (D (43,35) = 0.5136, p = 3.83 × 10⁻⁵; |d| = 1.0159, large effect) and best (D (43,35) = 0.4100, p = 0.0020; |d| = 0.7219, medium-to-large effect) FM direction than in the downward (D (43,35) = 0.3063, p = 0.0420; |d| =0.5853, medium effect) direction. Specifically, for the upward FM direction in males, BAs were lower amongst left (38.51 dB SPL ± 3.10) than right (57.04 dB SPL ± 2.58) DSCF neurons. Likewise, BAs were lower amongst left (38.13 dB SPL ± 3.07) than right (50.38 dB SPL ± 3.70) DSCF neurons for the downward FM direction in males. In females, there were trends towards hemispheric differences for BAs in the upward (D (40,58) = 0.2586, p = 0.0698) and downward (D (40,58) = 0.2526, p = 0.0815) FM directions that were significant for the best (D (40,58) = 0.3069, p = 0.0177; |d| = 0.1882, minute-to-small effect) direction. However, in the upward FM direction in females, this trend indicated a tendency for BAs to be greater amongst left (38.02 dB SPL ± 3.36) than right (33.24 dB SPL ± 2.24) DSCF neurons. Likewise, there was a tendency for BAs to be greater amongst left (42.92 dB SPL ± 2.85) than right (38.91 dB SPL ± 2.34) DSCF neurons in the downward FM direction in females. Largely due to these diametrically opposed tendencies between sexes, BAs showed no overall hemispheric differences in either the upward (D (83,93) = 0.1283, p = n.s.), downward (D (83,93) = 0.1347, p = n.s.), or best (D (83,93) = 0.1347, p = n.s.) FM directions.
BAs differed substantially between sexes. BAs were generally greater in males (43.62 dB SPL ± 2.19) than in females (40.55 dB SPL ± 1.81) in the downward (D (78,98) = 0.2449, p = 0.0088, |d| = 0.1882, minute-to-small effect) FM direction. Similarly, BAs were greater in males (46.83 dB SPL ± 2.06) than in females (35.19 dB SPL ± 1.91) in the upward (D (78,98) = 0.2449, p = 3.43 × 10⁻⁴; |d| = 0.5945, medium-to-large effect) FM direction. These same differences were reflected in the BAs for FMs modulated in the best (D (78,98) = 0.2658, p = 0.0033; |d| = 0.3984, small-to-medium effect) direction of each neuron. Separating analyses by hemisphere provided greater detail to the sex-dependent hemispheric differences in BA described above. Specifically, BAs were similar between males (38.13 dB SPL ± 3.07) and females (42.92 dB SPL ± 2.85) in the downward FM direction in the left hemisphere (D (43,40) = 0.2686, p = n.s.). However, BAs were greater between males and females in the downward FM direction in the right hemisphere (D (35,58) = 0.4562, p = 1.2876 × 10⁻⁴;|d| = 0.5899, medium-to-large effect). BAs were similar between males (38.51 dB SPL ± 3.10) and females (38.02 dB SPL ± 3.36) for the upward FM direction in the left hemisphere (D (43,40) = 0.1674, p = n.s.). Again, there was no such similarity in the right hemisphere for upward FMs (D (35,58) = 0.6616, p = 3.0550 × 10⁻⁹; |d| = 1.4495, large-to-huge effect) where BAs were greater in males (50.38 dB SPL ± 3.70) than in females (38.91 dB SPL ± 2.34) for upward FMs. Following from these results, BAs were similar between sexes in the left (D (78,98) = 0.1186, p = n.s.) but not the right (D (78,98) = 0.5700, p = 5.7264 × 10⁻⁷, |d| = 0.9413, large effect) hemisphere when FMs were modulated in the best direction for each neuron. These results underscore that, amongst DSCF neurons, BAs for linear FMs with rates of 0.04 kHz/ms differ between sexes, but these sex differences in BA are largely driven by the right hemisphere.
Figure 3 and Figure 4 reveal latency shifts that coincide with decreases in sound level in the upward FM direction. On average, response latencies increased by nearly 50 ms as the sound level decreased in the upward FM directions in both hemispheres of males and females. However, this latency shift in response to upward FMs occurred at a greater sound level (around 20 dB SPL louder) on the right in males than on the left in males or in either hemisphere in females. This pattern is similar for the downward FM direction in males, though a prominent second response peak is also visible after 150 ms (i.e., a possible offset response) and at 50–70 dB SPL. Changes in sound level for downward FMs yielded a variety of response patterns in the male right hemisphere and bilaterally in females. Right-hemispheric responses to downward FMs in males did not shift in latency, despite decreases in sound level, and these responses largely ceased for sound levels <40 dB SPL. Unlike the other groups, the average peak response to downward FMs amongst right-hemispheric neurons in males occurred at the highest sound levels and near stimulus onset (20 ms or 10 ms post-stimulus onset). Left and right-hemispheric responses to downward FMs in females were characterized by a quasi-tonic firing pattern most prominent at lower sound levels (≤40 dB SPL).
Previous research established that DSCF neurons are generally more responsive to upward than to downward FMs when the FMs were optimized for rate, bandwidth, central frequency, and BA [80]. In our sample, 101/176 (57%) DSCF neurons had greater responses to upward than to downward FMs when FM rates were all equal to 0.04 kHz/ms and the sound level changed by 10 dB SPL every 10 out of 100 trials. In males, maximal responses to FMs with rates of 0.04 kHz/ms were found in the upward direction in 51% (22/43) of left-hemispheric and 69% (24/35) of right-hemispheric neurons. In females, maximal responses to FMs with these same rates were found in the upward direction in 42.5% (17/40) of left-hemispheric and 66% (38/58) of right-hemispheric neurons. As stated above, previous research employed more optimal measures to assess the general directional preference of DSCF neurons and thus provides a better guide to this filter property. Nonetheless, these results show that a general upward FM directional preference in DSCF neurons is present even when assessed using FM stimuli not optimized for rate, BA, and other FM parameters.
Lastly, we selected 64 DSCF neurons with best-FM rates of 0.04 kHz/ms and measured their responses to 200 presentations of their best-FMs (optimized for rate, bandwidth, central frequency, and direction) at BA (Figure 5). This relatively small number of neurons (Left Male = 4; Left Female = 10; Right Male = 17; Right Female = 33) yielded no significant differences when compared across hemispheres and sexes via two-sample Kolmogorov–Smirnov tests. However, descriptive statistics reveal notable patterns across hemispheres and sexes. In males, latencies of responses to best-FMs with rates of 0.04 kHz/ms tended to be shorter on the left (14.75 ms ± 2.21) than on the right (31.68ms ± 6.08), and BAs tended to be greater on the right (74.71 dB SPL ± 3.11) than on the left (22.5 dB SPL ± 7.5). In females, response latencies were closer in time between hemispheres but still tended to be shorter on the left (22.00 ms ± 4.89) than on the right (31.38 ms ± 5.26). Further, in females, BAs were also closer in loudness between hemispheres, tending to be slightly greater on the left (44.00 dB SPL ± 5.42) than on the right (38.48 dB SPL ± 3.70).
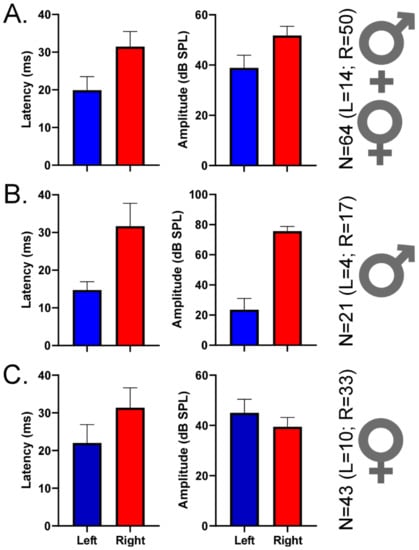
Figure 5.
Mean peak response latencies and best amplitudes (BAs) of DSCF neurons selective for 0.04 kHz/ms. (A) Mean (± standard error of the mean) latencies (left column) and BAs (right column) of DSCF neuronal responses recorded from 64 neurons in male and female bats and elicited by 200 repetitions of their “best FMs” (optimized for BA, FM rate, FM bandwidth, FM central frequency, and FM direction). Recordings were from left (blue, N = 14) and right (red, N = 50). In this 64-neuron sample, 57.14% (8/14) of best FM directions for the left DSCF neurons and 64% (32/50) of best FM directions for the right DSCF neurons were upward. (B) Same depiction as “A” for responses recorded from 21 DSCF neurons (left, N = 4; right, N = 17) in male bats. In this 21-neuron sample, 50% (2/4) of best FM directions for the left DSCF neurons and 82.35% (14/17) of best FM directions for the right DSCF neurons were upward. (C) Same depiction as “A” for responses recorded from 43 DSCF neurons (left, N = 10; right, N = 33) in female bats. In this 43-neuron sample, 60% (6/10) of best FM directions for the left DSCF neurons and 54.54% (18/33) of best FM directions for the right DSCF neurons were upward. The lower number of left DSCF neurons across this sample reflects an earlier finding that, when presented with FM rates ranging from 0.04 to 4.0 kHz/ms, right DSCF neurons (especially in males) are far more likely to respond maximally to 0.04 kHz/ms than those on the left [67].
4. Discussion
Slow linear FMs (rate = 0.04 kHz/ms; bandwidth = 5.25 kHz; duration = 131.25 ms) when presented at sound levels ranging from 0 to 90 dB SPL (in 10 dB SPL attenuation steps) revealed sex-dependent hemispheric asymmetries in DSCF neural peak response latency and best amplitude (BA). Two results support our hypothesis that DSCF neural responses to slow linear FMs differ by hemisphere and sex. First, left DSCF neurons responded to slow, upward FMs with shorter latencies than right DSCF neurons, particularly in females. Second, BAs of right DSCF neurons responding to slow upward and downward FMs were greater than those of left DSCF neurons in males but not females. In other words, in males, DSCF neurons respond at their peak firing rates to quieter FM sounds on the left compared to the right. Furthermore, right DSCF neurons in males have higher minimum thresholds for slow upward and downward FMs than left DSCF neurons. With respect to sex differences, peak response latencies to both upward and downward FMs were generally shorter in males when compared to females. These results from 176 DSCF neurons are largely corroborated by responses from a subset of 64 DSCF neurons selective for FM rates of 0.04 kHz/ms elicited by 200 repetitions of optimized FM stimuli (i.e., best FM rate, bandwidth, center frequency, and direction) presented at BA.
Here, we reported results for the upward, downward, and best FM directions to provide greater detail and a wider scope. Though some results were more significant for downward FMs (e.g., shorter response latencies in males than in females for downward but not upward FMs), the majority of our findings were either significant for both FM directions or more significant for upward FMs. This aspect is critical to the interpretation of our results because DSCF neurons, in general, prefer (i.e., respond with greater magnitude to) upward FMs [80], and the data presented here reflects that same directional preference. Best FM results largely reflected those of the upward FM direction combined with some aspects of the downward direction.
The hemispheric differences in peak response latency primarily observed in female bats exist in the absence of any significant differences in BA. Hemispheric differences in temporal and spectral resolution, hypothesized to underlie speech and music processing in the human auditory cortex [28,29], operationally match those hypothesized to underlie social communication and echolocation in the DSCF area [50,67,84]. Though not direct evidence for this assertion, a longer peak response latency to a slowly modulated, long-duration FM signal could be elicited from a neuron tuned to a specific, narrow frequency band contained within the FM or a short segment of the FM itself, suggesting a relatively longer temporal integration window (i.e., low temporal resolution coinciding with high spectral resolution). Conversely, a shorter latency in response to a long, slow FM signal could be elicited from a neuron tuned to a broader range of frequencies contained within the FM, with earlier firing resulting from faster integration times (i.e., low spectral resolution but with a high temporal resolution, allowing the neuron to follow frequency changes across shorter time windows than those possible on the right).
Previous research suggests that interhemispheric temporal versus spectral processing differences in mustached bats [67], rodents [66], and humans [9] would either be more pronounced in males or similar between the sexes. A closer examination of previous sex-dependent asymmetry results in the DSCF area in the mustached bat, however, provides additional details. Left DSCF neurons in males are selective for FMs with faster rates and shorter durations than their right-hemispheric homologues or either hemisphere in females [67]. In females, whereas left DSCF neurons were selective for FMs with shorter durations than their right-hemispheric homologues, they had no significant hemispheric differences in FM rate selectivity. Despite these sex-dependent hemispheric differences in FM selectivity, left DSCF neurons responded to their best FMs (i.e., optimized for rate, bandwidth, central frequency, direction, and BA) nearly 10 ms faster than right DSCF neurons in both sexes. As reported here, peak response latencies were generally longer for females than males. These results, when contextualized by previous results, suggest that interhemispheric spectral versus temporal processing differences are present yet manifest differently within both sexes. Specifically, in males, the left-hemispheric advantage for temporal processing amongst DSCF neurons manifests as an enhanced ability to detect and quickly respond to short duration, rapidly changing FMs relative to those on the right. In females, on the other hand, a left-hemispheric temporal processing advantage results in earlier responses to FMs with slow-to-moderate rates relative to the right as opposed to selectivity for faster FM rates. Thus, hemispheric differences in peak response latency to best-FMs would appear similar in both sexes with potentially longer latencies in females overall, as reported previously [67].
The amplitude-related asymmetry observed amongst DSCF neurons in males, on the other hand, does not conform as elegantly to the theoretical framework of spectral versus temporal processing. Hemispheric differences in neural selectivity for amplitude (dB SPL) can be restated as hemispheric differences in acoustical energy or power (i.e., energy per unit time). In other words, right DSCF neurons in males required greater acoustic energy to respond to long-duration FMs with slow rates than did those on the left. This point is made even clearer when observing “latency shifts” within the recorded population of DSCF neurons. With the rare exception of auditory neurons that display “paradoxical latency shifts,” neurons throughout the auditory system typically increase their latencies as the sound level (i.e., intensity or loudness) decreases [87]. Such latency shifts are observed in both hemispheres and sexes, especially in the upward FM direction. Our group analyses, however, demonstrate that the latency shifts that commonly accompany decreasing amplitude in auditory neurons are evident even after relatively slight amplitude decreases amongst right DSCF neurons in males. These high amplitude latency shifts likely explain why there are hemispheric differences in peak response latencies in males for the subset of DSCF neurons selective for 0.04 kHz/ms (N = 21 in males), to which we presented best FMs 200 times at BA, but not in the larger population (N = 78), where we presented FMs with rates of 0.04 kHz/ms across sound levels from 0 to 90 dB SPL.
The results above add new details to the previously reported hemispheric differences for processing social calls in the DSCF area of the mustached bat auditory cortex [50]. Comparisons between social calls and pulse–echo CF pairs revealed that left DSCF neurons responded equally well to both stimulus types, whereas right DSCF neurons were more responsive to pulse–echo CF pairs than to social calls. Subsequent comparisons between CF pairs and linear FMs revealed that right DSCF neurons only responded to CFs and relatively slow FM rates (<0.5 kHz/ms), left DSCF neurons responded to CFs and a wider range of FM rates, and this hemispheric difference appeared to be more pronounced in males than in females [67].
Most mustached bat social calls often contain FMs with rapid rates, so a lack of the right DSCF neural responses to many social calls is in accordance with their general lack of responses to rapid FMs. The robust responses of DSCF neurons in both hemispheres to slow FM rates (0.04 kHz/ms) of upward FMs also does not correspond to the gradually increasing Doppler shifts (<0.01 kHz/ms) of the CF in echoes returning from approaching targets (Mueller and Kanwal, unpublished). CF and quasi-CF calls emitted by mustached bats, however, do contain slow modulations near 0.04 kHz/ms in the echo-CF2 range [81]. Further, CF and quasi-CF calls, particularly the QCFl call, are frequently emitted by males during their affiliative interactions between other males and females [85]. Our results of shorter peak response latencies and lower BAs for slow FMs on the left, therefore, support the left-hemispheric specialization for processing social calls [50] though sex differences in call processing need further investigation. We propose that studies of hemispheric specialization for social calls in mammals, typically restricted to tests at single sound levels, could benefit from testing wider amplitude ranges and FM rates present in conspecific social calls. Future investigations can also help determine whether the amplitude-related asymmetry observed here is a direct consequence of an asymmetry for spectral versus temporal processing or whether they are independent aspects of auditory processing asymmetries in highly social and vocal species, including humans.
One potential limitation to our study is that functional hemispheric asymmetries, in general, can be modulated over time by stress [88,89]. Such stress-related changes on functional hemispheric asymmetries have been found in classes as diverse as Chondrichthyes, Osteichthyes, amphibians, aves, and mammals (humans included). The influence of stress on functional hemispheric asymmetries can be attributed either to steroid hormones (e.g., androgens, estrogens, progestogens, glucocorticoids, and mineralocorticoids), hemispheric differences in emotional processing, or an interaction thereof. For instance, it has been suggested that the regulation of cortisol secretion during stress is regulated by right-hemispheric neural circuitry [90]. Further, the relationship between stress and functional hemispheric asymmetries may also depend on the developmental stage along with the type of stressor and its duration [91]. Experimental conditions such as those used in highly invasive techniques such as single-unit recording or even non-invasive techniques predicated on confined environments such as fMRI have the potential to induce stress. Certain functional hemispheric asymmetries in mustached bats reported above and previously [67] are highly sex-dependent, suggesting that such asymmetries are subject to changes in sex hormones. It is thus likely that other steroid hormones, such as those regulated by stress, would similarly impact the cortical asymmetries observed in mustached bats. The mustached bats used in our study were free to fly and socialize in a temperature and humidity-controlled environment that simulates the caves they naturally inhabit. Nonetheless, keeping these bats in a confined environment may have caused them stress and influenced their hemispheric differences in a multitude of ways. Thus, designing experiments to assess the influence of stress on hemispheric asymmetries for processing social calls in mustached bats represents a key future direction.
It is important to contextualize these and previous findings in mustached bats with hemispheric specializations reported in other species. One classic paper employed cladographic comparisons to identify vertebrate orders for which there is evidence supporting or negating lateralization of conspecific social call production and/or perception [57]. This extensive review details evidence from the literature supporting hemispheric specialization for conspecific social calls in species as diverse as fish, frogs, songbirds, parrots, eagles, horses, dogs, seals, rodents, and primates. Interestingly, based on the literature at the time of its publication, this review stated that “no general left-hemispheric dominance for the auditory perception of conspecific vocalization comparable to humans exists in bats…”, apparently because a stereological study of Nissl-stained cells failed to find hemispheric differences between the left and right DSCF areas [92]. This conclusion was revised after two neurophysiological studies revealed functional hemispheric differences in the processing of social calls vs. echolocation signals [50] and linear FMs [67] in that same area.
Despite their exclusion from that cladographic analysis, mustached bats have much to offer the field of comparative cortical lateralization for social communication. First, the auditory cortices of mustached bats have evolved to process both their stereotypic biosonar signals during echolocation [68,69,70,71,93] and also to process their acoustically diverse social calls [76,77,78,79,80]. Thus, maps of the mustached bat auditory cortex reflect the stereotypic nature of their biosonar signals, making it one of the best-established auditory cortex maps amongst all mammals studied to date. Second, central and peripheral auditory structures evolved to be hypertrophic in mustached bats [83] and other high-duty cycle (i.e., CF-FM) chiroptera [94], making them relatively easy to probe and/or image. Third, the review described above advocates for neuroimaging (e.g., fMRI) approaches to studying hemispheric specialization for audiovocal communication in animals. Here, mustached bats have the advantage that the acoustic frequencies of MRI scanner noise largely fall below this species’ range of hearing [95]. Thus, the results presented above and previous findings suggest that mustached bats have much to offer from their unique position amongst animal models of hemispheric specialization for auditory social communication.
Author Contributions
Conceptualization: S.D.W., D.L.P., G.A.K., and J.S.K.; Methodology: S.D.W., D.L.P., and J.S.K.; Software: S.D.W., D.L.P., and G.A.K.; Validation: S.D.W.; Formal Analysis: S.D.W. and D.L.P.; Investigation: S.D.W.; Resources: J.S.K.; Data Curation: S.D.W., G.A.K., J.S.K.; Writing—Original Draft Preparation: S.D.W.; Writing—Review and Editing: S.D.W., D.L.P., G.A.K., and J.S.K.; Visualization: S.D.W., D.L.P., and J.S.K.; Supervision: D.L.P., G.A.K., and J.S.K.; Project Administration: J.S.K.; Funding Acquisition: S.D.W. and J.S.K. All authors have read and agreed to the published version of the manuscript.
Funding
This work was supported in part by the National Institutes of Health Grants DC02054 and DC008822 (to J.S. Kanwal), DC75763 (to S.D. Washington), HD046388 (to V. Gallo), and an Erasmus Mundus Auditory Cognitive Exchange Program Fellowship (to S.D. Washington). This project was also supported in part by the NIH/NIMHD U54MD007597 grant and the NIH/HICHD P50HD105328 grant.
Data Availability Statement
The data presented in this study are available on request from the corresponding author.
Acknowledgments
The Ministry of Agriculture, Land and Marine Resources in Trinidad kindly permitted us to export mustached bats, and F. Muradali assisted with collection and exportation procedures. We thank Gerd Schüller and Leon Der for the design and fabrication of the stereotaxic recording setup. We also thank Tsang-Wei Tu, Annemie Van der Linden, Marleen Verhoye, and Paul Wang for supporting our work on this manuscript.
Conflicts of Interest
The authors declare no conflict of interest.
References
- Wernicke, K. Der Aphasische Symptomencomplex: Eine Psychologische Studie auf Anatomischer Basis Breslau; Crohn, M., Ed.; Cohn Weigert: Breslau, Poland, 1874; Available online: https://wellcomecollection.org/works/dwv5w9rw (accessed on 15 February 2021).
- Robson, H.; Sage, K.; Ralph, M.A.L. Wernicke’s aphasia reflects a combination of acoustic-phonological and semantic control deficits: A case-series comparison of Wernicke’s aphasia, semantic dementia and semantic aphasia. Neuropsychologia 2012, 50, 266–275. [Google Scholar] [CrossRef]
- Belin, P.; Zilbovicius, M.; Crozier, S.; Thivard, L.; Fontaine, A.A.; Masure, M.-C.; Samson, Y. Lateralization of Speech and Auditory Temporal Processing. J. Cogn. Neurosci. 1998, 10, 536–540. [Google Scholar] [CrossRef]
- Mäkelä, A.M.; Alku, P.; May, P.; Mäkinen, V.; Tiitinen, H. Left-hemispheric brain activity reflects formant transitions in speech sounds. Neuro Rep. 2005, 16, 549–553. [Google Scholar] [CrossRef]
- Schwartz, J.; Tallal, P. Rate of acoustic change may underlie hemispheric specialization for speech perception. Science 1980, 207, 1380–1381. [Google Scholar] [CrossRef] [PubMed]
- Flinker, A.; Doyle, W.K.; Mehta, A.D.; Devinsky, O.; Poeppel, D. Spectrotemporal modulation provides a unifying framework for auditory cortical asymmetries. Nat. Hum. Behav. 2019, 3, 393–405. [Google Scholar] [CrossRef] [PubMed]
- Boemio, A.; Fromm, S.J.; Braun, A.R.; Poeppel, D. Hierarchical and asymmetric temporal sensitivity in human auditory cortices. Nat. Neurosci. 2005, 8, 389–395. [Google Scholar] [CrossRef] [PubMed]
- Schönwiesner, M.; Rübsamen, R.; Von Cramon, D.Y. Hemispheric asymmetry for spectral and temporal processing in the human antero-lateral auditory belt cortex. Eur. J. Neurosci. 2005, 22, 1521–1528. [Google Scholar] [CrossRef] [PubMed]
- Brown, C.P.; Fitch, R.H.; Tallal, P. Sex and Hemispheric Differences for Rapid Auditory Processing in Normal Adults. Laterality Asymmetries Body Brain Cogn. 1999, 4, 39–50. [Google Scholar] [CrossRef] [PubMed]
- Divenyi, P.L.; Robinson, A.J. Nonlinguistic auditory capabilities in aphasia. Brain Lang. 1989, 37, 290–326. [Google Scholar] [CrossRef]
- Merzenich, M.M.; Jenkins, W.M.; Johnston, P.; Schreiner, C.; Miller, S.L.; Tallal, P. Temporal Processing Deficits of Language-Learning Impaired Children Ameliorated by Training. Science 1996, 271, 77–81. [Google Scholar] [CrossRef]
- Tallal, P.; Miller, S.; Fitch, R.H. Neurobiological Basis of Speech: A Case for the Preeminence of Temporal Processing. Ann. N. Y. Acad. Sci. 1993, 682, 27–47. [Google Scholar] [CrossRef] [PubMed]
- Temple, E.; Poldrack, R.A.; Protopapas, A.; Nagarajan, S.; Salz, T.; Tallal, P.; Merzenich, M.M.; Gabrieli, J.D.E. Disruption of the neural response to rapid acoustic stimuli in dyslexia: Evidence from functional MRI. Proc. Natl. Acad. Sci. USA 2000, 97, 13907–13912. [Google Scholar] [CrossRef] [PubMed]
- Robin, D.A.; Tranel, D.; Damasio, H. Auditory perception of temporal and spectral events in patients with focal left and right cerebral lesions. Brain Lang. 1990, 39, 539–555. [Google Scholar] [CrossRef]
- Efron, R. Temporal Perception, Aphasia and D’ej’a Vu. Brain 1963, 86, 403–424. [Google Scholar] [CrossRef]
- Jamison, H.L.; Watkins, K.E.; Bishop, D.; Matthews, P.M. Hemispheric Specialization for Processing Auditory Nonspeech Stimuli. Cereb. Cortex 2005, 16, 1266–1275. [Google Scholar] [CrossRef]
- Zatorre, R.J.; Belin, P. Spectral and temporal processing in human auditory cortex. Cereb. Cortex 2001, 11, 946–953. [Google Scholar] [CrossRef]
- Sidtis, J.J. On the nature of the cortical function underlying right hemisphere auditory perception. Neuropsychologia 1980, 18, 321–330. [Google Scholar] [CrossRef]
- Sidtis, J.J. The complex tone test: Implications for the assessment of auditory laterality effects. Neuropsychologia 1981, 19, 103–112. [Google Scholar] [CrossRef]
- Samson, S.; Zatorre, R.J. Melodic and harmonic discrimination following unilateral cerebral excision. Brain Cogn. 1988, 7, 348–360. [Google Scholar] [CrossRef]
- Zatorre, R.J. Pitch perception of complex tones and human temporal-lobe function. J. Acoust. Soc. Am. 1988, 84, 566–572. [Google Scholar] [CrossRef]
- Zatorre, R.J. Discrimination and recognition of tonal melodies after unilateral cerebral excisions. Neuropsychologia 1985, 23, 31–41. [Google Scholar] [CrossRef]
- Samson, S.; Zatorre, R.J. Contribution of the right temporal lobe to musical timbre discrimination. Neuropsychologia 1994, 32, 231–240. [Google Scholar] [CrossRef]
- Zatorre, R.J.; Evans, A.C.; Meyer, E. Neural mechanisms underlying melodic perception and memory for pitch. J. Neurosci. 1994, 14, 1908–1919. [Google Scholar] [CrossRef]
- Milner, B. Laterality effects in audition. In Interhemispheric Relations and Cerebral Dominance; Mountcastle, V.B., Ed.; Johns Hopkins Press: Baltimore, MD, USA, 1962; pp. 177–195. [Google Scholar]
- Robinson, T.; Fallside, F. A recurrent error propagation network speech recognition system. Comput. Speech Lang. 1991, 5, 259–274. [Google Scholar] [CrossRef]
- Lakshminarayanan, K.; Ben Shalom, D.; van Wassenhove, V.; Orbelo, D.; Houde, J.; Poeppel, D. The effect of spectral manipulations on the identification of affective and linguistic prosody. Brain Lang. 2003, 84, 250–263. [Google Scholar] [CrossRef]
- Zatorre, R.J.; Belin, P.; Penhune, V.B. Structure and function of auditory cortex: Music and speech. Trends Cogn. Sci. 2002, 6, 37–46. [Google Scholar] [CrossRef]
- Poeppel, D. The analysis of speech in different temporal integration windows: Cerebral lateralization as ‘asymmetric sampling in time’. Speech Commun. 2003, 41, 245–255. [Google Scholar] [CrossRef]
- Joos, M. Acoustic Phonetics; Linguistic Society of America: Baltimore, MD, USA, 1948; 136p. [Google Scholar]
- Schuller, B.; Batliner, A. Computational Paralinguistics: Emotion, Affect and Personality in Speech and Language Processing, 1st ed.; John Wiley and Sons, Ltd.: West Sussex, UK, 2014; p. 344. [Google Scholar]
- Lansdell, H. Sex Differences in Hemispheric Asymmetries of the Human Brain. Nat. Cell Biol. 1964, 203, 550. [Google Scholar] [CrossRef] [PubMed]
- McGlone, J. Sex Differences in the Cerebral Organization of Verbal Functions in Patients with Unilateral Brain Lesions. Brain 1977, 100, 775–793. [Google Scholar] [CrossRef] [PubMed]
- Shaywitz, B.A.; Shaywltz, S.E.; Pugh, K.R.; Constable, R.T.; Skudlarski, P.; Fulbright, R.K.; Bronen, R.A.; Fletcher, J.M.; Shankweiler, D.P.; Katz, L.; et al. Sex differences in the functional organization of the brain for language. Nat. Cell Biol. 1995, 373, 607–609. [Google Scholar] [CrossRef]
- Evans, T.M.; Flowers, D.L.; Napoliello, E.M.; Eden, G.F. Sex-specific gray matter volume differences in females with developmental dyslexia. Brain Struct. Funct. 2013, 219, 1041–1054. [Google Scholar] [CrossRef] [PubMed][Green Version]
- Liberman, A.; Mattingly, I. A specialization for speech perception. Science 1989, 243, 489–494. [Google Scholar] [CrossRef]
- Ringo, J.L.; Doty, R.W.; Demeter, S.; Simard, P.Y. Time Is of the Essence: A Conjecture that Hemispheric Specialization Arises from Interhemispheric Conduction Delay. Cereb. Cortex 1994, 4, 331–343. [Google Scholar] [CrossRef]
- Poremba, A.; Malloy, M.; Saunders, R.C.; Carson, R.E.; Herscovitch, P.; Mishkin, M. Species-specific calls evoke asymmetric activity in the monkey’s temporal poles. Nature 2004, 427, 448–451. [Google Scholar] [CrossRef]
- Heffner, H.E.; Heffner, R.S. Temporal lobe lesions and perception of species-specific vocalizations by Macaques. Science 1984, 226, 75–76. [Google Scholar] [CrossRef] [PubMed]
- Heffner, E.H.; Heffner, R.S.; Hefner, H.E. Effect of unilateral and bilateral auditory cortex lesions on the discrimination of vocalizations by Japanese macaques. J. Neurophysiol. 1986, 56, 683–701. [Google Scholar] [CrossRef]
- Hook, M.; Rogers, L. Lateralized use of the mouth in production of vocalizations by marmosets. Neuropsychologia 1998, 36, 1265–1273. [Google Scholar] [CrossRef]
- Gannon, P.J.; Holloway, R.L.; Broadfield, D.C.; Braun, A.R. Asymmetry of Chimpanzee Planum Temporale: Humanlike Pattern of Wernicke’s Brain Language Area Homolog. Science 1998, 279, 220–222. [Google Scholar] [CrossRef] [PubMed]
- Poremba, A.; Mishkin, M. Exploring the extent and function of higher-order auditory cortex in rhesus monkeys. Hear. Res. 2007, 229, 14–23. [Google Scholar] [CrossRef][Green Version]
- Voss, H.U.; Tabelow, K.; Polzehl, J.; Tchernichovski, O.; Maul, K.K.; Salgado-Commissariat, D.; Ballon, D.; Helekar, S.A. Functional MRI of the zebra finch brain during song stimulation suggests a lateralized response topography. Proc. Natl. Acad. Sci. USA 2007, 104, 10667–10672. [Google Scholar] [CrossRef]
- Poirier, C.; Boumans, T.; Verhoye, M.; Balthazart, J.; Van Der Linden, A. Own-Song Recognition in the Songbird Auditory Pathway: Selectivity and Lateralization. J. Neurosci. 2009, 29, 2252–2258. [Google Scholar] [CrossRef] [PubMed]
- Nottebohm, F.; Arnold, A.P. Sexual dimorphism in vocal control areas of the songbird brain. Science 1976, 194, 211–213. [Google Scholar] [CrossRef] [PubMed]
- DeVoogd, T.J.; Nottebohm, F. Sex differences in dendritic morphology of a song control nucleus in the canary: A quantitative Golgi study. J. Comp. Neurol. 1981, 196, 309–316. [Google Scholar] [CrossRef]
- Phan, M.; Vicario, D.S. Hemispheric differences in processing of vocalizations depend on early experience. Proc. Natl. Acad. Sci. USA 2010, 107, 2301–2306. [Google Scholar] [CrossRef]
- George, I.; Cousillas, H.; Richard, J.-P.; Hausberger, M. State-dependent hemispheric specialization in the songbird brain. J. Comp. Neurol. 2005, 488, 48–60. [Google Scholar] [CrossRef]
- Kanwal, J.S. Right-left asymmetry in the cortical processing of sounds for social communication vs. navigation in mustached bats. Eur. J. Neurosci. 2011, 35, 257–270. [Google Scholar] [CrossRef]
- Ehret, G. Left hemisphere advantage in the mouse brain for recognizing ultrasonic communication calls. Nat. Cell Biol. 1987, 325, 249–251. [Google Scholar] [CrossRef] [PubMed]
- Levy, R.B.; Marquarding, T.; Reid, A.P.; Pun, C.M.; Renier, N.; Oviedo, H.V. Circuit asymmetries underlie functional lateralization in the mouse auditory cortex. Nat. Commun. 2019, 10, 2783. [Google Scholar] [CrossRef] [PubMed]
- Wetzel, W.; Ohl, F.W.; Scheich, H. Global versus local processing of frequency-modulated tones in gerbils: An animal model of lateralized auditory cortex functions. Proc. Natl. Acad. Sci. USA 2008, 105, 6753–6758. [Google Scholar] [CrossRef]
- Güntürkün, O.; Ströckens, F.; Ocklenburg, S. Brain Lateralization: A Comparative Perspective. Physiol. Rev. 2020, 100, 1019–1063. [Google Scholar] [CrossRef]
- Tallal, P. Of bats and men. J. Neurophysiol. 2012, 108, 1545–1547. [Google Scholar] [CrossRef]
- Andics, A.; Miklósi, Á. Neural processes of vocal social perception: Dog-human comparative fMRI studies. Neurosci. Biobehav. Rev. 2018, 85, 54–64. [Google Scholar] [CrossRef] [PubMed]
- Ocklenburg, S.; Ströckens, F.; Güntürkün, O. Lateralisation of conspecific vocalisation in non-human vertebrates. Laterality Asymmetries Body Brain Cogn. 2013, 18, 1–31. [Google Scholar] [CrossRef] [PubMed]
- Boye, M.; Güntürkün, O.; Vauclair, J. Right ear advantage for conspecific calls in adults and subadults, but not infants, California sea lions (Zalophus californianus): Hemispheric specialization for communication? Eur. J. Neurosci. 2005, 21, 1727–1732. [Google Scholar] [CrossRef] [PubMed]
- Bauer, R.H. Lateralization of neural control for vocalization by the frog (Rana pipiens). Psychobiology 1993, 21, 243–248. [Google Scholar] [CrossRef]
- Andics, A.; Gábor, A.; Gácsi, M.; Faragó, T.; Szabó, D.; Miklósi, Á. Neural mechanisms for lexical processing in dogs. Science 2016, 353, 1030–1032. [Google Scholar] [CrossRef]
- Andics, A.; Gácsi, M.; Faragó, T.; Kis, A.; Miklósi, Á. Voice-Sensitive Regions in the Dog and Human Brain Are Revealed by Comparative fMRI. Curr. Biol. 2014, 24, 574–578. [Google Scholar] [CrossRef]
- Siniscalchi, M.; D’Ingeo, S.; Quaranta, A. Lateralized emotional functioning in domestic animals. Appl. Anim. Behav. Sci. 2021, 237, 105282. [Google Scholar] [CrossRef]
- Smith, A.V.; Proops, L.; Grounds, K.; Wathan, J.; Scott, S.K.; McComb, K. Domestic horses (Equus caballus) discriminate between negative and positive human nonverbal vocalisations. Sci. Rep. 2018, 8, 13052. [Google Scholar] [CrossRef]
- Van Ruijssevelt, L.; Washington, S.D.; Hamaide, J.; Verhoye, M.; Keliris, G.A.; Van Der Linden, A. Song Processing in the Zebra Finch Auditory Forebrain Reflects Asymmetric Sensitivity to Temporal and Spectral Structure. Front. Neurosci. 2017, 11, 549. [Google Scholar] [CrossRef]
- Pagliaro, A.H.; Arya, P.; Piristine, H.; Lord, J.S.; Gobes, S.M. Bilateral brain activity in auditory regions is necessary for successful vocal learning in songbirds. Neurosci. Lett. 2020, 718, 134730. [Google Scholar] [CrossRef]
- Fitch, R.H.; Brown, C.P.; O’Connor, K.; Tallal, P. Functional lateralization for auditory temporal processing in male and female rats. Behav. Neurosci. 1993, 107, 844–850. [Google Scholar] [CrossRef] [PubMed]
- Washington, S.D.; Kanwal, J.S. Sex-dependent hemispheric asymmetries for processing frequency-modulated sounds in the primary auditory cortex of the mustached bat. J. Neurophysiol. 2012, 108, 1548–1566. [Google Scholar] [CrossRef] [PubMed]
- Suga, N.; Jen, P. Disproportionate tonotopic representation for processing CF-FM sonar signals in the mustache bat auditory cortex. Science 1976, 194, 542–544. [Google Scholar] [CrossRef] [PubMed]
- Suga, N. The extent to which biosonar information is represented in the bat auditory cortex. In Neurocomputing 2: Directions for Research; Anderson, J.A., Pellionisz, A., Rosenfeld, E., Eds.; MIT Press: Cambridge, MA, USA, 1985; pp. 259–294. [Google Scholar]
- O’Neill, W.; Suga, N. Target range-sensitive neurons in the auditory cortex of the mustache bat. Science 1979, 203, 69–73. [Google Scholar] [CrossRef]
- Suga, N.; O’Neill, W. Neural axis representing target range in the auditory cortex of the mustache bat. Science 1979, 206, 351–353. [Google Scholar] [CrossRef] [PubMed]
- Suga, N. Specialization of the auditory system for the processing of bio-sonar information in the frequency domain: Mustached bats. Hear. Res. 2018, 361, 1–22. [Google Scholar] [CrossRef]
- Xiao, Z.; Suga, N. Reorganization of the cochleotopic map in the bat’s auditory system by inhibition. Proc. Natl. Acad. Sci. USA 2002, 99, 15743–15748. [Google Scholar] [CrossRef]
- Kanwal, J.S.; Fitzpatrick, D.C.; Suga, N. Facilitatory and inhibitory frequency tuning of combination-sensitive neurons in the primary auditory cortex of mustached bats. J. Neurophysiol. 1999, 82, 2327–2345. [Google Scholar] [CrossRef][Green Version]
- Fitzpatrick, D.C.; Kanwal, J.S.; Butman, J.; Suga, N. Combination-sensitive neurons in the primary auditory cortex of the mustached bat. J. Neurosci. 1993, 13, 931–940. [Google Scholar] [CrossRef] [PubMed][Green Version]
- Fitzpatrick, D.C.; Suga, N.; Olsen, J.F. Distribution of response types across entire hemispheres of the mustached bat’s auditory cortex. J. Comp. Neurol. 1998, 391, 353–365. [Google Scholar] [CrossRef]
- Washington, S.D.; Hamaide, J.; Jeurissen, B.; Van Steenkiste, G.; Huysmans, T.; Sijbers, J.; Deleye, S.; Kanwal, J.S.; De Groof, G.; Liang, S.; et al. A three-dimensional digital neurological atlas of the mustached bat (Pteronotus parnellii). NeuroImage 2018, 183, 300–313. [Google Scholar] [CrossRef] [PubMed]
- Esser, K.-H.; Condon, C.J.; Suga, N.; Kanwal, J.S. Syntax processing by auditory cortical neurons in the FM-FM area of the mustached bat Pteronotus parnellii. Proc. Natl. Acad. Sci. USA 1997, 94, 14019–14024. [Google Scholar] [CrossRef]
- Hauser, M.D.; Konishi, M. Processing Species-specific Calls by Combination-sensitive Neurons in an Echolocating Bat. In The Design of Animal Communication; The MIT Press: Cambridge, MA, USA, 2003; pp. 135–157. [Google Scholar]
- Kanwal, J.S. A distributed cortical representation of social communication calls. In Behavior and Neurodynamics for Auditory Communication; Kanwal, J.S., Ehret, G., Eds.; Cambridge University Press: New York, NY, USA, 2006; pp. 156–188. [Google Scholar]
- Medvedev, A.V.; Kanwal, J.S. Local Field Potentials and Spiking Activity in the Primary Auditory Cortex in Response to Social Calls. J. Neurophysiol. 2004, 92, 52–65. [Google Scholar] [CrossRef] [PubMed]
- Washington, S.D.; Kanwal, J.S. DSCF Neurons Within the Primary Auditory Cortex of the Mustached Bat Process Frequency Modulations Present Within Social Calls. J. Neurophysiol. 2008, 100, 3285–3304. [Google Scholar] [CrossRef][Green Version]
- Kanwal, J.S.; Matsumura, S.; Ohlemiller, K.; Suga, N. Analysis of acoustic elements and syntax in communication sounds emitted by mustached bats. J. Acoust. Soc. Am. 1994, 96, 1229–1254. [Google Scholar] [CrossRef]
- Washington, S.D.; Tillinghast, J.S. Conjugating time and frequency: Hemispheric specialization, acoustic uncertainty, and the mustached bat. Front. Neurosci. 2015, 9, 143. [Google Scholar] [CrossRef]
- Clement, M.J.; Gupta, P.; Dietz, N.; Kanwal, J.S. Audiovocal Communication and Social Behavior in Mustached Bats. In Behavior and Neurodynamics for Auditory Communication; Kanwal, J.S., Ehret, G., Eds.; Cambridge University Press: New York, NY, USA, 2006; pp. 57–84. [Google Scholar]
- Washington, S.D.; Kanwal, J.S. Linear FM Synthesis: Test Stimuli for Rapid Analysis of Auditory Neurodynamics. Hoya Tech. Res. Bull. 2004, 2004120, 2004. [Google Scholar]
- Ma, X.; Suga, N. Corticofugal Modulation of the Paradoxical Latency Shifts of Inferior Collicular Neurons. J. Neurophysiol. 2008, 100, 1127–1134. [Google Scholar] [CrossRef][Green Version]
- Ocklenburg, S.; Korte, S.M.; Peterburs, J.; Wolf, O.T.; Güntürkün, O. Stress and laterality—The comparative perspective. Physiol. Behav. 2016, 164, 321–329. [Google Scholar] [CrossRef]
- Cory-Slechta, D.A.; Weston, D.; Liu, S.; Allen, J.L. Brain Hemispheric Differences in the Neurochemical Effects of Lead, Prenatal Stress, and the Combination and Their Amelioration by Behavioral Experience. Toxicol. Sci. 2013, 132, 419–430. [Google Scholar] [CrossRef] [PubMed]
- Wittling, W.; Pflüger, M. Neuroendocrine hemisphere asymmetries: Salivary cortisol secretion during lateralized viewing of emotion-related and neutral films. Brain Cogn. 1990, 14, 243–265. [Google Scholar] [CrossRef]
- Brüne, M.; Nadolny, N.; Güntürkün, O.; Wolf, O.T. Stress induces a functional asymmetry in an emotional attention task. Cogn. Emot. 2013, 27, 558–566. [Google Scholar] [CrossRef] [PubMed]
- Sherwood, C.C.; Raghanti, M.A.; Wenstrup, J.J. Is humanlike cytoarchitectural asymmetry present in another species with complex social vocalization? A stereologic analysis of mustached bat auditory cortex. Brain Res. 2005, 1045, 164–174. [Google Scholar] [CrossRef]
- Suga, N.; O’Neill, W.; Manabe, T. Harmonic-sensitive neurons in the auditory cortex of the mustache bat. Science 1979, 203, 270–274. [Google Scholar] [CrossRef] [PubMed]
- Hsiao, C.J.; Jen, P.H.-S.; Wu, C.-H. The cochlear size of bats and rodents derived from MRI images and histology. Neuro Rep. 2015, 26, 478–482. [Google Scholar] [CrossRef] [PubMed]
- Kamada, K.; Pekar, J.J.; Kanwal, J.S. Anatomical and functional imaging of the auditory cortex in awake mustached bats using magnetic resonance technology. Brain Res. Protoc. 1999, 4, 351–359. [Google Scholar] [CrossRef]


Publisher’s Note: MDPI stays neutral with regard to jurisdictional claims in published maps and institutional affiliations. |
© 2021 by the authors. Licensee MDPI, Basel, Switzerland. This article is an open access article distributed under the terms and conditions of the Creative Commons Attribution (CC BY) license (https://creativecommons.org/licenses/by/4.0/).