Abstract
This paper introduced the use of two new adsorbents, Akrosorb soda-lime and Bentonite clay, for refinery flare flue gas capture and storage. This study also developed a novel pilot plant model with 409.7149 kg/h capacity refinery flare emission capture with a novel adsorption column configuration using Akrosorb soda-lime and Bentonite clay adsorbents. The flare flue gas adsorption unit was designed, fabricated, test run, and commissioned. The adsorption column temperature is 28 ± 10 °C and has a pressure of 131.7 kPa. The novel plant RSM optimization result shows that 93.24% of CO2 and 62.18% of CO were absorbed, while 86.14% of NOx and 55.87% of HC were absorbed. The established optimum conditions of CO2, NOx, HC, and CO removal efficiency are 22 °C, 2 atm, and 60 min. The variation in flare gas emission could impact the removal efficiency of the plant. The results show the maximum adsorption ability or capacity of 314.30 mg/g, and 68.90 mg/g was reached at 60 min for Akrosorb soda-lime and molded Bentonite adsorbents. Therefore, the developed novel technology for CO2 and other GHG capture is technically feasible and friendly. The combined usage of both adsorbents will enhance the capture of GHG at a low cost compared to using Akrosorb alone as an adsorbent.
1. Introduction
Gas flaring over the years has been an issue of concern globally, and nations of the world have striven to minimize CO2 and other greenhouse gases (GHG) emanating from flaring. As such, capturing these gases becomes a necessity for sustainable development with a vested responsibility in reducing CO2 emissions, which increases the incidence of atmospheric catastrophe and global warming. The world is being confronted with the effect of climate change resulting from the emission of carbon from sources such as gas flaring among others. Several processes and technologies have been developed to reduce CO2 and other GHG emissions sufficiently to stabilize atmospheric CO2 concentrations at a ‘comfortable’ level. Their methods are absorption, and adsorption, membrane, hydride, and cryogenic capable for CO2 capture. These existing technologies are prone to high energy for regeneration, corrosion, low flue gases adsorption conditions, running cost, and technical problems, and some are flammable and toxic (ethane) [1,2]. The most developing technologies of all available technology for CO2 and other GHG capture are absorption and adsorption technologies. There are several CO2 capture methods, which are classified into pre-, oxy-, and post-combustion carbon capture [1,2,3].
The paper focuses on the post-combustion route technology type, which can be retrofitted to existing and future combustion. The post-combustion capture route implies the capturing of CO2 and other GHG from gas sources after it has been combusted such as flare flue gases [1,3]. Several major post-combustion capture processes available are absorption, adsorption (solid material), membrane, and cryogenic and hybrid dual solution (both physicochemical mixture) (Ben-Mansour et al., 2016). The quest to develop improved technology for GHGs capture from gas flaring emissions motivate the need to develop a novel technology of an adsorption column configuration that utilizes Akrosorb soda-lime and Bentonite clay to capture CO2 and other GHG emissions from a flare system, taking into consideration the reality of the national and local constraints about technology deployment and integration.
Bentonite has shown to be a good material [4] that could capture the flue toxic gases and is readily available in abundance in Nigeria and several countries of the world. It has also been shown to be appropriate for the adsorption of pollutants due to its Montmorillonite content. Likewise, the sodium (Na-Bentonite) form of Bentonite was adopted and recommended to this application because it is a good clay that facilitates swelling, abating contaminant migration, sealing of gases, water retention, and low hydraulic conductivity. Furthermore, because of its chemical properties and useful layer surface, Na-Bentonite has Na+ ions, which occupy more than 50% of the cations exchange capacity. On the other hand, Akrosorb soda-lime is a CO2 removal adsorbent used in medical, military, diving, and safety application and is made up of calcium and sodium hydroxide with a high affinity for CO2. Akrosorb is slightly expensive; as a result, the combined use of Akrosorb soda-lime and molded Bentonite clay will help in reducing the high cost of Akrosorb soda adsorbent. Hence, there is a need to design, fabricate, and test run this novel technology with a unit adsorption column configuration to capture CO2 and other GHG emissions from flare systems [5]. In addition, there are no studies in the relevant literature on the use of both Akrosorb soda-lime and Bentonite clay adsorbent simultaneously for CO2 and other GHG emissions from a flare system.
The current refineries emission abatement technology types available in the market for supply and installment are as follows: gas-to-NGL [6,7], gas-to-wire [8,9], gas-to-fired turbines through Brayton [10], gas-to-power through SRC and ORC [11], gas-to-gas processing plant development [12], gas-to-compressed gas [10], gas-to-fuel cell power through SOFC [5], gas-to-industries through membrane and gas condition [13,14], gas-to-recycling injection through compression to low-pressure process equipment [15], gas-to-fuel gas [16], gas-to-feed through the further process method [17], gas-to-LPG through feed [18], gas-to-ethylene [19], gas-to-liquefaction [18], and gas-to-FGRS [20], among others. However, none of these studies paid attention to flared flue gas emission capture and storage in petrochemical refineries. Hence, there is a need to develop a technology for CO2 capture for refineries flare flue gas other than GHG that can be retrofitted to existing refineries.
The knowledge gap expresses the need for technological innovation for refinery carbon emission capture in petrochemical refineries. The available post-combustion technologies do not address the issue of carbon capture in a petrochemical refinery [21].
The combined use of Akrosorb soda-lime and Bentonite clay will help in reducing the relatively high cost of Akrosorb soda adsorbent and enhance performance. Furthermore, there is a dearth of information because no studies have been in the relevant current extant literature on the use of both Akrosorb soda-lime and Bentonite clay adsorbent simultaneously for CO2 and other GHG emissions from the flare system, which makes the process novel.
What makes this research new is that no study ever used these adsorbents in flare gas applications for the petrochemical refinery. A pilot plant for CO2 capture and storage technology was developed and test runs successfully with a unique adsorption column design. The Aspen Hysys simulation conducted is well initiated and established; it has also discovered the adsorption capacity of Akrosorb and Bentonite adsorbent in flare gas carbon emission capture. In addition, it established the adsorption kinetics for a better understanding of the dynamics between the adsorbent and adsorbate. The combined usage of both adsorbents will enhance the capture GHGs at a low cost compared to using Akrosorb alone as an adsorbent. The study also established the crystal structure of Akrosorb soda-lime adsorbent as well as the discovery of having more surface area and crystallographic features, which signifies the availability of more adsorption sites.
In addition, the resultant by-products of this technological innovation are clean air and limestone produced from the flue gas treatment process, which has a good agricultural soil fertility potential due to its physicochemical properties for the remediation of barring land, soil quality amendment, and crop development [22]. Abatement technology development in oil and gas industrials would reduce economic costs to refineries and improve the sustainability of the processes and help to achieve the Paris agreement, taking into consideration the reality of the nationals and local constraints concerning technology deployment and integration.
Previous Study on Carbon Capture
The review of existing CO2 capture and storage technology patents from 2007 to 2018 shows that biological or membrane technology innovation occupied 64%, while absorption and adsorption have over 30–35%, and the remaining technology accounts for less than 10% [23]. However, none of the studies paid attention to the simultaneous use of Bentonite and soda-lime. The need for oil and gas refineries emission capture was suggested by Romano (2013). In addition, the remaining technology options from the review of the various CO2 captured and storage technology include ionic liquids, which are a novel solvent for CO2 capture. The CO2 sequestering method for the recycling of captured CO2 and suitability of its usage as C1 in fine chemicals, liquid fuels, and polymers proved unsuccessful [24], even though the study of the economic valuation of coal-fired power plant carbon capture and storage using the CCL process shows that the process is good and has low penalties consideration. The economic simulation reveals that a 600 MW carbon capture power plant using CCL technology installed has a lower heating value of 33.8% at 94% CO2 capture and storage ratio, with a penalty efficiency of 7.4% points compared to a power plant that has no CO2 capture and storage [25]. In addition, carbon capture study attempts to analyze oxy-fuel and CaCO3-loop (CCL) cement plant burns/combustion carbon capture. The CCL result shows that is the best because it requires less energy. Another study for carbon capture (CO2 uptake) suggests the use of bio-fixation for carbon storage by micro-organisms in a tubular photo-bioreactor [26]. Studies have shown that adsorbents of amine-based are problematic in CO2 capture due to their high energy requirement in their regeneration, corrosive nature, and the degradation of amines themselves [27]. Therefore, selecting the appropriate process for CO2 and other GHGs is chosen by adsorption and diffusion activity as well as a surface affinity for CO2 capture. Several studies indicate the use of adsorbent for CO2 capture and other GHG [3].
Adsorption has evolved from the bench-scale level to pilot scale in recent times [3]. The evaluation of the various technologies shows that adsorption technology is the most promising abatement technology that can mitigate the menace of CO2 and other GHG capture in post-combustion capture. Furthermore, adsorption has shown to be an alternative attractive abatement technology option for several reasons. This necessitates the need to investigate the adsorption kinetics of CO2 and other GHG adsorption from flue gas using Akrosorb soda-lime and Bentonite clay adsorbent.
2. Materials and Methods
2.1. Process Description of the Novel Technology
This study proposed and implemented a novel process concept based on the modification of the existing adsorption column with new adsorbents introduced (Bentonite and Akrosorb soda-lime) in the adsorption column. The modification made on the existing adsorption process is depicted in the flow diagram as shown in Figure 1. The proposed process concept has several advantages: simple modification to equipment and the possibility to separate CO2 and other GHG simultaneously. The diagram in Figure 1 indicates the process flow proposed and novel CO2 and GHG capture process technology. The flue gas from the flare stack at a maximum temperature of 280 °C is cooled to 20–30 °C in a heat exchanger EX-100 and then fed to the adsorption column C-100, A/B through a middle section feed stage. In addition, the process water from TK-100 is pumped using pump P-100 to the adsorption column C-100 and fed to the column through the top and middle section of the column. In the absorber column C-100, the flue gas is passed through two sections of adsorbent, Akrosorb soda-lime and Bentonite, where the flue gas comes into contact with the process water co-currently and passes through the Bentonite adsorbent bed at the bottom section of the column. The relatively clean gas from the Bentonite section flows up and counter-currently with the water through the Akrosorb soda-lime bed at the upper part of the column; then, the water effluent from the lower part of column C-100 along with free particles of the adsorbent washed off by the flowing water are passed through the filter, F-100, before storage in tank TK-100. The adsorbent type and structure for the adsorption column are listed in Table 1. The reason for the selection of this packing type and structure is because they are the best and are a relatively lower cost than a structured one. In addition, the efficiency is high, vapor capacity is high, and the low-pressure drop compared with the other structure as well as the typical turndown ratio is good.
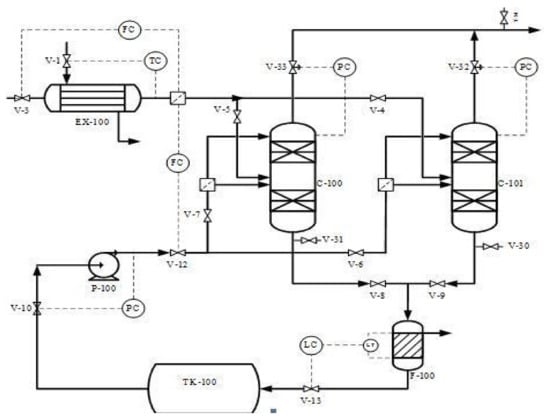
Figure 1.
Process flow diagram of carbon capture and storage plant.

Table 1.
Adsorbent type and structure.
The modification made on the existing adsorption process is that the flue gas and water were fed concurrently at the middle of the packed bed adsorption column (no adsorption column has this; it is only happening in the stripping process). The gas and water get mixed before contacting the adsorbent (i.e., gas dissolves in water before contact with the absorbents) to keep the adsorbent moisturized, thereby enhancing the adsorption of CO2 and other GHGs. In this regard, the packed column can handle a large volume of gases beyond its design capacity effectively and efficiently at a low cost, which opposed the current theories that consider that a packed bed absorption column of only less than 0.6 m in diameter would accommodate. The relatively clean gases from the Bentonite adsorbent section flow downwards to a concentric section in the column and then flow upward through the concentric space to the Akrosorb soda-lime bed at the upper section with water flowing from the upper part of the column as well counter currently to also keep the Akrosorb adsorbent bed moisturized for enhanced gas adsorption. Then, the finally cleaned gas is discharged from the top of the column, and the excess water in the column flows out from the bottom of the column.
A 409.7149 kg/h flare flue gas adsorption process according to Figure 1 was designed using a computer-aided design approach. Microsoft Visio 2013 was used for the process flow diagrams, and an Aspen HYSYS process simulator was used to perform the simulation. The adsorption column was configured to meet the proposed configuration and material and energy balance calculation. In addition, the equipment design calculation was performed using Aspen HYSY except for the filter unit design calculation, which was performed using the Mathcad application. The simulated adsorption process is as shown in Figure 2. The unique adsorption column designed specification was done to capture over 90% of CO2 and other GHG Figure 3.
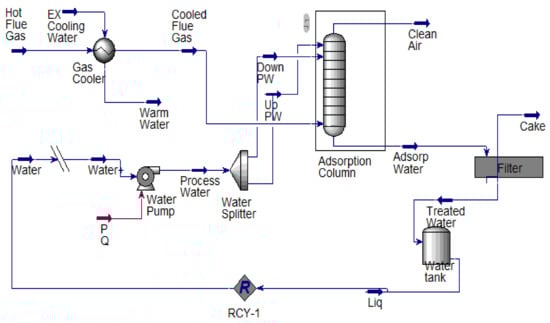
Figure 2.
Simulated novel process flow diagram of carbon capture unit.
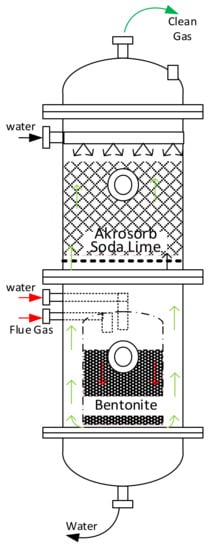
Figure 3.
Adsorption column configuration.
2.2. Fabrication and Installation Equipment
All fabrications were done using carbon steel material. The fabricated units were installed in line with the layout of the pipeline, and the pipelines were connected to the nozzle. During coupling, gaskets were used at all joints and tied properly to avoid leakages, while glass wool was used to prevent heat loss. In addition, all piping and instrumentations were installed before commissioning.
2.3. Adsorbent Preparation and Loading
The raw Bentonite clay sample was sourced from Bauchi town in Bauchi State, Nigeria. The clay was beneficiated, cleaned, moulded into a spherical shape using sodium silicate (Na2SiO3) as a binder in a 70:30 ratio, and calcined in a furnace at 500 °C for 1 h. Then, 20 kg of the prepared Bentonite was loaded into the inner concentric section at the bottom of the adsorption column. The Akrosorb was purchased from Akron Healthcare Pvt. Ltd., India, and 36 kg of the purchased Akrosorb was loaded into the top section of the adsorption column. The flue gas used for the test running and commissioning of the pilot plant was tapped from Ahmadu Bello University mini-refinery Zaria, Kaduna Nigeria, flare unit. Bentonite was prepared as follows:
- Powder Bentonite collection
- Beneficiation
- Drying and crushing of Bentonite
- Sieve analysis
- Bentonite mixed with a binder sodium silicate (Na2SiO3)
- Bentonite molded for carbon emission adsorption
- Calcination.
In the Bentonite section, the bottom packed bed section, the gas vapor, and solvent are moving in the same direction i.e., in the downward direction, and they do mix before they come into contact with the adsorbent while the adsorbent is being moisturized by the process water, making it capable of adsorbing the flue gas. Meanwhile, in the Akrosorb soda-lime at the top packed bed portion, the liquid and gas come in contact across the packed bed, which continues randomly as in the column plate. In addition, the physicochemical characteristics of both adsorbents influence the adsorption capacity. The overall chemosorption adsorption mechanism and that of CO2 capture by Akrosorb soda lime are represented in three stages:
CO2 (g) + H2O → CO2 (aq) (CO2 in aqueous form)
CO2 (aq) + NaOH → NaHCO3 (Alkaline base at high pH)
NaHCO3 + Ca(OH)2 → CaCO3 + H2O + NaOH (NaOH reproduced at step 2).
The overall balanced equation is expressed by Equation (4):
The resultant by-product of this technological innovation is clean air and limestone produced from the flue gas treatment process, which has high agricultural soil fertility potentials due to its physicochemical properties for remediation of barren land, soil quality amendment, and crop development.
2.4. Inspection of the Installed Plant
After successful installation and cladding of the unit, a test run was conducted on the pilot plant at the design operating parameters. Inspection and testing were carried out to ensure that all equipment units have been properly constructed, are operational, and are verified to perform according to the design intent and the user’s operational needs. All parts of the fabricated pilot plant (from the heat exchanger, process water storage tanks, adsorption columns, filter, and pump) were inspected for the avoidance of leakages and to ensure proper connection of pipes to nozzles and valves through the aide of visual observation and leak detection methods. All equipment units were inspected for cleanness and conformity with design specifications. In addition, all electrical connections and devices such as thermocouple, temperature and pressure controller and indicators as well as electrical cables were inspected for proper connection to avoid any electrical bridge and default during operations. Few issues of leakage were noticed from the connecting nozzles due to the improper placement of gaskets, which were corrected before the proper commissioning was done. In addition, the platforms were checked for the proper bolting of equipment on the platform; however, no-fault was noticed. After inspection, the pilot was started up and commissioned.
2.5. Characterization of Adsorbent Materials Method
2.5.1. X-ray Diffraction (XRD)
An XRD test was conducted on the raw Bentonite clay, molded Bentonite, and Akrosorb adsorbents powder samples. The Akrosorb soda-lime adsorbent was made into a fine powder before XRD weight. The scan was performed for the Akrosorb adsorbent. The XRD forms were generated from XPERT-PRO XRD through CuKα radiate (λ = 1.54 Å). The experiment was maintained at atmospheric temperature and power at 40 kV with 40 mA. The same procedure was repeated for raw Bentonite and molded Bentonite powder.
2.5.2. Brunauer–Emmett–Teller (BET) Surface Area Analyzer
To obtain the surface of the material and pore volume, among other measurements, we used the BET method at 77k. The analysis was done using a Quanta chrome NOVA4200e made in USA instrument. Powder samples of the Akrosorb soda-lime adsorbent were put into an oven operated under low temperature to make sure the powder dried. A dried quantity Akrosorb powdered sample was measured and placed into a tube GEL surface-dried analyzer, and gases were removed for 3 h at a temperature of 250 °C with the aid of a heating mantle before the analysis.
2.5.3. Fourier Transform Infrared (FTIR) Analysis
Fourier transform infrared (FTIR) was conducted on the Bentonite clay, molded Bentonite, and Akrosorb adsorbent to characterized into the various functional groups present in the adsorbent using Agilent Technologies Cary 630 FTIR spectrometer, the wavelength is within 650–4000/cm at a magnification of 2.0/cm.
2.5.4. Scanning Electron Microscopy (SEM) Analysis
The surface and microstructure analysis of the raw Bentonite clay, molded Bentonite, and Akrosorb adsorbent were carried out using an SEM instrument with model PHENOM ProX, Phenom-World, Eindhoven, The Netherlands.
2.6. Adsorption Study
Adsorption studies were carried out using the Akrosorb and molded Bentonite adsorbent in a batch adsorption process. The weight of the Akrosorb adsorbent was noted before the adsorption study commences, and the weight was also measured at a specified time interval using an electronic digital weighing balance to determine the difference in weight until the perpetual weight was achieved; this gives the maximum adsorption ability or capacity. Similarly, the same process applied to moulded Bentonite adsorbent is represented in Equation (5).
To determine the rate of adsorption of the adsorbent, 5 g each of Akrosorb and Bentonite were inserted into burretts, while the flue sample is being injected into each burette for 5 min. Then, the adsorbents are removed and weighed. The same process was repeated for 10, 20, 30, 40, 50, and 60 min. Equations (1)–(6) were used for modeling.
2.6.1. Adsorption Kinetics
Adsorption kinetics entails the experimental conditions that influence the rate of adsorption of chemicals. Adsorption kinetics is vital in understanding the adsorption dynamics between the adsorbent and adsorbate. In this study, Lagergren’s pseudo-1st-order and pseudo-2nd-order kinetic models were considered using the experimental data generated from the adsorption study to model the adsorption process.
Pseudo-first-order models
Lagergren’s pseudo-1st-order models were utilized to find out the kinetic performance of the Akrosorb soda-lime adsorbent and to assess the conformity of the experimental work and the kinetic model using regression coefficient (R2). The pseudo-1st-order models are represented in Equation (6).
Applying boundary conditions, the terms t = 0, q = 0, and t = t, q = qt when boundary conditions are reached. The linearized form of the Lagergren pseudo-1st-order model is generally expressed in Equation (7).
where qe and qt = the amount of CO2 gas adsorbed in mg/g at equilibrium and at time t, respectively, and k1 = the rate constant of pseudo-first-order model (min−1). The same mathematical procedure was utilized for the molded Bentonite adsorbent.
Pseudo-second-order models
In addition, the pseudo-2nd-order model was used to assess the kinetic behavior of the Akrosorb soda-lime adsorbent depict in Figure 4 and its conformity with experimental data, while the value of regression coefficient (R2) was used to analyze the kinetic model. The pseudo-1st-order model is represented in Equation (8).
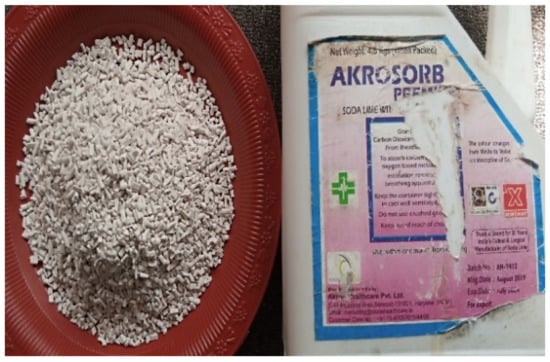
Figure 4.
Akrosorb soda-lime adsorbent.
Linearizing and integrating the equation, the pseudo-2nd-order model is given in Equation (9),
where slope = 1/k2qe2, and k2 = pseudo 2nd-order rate constant.
Concerning Equation (8) [27,28] a pseudo-2nd-order kinetic model is said to be applied if we plot t/qt against time (t), resulting in a square with an intercept of 1/qe and 1/h. The same mathematical procedure was utilized for the molded Bentonite adsorbent as shown in Figure 5.
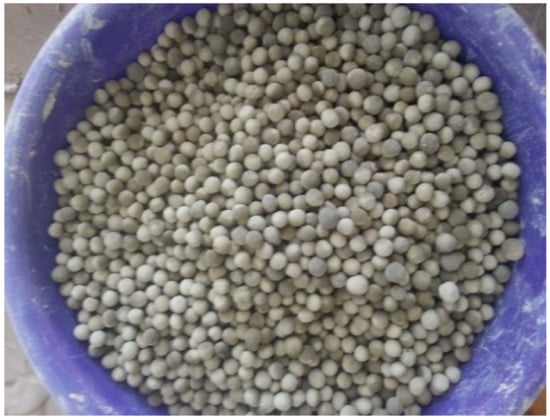
Figure 5.
Molded Bentonite clay adsorbent.
2.6.2. Intra-Particle Diffusion Model
The IPD model is vital in assessing the adsorption of pollutants by an adsorbent that involves the diffusion process. Ref. [29] give the IPD model as represented by Equation (10).
where qt = the amount of CO2 adsorbed at any time t (mg/g), kid = the intra-particle diffusion rate constant (mg/g·min1/2), t = the contact time (min1/2), Ci = a constant related to the bonding layer thickness.
According to [27], a straight line that passed through the origin will be observed if the adsorption process obeys the IPD model.
2.7. Pilot Plant Gas Analysis
The novel pilot plant was evaluated on its carbon emission removal efficiency for the flare flue gas using a Nanhua NHA 506 EN, 2012 automation emission analyzer to determine the gases (CO2, NOx, O2, HC, CO, N2) present in the combusted flue gas before entering and after leaving the adsorption column, and the obtained results were subjected to statistical analysis. Five samples each from the inlet and the outlet were collected, and the result is as shown below.
2.8. Two-Way ANOVA: Inlet, Outlet
To test for plant adsorption efficiency, ANOVA was used using the Minitab statistical package to transform the single values into statistical values and to test their significance difference between mean values of inlet and outlet, within and among the compounds, and to evaluate the pilot plant adsorption efficiency based on statistical evidence.
3. Result and Discussion
Performance Evaluation of Pilot Plant
The performance of the commissioned pilot plant for flare gas abatement was evaluated based on operating conditions (temperature and pressure sensing), CO2, CO, and N2 removal efficiency to show the performance of the pilot plant. The thermometer ensures the stability/uniformity of the temperature in the furnace. Digital temperature control that provides accurate reading was used; meanwhile, regular checking of the thermometer was maintained. The temperature controller is digital, which makes the reading accurate; also, there is a regular temperature check using an external probe to calibrate the temperature controller, thereby guaranteeing effective temperature reading. The flue gas removal efficiency of the installed pilot plant was a measure to pilot efficiency to attain the desired purity. The pilot plant was set to operate at 100% capacity, and it was observed that it took 6–10 min for the plant to attain stability and or steady-state operations.
The installed pilot plant is considered efficient in operation. The sensitivity and ability to maintain a constant temperature are also very important in the performance evaluation test. This was evaluated by monitoring the temperature change when the heat exchanger and the adsorption column were in operation as well as the insulator, which also shows effectiveness in minimizing heat loss to the surroundings. In addition, pressure build-up in the heat exchanger and adsorption column as a result of material flow during operations was inspected to ensure the safety of the operator and the plant. The pressure build-up was found to be negligible. It was observed that the heat exchanger shell-side pressure was 121.3 kPa, which is slightly higher than the specified operating pressure of 101.325 kPa; however, the operating pressure is well below the design pressure of 300 kPa, which signifies that the operating pressure is well within safe and operational limits. The tube side pressure of the heat exchanger was also observed to be 197.7 kPa which is slightly higher than the specified operating pressure of 162.12 kPa. Conversely, tube side operating pressure is also well below the design pressure of 300 kPa, which signifies that the operating pressure is well within safe and operational limits. In addition, the actual operating temperature on the shell side and tube side of the exchanger was found to be ± 5 °C from the desired shell-side temperature of 24 °C, while the tube-side outlet temperature was observed to be ± 8 °C from the desired tube-side outlet temperature of 25 °C. Furthermore, in terms of the safety and operation of the heat exchanger, the actual operating temperature on the shell side and tube side are well below the design temperature of 60 °C and 315 °C, respectively and the temperature stabilized after the steady-state operation was reached.
The performance of the adsorption column was evaluated to determine the conformity of the actual operating condition with design operating conditions. The temperature in the adsorption column was observed to be 35 °C. Furthermore, cooling water inlet valves to the heat exchanger were further slightly opened to enhance the cooling rate of the hot flue gas, resulting in the reduction of the deviation of the feed temperature to the adsorption column to ±2 °C to give a column temperature of 28 °C. The column’s actual operating pressure was found to be 131.7 kPa (1.3 atm), which is slightly lower than the specified operating pressure of 162.12 kPa. In addition, the column operating pressure is well within the design pressure of 254 kPa and within safe operational limits with no pressure build-up above the specified operating and design pressure. This variation in the actual operating conditions of the column from the design operating conditions could be attributed to the effectiveness of the flue gas cooling from the heat exchanger. The filter performance was also evaluated to ensure satisfactory operation, and no pressure build-up was observed in the filter during operation. The fabricated, assembled and commissioned a pilot plant for carbon emissions captured at the Ahmadu Bello University Mini-refinery is as shown in Figure 6.
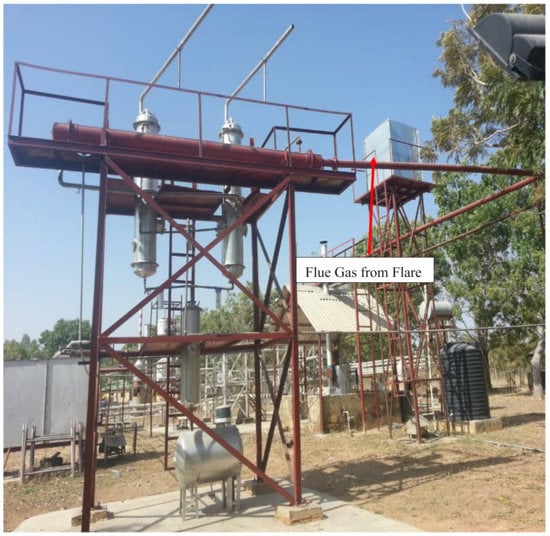
Figure 6.
Commissioned novel pilot-scale plant for GHGs adsorption and storage.
4. Characterization of Adsorbent Results
The results of the Akrosorb soda-lime, raw Bentonite, and molded Bentonite clay (with Na2SiO3 binder) adsorbent characterized using XRD, FTIR, BET, and SEM were presented below.
4.1. XRD Result of Akrosorb and Bentonite Clay
The crystallographic features of Akrosorb soda-lime and Bentonite clay adsorbent used for CO2 and GHG capture in the adsorption column were determined as shown in Figure 7. The crystallographic study of Akrosorb soda-lime adsorbents showed that it contains mainly Ca(OH)2 (87.5%) and a small quantity of CaCO3 (12.5%) and that the crystal system is trigonal with hexagonal axes for the portlandite and calcite phases present. The degree of crystallinity of the Akrosorb soda-lime adsorbents is 26% with 74% amorphous content, which portends high adsorption capacity for Akrosorb soda-lime due to its high amorphous content, which corresponds to the available composition from the Akrosorb soda-lime adsorbents data sheet (Ca(OH)2 > 80% w/w) obtained from the manufacturer. It was also found that the crystal structure of Akrosorb soda-lime (contains Ca(OH)2 and CaCO3) in portlandite and calcite phases is made up of a trigonal crystal system with hexagonal axes (unit cell parameter of a = 3.59247 Å and c = 4.90820 Å for portlandite and a = 4.99150 Å and c = 17.08800 Å for calcite phase).
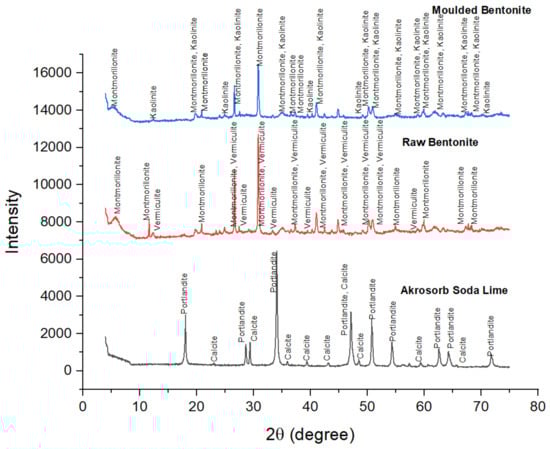
Figure 7.
XRD adsorbents diffractogram.
The crystallography of the molded Bentonite clay was also examined using XRD analysis as presented in Figure 7. The Figure 7 result shows the diffraction peaks of molded Bentonite at 2θ angles of 5.66°, 20.92°, 25.01°, 26.69°, 30.87°, 35.15°, 36.59°, 37.30°, and 44.87° are typical of those of Montmorillonite silicate phase and correspond to the diffraction peak of Montmorillonite in the raw Bentonite clay. The most intense peak is observed at the 2θ angle of 30.87°, which corresponds to those of Montmorillonite, showing that the molding of the Bentonite clay using Na2SiO3 binder did not affect the structure of the Montmorillonite silicate phase. However, it was observed that the XRD pattern of the vermiculite phase in the Bentonite clay changes after molding with Na2SiO3 binder to the kaolinite silicate phase. Figure 7 shows that the diffraction peaks of molded Bentonite at 2θ angles of 12.43°, 24.96°, 39.51°, 49.12°, and 70.10 are typical of the kaolinite silicate phase. The characteristic peaks of the kaolinite were for crystalline silica. It can be seen that the other peaks that represent the kaolinite phase were much lower; they generally had an intensity of fewer than 900 counts and even lower, which implies that the kaolinite content is lower than Montmorillonite content in the molded Bentonite. The change in the phases in the molded Bentonite clay indicates that the binder utilized affected the crystal structure of the Bentonite from vermiculite phase to kaolinite phase. It was further observed that the crystal system of the molded Bentonite clay is anorthic. The analysis further shows that the degree of crystallinity of the molded Bentonite clay reduces to about 9.98% with a 90.02% amorphous silica phase. The slight increase in the amorphous silica phase would further enhance the adsorptive properties of the molded Bentonite compared to the raw Bentonite.
Figure 7 also presents the XRD pattern of the raw Bentonite clay and the molded Bentonite clay. Figure 7 indicates that the diffraction peaks for raw Bentonite at 2θ angles of 5.82°, 11.70°, 17.84°, 20.92°, 26.69°, 30.87°, 35.15°, 44.87°, 50.20°, 50.96°, 54.95°, 58.81°, 59.99°, 61.73°, 63.43°, 67.79°, and 68.37° correspond to the diffraction peak of Montmorillonite. The most intense peak was observed at the 2θ angle of 30.87°, which corresponds to those of Montmorillonite and vermiculite, which shows that the raw Bentonite clay comprises mainly of Montmorillonite and vermiculite silicate phases with monoclinic and anorthic structures, respectively. These peaks correspond to (001), (002), (003), (012), (110), and (111) crystallographic planes assigned to the Montmorillonite phase, respectively, and are consistent with basal spacing reported in the literature for the Montmorillonite silicate phase. In addition, the peaks of the raw Bentonite at 2θ angles of 12.46°, 20.92°, 23.46°, 24.93°, 26.69°, 30.87°, 33.39°, 37.33°, and 41.06° correspond to those of vermiculite. These peaks are consistent with basal spacing of (004), (114), and (008) reported in the literature for the vermiculite silicate phase. The basal spacing for Montmorillonite and the vermiculite phase was observed to be 15.004 Å and 14.334 Å, which correspond to (001) and (002) planes respectively, indicating both Montmorillonite and vermiculite phases to be present in almost equal quantity. The XRD analysis shows that the raw Bentonite comprises mainly of Montmorillonite and vermiculite silicate phases in almost equal quantity, as shown in Figure 5, and the crystal system comprising mainly of anorthic and monoclinic crystal with three unequal axes, a = 5.18 Å, b = 8.98 Å, and c = 15.0 Å for the Montmorillonite phase and a = 5.349 Å, b = 9.255 Å, and c = 28.7217 Å for the vermiculite phase. The XRD analysis further shows that the degree of crystallinity of the raw Bentonite clay is 11.96% with 88.04% amorphous silica phase, which indicates high adsorption.
The crystal structure of the Bentonite and Akrosorb soda-lime adsorbents was determined by the XRD technique. Figure 7 presents the XRD pattern of the Akrosorb soda-lime adsorbents. It can be seen that the diffraction peaks at 2θ angles of 18.08°, 28.72°, 34.13°, 47.15°, 50.80°, 54.35°, 56.18°, 59.20°, 64.30°, and 71.81° were typical diffraction peaks of portlandite (Ca(OH)2), and the most intense peak was observed at the 2θ angle of 34.13°, which corresponds to portlandite (Ca(OH)2). This shows that Akrosorb soda-lime adsorbents are comprised mostly of Ca(OH)2 phase with a hexagonal structure. These peaks correspond to (001), (110), (011), (012), (110), and (111) crystallographic planes assigned to the Ca(OH)2 phase respectively. The XRD result of Ca(OH)2 is consistent with those reported for the Ca(OH)2 phase by Guerrero et al. (2017). In addition, the basal spacing of the Akrosorb soda-lime adsorbents at 2θ angles of 18.08° and 28.72° was 4.9060 Å and 2.6272 Å respectively, indicating that the (001) and (110) planes show portlandite to be in excess. In addition, the diffraction peaks at 2θ angles of 23.07°, 29.42°, 35.96°, 39.43°, 43.16°, 47.15°, 48.52°, 57.42°, 60.67°, and 65.64° were typical diffraction peaks of calcite (CaCO3), and the low intensity of the calcite peaks shows that the Akrosorb soda-lime adsorbents contain a small quantity of calcite. The calcite peaks correspond to (012), (104), (110), (113), (202), (211), and (122) crystallographic planes assigned to the CaCO3 phase, respectively. This corresponds with peaks at 2θ of 23.1°, 29.4°, 35.9°, 39.4°, 43.3°, and 57.3°, representing (112), (104), (110), (113), (202), (211), and (122) reported in the literature.
4.2. Brunauer–Emmett–Teller Result of Adsorbent
The BET technique was used to find out the total pores volume area, using a Quanta chrome instrument. The DH, DFT, and BJH methods were used to evaluate the mesoporus and micropores of adsorbent materials, while the t-method was also used to examine the surface/external area, and the DR techniques were used to examine the micropores. The porosity is classified into three groups of pore dimensions: these are micropores (width < 2 nm), mesoporous (width: 2–50 nm), and macrospores (width > 50 nm). Table 2 presents the BET surface area analysis of the Akrosorb soda-lime and Bentonite adsorbent.
Table 2.
BET surface area analysis.
Table 2 presents the surface and pore properties of the Akrosorb soda-lime and Bentonite adsorbents. It can be seen that the Akrosorb soda-lime adsorbent is highly micro porous with a 1072 m2/g micropore area when compared to that of raw Bentonite clay and molded Bentonite adsorbents with 498 m2/g and 498.2 m2/g micropore area, respectively. It was observed that there was no change in the micropore area of the Bentonite clay after molding using Na2SiO3 as a binder, as the micropore area only increases from 498 to 498.2 m2/g. Hence, Akrosorb soda-lime adsorbent has a higher micropore area than molded Bentonite, which could be due to the high amorphous content in the Akrosorb soda-lime adsorbent crystal structure established from the XRD analysis. This implies that a higher micropore area signifies the availability of more adsorption sites for CO2 and other GHG. In addition, it was observed that the cumulative adsorption surface area of Akrosorb soda-lime adsorbent was higher than that of molded Bentonite.
The pore volume of adsorbent is another crucial parameter of adsorbent materials. The pore volume of Akrosorb soda-lime and molded Bentonite adsorbent are presented in Table 2. Substantiating the micropore area and cumulative adsorption surface area of the adsorbents, it can be seen that the micropore volume of the Akrosorb soda-lime and molded Bentonite adsorbents are 0.02478–0.3810 m3/g and 0.02364–0.1770 m3/g respectively, while the cumulative adsorption pore volumes are 0.5444–0.5566 m3/g and 0.2533–0.2665 m3/g, respectively. This further confirms that the Akrosorb soda-lime adsorbent possesses a higher adsorption capacity than molded Bentonite adsorbents. This could be attributed to the high development of the pores in Akrosorb soda-lime.
The pore size of the adsorbent is also another significant parameter that gives insight into the adsorption capacity of an adsorbent. According to the classification of IUPAC, pore sizes are classified into three categories: < 2.0 nm are microporous, 2.0–50 nm are mesoporous, and > 50 nm macrospores. From Table 2, it can be seen that the diameter of the pores of the Akrosorb soda-lime adsorbent, raw Bentonite clay, and molded Bentonite adsorbents are mostly in the range of mesoporous pore size of 2.647–3.479 nm, 2.647–3.479 nm, and 2.647–2.800 nm, respectively. However, the HK method shows the presence of microporous pore sizes of 1.847, 1.847, and 0.3675 nm for Akrosorb soda-lime, raw Bentonite clay, and molded Bentonite adsorbents, respectively. In addition, the cumulative adsorption pore diameter for Akrosorb soda-lime, raw Bentonite clay, and molded Bentonite adsorbents are in the range of 2.105–2.426 nm, 2.100–2.427 nm, and 2.132 nm, respectively. It can be seen that the Akrosorb adsorbent and raw Bentonite clay have equal cumulative adsorption pore diameters, while that of molded Bentonite is slightly smaller. This shows that Akrosorb soda-lime has higher pore size compared to that of molded Bentonite adsorbent and both have microporous and mesoporous pore surface sizes.
Additionally, the micropores pore width formed in the interlayer spacing was found to be 6.503, 6.538, and 5.749 nm for Akrosorb soda-lime, raw Bentonite clay, and molded Bentonite, respectively, which indicates the formation of mesoporous (2.0–50 nm). These observations indicate that Akrosorb soda-lime and molded Bentonite both can adsorb CO2 and GHG. It was also found that adsorption takes place mainly through micropores and mesopores. Hence, from the adsorbents characterization, it can be concluded that Akrosorb soda-lime adsorbent has a higher adsorption capacity for CO2 and other GHG than Bentonite adsorbent. Therefore, both Akrosorb soda-lime and molded Bentonite adsorbents indicate good adsorption potential for CO2 and other GHG, and the combined usage of both adsorbents will enhance the capture of CO2 and other GHG at a low cost compared to the usage of Akrosorb soda-lime alone as adsorbent.
4.3. SEM/EDX Result of Akrosorb Soda-Lime and Bentonite Clay
A scanning electron microscope (SEM) was employed to examine the morphology of the surface and pore development of the adsorbent. Figure 8 shows the SEM image of the Akrosorb soda-lime adsorbent. It was observed that the SEM image of the Akrosorb adsorbent shows a crystalline and smooth surface morphology with smaller pores. The SEM images showed the formation of a dense and rough surface and the formation of nano crystalline powder particles. The surface roughness observed from Figure 9 is attributed to the relatively high amorphous phase associated with the Ca(OH)2 phase, which corroborates the high amorphous phase established from XRD analysis.
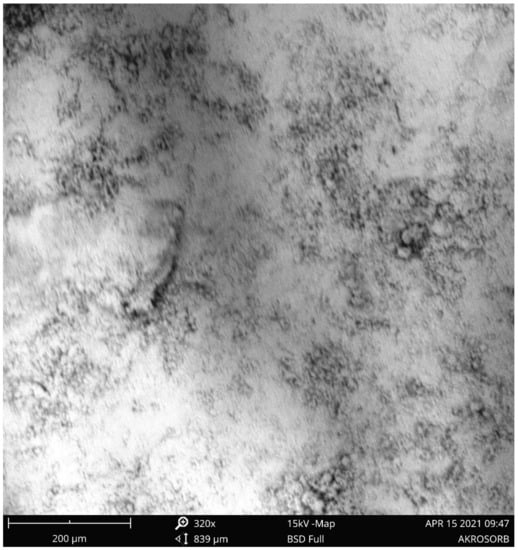
Figure 8.
SEM image of the Akrosorb adsorbent at 320× magnification.
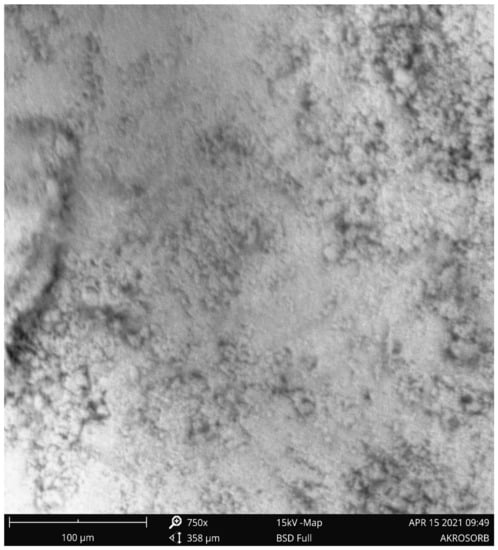
Figure 9.
SEM image of the Akrosorb adsorbent at 750× magnification.
The high composition of Ca Akrosorb adsorbent further confirms the XRD result, which predominantly shows Ca(OH)2 and CaCO3 phases and that the Akrosorb adsorbent constitutes primary Ca.
The raw Bentonite clay and molded Bentonite were also characterized using the SEM technique. Figure 10 indicated raw Bentonite clay SEM image at 320 and 750 magnifications. It was observed that the image shows a scattered and rough surface morphology with the formation of a nano crystalline particle. The surface roughness observed from Figure 10 is attributed to the relatively high amorphous silicate phase associated with the raw Bentonite clay phase, which validates the high amorphous phase established from XRD analysis. Figure 11shows that the minimum peak intensity of Akrosorb soda lime was larger than that of Bentonite, which is attributed to the presence of portlandite and calcite phases as well as the crystallographic structure of Akrosorb when compared to those of Bentonite, which contains Montmorillonite, Vermiculite, and Kaolinite.
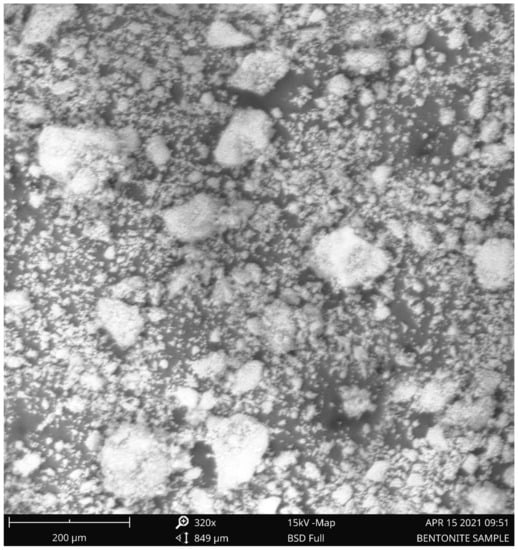
Figure 10.
Raw Bentonite SEM at 320× magnification.
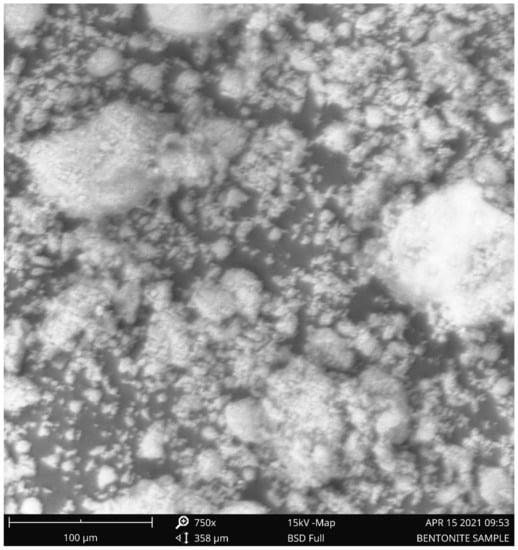
Figure 11.
Raw Bentonite SEM at 750× magnification.
The molded Bentonite was also characterized using the SEM technique. Figure 12 shows the SEM image of the molded Bentonite. It was observed that the SEM image of the molded Bentonite shows a crystalline and smooth surface morphology. The SEM images showed the formation of a dense and slightly rough surface with smaller pores. The change in surface morphology could be attributed to the effect of the binder (Na2SiO3) used, which was established from the XRD analysis to affect the crystal structure of the Bentonite. The image in Figure 13 shows some pore development; this could be attributed to the presence of kaolinite identified in the molded Bentonite from the XRD analysis. This is because the kaolinite phase has an empty framework structure that is almost 50% void, which makes the special structure of kaolinite have a lot of micropores and mesopores of less than one nanometer.
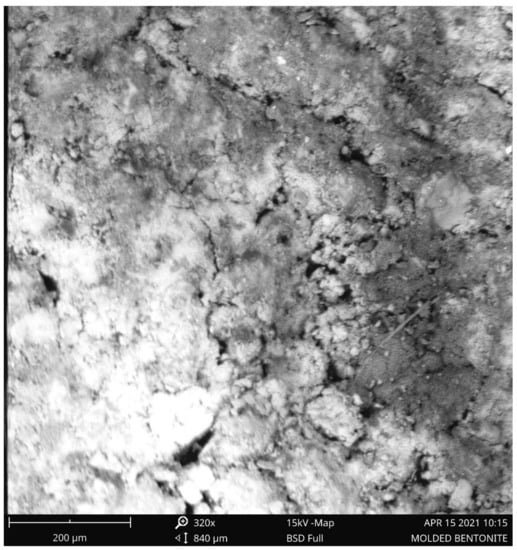
Figure 12.
SEM image of the molded Bentonite at 320× magnification.
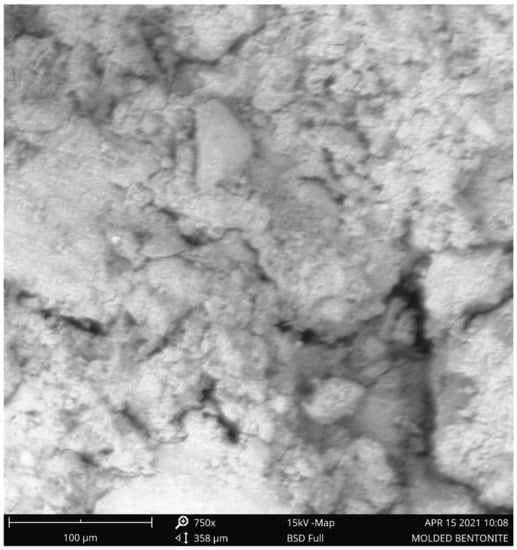
Figure 13.
SEM image of the molded Bentonite at 750× magnification.
It can be seen that there was an increase in the silica content from 31.91% in the raw Bentonite clay to 40.43% in the molded Bentonite. This could be attributed to the use of Na2SiO3 as a binder and also responsible for the increases in the sodium content in the molded Bentonite. The Bentonite clay is a calcium Montmorillonite that contains mainly silicon oxide, ferric oxide, calcium oxide, and aluminum oxide, which corroborates the finding. Calcium Bentonite is a useful adsorbent; this makes Bauchi LGA Bentonite a useful adsorbent.
4.4. Fourier Transform (FTIR) Result of Akrosorb Soda-Lime and Bentonite Clay
The FTIR is a measure of quantitative and qualitative analysis of the functional group of organic and inorganic samples in a material. The FTIR of the Akrosorb adsorbents indicated in Figure 14 shows the bands of a constituent functional group identified from the Akrosorb adsorbents FTIR. It was observed that the sharp band at 711.9 cm−1 indicates a carbonate ion (CO32−), which is attributed to the presence of a crystalline calcite phase. The bands at 872.2 cm−1 and 1103.3 cm−1 indicating CO32− bending vibration and CO32− stretching respectively correspond to the presence of amorphous calcium carbonate phase of calcite. However, the band at 1423.8 cm−1 is attributed to the presence of the CO3−2 asymmetric stretching mode of the carbonate ion bending vibration band, which corresponds to the carbonate phase of calcite. This is consistent with the XRD analysis, which also indicated the presence of calcite as well as amorphous and crystalline phases. Furthermore, it can be seen from Figure 14 that the characteristic band at 1640.0/cm is due to the H-O-H bending vibration of water. The bands at 3399.3/cm and 3641.6/cm are because of the presence of O-H broad band vibration as well as Ca-O-H and O-H stretching mode, which is similar to the stretching mode of portlandite. The O-H stretching mode also corresponds to structural water within the amorphous calcite phase. This is also consistent with the findings established from the XRD analysis of the presence of the portlandite phase.
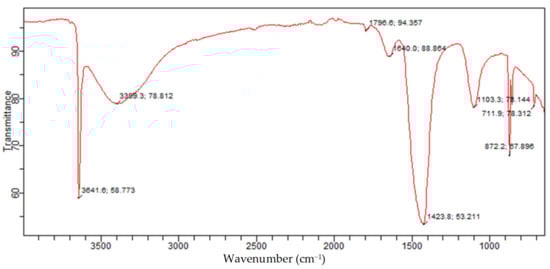
Figure 14.
Akrosorb soda-lime adsorbent FTIR.
The FTIR of raw Bentonite depicted in Figure 15 is attributed to the presence of quartz silicate Montmorillonite and vermiculite phases in the Bentonite. In addition, the 875.9 cm−1 and 913.2 cm−1 band is related to Al-Al-OH; this band indicates the presence of silicate type of Montmorillonite and vermiculite. The band at 1438.8/cm is because of the Ca-O broadband vibration, which is attributed to the Montmorillonite phase, while the bands at 1632.6/cm, 3391.9/cm, and 3623 cm−1 are because of the -OH bending mode, -OH vibration, and -OH stretching mode for the interlayer adsorbed water in the Montmorillonite and vermiculite phases. This is consistent with the OH band for water reported. Furthermore, the band at 3693.8 cm−1 is associated with O-H. This is consistent with the bands reported for the Si-OH and Al-OH groups of tetrahedral sheets of Montmorillonite and vermiculite silicate. This corroborates with the presence of Montmorillonite and vermiculite in the Bentonite clay established from XRD analysis.
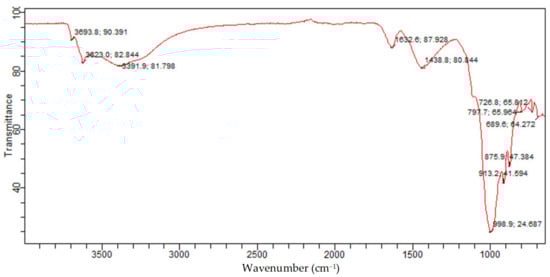
Figure 15.
Raw Bentonite FTIR spectrum.
Figure 16 presents the identified functional groups from the FTIR analysis and associated constituents for the molded Bentonite. The bands of the molded Bentonite clay show similar bands with those of the raw Bentonite clay. However, slight changes were observed in the molded Bentonite band. These changes could be attributed to the effect of the binder (Na2SiO3) used in molding the Bentonite clay, resulting in the structural change of the crystals.
Figure 16.
Molded Bentonite adsorbent FTIR spectrum.
From Figure 12, the bands at 726.8 cm−1 and 779.0 cm−1 were because of Si-O bending vibration and indicative of the Al-O-Si inner surface vibration of silicate of kaolinite quartz and Montmorillonite, which were similar to those reported in the literature for silicate of kaolinite and Montmorillonite phases. The bands at 872.2 cm−1, 909.5 cm−1, and 998.9 cm−1 are set to the Si-O-Al stretching mode and Al-Al-OH vibrations, indicating the presence of kaolinite and Montmorillonite silicate. These bands are similar to those reported. The bands at 1423.8 cm−1 and 1636.3/cm−1 are assigned to Si-O stretching and H-O-H bending, respectively. These bands are consistent with those of Montmorillonite silicate and water. The absorption bands at 3380.7 cm−1, 3619.2 cm−1, and 3693.8 cm−1 are attributed to asymmetric and symmetric stretching of structural hydroxyl groups, which are attributed to adsorbed crystal water in Montmorillonite and kaolinite phases of the Bentonite balls. This further confirms that after molding the Bentonite clay using Na2SiO3 as binder, the phase composition changes to Montmorillonite and kaolinite. The established band for the Montmorillonite and kaolinite phases of the Bentonite balls are consistent with those reported in the literature. Hence, the presence of Montmorillonite and kaolinite phases of the Bentonite balls portends the removal capacity for CO2 due to their high exchange capacity.
4.5. Result of Optimization Process for Enhanced Removal Efficiency
The response surface methodology (RSM) optimization of the process parameter of the flare emission capture plant was carried out using the Central Composite Design approach (CCD), with a three-level, three-factor (temperature, pressure, and time) experimental design. The Design Expert® 12 software package was utilized for implementing the RSM optimization. The experimental values of the factors in actual terms and the responses (removal efficiency of CO2, CO, NOx, and HC) are presented in Table 3. The novel plant RSM optimization result shows that 93.24% of CO2 and 62.18% of CO were absorbed, while 86.14% of NOx and 55.87% of HC were absorbed. The established optimum conditions of CO2, NOx, HC, and CO removal efficiency are 22 °C, 2 atm, and 60 min.
Table 3.
Experimental design and response factor of response surface CCD.
Table 3 shows the various experimental runs performed on the flare emission capture pilot plant in assessing the optimum parameter for emission removal efficiency. This indicates that the Akrosorb and Bentonite adsorbent used in the column has a relatively low affinity for hydrocarbon (HC) removal.
This was further demonstrated by the plot of predicted CO2, CO, NOx, and HC removal efficiency against the actual experimental CO2, CO, NOx, and HC removal efficiency values, as shown in Figure 17. From Figure 18, the data point was found to be very closer to the diagonal lines, which indicates the closeness of the model’s predicted result with that of the actual experimental results, which further demonstrates and validates the goodness of the fitted models.
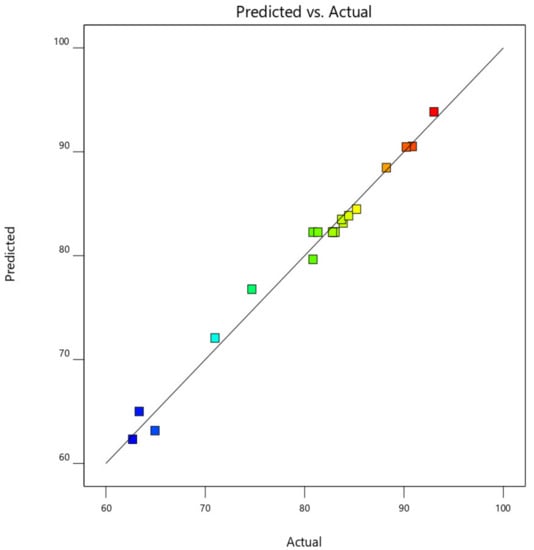
Figure 17.
Predicted against actual experimental response for CO2 removal efficiency.
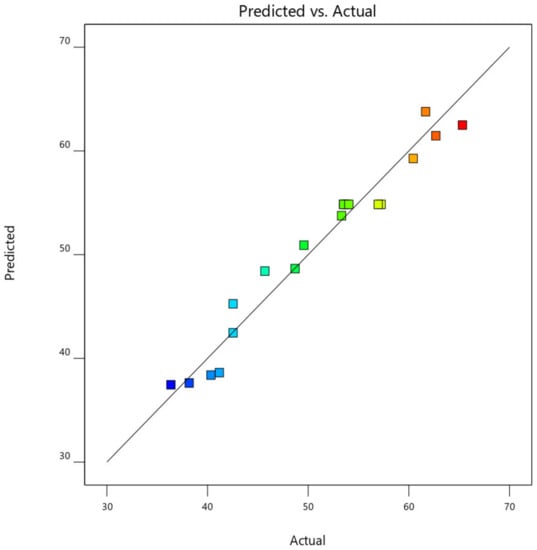
Figure 18.
Predicted against actual experimental response for CO removal efficiency.
4.5.1. Result of Optimum Process Parameter of Emission Removal Efficiency
The primary objective of the study is to optimize the process parameters for maximum CO2, CO, NOx, and HC removal efficiency by the pilot plant. As such, the process parameters were optimized using response surface CCD experiments. The optimization tool in the Design Expert 12 application package was used to determine the optimum parameter that maximizes CO2, CO, NOx, and HC removal efficiency using the optimum desirability function with the setup constraint for process parameters in the range of input examined in this study as show in Table 4, while the constraint for the responses was maximized for all responses. Table 5 and Figure 19 show the result of the optimization of the process parameter for maximum response.
Table 4.
RSM optimization of emission removal efficiency.
Table 5.
Results of experimental optimum validation of optimum process parameters.
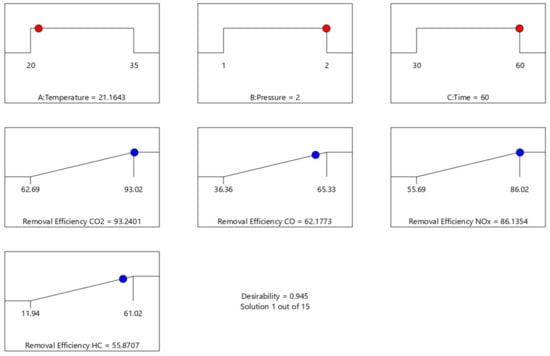
Figure 19.
RSM optimization ramps of emission removal efficiency.
Table 5 shows the optimization result generated at different experimental design points. The optimum condition of the process parameter that maximizes CO2, CO, NOx, and HC removal efficiency are 21.164 °C, 2 atm, and 60 min to give 93.24%, 62.18%, 86.14%, and 55.87% for CO2, CO, NOx, and HC removal efficiency, respectively, at a desirability factor of 0.945 (a mathematical method to find the optimum). Additionally, a Ramp plot, which is a graphical view of each optimal solution, was used to depict the established optimum process parameters as well as the responses depict in Figure 19.
4.5.2. Validation Result of the Optimized Process Parameter
A validation experiment was conducted to test and validate the reliability of the optimum process conditions of 22 °C, 2 atm, and 60 min obtained from the optimization study. The validation experiment was carried out in triplicate. The average experimental CO2, CO, NOx, and HC removal efficiencies were determined, as shown in Figure 19. The CO2, CO, NOx, and HC removal efficiencies obtained from the validation test were found to be very close to the predicted optimum values for CO2, CO, and NOx with less than 1% margin of error, except for and HC removal efficiency with about 9.4% margin of error. Hence, the results indicated that there is no significant difference between the established optimum and the experimental validation results. This shows that the RSM predictions were in good agreement with experimental values, and the developed model with minimum percent errors <1% for CO2, CO, and NOx and 9.4% error for HC removal efficiency. Therefore, this indicated that the optimization achieved in the present study was reliable, and the established optimum process parameters for CO2, CO, NOx, and HC removal efficiency are 22 °C, 2 atm, and 60 min.
4.6. Result of Analysis of Variance (ANOVA) for GHGs Removal Efficiency
The ANOVA was used to transform the single values into statistical values and to test the significant difference between the mean values of the inlet and outlet, within and among the compounds. Statistical analysis of the removal efficiency of the pilot plant was performed using ANOVA test to evaluate and check the effect of inlet and outlet gas concentration on the removal efficiency of the pilot plant. The results of the ANOVA test are summarized in Table 6.
Table 6.
ANOVA of the impact of inlet and outlet concentration of gases on removal efficiency.
The p-value, which is an index measuring the discrepancy of the strength of evidence against the null hypothesis (the hypothesis that there is no association between the factors and response variable), was examined. To quantify the strength of evidence against the null hypothesis, p < 0.05 (5% significance) is used as a standard level for concluding that there is evidence against the hypothesis tested. The significance difference at the inlet and outlet concentration on the removal efficiency was evaluate using p-values as well as F-value and F-critical value to examine the interaction strength of each parameter. From Table 6, it can be seen that the sample collection p-value is 0.9918 (p > 0.05), which indicates that the sample collection period is not significant and does not have an effect on the removal efficiency of the pilot plant. However, the p-value of the inlet and outlet concentration of the gases is 0.0074 (p < 0.05), which indicates that the inlet and outlet concentration of the gases is significant and has a significant effect on the removal efficiency of the pilot plant. Statistically, the variation in flare gas emission could impact the removal efficiency of the plant.
In addition, the interaction between the sample collection period and inlet and outlet concentration of the gases was examined to check the impact on removal efficiency of the plant. From Table 7, it was found that the p-value of the interaction between the sample collection and the inlet and outlet concentration of the gases is 0.9999 (p > 0.05), which indicates that there is no significant interaction between the sample collection period, inlet, and outlet concentration of the gases with the removal efficiency of the pilot plant. Therefore, this implies that the relationship between the sample collection period and inlet concentration has no significant effect on the removal efficiency of the pilot plant and that the removal efficiency is dependent on the inlet concentration of the flare gas emitted. The ANOVA estimated marginal means for the inlet and the outlet emission.
Table 7.
Kinetic parameters for CO2 adsorption using Akrosorb and molded Bentonite adsorbents.
4.7. Results of Adsorption Capacity
Figure 20 depicts the adsorption trend of CO2 gas in Akrosorb soda-lime and molded Bentonite ball adsorbents for 0–60 min and 35 °C temperature. A sharp rise in adsorption of CO2 was observed in the first 0–10 min to attain adsorption of 192.0 mg CO2/g and 38.35 mg CO2/g for Akrosorb soda-lime and molded Bentonite ball adsorbents, respectively. This could be attributed to the availability of a sufficient adsorption site per unit mass of adsorbent in the first 0–10 min of adsorption. In addition, for both Akrosorb soda-lime and molded Bentonite ball adsorbents, the rate of CO2 adsorption increases slightly from 192 to 286.40 mg/g and 38.35 to 65.87 mg/g respectively as time increases from 10 to 30 min. However, as the adsorption time increases beyond 30 min to 60 min, the curve for both Akrosorb soda-lime and molded Bentonite ball adsorbents tends to flatten, reaching maximum adsorption of 314.30 mg/g and 68.90 mg/g at 60 min. This is attributed to the fact that a further increase in time beyond 30 min resulted in the adsorption sites getting saturated gradually and the acceptance rate being regulated by the rate at which the CO2 gas is been moved from the exterior of the adsorbent to the internal part, and as such, the adsorption rate became much slower.
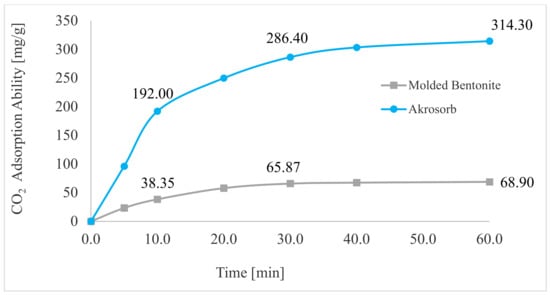
Figure 20.
CO2 adsorption capacity.
Furthermore, it was noted that the Akrosorb soda-lime adsorbent exhibited a higher adsorption capacity than the molded Bentonite balls adsorbent. This could be attributed to the higher surface and pore area associated with the Akrosorb soda-lime adsorbent with 1072 m2/g surface area when compared to that of the molded Bentonite adsorbent with 498.2 m2/g surface area, respectively. In addition, the pore volume of the Akrosorb soda-lime adsorbent was in the range of 0.02478–0.3810 m3/g, which was much higher than those of molded Bentonite balls adsorbents in the range of 0.02364–0.1770 m3/g, while the cumulative adsorption pore volume was also established from the Branuer–Emmett–Teller analysis to be 0.5444–0.5566 m3/g for the Akrosorb adsorbent, which was more than twice that of the molded Bentonite ball (0.2533–0.2665 m3/g). The low adsorption capacity associated with Bentonite could be attributed to the fact that Bentonite, though proven to be efficient in removing many toxic materials, particularly metallic, organic, and gaseous contaminants, has a low ability to absorb organic and gaseous molecules such as CO2 and the active site is not uniform. As such, a solution is needed to improve its adsorption performance. Hence, the adsorption rate for both Akrosorb soda-lime and molded Bentonite ball adsorbents decreases with increases in adsorption time due to the attainment of equilibrium.
4.8. Adsorption Kinetics
Adsorption kinetic, which is a measure of the adsorption uptake concerning the time at constant pressure and a measure of the diffusion of adsorbate (CO2 and other pollutant gases) in the pores is very vital in adsorption studies. Adsorption kinetic studies were done using Lagergren’s pseudo-1st order and pseudo-2nd-order kinetic models and the IPD model. A summary of the adsorption kinetic parameters is presented in Table 7. These are discussed subsequently.
4.8.1. Pseudo-1st-Order Models
Lagergren’s pseudo-1st-order model was employed to assess the adsorption kinetics of Akrosorb soda-lime and molded Bentonite ball adsorbents using Equation (2) to evaluate changes of adsorption. A straight-line plot of log (qe − qt) versus time (t) was done using the adsorption data generated from the test run. The kinetic parameters were obtained with the aid of Lagergren’s pseudo-first-order model, as shown in Table 8. Figure 18 presents the plot of the pseudo-first-order model for Akrosorb soda-lime and molded Bentonite ball adsorbents. The adsorption dynamics for the pseudo-first-order model Figure 21 show that the Akrosorb adsorbent experimental data fit well with an R2 value of 0.9973 compared to 0.8199 for molded Bentonite balls. This implies that the Akrosorb adsorbent well obeys the pseudo-1st-order model.
Table 8.
Intra-particle kinetic parameters for GHG adsorption in Akrosorb and molded Bentonite adsorbents.
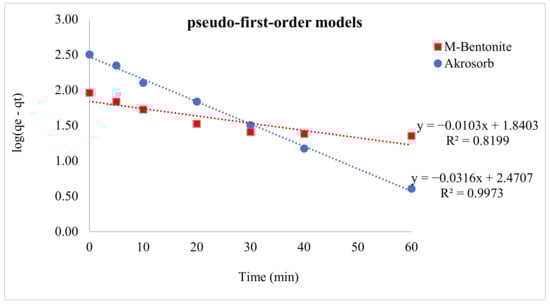
Figure 21.
Pseudo 1st-order kinetic models for CO2 adsorption.
The pseudo-first-order model describes the initial phase and the progress of adsorption. From Table 7, the first-order adsorption rate constant for Akrosorb soda-lime is 0.0729 min−1 and 0.0252 min−1 for molded Bentonite ball adsorbents. The high rate constant associated Akrosorb soda-lime when compared to molded Bentonite ball can be attributed to the material structure of Akrosorb adsorbents such as the higher pore surface and pore area. The Pseudo-1st-order adsorption rate constant associated with Akrosorb adsorbent implies a higher rate of adsorption of CO2 and other pollutant gases. This is further corroborated by the high adsorption capacity of approximately 26 L of carbon dioxide per 100 g of Akrosorb adsorbent. The high adsorption rate constant of 0.0729 min−1 for Akrosorb soda-lime shows the higher chances of collision with the binding sites of the Akrosorb adsorbent, which resulted in a higher initial sorption rate. In addition, the presence of mesoporosity in the Akrosorb adsorbent allows hosting target molecules of CO2, which in turn favor chemical exchange between the adsorbent and the CO2 molecules at the initial stage (0–10 min adsorption time) and increasing CO2 adsorption capacity.
4.8.2. Pseudo-2nd-Order Models
Lagergren’s pseudo-2nd-order model was used to evaluate the adsorption kinetics of Akrosorb soda-lime and molded Bentonite ball adsorbents to assess adsorption dynamics with the use of Equation (3). The Akrosorb soda-lime and molded Bentonite ball adsorbents data had R2 values of 0.9903 and 0.9892 respectively as depict in Figure 22.
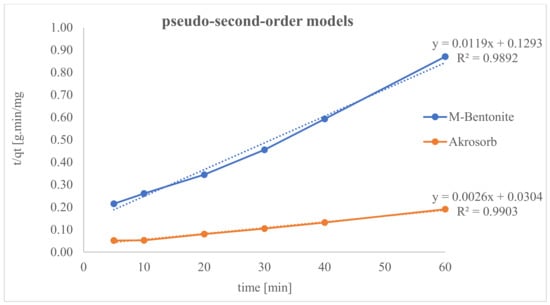
Figure 22.
Pseudo-second-order kinetic models for CO2 adsorption.
However, Akrosorb soda-lime adsorbent fits soundly with the pseudo-2nd-order model when related to molded Bentonite balls. This implies that 99.03% (R2 = 0.9903) of the Akrosorb adsorbent experimental data can be explained by the pseudo-2nd-order model, whereas 98.92% (R2 = 0.9892) of the molded Bentonite balls adsorbent experimental data can be explained by the pseudo-2nd-order model. In addition, from Table 7, the 2nd-order adsorption rate constant for Akrosorb soda-lime is 2.228 × 10⁻⁴ g/mg·min and 1.097 × 10⁻³ g/mg·min for molded Bentonite ball adsorbents. Hence, based on the R2 value, Akrosorb adsorbents are in the following order: pseudo-1st-order > pseudo-2nd-order kinetics. Meanwhile, those of molded Bentonite adsorbent is in the following order: pseudo-2nd-order > pseudo-1st-order kinetics model (see Figure 22).
4.8.3. Intra-Particles-Diffusion Models
The adsorption kinetics of Akrosorb soda-lime and molded Bentonite ball adsorbents was evaluated using the IPD model in Equation (4). The model gives an insight into various kinds of adsorption process mechanisms. This process can be illustrated in three basic steps: superficial adsorption, IPD, and the very fast stage, the final equilibrium.
Hence, if the plot of the experimental data shows multilinear plots, it is influenced by two or more steps of the adsorption process. Figure 23 presents the plot of the IPD model for both Akrosorb soda-lime and molded Bentonite adsorbent and shows their respective slope.
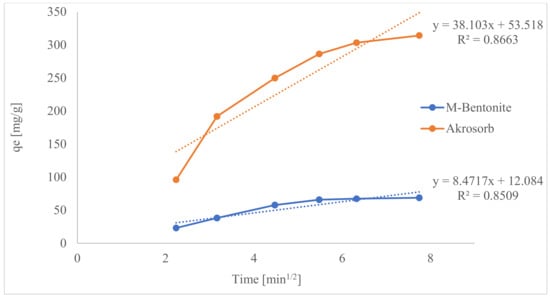
Figure 23.
Inter-particle diffusion models for CO2 adsorption.
From Figure 23, the multilinear plots indicate that IPD is not the only rate-limiting step in this adsorption process for both Akrosorb soda-lime and molded Bentonite adsorbent. It can be seen that the first steeper region, 2–3.2 min1/2 for Akrosorb and 2–4.5 min1/2 for molded Bentonite clay, could be attributed to surface sorption or superficial external adsorption, whilst the second region, 3.2–5.5 min1/2 for Akrosorb and 4.5–7.75 min1/2 for molded Bentonite balls, could be due to controlled of IPD. However, the third region, 5.5–7.75 min1/2 for Akrosorb could be attributed to equilibrium adsorption. This implies that the adsorption of CO2 and other pollutant gases by both Akrosorb soda-lime and molded Bentonite adsorbent is not limited by intra-particle diffusion alone. For Akrosorb adsorbent, the adsorption process is influenced by external or surface adsorption, intra-particle diffusion, and equilibrium stage.
Table 8 presents the intra-particle kinetic parameters for CO2 adsorption in Akrosorb and molded Bentonite adsorbents. The intra-particle diffusion constants for both Akrosorb soda-lime adsorbent (Kid1, Kid2, and Kid3) and molded Bentonite adsorbent (Kid1, and Kid2) are presented in Table 8. This depicts the diffusion speed in the stages of the adsorption process. The adsorption speeds in the 1st stage, Kid1 = 103.5250 mg/g·min1/2 for Akrosorb and Kid1 = 15.5266 mg/g·min1/2 for molded Bentonite, are greater than the rates of diffusion in the second stage (Kid2), which are 40.9424 mg/g·min1/2 and 3.0935 mg/g·min1/2. Meanwhile, the diffusion rate in the third stage for Akrosorb is much slower with Kid3 = 11.8199 mg/g·min1/2. This further shows that as the adsorption time rises, the rate of IPD reduces, and this is justified by the high adsorption capacity recorded at the early stage of the adsorption process. As such, IPD is carried out in the micro and mesopores, which results in a very high adsorption rate. The equilibrium plateau between CO2 and the Akrosorb and molded Bentonite adsorbent was reached, and it was slow in adsorption. Hence, CO2 is slowly transferred with intra-particle diffusion into the adsorbent particles.
Therefore, the rate of adsorption can be deduced to be controlled by diffusion within the particles, since the gradient did not pass through the origin. The intra-particle diffusion kinetics shows that the entire adsorption process is influenced kinetically and diffusional.
5. Conclusions
Gas flaring, resulting in the emission of CO2 and other GHG, has been of global concern, hence the need for improved CO2 and other GHG capture technology. This necessitates developing a novel pilot plant model for refinery flare emission capture with a novel adsorption column configuration using both Akrosorb soda-lime and Bentonite clay. A flare flue gas adsorption unit was designed, fabricated, test run, and commissioned with an Akrosorb soda-lime loaded top section, and molded Bentonite was loaded at the bottom of the adsorption column. This study introduced the use of two adsorbents Akrosorb soda-lime and Bentonite clays simultaneously for refinery flare flue gas capture and storage. The adsorption column configuration is an alternative gas flare-out technology to curtail GHGs, heat radiation, soot, global warming, climate change, ozone layer depletion, temperature inversion, as well as curtailing direct threats to human wealth, quality of life, and natural function of the ecosystem with no effect or destruction to existing flare network facilities, as it is retrofitted and operates without jeopardizing or compromising the refinery safety operation as well as being least costly compared to others, as it does not require energy to operate. The study used the batch adsorption process to examine the kinetics of CO2 adsorption from flue gas using Akrosorb soda-lime and Bentonite clay, as the combined usage of both adsorbents will enhance the capture of GHG at low cost compared to the use of Akrosorb alone as an adsorbent. The study also optimizes the column process parameters using an RSM central composite design of the experiment to maximize the removal efficiency for GHG. The pilot plant performance shows high CO2, CO, NOx, and hydrocarbon (HC) gases removal efficiencies from the test running and commissioning of the plant, and the pilot plant operation was satisfactory and operates within design operating conditions. However, the adsorbents in the column show a relatively low affinity for hydrocarbon (HC) removal. In addition, the surface area and crystallographic features of the Akrosorb soda-lime and Bentonite clay adsorbent show that Akrosorb contains mainly Ca(OH)2 with less CaCO3 in the portlandite and calcite phases. There is also a trigonal crystal system with hexagonal axes for portlandite and calcite phases, which portends the availability of more adsorption sites. The optimum process parameters that maximize CO2, CO, NOx, and HC removal efficiency are 21.164 °C, 2 atm, and 60 min with 93.24%, 62.18%, 86.14%, and 55.87% removal for CO2, CO, NOx, and HC, respectively. It was noted that the Akrosorb soda-lime adsorbent exhibited a higher adsorption capacity than the molded Bentonite balls adsorbent, which is attributed to the high surface area of exposure. The adsorption kinetics of the Akrosorb adsorbent is in the following order: pseudo-1st order > pseudo-2nd order kinetics. In contrast, that of molded Bentonite adsorbent is in the following order: pseudo-2nd order > pseudo-1st order kinetics model, while the intra-particle diffusion shows that the entire adsorption process is influenced kinetically and diffusional. The novel technology for GHG capture showed that it is technically feasible, scientifically justifiable, financially viable, socio-culturally acceptable, environmentally friendly, cost-effective, and reliably sustainable. Hence, the plant is recommendable for adsorbent regeneration and large-scale industrial adaptation and implementation and for retrofitting to existing flare units.
Author Contributions
Conceptualization, A.S. and I.A.M.D.; methodology, A.S.; software, A.S.; validation, A.S., and I.A.M.D.; formal analysis, A.S.; investigation, A.S.; resources, A.S.; data curation, A.S.; writing—original draft preparation, A.S.; writing—review and editing, I.A.M.D.; visualization, A.S.; supervision, I.A.M.D.; project administration, I.A.M.D.; funding acquisition, A.S. All authors have read and agreed to the published version of the manuscript.
Funding
This research was funded by Petroleum Technology Development Fund, Nigeria, grant number 944.
Institutional Review Board Statement
No any ethical issue. Not applicable.
Informed Consent Statement
Not applicable.
Data Availability Statement
The study did not report any data.
Acknowledgments
Sincere appreciation goes to the research sponsor Petroleum Technology Development Fund (PTDF) Nigeria and special thanks go to the Nigerian refineries management and staff of the College of Engineering Brunel University London. Mini refinery staff of Ahmadu Bello University Zaria, Nigeria.
Conflicts of Interest
I declare no conflict of interest. I also declare that The funders had no role in the decision to publish the results. I hereby declare that the entire work was developed in an effort to meet the requirement for PhD and there no any conflict of interest.
References
- Younas, M.; Sohail, M.; Kong, L.L.; Bashir, M.J.K.; Sethupathi, S. Feasibility of CO2 adsorption by solid adsorbents: A review on low-temperature systems. Int. J. Environ. Sci. Technol. 2016, 13, 1839–1860. [Google Scholar] [CrossRef]
- Ben-Mansour, R.; Habib, M.; Bamidele, O.; Basha, M.; Qasem, N.; Peedikakkal, A.; Laoui, T.; Ali, M. Carbon capture by physical adsorption: Materials, experimental investigations, and numerical modeling and simulations—A review. Appl. Energy 2016, 161, 225–255. [Google Scholar] [CrossRef]
- Wang, Y.; Zhao, L.; Otto, A.; Rubinius, M.; Stolten, D. A Review of Post-combustion CO2 Capture Technologies from Coal-fired Power Plants. Energy Procedia 2017, 114, 650–665. [Google Scholar] [CrossRef]
- Foroutan, R.; Zareipour, R.; Mohammadi, R. Fast adsorption of chromium (VI) ions from synthetic sewage using bentonite and bentonite/bio-coal composite: A comparative study. Mater. Res. Express 2018, 6, 025508. [Google Scholar] [CrossRef]
- Saidi, M.; Siavashi, F.; Rahimpour, M. Application of solid oxide fuel cell for flare gas recovery as a new approach; a case study for Asalouyeh gas processing plant, Iran. J. Nat. Gas Sci. Eng. 2014, 17, 13–25. [Google Scholar] [CrossRef]
- Ferdrin, J. Utilization of Gas Resources in Qatar: A Decade of Planned Development and Integration. In Proceedings of the Middle East Oil Technical Conference and Exhibition, Manama, Bahrain, 11–14 March 1985. [Google Scholar] [CrossRef]
- Branco, D.A.C.; Szklo, A.S.; Schaeffer, R. Co2e emissions abatement costs of reducing natural gas flaring in Brazil by investing in offshore GTL plants producing premium diesel. Energy 2010, 35, 158–167. [Google Scholar] [CrossRef]
- Khalilpour, R.; Karimi, I. Evaluation of utilization alternatives for stranded natural gas. Energy 2012, 40, 317–328. [Google Scholar] [CrossRef]
- Bauer, M.; Köck, M.; Jörg, K.; Ramakrishnan, C.; Mestiri, Y.; Scheed, A. Flare Gas Recovery in Tunisia—From Liability to Value. Oil Gas Facil. 2012, 1, 44–51. [Google Scholar] [CrossRef]
- Rahimpour, M.R.; Jokar, S.M. Feasibility of flare gas reformation to practical energy in Farashband gas refinery: No gas flaring. J. Hazard. Mater. 2012, 209-210, 204–217. [Google Scholar] [CrossRef]
- Friedman, J.; Manager, P. A Resource Guide for State Energy Officials National Association. In Combined Heat and Power; U.S. Environmental Protection Agency: Arlington, VI, USA, 2013. [Google Scholar]
- Davoudi, M.; Rahimpour, M.; Jokar, S.; Nikbakht, F.; Abbasfard, H. The major sources of gas flaring and air contamination in the natural gas processing plants: A case study. J. Nat. Gas Sci. Eng. 2013, 13, 7–19. [Google Scholar] [CrossRef]
- Onwuka, E.I.; Iledare, O. Nigeria Gas to Power Value Chain Systems Economic Evaluation and Modeling. In Proceedings of the All Days, Lagos, Nigeria, 4–6 August 2015. [Google Scholar] [CrossRef]
- Khanipour, M.; Mirvakili, A.; Bakhtyari, A.; Farniaei, M.; Rahimpour, M.R. Enhancement of synthesis gas and methanol production by flare gas recovery utilizing a membrane-based separation process. Fuel Process. Technol. 2017, 166, 186–201. [Google Scholar] [CrossRef]
- Ghasemikafrudi, E.; Amini, M.; Habibi, M.R.; Hassankiadeh, Q.D. Environmental effects and economic study on flare gas recovery for using as fuel gas or feedstock. Pet. Coal. 2017, 59, 18–28. [Google Scholar]
- Ibrahim, A.Y.; Ghallab, A.O.; Gadalla, M.A.; Makary, S.S.; Ashour, F.H. Technical and economical/financial feasibility analyses of flared gas recovery in Egypt from oil and gas industry from international/national oil companies’ perspectives. Clean Technol. Environ. Policy 2017, 19, 1423–1436. [Google Scholar] [CrossRef]
- Allamaraju, J.P.; Mukherjee, R. Successful Implementation of Flare Gas Recovery Systems in Gasco Plants. In Proceedings of the Abu Dhabi International Petroleum Exhibition & Conference, Abu Dhabi, United Arab Emirates, 7–10 November 2016; Society of Petroleum Engineers: Dallas, TX, USA, 2016. [Google Scholar] [CrossRef]
- Hajizadeh, A.; Mohamadi-Baghmolaei, M.; Azin, R.; Osfouri, S.; Heydari, I. Technical and economic evaluation of flare gas recovery in a giant gas refinery. Chem. Eng. Res. Des. 2018, 131, 506–519. [Google Scholar] [CrossRef]
- Zolfaghari, M.; Pirouzfar, V.; Sakhaeinia, H. Technical characterization and economic evaluation of recovery of flare gas in various gas-processing plants. Energy 2017, 124, 481–491. [Google Scholar] [CrossRef]
- Mahamid, M.; Triandafilou, N.; Brindley, T. Challenges and Constructability Solutions for New Flare Gas Recovery Modifications in Oil and Gas Refineries: Case Studies for Five Different Flare Stacks. Pr. Period Struct. Des. Constr. 2018, 23, 05017004. [Google Scholar] [CrossRef]
- Romano, M.C.; Anantharaman, R.; Arasto, A.; Ozcan, D.C.; Ahn, H.; Dijkstra, J.W.; Carbo, M.; Boavida, D. Application of Advanced Technologies for CO2 Capture from Industrial Sources. Energy Procedia 2013, 37, 7176–7185. [Google Scholar] [CrossRef]
- Wang, J.; Yang, P. Potential flue gas desulfurization gypsum utilization in agriculture: A comprehensive review. Renew. Sustain. Energy Rev. 2018, 82, 1969–1978. [Google Scholar] [CrossRef]
- Míguez, J.L.; Porteiro, J.; Pérez-Orozco, R.; Patiño, D.; Rodríguez, S. Evolution of CO2 capture technology between 2007 and 2017 through the study of patent activity. Appl. Energy 2018, 211, 1282–1296. [Google Scholar] [CrossRef]
- MacDowell, N.; Florin, N.; Buchard, A.; Hallett, J.; Galindo, A.; Jackson, G.; Adjiman, C.S.; Williams, C.K.; Shah, N.; Fennell, P. An overview of CO2 capture technologies. Energy Environ. Sci. 2010, 3, 1645–1669. [Google Scholar] [CrossRef]
- Rolfe, A.; Huang, Y.; Haaf, M.; Rezvani, S.; MclIveen-Wright, D.; Hewitt, N. Integration of the calcium carbonate looping process into an existing pulverized coal-fired power plant for CO2 capture: Techno-economic and environmental evaluation. Appl. Energy 2018, 222, 169–179. [Google Scholar] [CrossRef]
- Hossain, S.M.Z.; Hossain, M.M.; Razzak, S.A. Optimization of CO2 Biofixation by Chlorella Vulgaris Using a Tubular Photobioreactor. Chem. Eng. Technol. 2018, 41, 1313–1323. [Google Scholar] [CrossRef]
- Abdullahi, A.; Alhassan, M.; Isah, A.G.; Sani, K.A.; Olalekan, O.A. Comparative studies on the kinetics of biogas purification using activated Carbon and Zeolite. IOP Conf. Ser. Earth Environ. Sci. 2018, 173, 012046. [Google Scholar] [CrossRef]
- Romero, J.R.G.; Moreno-Piraján, J.C.; Gutierrez, L.G. Kinetic and Equilibrium Study of the Adsorption of CO2 in Ultramicropores of Resorcinol-Formaldehyde Aerogels Obtained in Acidic and Basic Medium. C J. Carbon Res. 2018, 4, 52. [Google Scholar] [CrossRef]
- Ho, Y.S.; Ng, J.C.; McKay, G. Kinetics of Pollutant Sorption by Biosorbents: Review. Sep. Purif. Methods 2000, 29, 189–232. [Google Scholar] [CrossRef]


Publisher’s Note: MDPI stays neutral with regard to jurisdictional claims in published maps and institutional affiliations. |
© 2021 by the authors. Licensee MDPI, Basel, Switzerland. This article is an open access article distributed under the terms and conditions of the Creative Commons Attribution (CC BY) license (https://creativecommons.org/licenses/by/4.0/).