Abstract
Femoral neck fractures have a high incidence in the geriatric population and are associated with high mortality and disability rates. With the minimally invasive nature, internal fixation is widely used as a treatment option to stabilize femoral neck fractures. The fixation effectiveness and stability of the implant is an essential guide for the surgeon. However, there is no long-term reliable evaluation method to quantify the implant’s fixation effect without affecting the patient’s behavior and synthesizing long-term treatment data. For the femur’s symmetrical structure, this study used 3D convolutional networks for biomedical image segmentation (3D-UNet) to segment the injured femur as a mask, aligned computerized tomography (CT) scans of the patient at different times after surgery and quantified the displacement in the specified direction using the generated 3D point cloud. In the experimental part, we used 10 groups containing two CT images scanned at the one-year interval after surgery. By comparing manual segmentation of femur and segmentation of femur as a mask using neural network, the mask obtained by segmentation using the 3D-UNet network with symmetric structure fully meets the requirements of image registration. The data obtained from the 3D point cloud calculation is within the error tolerance, and the calculated displacement of the implant can be visualized in 3D space.
1. Introduction
Femoral neck fractures (FNFs) constitute a common surgical trauma worldwide, with a patient population of 1.6 million per year and growing annually [1]. Aging people have a high incidence of femoral neck fractures due to their tendency to low-energy fall and high prevalence of osteoporosis prevalence [2]. Previous epidemiological studies have indicated that the incidence is approximately twice as high in females as in males [3]. Particularly with the aging of the population in all countries, the prevalence of femoral neck fractures increases over the years, accompanied by high mortality and disability rates [4]. It is expected that by 2050, the number of patients with FNFs will exceed 6 million worldwide [5], which will account for a significant proportion of orthopedic work and constitute a health care burden significant in terms of socio-economic impact.
Plastic surgery literature now agrees that cannulated screws and the dynamic hip screw (DHS) are the most commonly used treatment modalities for stable fractures classified as Garden I or II [6]. The internal fixation is minimally invasive compared to total hip arthroplasty (THA) and can significantly reduce the postoperative hospital stay [7,8]. Nevertheless, the use of internal fixation hip implants is associated with medium to long-term surgical complications such as chondrolysis, osteonecrosis, avascular necrosis, and mechanical failure of the implant, accompanied by a high rate of rehospitalization and reoperation [9,10,11].
Much literature has been presented to analyze and study internal fixation results with hip implants. Marco Bigoni et al. analyzed postoperative patient mortality, complications, and reoperation rates statistically by following 244 elderly patients who underwent internal fixation with implants over 10 years from January 2008 to December 2018 [12]. The results indicate that internal fixation effectively stabilizes femoral neck fractures, and the patient’s postoperative mortality and complication rates are only associated with individual patient comorbidities. Ref. [13] has conducted mechanical simulations of implants for the treatment of stable femoral neck fractures using synthetic bones. That study evaluated hip implants’ ability with different configurations by limiting relative motion at the fracture site using a manual hydraulic press to simulate hip compression, i.e., to measure the amount of resistance of the pins. In the experimental part, the femur’s stability was compared between two internal fixation systems by simulating force by the spine to the femur, with one of the internal fixation systems using two parallel cannulated screws and the other framework using three cannulated screws forming a pyramidal shape. In [14], the authors modeled the fracture with segmented human cadaveric femora. Using the servo-hydraulic device to simulate the force components in the frontal and sagittal planes in human gait motion, they measured the displacement of both internal fixation systems at different loads. Moreover, Jiantao Li et al. proposed a method analyzing five different implant configurations using a finite element approach [15]. They evaluated the mechanical properties such as stress and strain in different postoperative weight-bearing states of patients by computer simulation. In contrast, ref. [16] analyzed the stresses applied to the femur and related tissues under different fracture types after internal fixation of femoral neck fractures from a biomechanical perspective. It assessed the mechanical stability of mainstream fixation techniques such as cannulated screws, hip screw systems, proximal femur plates, and cephallomedullary nails.
Among these evaluation methods, the use of statistics to evaluate treatment effectiveness cannot provide specific reasons for pins’ failure and requires a large number of experimental samples as a basis for analysis. Mechanical simulations using synthetic bones, cadaveric femora, and finite element-based 3D models all use a simulated stress environment. Obviously, the simulated environment is different from the patient’s real behavioral movement after surgery and can only use a limited number of parameters and simulated stresses in a single scenario. What is more, it takes months or years of data collection to assess the effectiveness of internal fixation on patients accurately, which is very difficult for mechanical simulation experiments.
Computed tomography scans provide realistic information about the displacement of implants in the patient’s body after surgery. The acquisition of computerized tomography (CT) scan does not place an additional load on the patient’s daily movements. Traditionally, however, the measurement of fracture displacement or implant displacement in the body is mainly performed by the surgeon in CT medical images, selecting a reference, measuring the target object’s distance relative to the reference in different CT sequences, and calculating the displacement. In [17], the authors acquired two sets of chest computed tomography scans, CT1 and CT2, at an interval of 84 days. The distance of the rib’s outer cortex was measured in three planes, using the site of the rib fracture as a reference point to verify that rib fractures become more displaced over time. A similar approach was used by Bugaev and Nikolay et al. to measure axial displacement, sagittal displacement, and coronal displacement, and then they calculated the (Euclidean) distance using the Pythagorean formula [18]. In the literature [19], digital calipers and a protractor were used to measure foot fractures within the CT images’ coronal plane. This manual method of measuring implant displacement is complex and time-consuming to perform, and the accuracy of the measurement results is susceptible to subjective influence by the surgeon.
This paper presents a method for evaluating internal fixation implants based on CT medical image analysis. The Hansson pins system is used as the study object to quantify the implant’s movement after surgery and to analyze the effectiveness of the internal fixation system. Our method allows us to analyze the movement of the implant in a specific direction with low impact on the patient, based on real patient data.
2. Materials and Methods
2.1. Creation of Data Sets
In this paper, we constructed Dataset A and B for training the segmentation models of the left and right femur, respectively, and Dataset C for femur registration and displacement measurement of the implant. In the segmentation femur stage, this paper uses 3D-UNet, a semantic segmentation framework, which differs from the instance segmentation framework; 3D-UNet can only classify pixels in an image. In our study, if the dataset used for training does not partition anatomically left and right, the trained model will also label the healthy femur that is symmetrical with the injured femur as the target object. While in Section 2.2, the mask required for fine registration is only the femur that is fixed with the implant. To avoid registration failure, we construct the left femur and right femur datasets separately and train two segmentation models for the left and right femurs.
2.1.1. Dataset A and B
High-quality medical image collection is challenging due to the need to protect patient privacy and data security. Additionally, the annotation of images requires a large number of experienced surgeons; therefore, it is quite costly to integrate high-quality annotated data, limiting the development of medical image segmentation algorithms, which has become an accepted fact in the field of medical image research [20]. Consequently, no publicly available medical image datasets specifically for femoral fractures are available. However, some of the images in the dataset that are currently publicly available for other research purposes contain the femur we need. In these raw CT images, in addition to containing the entire left and right femur, adjacent tissues and organs such as the pelvis, spine, and ribs are also included. Which can considerably increase the GPU’s memory usage, making it necessary for us to extract regions of interest (ROIs), i.e., image information that contains only femur parts. Furthermore, we need to label the femur information as ground truth for training manually.
We used Pelvic Reference Data, a free dataset used for commercial, scientific, and educational purposes, as the original data [21,22]. This dataset was created to serve as a reference for the rigid registration of clinical images. The process of removing irrelevant information from CT images is shown in Figure 1.
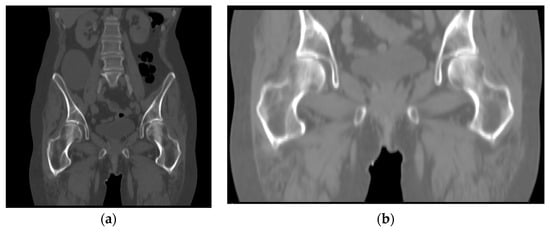
Figure 1.
Cropping of CT images: (a) raw CT data in Pelvic Reference Data, including symmetrical femur, pelvis, spine, etcetera; (b) cropped CT images.
Figure 2 displays the coronal images viewed from the anterior side. The complete image (b) is shared between the two datasets, and as a complement, each of the two datasets also contains unique left femur (a) and right femur (c). In this way, we can simply expand the dataset and accurately distinguish between left and right femur when segmenting CT images that contain a complete structure. By removing the data with poor image quality, in Dataset A, we ended up with 112 images of the left femur, of which 84 images were used for training, and 28 images formed the validation set. Similarly, 113 images were collected in Dataset B. A total of 85 images were used for training, and 28 images were used for validation. Subsequently, manual annotation of the femur for the constructed dataset.

Figure 2.
Coronal images viewed from the anterior side: (a) left femur; (b) images shared by both datasets; (c) right femur.
2.1.2. Dataset C
In Dataset C, we collected 10 cases from March 2012 to January 2015 provided by Hyogo Prefectural Awaji Medical Center. Each case underwent two CT scans after internal fixation surgery and one year later.
All cases associated with intracapsular fractures and the patient’s age ranged from 69 to 65 years. These cases all used the Hansson Pin System (Hansson Pins, Swemac, Linköping, Sweden) [23]. Hansson pin is a 6.5-diameter unthreaded nail with various specifications and the length ranging from 75 to 150 mm. The implant has an integrated hook on each pin’s tip that deploys to provide rotational stability of the femoral head following insertion. Typically, using two pins for fixing and screwing out the hook pins when fixing (Figure 3). Table 1 lists information such as the patient’s age and the pins used.
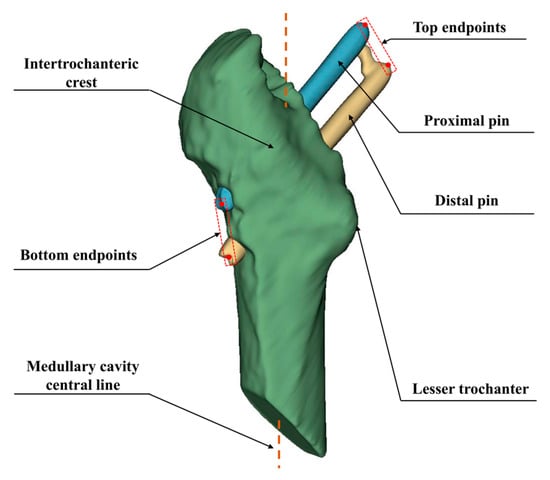
Figure 3.
The position of Hansson pins in the anatomy of the femur.

Table 1.
The length of pins and information of patients in each case.
Figure 4 illustrates the different situations during a CT scan. Generally, in the examination during the recovery period from surgery, the CT data is cropped and transformed to provide a clearer and faster diagnosis, that is, a localized CT image of the left or right femur. In contrast, the complete femur and pelvis are sometimes retained in the CT image to visualize information around the fracture site. To obtain high robustness of the trained femur segmentation model and avoid the femur segmentation failure in the next step, we convert all images to the right, anterior, superior (RAS) anatomical coordinate system and use empty images to supplement the missing parts.
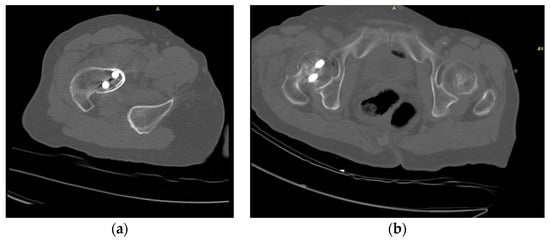
Figure 4.
The partial CT image versus the complete CT images: (a) partial CT images containing a single femur; (b) CT images containing the complete femur structure.
2.2. Registration of the Femur
For measuring the postoperative displacement of the Hansson pins, it is necessary to select a reference with rigid morphological properties. Depending on the setting in which the Hansson pin is used, the shape and X-ray absorptivity of the proximal femur does not change unless structural damage occurs, which satisfies the requirements for use as a reference. Femur image registration is the transfer of images containing femur and implants from the same patient at different times, different scanning devices, different scenes, and others to the same spatial coordinate system and strict alignment with femur as the reference. After this transformation, it is possible to measure the position information of Hansson pins at different times.
Typically for CT image alignment, at least two sets of images containing the same target information are required. The matching criterion is to achieve maximum similarity between the fixed and floating images, a combination of feature space matching algorithm, spatial search algorithm, optimization algorithm, and similarity measure. Commonly used rigid medical image registration algorithms include point set matching based, a genetic algorithm-based, and mutual information-based 3D image registration. The alignment of the femur image in this paper is rigid, i.e., no affine transformation of the graph is required, which requires high alignment accuracy.
We choose a multi-resolution framework, which uses negative mutual information as the similarity metric function. The framework contains four parts: spatial transformation module, similarity metric module, interpolator, and optimizer, as shown in Figure 5.
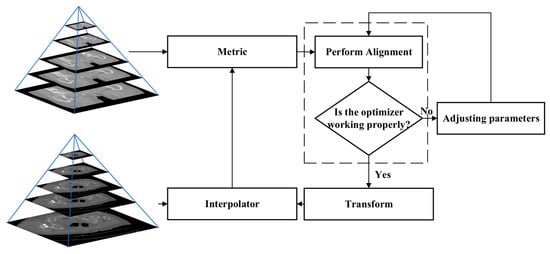
Figure 5.
Pyramid multi-resolution framework.
This framework is widely used in medical image registration due to its high accuracy, robustness, and fast alignment speed. Its core idea is to input the images in the fixed image pyramid and floating image pyramid into the framework layer by layer. An optimizer is used to drive the alignment process, and an interpolator is used to map the floating images into the new coordinate system [24,25].
The method of negative mutual information in the similarity measurement module was proposed by Mattes et al. in 2003. Mutual information forms a continuous histogram estimate of the underlying grayscale image using the Parzen window virtually eliminates the effect on the similarity calculation due to interpolation quantization and binary data discretization during the image space transformation. Image registration can be seen essentially as the process of minimizing the negative similarity function. When we define the set of discrete grayscales for a fixed image as and the set of discrete grayscales for a floating image as , the negative similarity function model can be expressed as
where is the joint distribution function, which can be calculated from the values of the Parzen window cubic spline and zero-order B-splines. are the grayscale values in and , respectively. is the floating image edge probability distribution and is the fixed image edge probability distribution. is the image transformation parameter.
Mattes mutual information function has continuously differentiable characteristics. The optimizer needs to meet the conditions of high speed, low resource consumption, and high robustness to obtain the optimal spatial transformation parameters. Therefore, we choose a multi-resolution algorithm as the optimization search strategy. In this section, we select the patient’s CT images before the one-year recovery period as fixed images and the CT data after the one-year recovery period as floating images to construct the Gaussian pyramid. Gaussian pyramids are constructed using Gaussian smoothing and downsampling to create a series of images of varying sizes. These images form a pyramid model from large to small and from bottom to top, as the fixed image and floating image modules present in Figure 5.
We take the original fixed image and floating image as the bottom level 0 of the pyramid, and after the discrete low-pass filter calculation, an upper level 1 of the upper pyramid is obtained, and the iterative process is repeated. For getting the Gaussian pyramid layer , it is necessary to perform Gaussian low-pass filtering on its previous level image and then downsample it by inter-row and inter-column, usually for removing pixels in even rows and even columns of the image. The mathematical expression is
where is the number of Gaussian pyramid layers, and are the number of rows and columns of the image of the ith layer of the Gaussian pyramid, respectively; is a two-dimensional 5 × 5 window function with the expression as
When two 3D images containing femur are input to the framework, the registration range defaults to the whole image, and the optimal spatial transformation parameters obtained after iteration corresponds to the global search space. In other words, although the spatially transformed floating image matches the fixed image, the purpose of our study is to align the femur. The tissues or organs around the pelvis, such as the pelvic bone, will significantly affect the similarity calculation. In this case, the spatial transformation mostly matches the pelvis’s position rather than the proximal femur. Therefore, we use the above framework to perform coarse alignment on the images containing the femur. After that, we use the femur’s mask and perform fine registration on the region containing the only femur.
2.3. D-UNet Framework
To extract the region of interest, we segmented the proximal femur without the femoral head in the patient’s CT images using a model trained by the 3D-UNet framework.
3D-UNet is an end-to-end training model proposed by Özgün Çiçek et al., which is mainly used for semantic segmentation of medical images [26]. The model inherits the features of the 2D-UNet network by using encoder and decoder structures to extract features and recover the semantic feature maps into volumetric images with the same resolution as the original images. Compared with the 2D-UNet network, 3D-UNet uses the image interlayer information to ensure the continuity of mask changes in adjacent images. Moreover, different from the fully convolutional network, which only deconvolutes the feature map, 3D-UNet achieves the multi-scale feature recognition of image features by the symmetric structure of four downsampling and four upsampling, and the skip connection method, i.e., it fuses the shallow features of the same scale in the encoder and the in-depth features from the upsampling to avoid the loss of edge information. The downsampled low-resolution information provides contextual information to the target, and the upsampled high-resolution features improve the network’s ability to recognize edge information such as gradients. Figure 6 illustrates the 3D UNet network framework used in this paper. In the encoder structure, we set the network structure to 5 layers, and the number of channels in each layer is 16, 32, 64, 128, and 256, respectively.
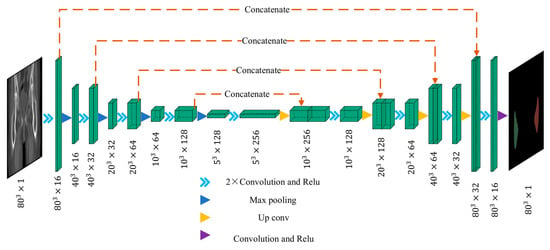
Figure 6.
The framework of a symmetrical structure of a five-layer network with 1 channel for both input and output and a volume of 80 × 80 × 80.
This study uses dice loss as the loss function, which is widely used in neural networks for medical image segmentation. Dice score coefficient (DSC) is used to evaluate the degree of overlap of two samples, and in binary semantic segmentation, the segmentation effect is evaluated based on ground truth [27]. Hence, we can maximize the overlap of two samples using . Dice loss was first proposed and used in the VNet framework by Milletari et al. and is defined as
where and represent the predicted label and ground truth of each voxel, respectively, during the training process. is the number of voxels in the input image.
CT images vary depending on patient condition and scanner model. The output segmented femur is often accompanied by segmentation noise, as shown in Figure 7. The noise appears as small, separated coherent voxels. The model outputs segmented images in which the femur has the largest number of coherent voxels. To correct this problem of non-femur parts being incorrectly identified, we retain only the largest coherent components in the post-processing of the model output. The mathematical model can be expressed as
where is a function to calculate the maximum number of contiguous adjacent voxels.
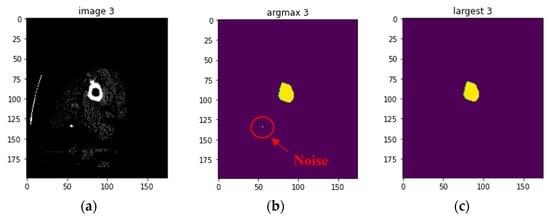
Figure 7.
In post-processing, remove noise from the image: (a) input images; (b) output image with noise; (c) output image with maximum coherence preserved.
2.4. Principal Component Analysis (PCA)
Based on the aligned CT images, the Hansson pins were reconstructed as a 3D model. We use the point cloud data to calculate the displacement distance after locating the endpoints of the pins. In this subsection, we apply the principal component analysis method to fit the pins’ axes, as shown in Figure 8. The point cloud size and the obtained axes are used to draw the outer envelope of the pins, and the point intersecting the envelope in the direction of the axes is the endpoint of the pins.
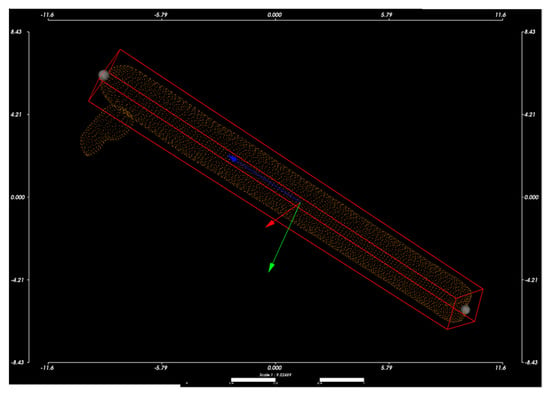
Figure 8.
The pin’s axis and the outer bounding box of the pin intersect are the two endpoints of the implant.
The principal component analysis is a multivariate statistical method commonly used for dimensionality reduction of multidimensional data [28]. The main principle is that the m-dimensional feature vector is mapped to the n-dimensional vector using the orthogonal transformation. This n-dimensional vector is an orthogonal vector constructed based on the original features, where the first vector is the direction with the most considerable variance in the original data.
The algorithm is:
- Input:
- •
- M-dimensional sample set ;
- •
- The number of dimensions n to be dimensioned down to.
- Output: reduced-dimensional sample set .
- Steps:
- Standardize all variables.
- Calculation of covariance matrix.
- Computes the eigenvectors and eigenvalues of the covariance matrix.
- Select the largest n vectors normalized to form a new matrix .
- Transform the original matrix.
- Output sample set .
We define a single point in the point cloud as . The point cloud can be represented as a sample set , by inputting into the PCA algorithm above, we solve the feature vectors () and form the orthogonal matrix after standard orthogonalization of each feature vector. , , and are the main directions of the input point cloud, and the center of mass of the point cloud is taken as the origin of the new coordinate system. Using the point cloud’s center of mass as the origin of the coordinate system, , , and as the axes to form the coordinate system shown in Figure 8, where is the blue axis, , is the green axis, and is the blue axis. The original point cloud data is converted to the new coordinate system using Equation (7). Subsequently, the red enclosing box is constructed according to the point cloud’s maximum and minimum values in the three directions of X, Y, and Z.
3. Experiment
3.1. Input of Images and Training of Segmentation Models
In general, CT images are obtained by data transformation of scanning devices according to the different X-ray beam absorption coefficients of human organs or tissues. The coordinate system origin and voxel spacing of the generated CT images vary depending on the scanning device. The 3D-UNet framework cannot extract voxel spacing as feature information, so we resample the data in Dataset A and B to the same voxel spacing, which is called the specified spacing. To minimize the loss of image detail due to the decrease in slices caused by increasing the specified spacing, we resampled the voxel spacing to 1.5 × 1.5 × 1.5 mm.
The images’ orientation may vary from case to case when the training data is input to the neural network. Here, we use the RAS coordinate system to ensure the input data orientation’s consistency. In addition, to simplify the feature extraction process of the 3D-UNet network and reduce the impact of femoral edge blur on the segmentation, we remove the information beyond 20HU-220HU from the CT images and convert the intensity range of the remaining information to (0,1). The processed images and labels are illustrated in Figure 9.
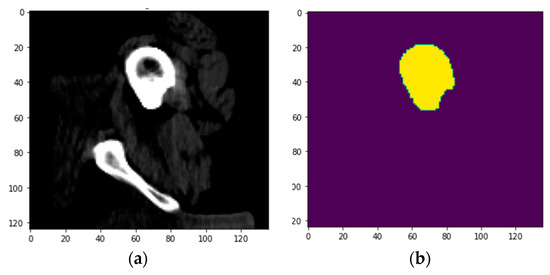
Figure 9.
Pre-processed images and femur labels: (a) preserved images of 20-220 Hounsfield unit values; (b) ground truth of femur.
In this paper, the 3D-UNet network is set to five layers, so the size of each input image size should be a multiple of 16. Considering the image’s size after specified spacing resampling, we use cropping to augmentation the dataset in this section, and the cropped image size is (80, 80, 80). 3D-UNet has the features of requiring less training data and good results for medical image segmentation. Published literature indicates that the 3D-UNet network can still achieve good segmentation results when a small number of datasets are used for learning [26]. Thus, we did not use methods other than random crops for data augmentation.
The datasets A and B separately input into the 3D-UNet framework of the previous session for training. In this section, we implement the framework using MONAI, an open-source framework based on PyTorch [29]. The training yields the left femur segmentation model and the right femur segmentation model, respectively. The images in Dataset C were segmented using each of the two trained models according to the femur’s left and right positions with internal fixation using Hansson pins. The segmentation information of the injured femur was collected as mask data for the next step.
3.2. Registration of References
The CT data acquired postoperatively as fixed images, and the CT data scanned one year later as floating images were simultaneously inputted into the mutual information registration framework in the previous section for coarse alignment. The coarse alignment result is used as input, and the femur segmentation data from the previous step is used as masks for fine alignment of the images. To avoid the influence of mask edge information on the alignment, we use a kernel of size (27 × 27 × 27) to perform morphological collision processing on the mask.
To verify that segmenting femur by the model can provide an accurate mask for fine alignment, we add an experiment to manually labeled femur as the mask for fine alignment and compare the effect of both masks on fine registration.
The fixed image and floating image after fine registration are shown in Figure 10. In the two CT images after alignment, the proximal femur parts without the femoral head are overlapped and served as the reference. Observed in 3D space, the proximal pin and distal pin are in the same spatial coordinate system, and after 3D reconstruction, the voxel data of pins in CT are transformed into point cloud data, as shown in Figure 11.
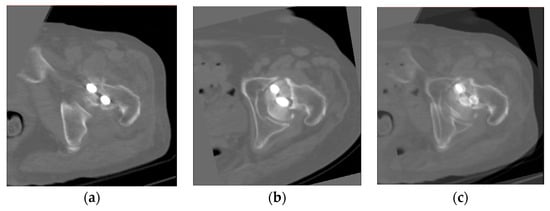
Figure 10.
CT images after registration: (a) fixed images; (b) fine-aligned floating images; (c) the two images in the coordinate system with the overlapping femur as the reference.
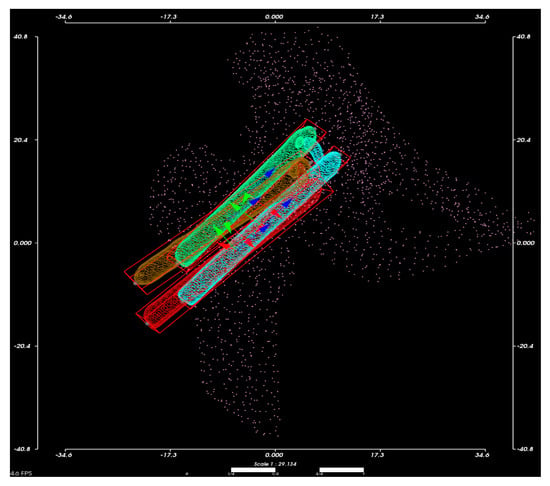
Figure 11.
3D point clouds of proximal pins and distal pins in the same spatial coordinate system for both previous and posterior CT images. The purple point cloud is part of the proximal femur and pelvis. The green and blue point clouds represent the proximal and distal pins obtained from the first postoperative CT scan. Gold and red point clouds represent the proximal and distal pins from the second CT image after the previous CT scan, respectively.
3.3. Calculation of Implant Displacement
Using principal component analysis, we built the pins’ outer bounding box, obtained the coordinates of the endpoints of the four pins in Figure 11 separately, and calculated the displacement of the corresponding points. To analyze the displacement of Hansson pins more comprehensively, we take the axis of pins as the z axis, the direction of hook extension as y axis, and the direction of the cross product of y and z as x axis to establish a new coordinate system, as shown in Figure 12a,b are the proximal pin and distal pin coordinate systems, respectively. In the new coordinate system, the proximal pin and distal pin’s displacements in different directions are calculated.
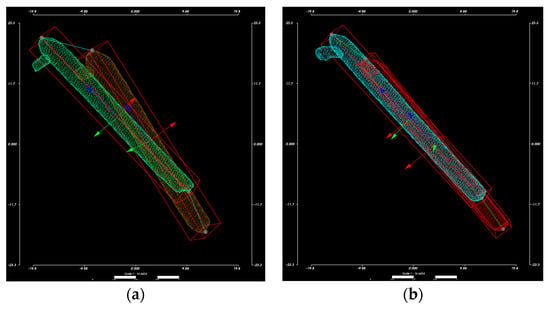
Figure 12.
Calculate the displacement of the proximal pin and the distal pin in the specified direction in the newly established spatial coordinate system: (a) establish the coordinate system based on the proximal pin; (b) establish the coordinate system based on the distal pin.
3.4. Measurement of Implant Displacement Based on Conventional Methods
In this subsection, to verify our proposed measurement of implant displacement’s validity, we used the reference point-based distance measurement method described in [18]. We define the point on the outer surface of the Lesser trochanter farthest from the centerline of the medullary cavity as reference point A. As shown in Figure 13a–c, all steps to locate point A were performed entirely using the three planes in the CT images, and no 3D femur model was used to assist in localization. Figure 13d is used to assist in showing the position of the reference point in the CT image.
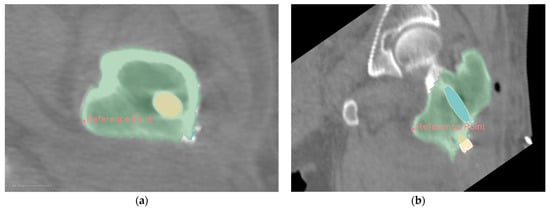
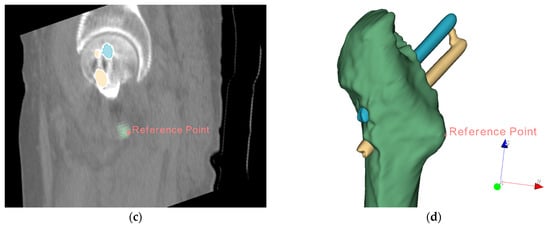
Figure 13.
Locating reference point A in the CT image: (a) reference point located in the axial plane; (b) reference point located in the sagittal plane; (c) reference point located in coronal plane; (d) display reference point in the 3D model.
Point A is used as the origin, and a new coordinate system is formed with the intersecting lines of the planes, axial plane (green), coronal plane (blue), and sagittal plane (red), as shown in Figure 14. The coordinates of the target object are measured in the new coordinate system, and the Euclidean distance is calculated using the formula
where (, , ) and (, , ) represent the coordinates of the same point in the two CT image sequences, respectively.
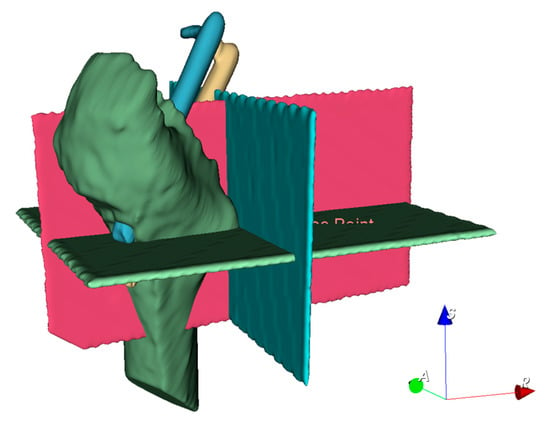
Figure 14.
Create coordinate system for measurement.
To reduce the measurement error, we measure the coordinates of each point three times and take the average value to plug into Equation (8).
4. Results
Training Loss, Mean Dice, and Evaluation
Datasets A and B are used to train the left femur segmentation model, and the right femur segmentation model is derived from the same data source with the same image quality. The proportions of the images used for training and validation are also the same. The results of loss and the change of mean dice during the two models’ training are shown in Figure 15 and Figure 16, respectively.
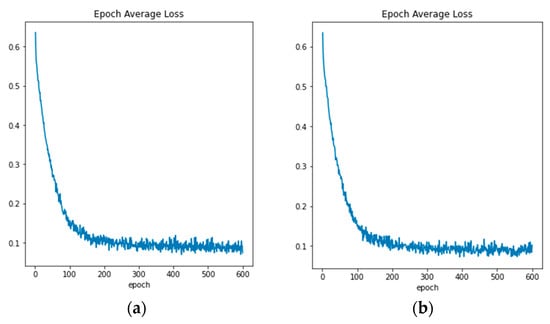
Figure 15.
The average loss calculated in training: (a) left femoral segmentation model; (b) right femoral segmentation model.
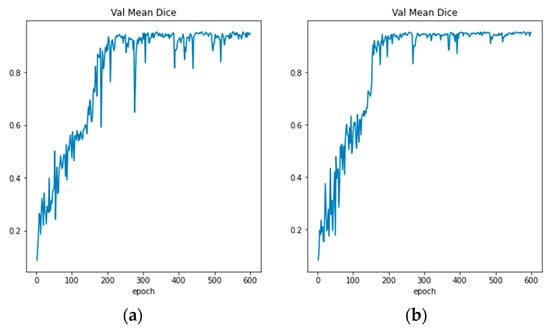
Figure 16.
Mean dice of the model: (a) left femoral segmentation model; (b) right femoral segmentation model.
The best metric was 0.9547 when the left femur segmentation model was trained with peoch of 580, and another model obtained a metric of 0.9450 when the peoch reached 552.
When the images in Dataset C are segmented according to the injury site using the two models that were trained, the left segmentation model’s evaluation metric is 0.85, and the evaluation metric of the right segmentation model is 0.81, using the manual labeling information as the ground truth. Figure 17 shows a comparison of the 3D images of the manually segmented proximal femur and the segmented femur using the model.
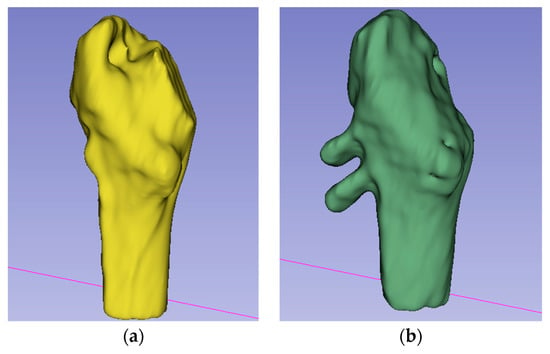
Figure 17.
Comparison of femoral segmentation results: (a) manual segmentation; (b) segmentation using model.
A multi-resolution framework using negative mutual information as the image similarity metric function is used to perform coarse registration of the images in each case, and their metric values are listed in Table 2.

Table 2.
Coarse registration metrics.
Figure 18 plots the coarse-aligned image with the 3D schematic of the femur. The yellow model presents the skeletal part of the fixed image, and the purple is the floating image. In the femur part, the two images do not entirely overlap; instead, some of the pelvic bones overlap.
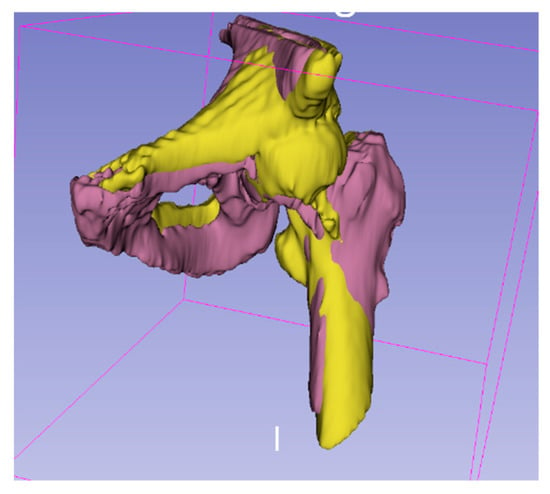
Figure 18.
Spatial location of femur after coarse alignment.
In the experiments, the label obtained using the segmentation model and the manual annotation is used as the mask to fine align the images, respectively, and the mutual information from the two methods is presented in Table 3. For the images in the same case, there is no significant difference in the precision-aligned metric value obtained when different masks are selected.

Table 3.
Results comparison of fine alignment using different masks.
Figure 19 shows the 3D schematic diagram of the floating image obtained from the two experiments, where the yellow model is the bone in the fixed image, the green model is the result of alignment with the label generated by the segmentation model as the mask, and the red model is the result of manual labeling as the mask.
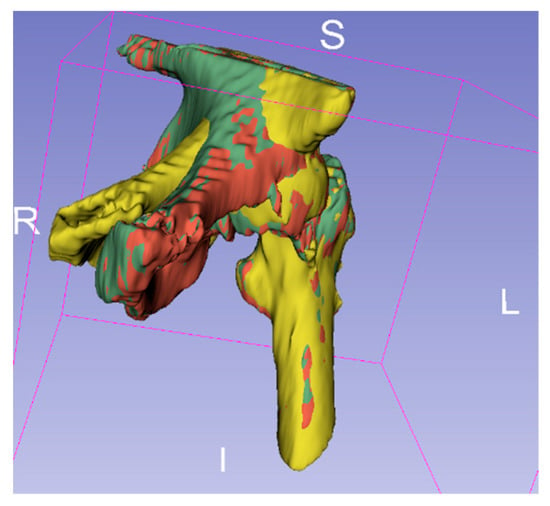
Figure 19.
Comparison of the results using different labeling as a fine-aligned mask.
The fine-aligned CT images were transformed by 3D reconstruction to obtain the point cloud data, as in Figure 20.
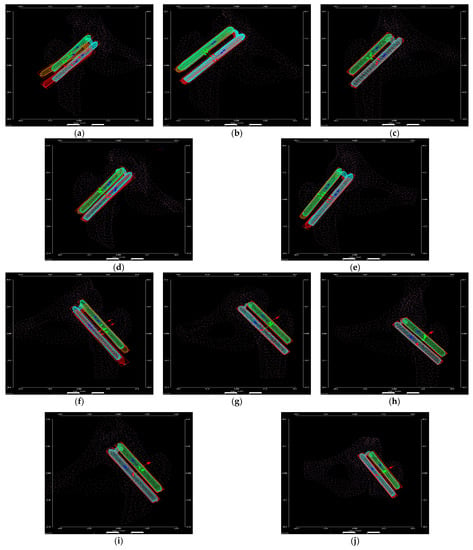
Figure 20.
Hansson pins point clouds: from (a–e) is the Hansson pins point clouds used for the left femur; from (f–j) is the Hansson pins point clouds used for the right femur.
To ensure that the 3D point cloud data can represent the actual size and accurate displacement calculation of Hansson pins, we compared the pins’ actual length with the measured length of the point cloud data, and the results are reported in Table 4. Each case contains two sets of CT images, fixed images, and floating images; all the results are presented. The error between the length of the pins calculated by the point cloud and the actual length is within 2 mm.

Table 4.
Comparison of the actual length of Hansson pins with the point cloud data.
Table 5 shows the displacement distances of the two endpoints of pins calculated using the point cloud data. Additionally, as discussed in Section 3.3, a new spatial coordinate system was established with the fixed image pins as the reference. We converted the displacements to the new coordinate system for calculating Hansson pins’ displacement in a specific direction. The displacements of the pin’s endpoints in the three directions in space are listed in Table 6.

Table 5.
Hansson pins displacement measurement based on 3D point clouds.

Table 6.
The displacement of Hansson pins’ endpoints in each direction after coordinate transformation.
We compared the manual measurement of implant displacement obtained in Section 3.4 with the femur registration-based measurements proposed in this paper. The difference between the two experimental results is shown in Table 7. The measurement error is within 3 mm, except in Case 3, where the measurement error is −3.57 mm.

Table 7.
The difference between the implant displacement results obtained by the conventional method and femur registration-based method.
Figure 21 and Figure 22 depict the errors of the lengths of Hansson pins obtained by the method based on femur registration and conventional method from the actual values, respectively. It is used to evaluate the stability line and accuracy of the measurement method.
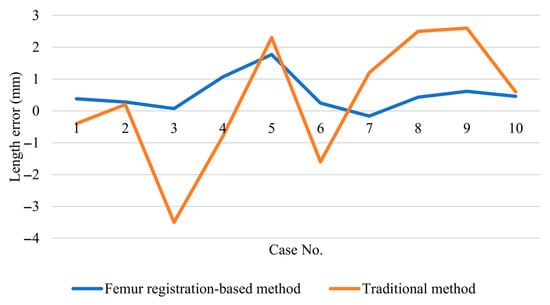
Figure 21.
Length error of proximal Hansson pins calculated based on femoral registration method and traditional method.
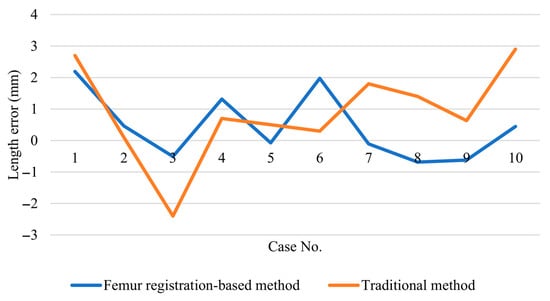
Figure 22.
Length error of distal Hansson pins calculated based on femoral registration method and traditional method.
5. Discussion
Internal fixation using implants is the standard management option for the treatment of stable femoral neck fractures. No evaluation method of the internal fixation system has been proposed that can use long-term postoperative examination data and measure pins displacement based on the postoperative patient’s realistic daily movement. In this paper, we use the Hansson pins system as the object of study. A neural network with a symmetrical structure was used to segment the injured femur automatically, and the segmented label was used as a mask to register the patient’s postoperative CT images at different time points. We calculated the displacement by obtaining the coordinate information of the hip implant from the 3D point cloud generated by the aligned CT images.
This study’s focus is to quantify and visualize the movement of the patient’s implanted pins after surgery and to evaluate the internal fixation system based on the effect of the patient’s regular behavioral habits on the migration of the implant. Generally, the pins’ axial displacement is a fundamental criterion, and the quantified displacement of the pins is the most visual data that can be read in radiographs, reflecting the pins’ ability to resist axial force. In many postoperative evaluations of orthopedic internal fixation procedures, the degree of implant movement is used as an indicator of the need for reoperation, the mechanical failure of the pins, or the internal fixation device’s reliability [30,31,32]. For example, in [33], the migration of screw and K-wire was used as one indicator to analyze the outcome after internal fixation of proximal humeral fractures. Due to the nature of radiographic images, surgeons judge implant failure based on experience only if significant implant displacement occurs. The pins displacement measurement method proposed in this study can quantify the implant’s displacement value in any specified direction in 3D space by transforming the coordinate system and visualizing it by 3D reconstruction. Furthermore, we use the segmented femur obtained from a neural network with symmetric properties as the mask for alignment and use the multi-resolution framework as the core for automatic alignment of CT images, which reduces human intervention and dramatically reduces time consumption. Therefore, it can reduce the workload of surgeons and their reliance on experience.
In this paper’s experiments, two sets of CT images for measurement with a one-year interval between scans. In contrast to many literature pieces that use hydraulic devices or finite element simulations to simulate a single motion scenario of the patient, the evaluation method proposed in this paper is based on the analysis of the pins data presented after the real behavior. Furthermore, we can fuse the patient’s CT data at multiple time points and combine the patient-specific health information for the evaluation of the internal fixation system, avoiding the simulation results that do not match with the real data due to simplified parameters. More importantly, the CT images we use can provide three-dimensional coordinate data with higher accuracy of results compared to two-dimensional radiological images.
We used negative mutual information for the experiments with the coarse and fine alignment of CT images as the evaluation function of image overlap. The metric values of fine registration in some cases listed in Table 3 are smaller than those of coarse registration. The fine alignment and the coarse alignment have different ranges of effect in the similarity function. In the coarse alignment, the mutual information is calculated with the whole input image as the range, while the fine alignment has a different range due to the mask’s use. The metric values in Table 3 are to verify whether there is a difference between the registration using manual annotation and the registration using the mask generated by 3D-UNet and are not correlated with the results shown in Table 2.
Another interesting finding in this paper is that in the 10 cases where Hansson pins were used as the internal fixation system, both proximal and distal pins shifted to varying degrees along the axis of the pins, away from the femoral head, and to a small degree in other directions compared to axial migration. Biomechanical analysis is that since the upper body’s major weight within the frontal and sagittal planes produce different components on the femur during normal walking [34]. In Case 2, the displacement in both axial and hook directions was significantly greater than in the other cases and may be related to the severity of the patient’s osteoporosis, which will continue to be discussed in future studies.
By comparing the lengths of Hansson pins calculated by the femur-based registration method with the traditional method in Figure 21 and Figure 22, we found that the measurement stability and accuracy of the proposed method are higher than the traditional method. Only in cases 4 and 6, the traditional method’s absolute errors are minor compard to the method proposed in this paper. Moreover, the traditional method’s error fluctuation is large, which indicates that the measurement effect is not stable. More importantly, according to Table 7, the method proposed in this paper consumes much less time than the manual measurement and obtains similar measurement results.
The cases in dataset C were obtained from Hyogo Prefectural Awaji Medical Center. We only collected records of intracapsular fractures in female patients during the four years from March 2012 to January 2015. This data supports the previous literature’s statistical findings that femoral fracture incidence is significantly higher in women than in men [3]. Since male and female femurs have the same symmetrical structure, with no significant differences in morphology and stress environment, it will not affect the experimental results’ applicability. Moreover, we will continue to focus on the treatment of intracapsular femur fractures, and in future studies, we will add medical image data from male patients for experimental comparisons.
In this paper, we use Hansson pins as the object of study, and Table 6 demonstrates the displacement of the pins along the axial and the hook pointing direction. The crucial step of the method is the registration of the rigid reference. Thus, the method is widely applicable to evaluating internal fixation implants in other fracture sites, and only different segmentation models need to be trained depending on the rigid reference. This paper is an improved solution based on a previous study, ref. [35] using a 3D point cloud alignment method for femur alignment. The registration method based on the multi-resolution framework proposed in this paper is less time consuming and higher accuracy.
A limitation of the current study is that the pins’ calculated displacement values are obtained without ground truth for comparison. For this reason, we use mutual information as the evaluation function in the process of registration of CT images and set the convergence minimum to 1e-6 to ensure the maximum overlap of the registered images. The error is limited to an acceptable range by the intuitive evaluation of the 3D images of the two data sets after alignment. Moreover, to ensure the pins’ displacement values’ validity, we use the actual length of Hansson pins as the parameter criterion for 3D reconstruction in generating 3D point clouds, and the length error is less than 2 mm. Despite the limitations, the results obtained by this method of measurement can accurately reflect the motion trend of the pins. For overcoming the limitations of this study, more biomechanical experiments are needed as a comparison of the results.
6. Conclusions
This study refers to address the problems of traditional internal fixation evaluation methods used for intracapsular fractures, which have low applicability, do not fully reflect the actual postoperative condition of patients, time-consuming, and low accuracy. We proposed a rapid evaluation method for internal fixation systems used for femoral neck fractures in the elderly. The method uses a 3D-UNet neural network to segment the injured femur and uses it as a mask to registers CT images scanned at different times. Further, the registered CT images are converted to point cloud data to quantify the implant’s displacement in a specific direction. This method does not affect the patient’s postoperative recovery and allows the fusion of long-term data for the evaluation of the internal fixation system.
Encouraging experimental results demonstrate that this method gives more reliable results than the traditional manual measurement of pins displacement. Although the evaluation given in this paper is preliminary, it is widely applicable to implants’ displacement after internal fixation procedures at other sites. A wide range of research prospects is available.
Author Contributions
Conceptualization, K.L. and K.N.; methodology, K.L.; software, K.L.; validation, K.N., K.O., R.K., and T.N.; formal analysis, K.N.; investigation, K.O., R.K., and T.N.; resources, K.O.; data curation, K.L. and K.N.; writing—original draft preparation, K.L.; writing—review and editing, K.O. and R.K.; visualization, K.L.; supervision, K.N. and K.O.; project administration, K.N., K.O., R.K., and T.N. All authors have read and agreed to the published version of the manuscript.
Funding
This research received no external funding.
Institutional Review Board Statement
The study was conducted according to the guidelines of the Declaration of Helsinki and approved by the Institutional Review Board of Hyogo Prefectural Awaji 65 Medical Center (3.28.2011). The clinical study title is “A study of the indications for osteosynthesis (using Hanson pins) in the treatment of femoral neck fractures”, and the study was conducted from 1 April 2011 to 31 March 2013. The Institutional Review Board of Hyogo Awaji Medical Center approved the study in the form of a decision notice with no approval number.
Informed Consent Statement
Informed consent was obtained from all subjects involved in the study.
Data Availability Statement
The data on the patients included in this clinical study are not publicly available due to ethical and privacy reasons.
Acknowledgments
The author would like to thank Hyogo Prefectural Awaji Medical Center for providing medical cases as research data.
Conflicts of Interest
The authors declare no conflict of interest. The funders had no role in the design of the study; in the collection, analyses, or interpretation of data; in the writing of the manuscript; or in the decision to publish the results.
References
- Haider, T.; Schnabel, J.; Hochpöchler, J.; Wozasek, G.E. Femoral shortening does not impair functional outcome after internal fixation of femoral neck fractures in non-geriatric patients. Arch. Orthop. Trauma Surg. 2018, 138, 1511–1517. [Google Scholar] [CrossRef]
- Chen, W.-C.; Yu, S.-W.; Tseng, I.-C.; Su, J.-Y.; Tu, Y.-K.; Chen, W.-J. Treatment of Undisplaced Femoral Neck Fractures in the Elderly. J. Trauma Inj. Infect. Crit. Care 2005, 58, 1035–1039. [Google Scholar] [CrossRef]
- Brauer, C.A.; Coca-Perraillon, M.; Cutler, D.M.; Rosen, A.B. Incidence and mortality of hip fractures in the United States. JAMA 2009, 302, 1573–1579. [Google Scholar] [CrossRef]
- Miyamoto, R.G.; Kaplan, K.M.; Levine, B.R.; Egol, K.A.; Zuckerman, J.D. Surgical Management of Hip Fractures: An Evidence-based Review of the Literature. I: Femoral Neck Fractures. J. Am. Acad. Orthop. Surg. 2008, 16, 596–607. [Google Scholar] [CrossRef]
- Sekeitto, A.R.; Sikhauli, N.; van der Jagt, D.R.; Mokete, L.; Pietrzak, J.R. The management of displaced femoral neck fractures: A narrative review. EFORT Open Rev. 2021, 6, 139–144. [Google Scholar] [CrossRef] [PubMed]
- Lehtonen, E.J.I.; Stibolt, R.D., Jr.; Smith, W.; Wills, B.; Pinto, M.C.; McGwin, G., Jr.; Shah, A.; Godoy-Santos, A.L.; Naranje, S. Trends in surgical treatment of femoral neck fractures in the elderly. Einstein (São Paulo) 2018, 16, eAO4351. [Google Scholar] [CrossRef] [PubMed]
- Eiskjaer, S.; Ostgård, S.E. Risk factors influencing mortality after bipolar hemiarthroplasty in the treatment of fracture of the femoral neck. Clin. Orthop. Relat. Res. 1991, 270, 295–300. [Google Scholar] [CrossRef]
- Lu, Q.; Tang, G.; Zhao, X.; Guo, S.; Cai, B.; Li, Q. Hemiarthroplasty versus internal fixation in super-aged patients with undisplaced femoral neck fractures: A 5-year follow-up of randomized controlled trial. Arch. Orthop. Trauma Surg. 2016, 137, 27–35. [Google Scholar] [CrossRef]
- Oñativia, I.J.; Slulittel, P.A.; Dilernia, F.D.; Viezcas, J.M.G.; Vietto, V.; Ramkumar, P.N.; Buttaro, M.A.; Piuzzi, N.S. Outcomes of nondisplaced intracapsular femoral neck fractures with internal screw fixation in elderly patients: A systematic review. HIP Int. 2018, 28, 18–28. [Google Scholar] [CrossRef] [PubMed]
- Nanty, L.; Canovas, F.; Rodriguez, T.; Faure, P.; Dagneaux, L. Femoral neck shortening after internal fixation of Garden I fractures increases the risk of femoral head collapse. Orthop. Traumatol. Surg. Res. 2019, 105, 999–1004. [Google Scholar] [CrossRef]
- Johnson, J.P.; Kleiner, J.; Goodman, A.D.; Gil, J.A.; Daniels, A.H.; Hayda, R.A. Treatment of femoral neck fractures in patients 45–64 years of age. Injure 2019, 50, 708–712. [Google Scholar] [CrossRef]
- Bigoni, M.; Turati, M.; Leone, G.; Caminita, A.D.; D’Angelo, F.; Munegato, D.; Zatti, G. Internal fixation of intra-capsular femoral neck fractures in elderly patients: Mortality and reoperation rate. Aging Clin. Exp. Res. 2020, 32, 1–6. [Google Scholar] [CrossRef] [PubMed]
- Mansur, H.; Alvarez, R.; Freitas, A.; Gonçalves, C.B.; Ramos, M.R.F. Biomechanical analysis of femoral neck fracture fixation in synthetic bone. Acta Ortop. Bras. 2018, 26, 162–165. [Google Scholar] [CrossRef] [PubMed]
- Schopper, C.; Zderic, I.; Menze, J.; Müller, D.; Rocci, M.; Knobe, M.; Shoda, E.; Richards, G.; Gueorguiev, B.; Stoffel, K. Higher stability and more predictive fixation with the Femoral Neck System versus Hansson Pins in femoral neck fractures Pauwels II. J. Orthop. Transl. 2020, 24, 88–95. [Google Scholar] [CrossRef] [PubMed]
- Li, J.; Wang, M.; Li, L.; Zhang, H.; Hao, M.; Li, C.; Han, L.; Zhou, J.; Wang, K. Finite element analysis of different configurations of fully threaded cannulated screw in the treatment of unstable femoral neck fractures. J. Orthop. Surg. Res. 2018, 13, 272. [Google Scholar] [CrossRef]
- Augat, P.; Bliven, E.; Hackl, S. Biomechanics of Femoral Neck Fractures and Implications for Fixation. J. Orthop. Trauma 2019, 33, S27–S32. [Google Scholar] [CrossRef] [PubMed]
- Bauman, Z.M.; Grams, B.; Yanala, U.; Shostrom, V.; Waibel, B.; Evans, C.H.; Cemaj, S.; Schlitzkus, L.L. Rib fracture displacement worsens over time. Eur. J. Trauma Emerg. Surg. 2020, 1–6. [Google Scholar] [CrossRef] [PubMed]
- Bugaev, N.; Breeze, J.L.; Alhazmi, M.; Anbari, H.S.; Arabian, S.S.; Holewinski, S.; Rabinovici, R. Magnitude of rib fracture displacement predicts opioid requirements. J. Trauma Acute Care Surg. 2016, 81, 699–704. [Google Scholar] [CrossRef]
- Eastwood, D.M.; Gregg, P.J.; Atkins, R.M. Intra-articular fractures of the calcaneum. Part I: Pathological anatomy and classification. J. Bone Joint Surg. Br. 1993, 75, 183–188. [Google Scholar] [CrossRef]
- Tajbakhsh, N.; Jeyaseelan, L.; Li, Q.; Chiang, J.N.; Wu, Z.; Ding, X. Embracing imperfect datasets: A review of deep learning solutions for medical image segmentation. Med. Image Anal. 2020, 63, 101693. [Google Scholar] [CrossRef]
- Yorke, A.A.; McDonald, G.C.; Solis, D., Jr.; Guerrero, T. Pelvic Reference Data. Cancer Imaging Arch. 2019. [Google Scholar] [CrossRef]
- Clark, K.; Vendt, B.; Smith, K.; Freymann, J.; Kirby, J.; Koppel, P.; Moore, S.; Phillips, S.; Maffitt, D.; Pringle, M.; et al. The Cancer Imaging Archive (TCIA): Maintaining and Operating a Public Information Repository. J. Digit. Imaging 2013, 26, 1045–1057. [Google Scholar] [CrossRef]
- Hansson, L.I. Osteosynthesis with the Hook-Pin in Slipped Capital Femoral Epiphysis. Acta Orthop. Scand. 1982, 53, 87–96. [Google Scholar] [CrossRef]
- Lv, X. Medical Image Alignment Techniques and Applications, 1st ed.; Science Press: Beijing, China, 2015; pp. 120–129. [Google Scholar]
- Johnson, H.J.; McCormick, M.M.; Ibanez, L. The ITK Software Guide Book 1: Introduction and Development Guidelines; Kitware, Inc.: Clifton Park, NY, USA, 2015; Volume 1, pp. 377–386. [Google Scholar]
- Çiçek, Ö.; Abdulkadir, A.; Lienkamp, S.S.; Brox, T.; Ronneberger, O. 3D U-Net: Learning dense volumetric segmentation from sparse annotation. In Proceedings of the International Conference on Medical Image Computing and Computer-Assisted Intervention, Athens, Greece, 17–21 October 2016; Springer: Cham, Switzerland, 2016; pp. 424–432. [Google Scholar]
- Moeskops, P.; Wolterink, J.M.; Van Der Velden, B.H.M.; Gilhuijs, K.G.A.; Leiner, T.; Viergever, M.A.; Išgum, I. Deep Learning for Multi-task Medical Image Segmentation in Multiple Modalities. In Proceedings of the International Conference on Medical Image Computing and Computer-Assisted Intervention, Athens, Greece, 17–21 October 2016; Springer: Cham, Switzerland, 2016; pp. 478–486. [Google Scholar]
- Wold, S.; Esbensen, K.; Geladi, P. Principal component analysis. Chemom. Intell. Lab. Syst. 1987, 2, 37–52. [Google Scholar] [CrossRef]
- The MONAI Consortium. Project MONAI. Zenodo. Available online: https://monai.io/ (accessed on 15 December 2020). [CrossRef]
- Zhang, Q.; Song, L.; Ning, S.; Xie, H.; Li, N.; Wang, Y. Recent advances in rib fracture fixation. J. Thorac. Dis. 2019, 11, S1070–S1077. [Google Scholar] [CrossRef]
- Rancy, S.K.; Malliaris, S.D.; Bogner, E.A.; Wolfe, S.W. Intramedullary Fixation of Distal Radius Fractures Using CAGE-DR Implant. J. Wrist Surg. 2018, 7, 358–365. [Google Scholar] [CrossRef] [PubMed]
- Jacobs, N.; Seghi, R.; Johnston, W.M.; Yilmaz, B. Displacement and performance of abutments in narrow-diameter implants with different internal connections. J. Prosthet. Dent. 2021. [Google Scholar] [CrossRef]
- Della Rotonda, G.; Guastafierro, A.; Viglione, S.; Russo, F.; Coscione, A.V.; Ciccarelli, M.; Russo, R. Analysis of early and late clinical and radiologic complications of proximal humeral fractures using open reduction, internal fixation, and intramedullary titanium cage augmentation. J. Shoulder Elb. Surg. 2020, 29, 1843–1851. [Google Scholar] [CrossRef]
- Bergmann, G.; Bender, A.; Dymke, J.; Duda, G.; Damm, P. Standardized Loads Acting in Hip Implants. PLoS ONE 2016, 11, e0155612. [Google Scholar] [CrossRef]
- Liu, K.; Nagamune, K.; Oe, K.; Kuroda, R.; Niikura, T. Migration Measurement of Pins in Postoperative Recovery of the Proximal Femur Fractures Based on 3D Point Cloud Matching. Medicina 2021, 57, 406. [Google Scholar] [CrossRef]
Publisher’s Note: MDPI stays neutral with regard to jurisdictional claims in published maps and institutional affiliations. |
© 2021 by the authors. Licensee MDPI, Basel, Switzerland. This article is an open access article distributed under the terms and conditions of the Creative Commons Attribution (CC BY) license (https://creativecommons.org/licenses/by/4.0/).