Article

The Exponentiated Fréchet Generator of Distributions with Applications

by
Lamya A. Baharith
* and
Hanan H. Alamoudi
Department of Statistics, Faculty Science, King Abdul-Aziz University, Jeddah 21589, Saudi Arabia
*
Author to whom correspondence should be addressed.
Symmetry 2021, 13(4), 572; https://doi.org/10.3390/sym13040572
Submission received: 22 February 2021 / Revised: 24 March 2021 / Accepted: 26 March 2021 / Published: 30 March 2021
(This article belongs to the Section Mathematics)

Abstract

:
In this article, we introduce the exponentiated Fréchet-G family of distributions. Several models of the introduced exponentiated Fréchet-G family are presented. The proposed family is precisely more flexible and effective in modeling complex data and is instrumental in reliability analysis. It covers a wide variety of shapes, such as unimodal, reverse J, right-skewed, symmetrical, and asymmetrical shapes. Various structural mathematical properties, such as the quantile, moment, incomplete moment, entropy, and order statistics, are derived. The parameters are evaluated using a parametric estimation method. The performance and flexibility of the exponentiated Fréchet-G family are analyzed via a simulation and two applications; one deals with reliability data, and the other deals with medical data.

1. Introduction

In the last decades, many generators have been developed in the literature to introduce new families of distributions from the existing classical ones by inducing extra parameter(s) to the base standard distributions. These extensions and modifications have increased the goodness of fit of the introduced families and provided more flexible and adaptable distributions for different types of data in many real-life situations. Some commonly proposed generators include the beta-G by [1], Kumaraswamy-G by [2], exponentiated generalized-G by [3], Weibull-G by [4], new Weibull-G family by [5], transformed–transformer by [6], odd Lindley-G by [7], and odd Burr-G by [8].
Recently, new families have been introduced in the literature: the odd Fréchet-G [9], extended odd Fréchet-G [10], Fréchet Topp Leone-G [11], type II power Topp–Leone by [12], and exponentiated truncated inverse Weibull-G by [13].
The exponentiated Fréchet (EF) distribution was first proposed by [14,15]; it has some attractive physical interpretations and shares the many applications of the Fréchet distribution in extreme value theory, such as queues in supermarkets, wind speeds, accelerated life testing, sea currents, earthquakes, horse racing, floods, track race records, and rainfall, among others; see Kotz and Nadarajah [16] and Coles [17].
The cumulative distribution function (CDF) and probability density function (PDF) of the EF distribution with α > 0 and θ > 0 as shape parameters and γ > 0 as the scale parameter are, respectively, expressed as
F ( x ; α , θ , γ ) = 1 1 exp γ x θ α , x > 0 ,
f ( x ; α , θ , γ ) = α θ γ θ 1 exp γ x θ α 1 x ( θ + 1 ) exp γ x θ .
In this paper, we introduce and study the exponentiated Fréchet-G family (EF-G) based on the transformed–transformer (T-X) method proposed by [6]. The EF-G family has great flexibility and will play a significant role in reliability analyses, as it can provide a wide variety of shapes for the hazard function. We anticipate that EF-G will attract broader applications and represent several types of data in many areas.
This article is planned as follows: Section 2 defines the EF-G family and its reliability functions. In Section 3, special members of the EF-G are obtained. Expansions for the density and CDF functions of EF-G are provided in Section 4. Some mathematical results of the EF-G family are derived in Section 5. Section 6 illustrates the maximum likelihood (ML) estimates of the EF-G parameters. In Section 7, we carried out a numerical study of a special member of the EF-G using the Lomax distribution as a baseline to demonstrate the efficacy of the ML estimates. In Section 8, the EF-G family is analyzed via two practical applications by considering the exponential and Lomax as baseline distributions. The article’s conclusion is displayed in Section 9.

2. Exponentiated Fréchet-G Family

Based on the transformed–transformer (T-X) method proposed by [6] and the EF distribution, we introduce the EF-G family with the CDF given by
F ( x ; α , θ , γ , τ ) = 0 log [ 1 G ( x ; τ ) ] f ( x ; α , θ , γ , τ ) d x = 1 1 exp γ log [ 1 G ( x ; τ ) ] θ α ,
where τ represents the parameter vector of the baseline distribution G. Since the cumulative hazard rate function (CHF) is represented as C H F ( x , τ ) = log [ 1 G ( x ; τ ) ] , then the PDF of EF-G is
f ( x ; Θ ) = α θ γ θ g ( x ; τ ) 1 G ( x ; τ ) C H F ( x , τ ) ( θ + 1 ) exp γ C H F ( x , τ ) θ × 1 exp γ C H F ( x , τ ) θ α 1 ,
where Θ = ( α , θ , γ , τ ) .
As a result, the survival function (SF) and hazard rate function (HF) of EF-G are given by
S F ( x ; Θ ) = 1 exp γ log [ 1 G ( x ; τ ) ] θ α ,
H F ( x ; Θ ) = α θ γ θ g ( x ; τ ) 1 G ( x ; τ ) log [ 1 G ( x ; τ ) ] ( θ + 1 ) exp γ log [ 1 G ( x ; τ ) ] θ 1 exp γ log [ 1 G ( x ; τ ) ] θ .

3. Special Models

This section presents the following members of the EF-G family; the EF exponential (EF-E), EF-Rayleigh (EF-R), EF-Lomax (EF-L), and EF-Gompertz (EF-Gom) distributions.

3.1. EF-Exponential Distribution

The CDF for the EF-E, in which G ( x ) e x p o n e n t i a l ( λ ) , is defined as
F E F - E ( x ) = 1 1 exp γ λ x θ α .
The corresponding PDF of EF-E can be obtained as
f E F - E ( x ) = α θ γ θ λ θ x ( θ + 1 ) exp γ λ x θ 1 exp γ λ x θ α 1 .

3.2. EF-Rayleigh Distribution

The CDF for the EF-R, in which G ( x ) R a y l e i g h ( λ ) , is given by
F E F - R ( x ) = 1 1 exp 2 γ λ 2 x 2 θ α .
The corresponding PDF of EF-R can be obtained as
f E F - R ( x ) = α θ γ θ λ 2 θ 2 ( θ + 1 ) x ( 2 θ + 1 ) exp 2 γ λ 2 x 2 θ 1 exp 2 γ λ 2 x 2 θ α 1 .

3.3. EF-Lomax Distribution

The CDF for the EF-L, in which G ( x ) L o m a x ( λ , β ) , is given by
F E F - L ( x ) = 1 1 exp γ β l o g ( 1 + ( x / λ ) ) θ α .
The corresponding PDF of EF-L can be obtained as
f E F - L ( x ) = α θ γ θ β θ λ l o g ( 1 + ( x / λ ) ) ( θ + 1 ) [ 1 + ( x / λ ) ] exp γ β l o g ( 1 + ( x / λ ) ) θ × 1 exp γ β l o g ( 1 + ( x / λ ) ) θ α 1 .

3.4. EF-Gompertz Distribution

The CDF for the EF-Gom, in which G ( x ) G o m p e r t z ( λ , β ) , is given by
F E F - G o m ( x ) = 1 1 exp γ λ ( e x β 1 ) θ α .
The corresponding PDF of EF-Gom can be obtained as
f E F - G o m ( x ) = α θ β γ θ e x β λ θ exp γ λ ( e x β 1 ) θ ( e x β 1 ) ( θ + 1 ) 1 exp γ λ ( e x β 1 ) θ α 1 .
Figure 1 and Figure 2 present various shapes of the EF-E and EF-L densities, which can be right-skewed, reverse J, symmetrical, and asymmetrical.
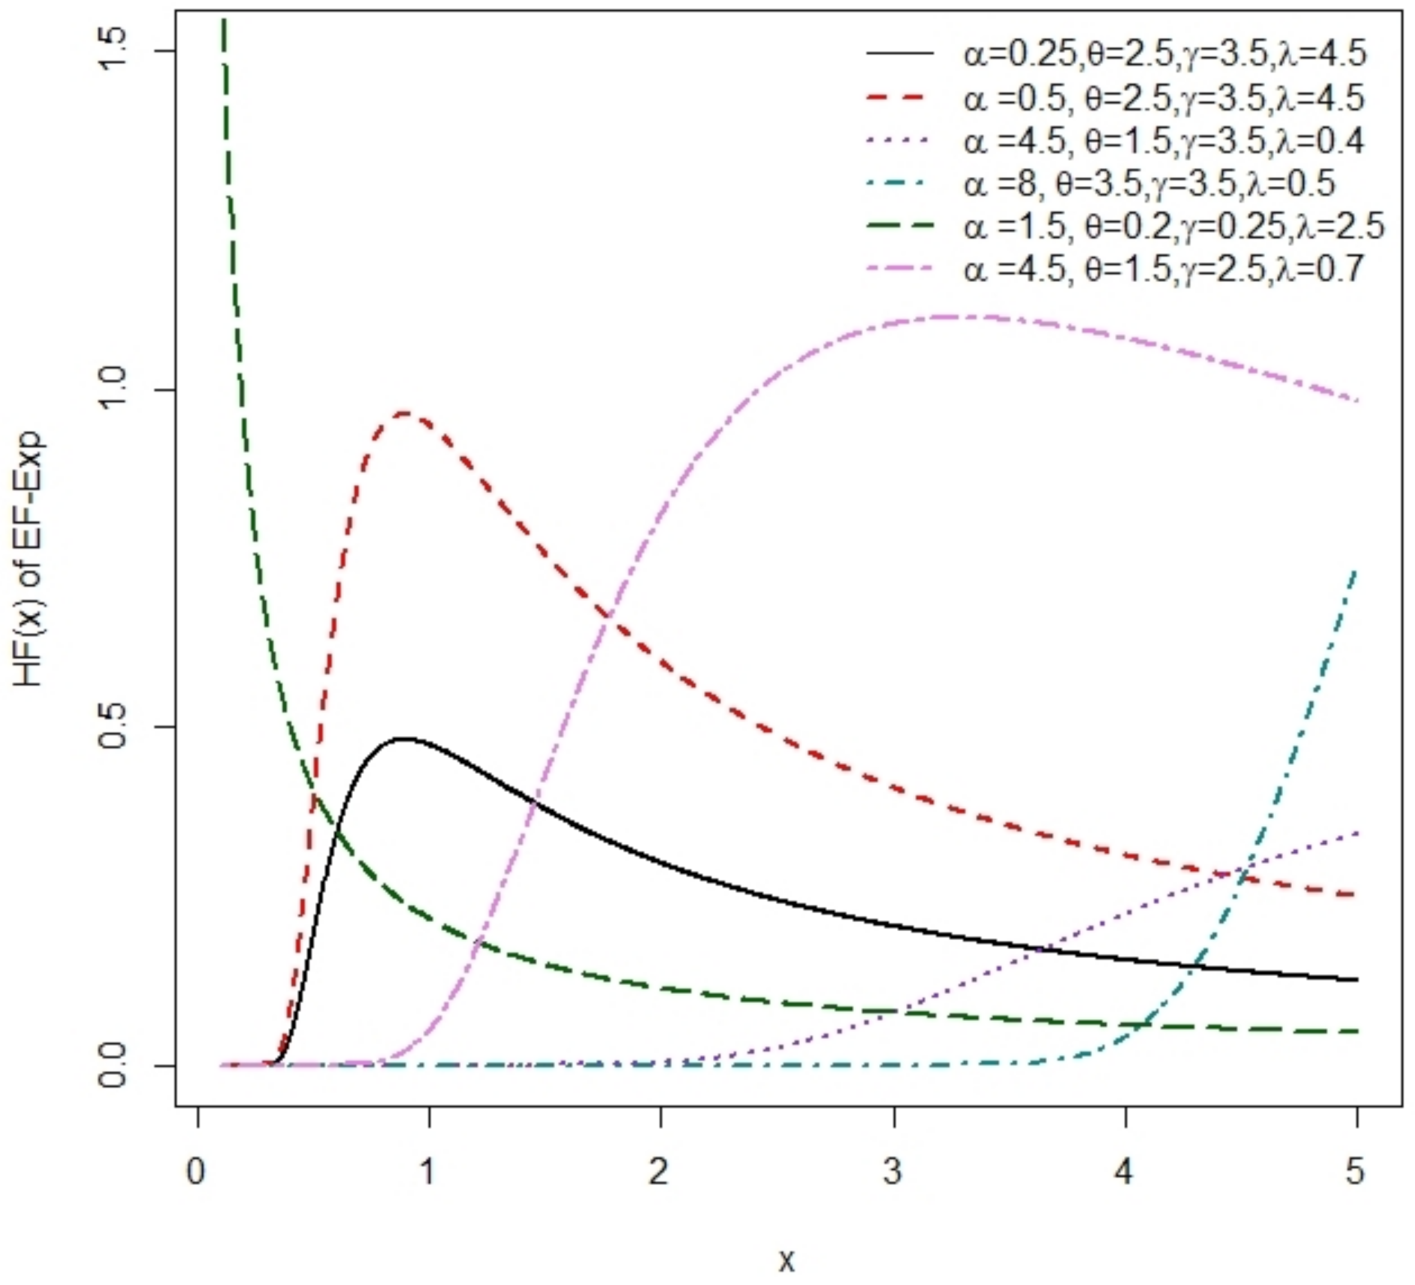
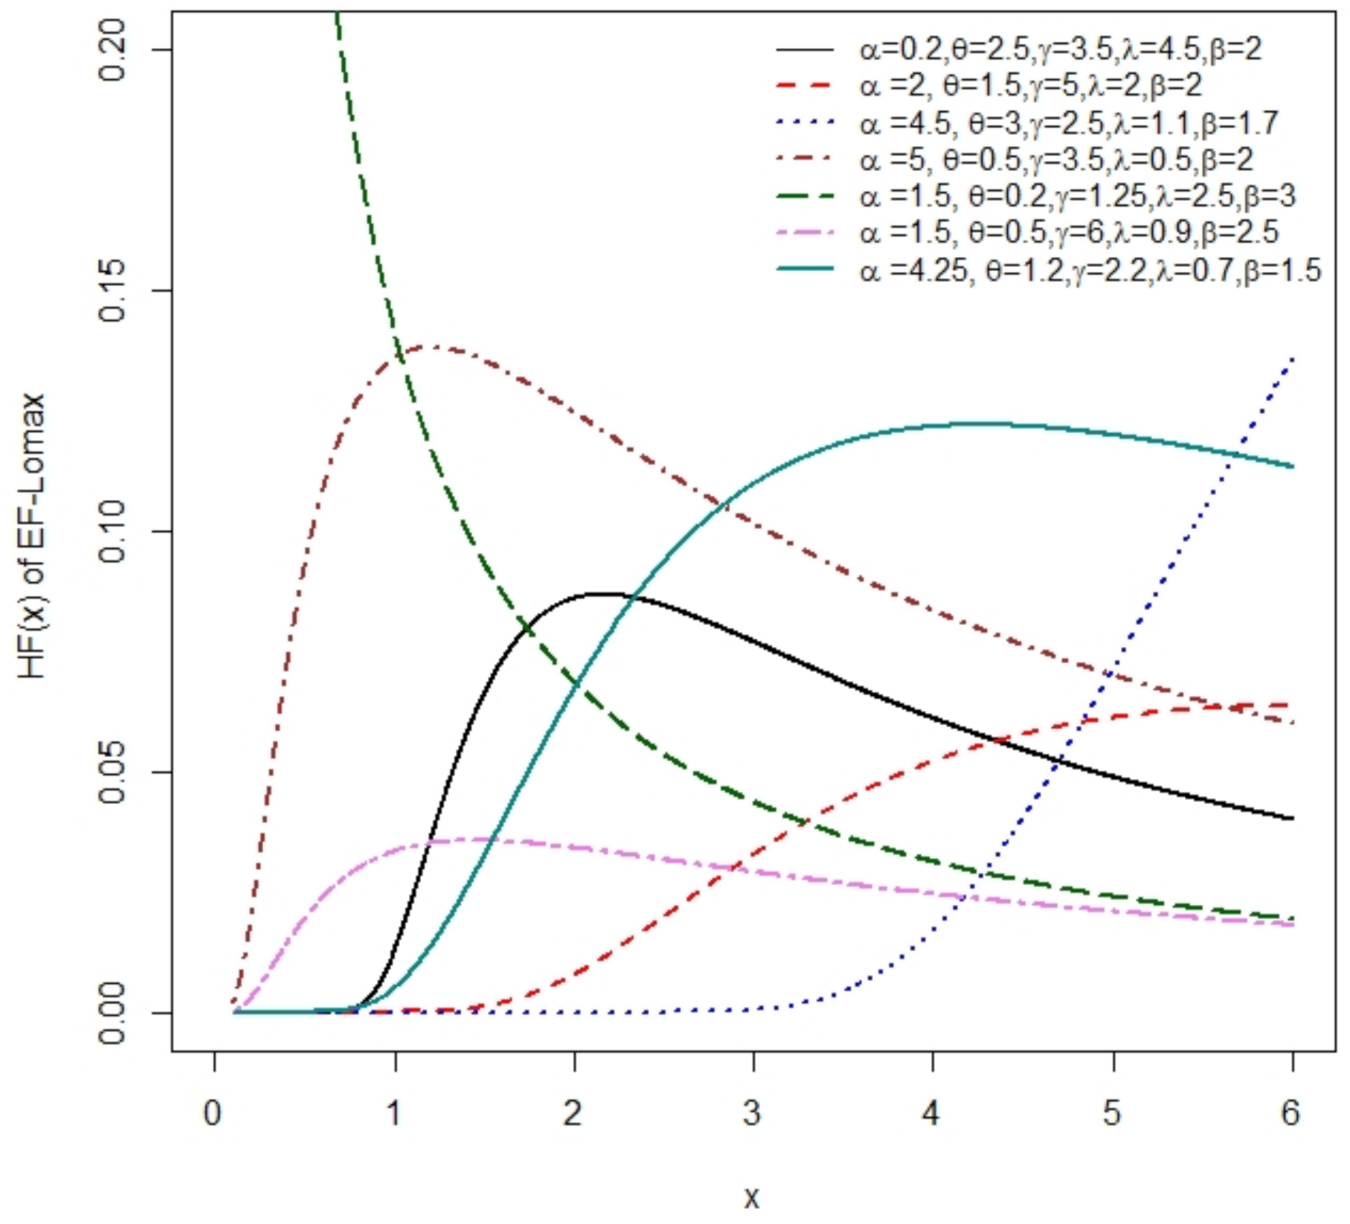
Moreover, the presentation of the HFs of the special models can be obtained directly from their PDFs and CDFs. The plots of the HFs of the EF-E and EF-L distributions possess right-skewed, nearly symmetrical, and asymmetrical shapes, as shown in Figure 3 and Figure 4.

4. Useful Expansion of the EF-G Density and Cumulative Functions

This section presents a useful expansion of the PDF and CDF of the EF-G.
The binomial series expansion is given by
1 x z = k = 0 z k ( 1 ) k x k .
In addition, the exponential function could be expressed as
e x = i = 0 ( 1 ) i i ! x i .
Then, it follows that, using (11) to expand [ 1 G ( x ; τ ) ] 1 and 1 exp γ C H F ( x , τ ) θ α 1 , the PDF of EF-G in (4) is expressed as
f ( x ; Θ ) = α θ γ θ g ( x ; τ ) C H F ( x , τ ) ( θ + 1 ) j , k = 0 [ G ( x ; τ ) ] j α 1 k ( 1 ) k × exp ( k + 1 ) γ C H F ( x , τ ) θ .
Applying (12) to expand exp ( k + 1 ) γ C H F ( x , τ ) θ , we obtain
f ( x ; Θ ) = α θ γ θ g ( x ; τ ) j , k , i = 0 α 1 k [ G ( x ; τ ) ] j ( 1 ) i + k ( k + 1 ) i γ i θ i ! 1 ( 1 C H F ( x , τ ) ) [ θ ( i + 1 ) + 1 ] .
Then, using (11) to expand 1 ( 1 C H F ( x , τ ) ) [ θ ( i + 1 ) + 1 ] , the EF-G’s PDF will be
f ( x ; Θ ) = α θ γ θ g ( x ; τ ) j , k , i , n = 0 α 1 k θ ( i + 1 ) + n n ( 1 ) i + k + n i ! ( k + 1 ) i γ i θ 1 C H F ( x , τ ) n [ G ( x ; τ ) ] j .
Furthermore, using the following binomial theorem to expand 1 C H F ( x , τ ) n ,
1 x d = a = 0 d d a ( 1 ) a x a .
Therefore, the density of EF-G becomes
f ( x ; Θ ) = α θ γ θ g ( x ; τ ) j , k , i , n = 0 m = 0 n α 1 k θ ( i + 1 ) + n n n m × ( 1 ) i + k + n + m i ! ( k + 1 ) i γ i θ C H F ( x , τ ) m [ G ( x ; τ ) ] j .
Now, we expand [ log ( 1 G ( x ; τ ) ) ] m = C H F ( x , τ ) m using the expansion in [18,19,20] as follows:
log 1 x a = a ν 1 = 0 ν 2 = 0 ν 1 ( 1 ) ν 1 + ν 2 ν 1 a ν 1 ν 1 ν 2 P ν 2 , ν 1 a ν 2 x a + ν 1 ,
such that
P ν 2 , ν 1 = ( ν 1 ) 1 l = 1 ν 1 ν 1 l ( ν 2 + 1 ) c l P ν 2 , ν 1 l ,
for ν 1 = 1 , 2 , , P ν 2 , 0 = 1 , and c l = ( 1 ) ν 1 + 1 ν 1 + 1 1 . As a result,
f ( x ; Θ ) = m = 0 n η m ( j + m + ν 1 + 1 ) g ( x ; τ ) [ G ( x ; τ ) ] j + m + ν 1 ,
where
η m = k , j , i , n = 0 ν 1 = 0 ν 2 = 0 ν 1 ( 1 ) k + i + n + m + ( ν 1 + ν 2 ) m γ i θ ( k + 1 ) i i ! ( m ν 2 ) [ j + m + ν 1 + 1 ] × α 1 k θ ( i + 1 ) + n n n m ν 1 m ν 1 ν 1 ν 2 P ν 2 , ν 1 .
Therefore, the PDF of EF-G could be reduced to
f ( x ; Θ ) = m = 0 n η m f E x p - G ( x ; j + m + ν 1 + 1 ) ,
where f E x p - G ( x ) is the PDF of the exponentiated-G family (Exp-G). This is given for any arbitrary G ( x ) as
f E x p - G ( x ) = ζ g ( x ) [ G ( x ) ] ζ 1 . ; for ζ > 0 .
That is, the PDF of the EF-G family represents a linear combination of the Exp-G’s densities. As a result, we can acquire some of the mathematical results of the EF-G family from the corresponding results of the Exp-G family, which was studied in [15,21,22], among many others. Similarly, it follows from (11) and (12) that the CDF of EF-G in (3) can be reduced to
F ( x ; Θ ) = 1 k , i = 0 α k ( 1 ) k + i k i i ! γ C H F ( x , τ ) i θ = 1 k , i = 0 α k ( 1 ) i + k ( k + 1 ) i γ i θ i ! 1 ( 1 C H F ( x , τ ) ) [ i θ ] .
Using (11) to expand 1 ( 1 C H F ( x , τ ) ) [ i θ ] , we have
F ( x ; Θ ) = 1 k , i , n = 0 α k i θ + n n ( 1 ) i + k + n i ! k i γ i θ 1 C H F ( x , τ ) n .
Moreover, using (13) to expand 1 C H F ( x , τ ) n , the CDF of EF-G is expressed as
F ( x ; Θ ) = 1 k , i , n = 0 m = 0 n α k i θ + n n n m ( 1 ) i + k + n + m i ! k i γ i θ C H F ( x , τ ) m .
Using (14) to expand [ log ( 1 G ( x ; τ ) ) ] m = C H F ( x , τ ) m , the CDF of EF-G is reduced to
F ( x ; Θ ) = 1 m = 0 n η m * [ G ( x ; τ ) ] m + ν 1 ,
where
η m * = k , i , n = 0 ν 1 = 0 ν 2 = 0 ν 1 ( 1 ) k + i + n + m + ( ν 1 + ν 2 ) m γ i θ k i i ! ( m ν 2 ) α k i θ + n n n m ν 1 m ν 1 ν 1 ν 2 P ν 2 , ν 1 ,
where P ν 2 , ν 1 is defined in (15).

5. Mathematical Properties of EF-G

This section presents various structural, statistical, and mathematical properties of the EF-G family.

5.1. Quantiles of EF-G

The quantile function X ( q ) for the EF-G family for ( 0 < q < 1 ) is
X ( q ) = G 1 1 exp γ log [ 1 ( 1 q ) 1 / α ] 1 / θ ,
where G 1 is the quantile that corresponds to the CDF of the baseline distribution G ( x ; τ ) .
Therefore, the median and the corresponding upper and lower quantiles are, respectively, obtained as follows:
M e d i a n = G 1 1 exp γ log [ 1 ( 0.5 ) 1 / α ] 1 / θ , X ( 0.25 ) = G 1 1 exp γ log [ 1 ( 0.75 ) 1 / α ] 1 / θ , X ( 0.75 ) = G 1 1 exp γ log [ 1 ( 0.25 ) 1 / α ] 1 / θ .

5.2. Moment

The rth moment of EF-G can be obtained directly using the expansion of the PDF of the EF-G family in (17) as follows:
E ( X r ) = 0 x r f ( x ; Θ ) d x = m = 0 n η m 0 x r f E x p - G ( x ; j + m + ν 1 + 1 ) d x = m = 0 n η m E ( Y m r ) ,
where Y m E x p - G j + m + ν 1 + 1 ; see [15] for the moment expression for some G distributions for obtaining E ( X r ) .

5.3. Moment Generating Function (MGF)

Similarly, the MGF of the EF-G is given by
M ( t ) = E ( e t X ) = 0 e t x f ( x ; Θ ) d x = m = 0 n η m 0 e t x f E x p - G ( x ; j + m + ν 1 + 1 ) d x = m = 0 n η m M Y m ( t ) ,
where M Y m is the MGF of Exp-G.

5.4. Incomplete Moment

The sth incomplete moment of the EF-G is obtained as follows:
I ( X s ) = E ( X s ) = 0 z x s f ( x ; α , θ , γ , τ ) d x = m = 0 n η m 0 z x s f E x p - G ( x ; j + m + ν 1 + 1 ) d x = m = 0 n η m I ( Y m s ) ,
where I ( Y m s ) is the incomplete sth moment for the Exp-G.

5.5. Rényi Entropy

This determines the amount of variation of the uncertainty; see [23]. It has the following form:
I R ( δ ) = 1 1 δ log 0 f δ ( x ) d x , δ 1 , δ > 0 .
Using the same approach used to expand the PDF of EF-G, we apply the expansion in (11) and (12) to the PDF of EF-G in (4), that is,
f δ ( x ; Θ ) = α θ δ k , i , j = 0 ( 1 ) k + i i ! δ ( α 1 ) k δ + j 1 ) j × [ G ( x ; τ ) ] j g δ ( x ; τ ) γ θ ( δ + i ) ( k + δ ) i [ 1 ( 1 C H F ( x , τ ) ) ] δ ( θ + 1 ) + i θ .
Using (11), (13), and (14), respectively, f δ ( x ; Θ ) is reduced to
f δ ( x ; Θ ) = α θ γ θ δ m = 0 n Ψ m g δ ( x ; τ ) [ G ( x ; τ ) ] j + m + ν 1 ( j + m + ν 1 + δ ) δ ,
where
Ψ m = k , i , j , n = 0 ν 1 = 0 ν 2 = 0 ν 1 ( 1 ) k + i + n + m + ( ν 1 + ν 2 ) m γ i θ ( k + δ ) i i ! ( m ν 2 ) ( j + m + ν 1 + δ ) δ δ ( α 1 ) k δ + j 1 j θ ( i + δ ) + δ + n 1 n n m ν 1 m ν 1 ν 1 ν 2 P ν 2 , ν 1 ,
where P ν 2 , ν 1 is defined in (15). Therefore,
I R ( δ ) = 1 1 δ δ log α θ + θ δ log ( γ ) + 1 1 δ log m = 0 n Ψ m 0 g δ ( x ; τ ) [ G ( x ; τ ) ] j + m + ν 1 ( j + m + ν 1 + δ ) δ d x .
The I R ( δ ) for the EF-G family is expressed as
I R ( δ ) = δ [ log α θ ) + θ log ( γ ) ] 1 δ + 1 1 δ log m = 0 n Ψ m δ δ j + m + ν 1 + δ δ e ( 1 δ ) I R E x p - G ,
where I R E x p - G is the Rényi entropy of the Exp-G family.

5.6. Order Statistics

If there is a random sample (r.s.) x 1 , x 2 , , x n from EF-G with x 1 : n < x 2 : n < < x n : n , then the density of the ith order statistics of EF-G is defined as
f i : n ( x ; Θ ) = n ! ( i 1 ) ! ( n i ) ! f ( x ; Θ ) F ( x ; Θ ) i 1 1 F ( x ; Θ ) n i .
Using (13) to expand 1 F ( x ; Θ ) n i , (24) will be reduced to
f i : n ( x ; Θ ) = a = 0 n i ( 1 ) a n ! ( i 1 ) ! ( n i ) ! n i a f ( x ; Θ ) F ( x ; Θ ) a + i 1 ,
where both f ( x ; Θ ) and F ( x ; Θ ) are given by (17) and (19).

6. Estimation of the EF-G Parameters

The ML method is used to estimate the parameters of EF-G family. If x 1 , x 2 , , x n is an r.s. from EF-G, then the log-likelihood () for Θ is
= n log α + n log θ + n θ log γ + i = 1 n log g ( x ; τ ) i = 1 n log 1 G ( x ; τ ) ( θ + 1 ) i = 1 n log log [ 1 G ( x ; τ ) ] i = 1 n γ log [ 1 G ( x ; τ ) ] θ + ( α 1 ) i = 1 n log 1 e x p γ log [ 1 G ( x ; τ ) ] θ .
The partial derivative of (26) with respect to α , θ , γ , and τ will take the following forms:
α = n α + i = 1 n log 1 e x p γ log [ 1 G ( x ; τ ) ] θ ,
θ = n θ + n log γ i = 1 n log log G ( x ; τ ] i = 1 n log γ log [ 1 G ( x ; τ ) ] γ log [ 1 G ( x ; τ ) ] θ + α 1 i = 1 n log γ log [ 1 G ( x ; τ ) ] γ log [ 1 G ( x ; τ ) ] θ e γ log [ 1 G ( x ; τ ) ] θ 1 e γ log [ 1 G ( x ; τ ) ] θ ,
γ = n θ γ + θ i = 1 n γ log [ 1 G ( x ; τ ) ] θ 1 log [ 1 G ( x ; τ ) ] i = 1 n α 1 θ γ log [ 1 G ( x ; τ ) ] θ 1 e γ log [ 1 F ( x ; τ ) ] θ log [ 1 G ( x ; τ ) ] 1 e γ log [ 1 G ( x ; τ ) ] θ ,
τ = τ i = 1 n log g ( x ; τ ) τ i = 1 n log 1 G ( x ; τ ) τ ( θ + 1 ) i = 1 n log log [ 1 G ( x ; τ ) ] τ i = 1 n γ log [ 1 G ( x ; τ ) ] θ + τ ( α 1 ) i = 1 n log 1 e x p γ log [ 1 G ( x ; τ ) ] θ .
Then, the ML estimates of the vector of parameters Θ are derived by solving the above equations using iterative techniques. In addition, in (26) can be maximized by employing any optimization technique in any statistical software (e.g., R package).

7. Numerical Study

This section presents some numerical results of a simulation to assess the accuracy of the ML estimates and evaluate their performance. The simulation study was conducted for the EF-Lomax distribution. That is, the simulation was conducted as follows:
  • Generate data from EF-Lomax by setting U = F E F - L ( x ) given by (9), where U u n i f o r m ( 0 , 1 ) , such that
    X ( u ) = λ exp γ β log [ 1 ( 1 u ) 1 / α ] 1 / θ 1 , u ( 0 , 1 ) .
  • Four sample sizes, n = 30 , 50 , 100 , 200 , with the two sets of the true parameters Θ t r u ; the simulation for each sample size is considered over 1000 iterations.
The ML estimates for each estimator Θ ^ can be evaluated using the relative mean square error (RMSE), which is given by
R M S E ( Θ ^ ) = i = 1 1000 ( Θ ^ i Θ t r u ) 2 1000 .
The R programming language [24] was used to carry out Monte Carlo simulation studies. Table 1 reports the results for the EF-Lomax parameter estimates and the RMSE for the two different sets.
The simulation results in Table 1 show that the RMSE decreases when the sample size increases, and hence, the estimates improve. This provides evidence that the ML method presents a good performance when estimating the parameters of the EF-G family.

8. Applications

In this section, the applications of the EF-G family are demonstrated by considering the exponential and Lomax as the baseline distributions in two real applications. The performance of two members of the EF-G family—the EF-E and EF-L distributions—is illustrated by comparing the Akaike information criterion (AIC) and corrected AIC, denoted by CAIC, with other competitive distributions. The distribution with the lower AIC and CAIC values will have a better fit. Finally, we present the plots of the two datasets to visually compare between the fitted densities.
Dataset I: Represents the fatigue time data described in [25]. The data are given as follows:
70 90 96 97 99 100 103 104 104 105 107 108 108 108 109 109 112 112 113 114 114 114 116 119 120 120 120 121 121 123 124 124 124 124 124 128 128 129 129 130 130 130 131 131 131 131 131 132 132 132 133 134 134 134 134 134 136 136 137 138 138 138 139 139 141 141 142 142 142 142 142 142 144 144 145 146 148 148 149 151 151 152 155 156 157 157 157 157 158 159 162 163 163 164 166 166 168 170 174 196 212
We compare the fit of the EF-L in (10) with that of the Exp-G from [26] for the G is exponential (Exp-E) and G is Fréchet (Exp-F), as well as the EF from [14], the exponentiated generalized-Fréchet (EG-F) from [27], and Fréchet and exponential distributions.
Dataset II: These data were obtained from [28]; they provide the lifetimes of 43 patients in Saudi Arabia suffering from blood cancer (in days). The data are given as follows:
115, 181, 255, 418, 441, 461, 516, 739, 743, 789, 807, 865, 924, 983, 1025, 1062, 1063, 1165, 1191, 1222, 1222, 1251, 1277, 1290, 1357, 1369, 1408, 1455, 1478, 1519, 1578, 1578, 1599, 1603, 1605, 1696, 1735, 1799, 1815,1852, 1899, 1925, 1965.
The fit of the EF-L distribution for this data is compared with the fits of the exponentiated Lomax (Exp-L), Exp-F, EF, exponentiated generalized Lomax (EG-L), EG-F, Lomax, and Fréchet distributions.
The ML estimates and associated model criteria of the distributions for datasets I and II are, respectively, reported in Table 2 and Table 3.
It can be observed from Table 2 and Table 3 that both EF-E and EF-L have the smaller AIC, CAIC, and Kolmogorov–Smirnov (K-S) test statistics, which means that EF-E and EF-L provide a better fit compared to other competing distributions.
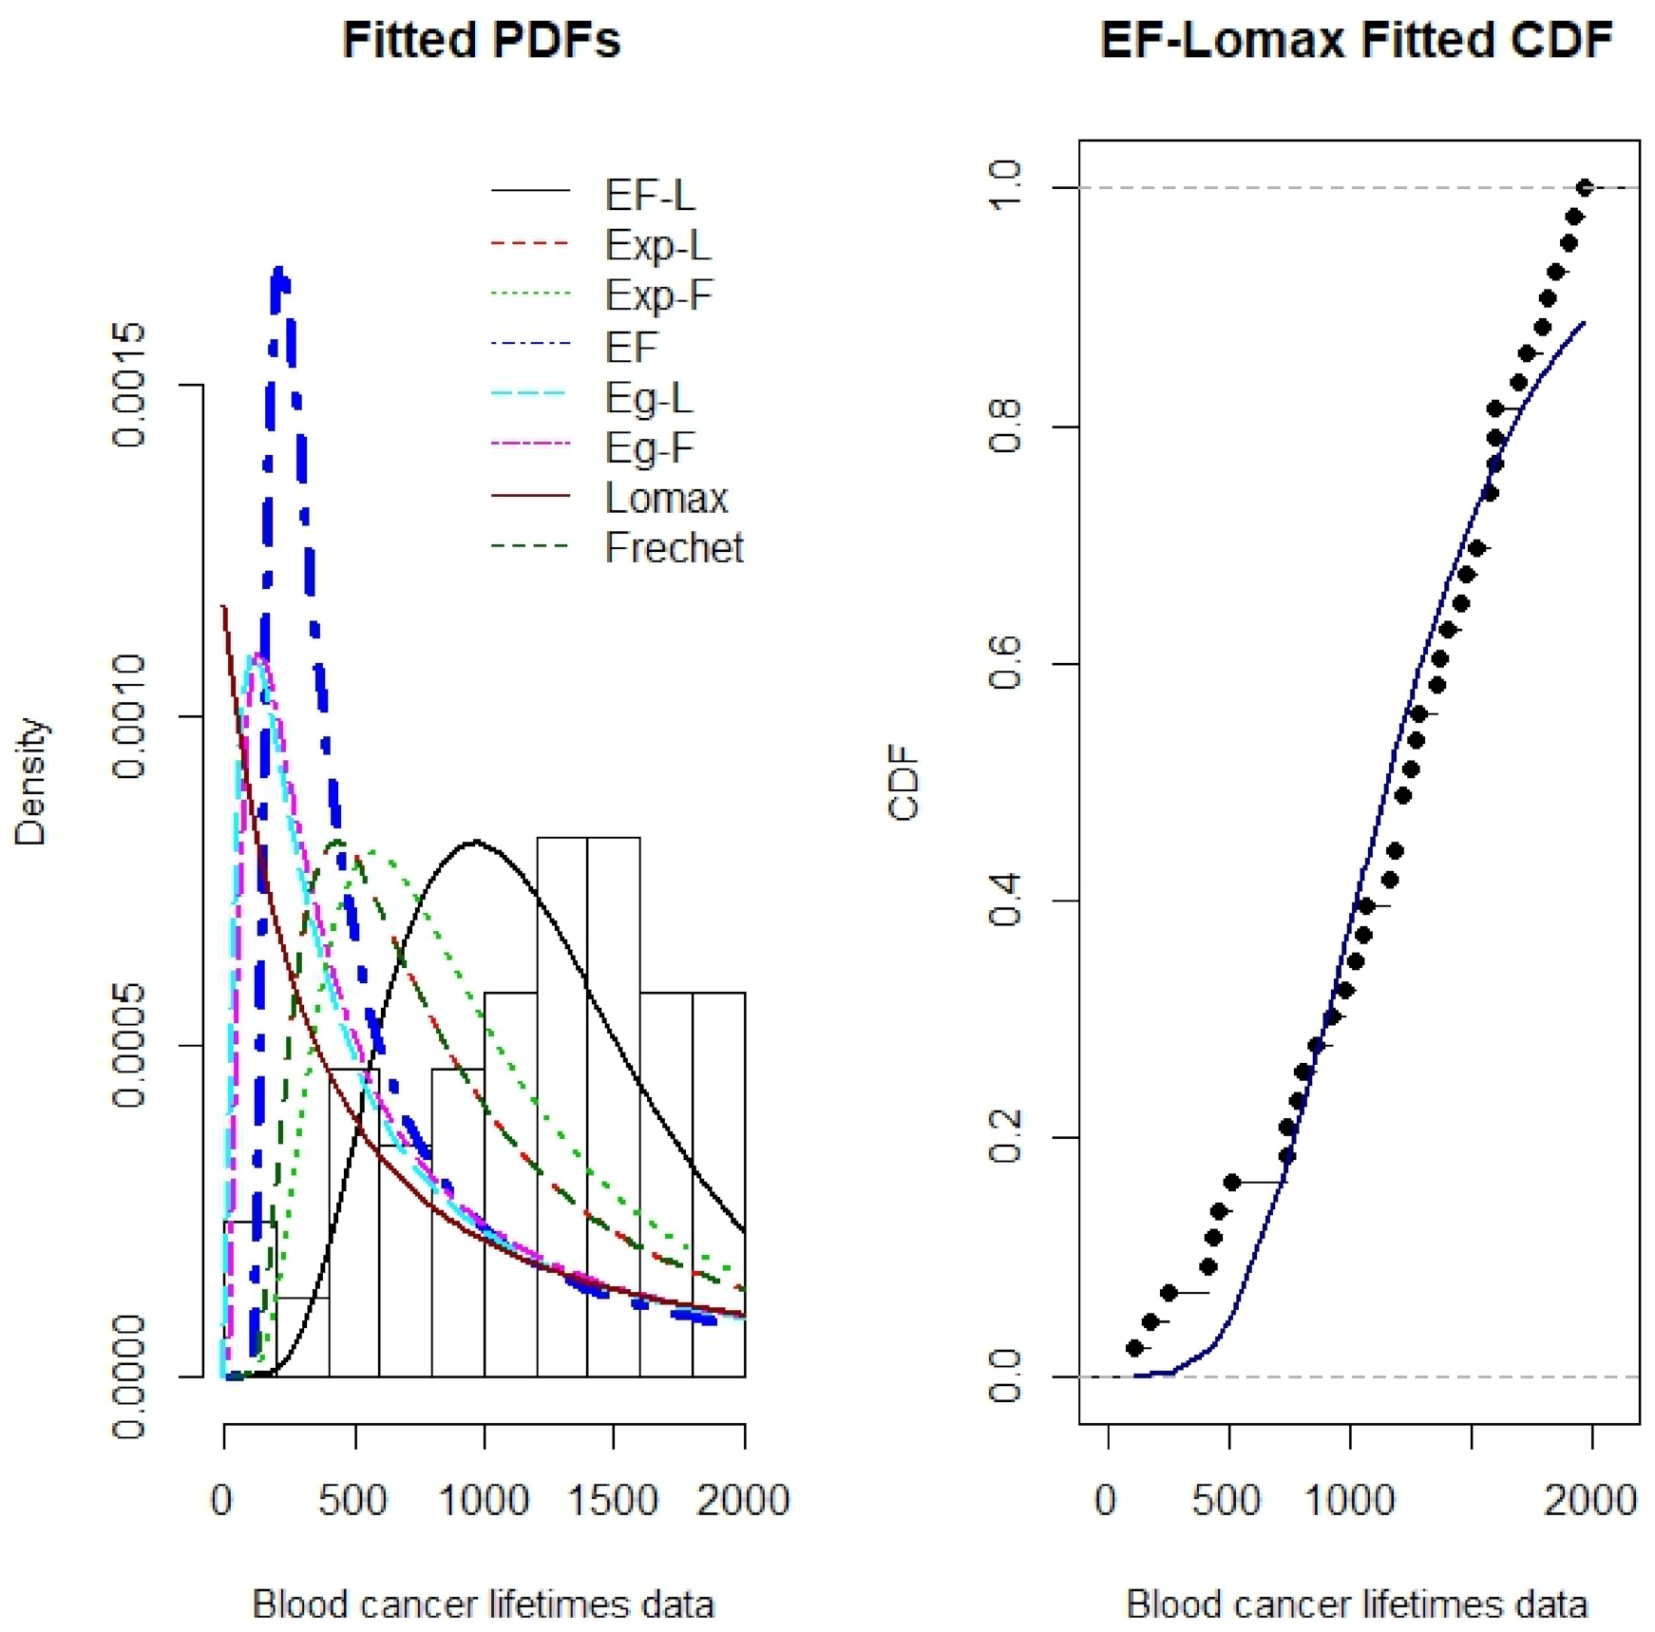
Figure 5 and Figure 6 display the fitted densities for both datasets. In addition, it is clear from these Figures that EF-E and EF-L show a more adequate fit to data histograms that capture the skewness of the two datasets well in comparison to other distributions.

9. Concluding Remarks

There has been more interest in introducing newly generated classes of distributions. In this article, we established the EF-G family of distributions. Useful expansions for the PDF and CDF functions of EF-G were obtained. We derived the main mathematical features, including the quantile, moment, median, incomplete moment, order statistics, and entropy. The family parameters were estimated using the ML method. Two special members, EF-E and EF-L, were employed for fitting real datasets. Both the EF-E and EF-L provided better fits in terms of goodness-of-fit measures compared to other competing distributions. Thus, the EF-G family and its generated distributions are promising and could be attractive for more practical applications in different fields.

Author Contributions

Conceptualization, L.A.B.; methodology, L.A.B.; software, L.A.B.; validation, L.A.B. and H.H.A.; investigation, L.A.B. and H.H.A.; data curation, L.A.B.; writing—original draft preparation, L.A.B.; writing—review and editing, L.A.B. and H.H.A.; visualization, L.A.B.; supervision, L.A.B.; All authors have read and agreed to the published version of the manuscript.

Funding

This research received no external funding.

Institutional Review Board Statement

Not applicable.

Informed Consent Statement

Not applicable.

Data Availability Statement

Not applicable.

Conflicts of Interest

The authors declare no conflict of interest.

References

  1. Eugene, N.; Lee, C.; Famoye, F. Beta-normal distribution and its applications. Commun. Stat. Theory Methods 2002, 31, 497–512. [Google Scholar] [CrossRef]
  2. Cordeiro, G.M.; de Castro, M. A new family of generalized distributions. J. Stat. Comput. Simul. 2011, 81, 883–898. [Google Scholar] [CrossRef]
  3. Tahir, M.H.; Cordeiro, G.M.; Alizadeh, M.; Mansoor, M.; Zubair, M.; Hamedani, G.G. The odd generalized exponential family of distributions with applications. J. Stat. Distrib. Appl. 2015, 2, 1. [Google Scholar] [CrossRef] [Green Version]
  4. Bourguignon, M.; Silva, R.B.; Cordeiro, G.M. The Weibull-G family of probability distributions. J. Data Sci. 2014, 12, 53–68. [Google Scholar] [CrossRef]
  5. Alzaatreh, A.; Ghosh, I. On the Weibull-X family of distributions. J. Stat. Theory Appl. 2015, 14, 169–183. [Google Scholar] [CrossRef] [Green Version]
  6. Alzaatreh, A.; Lee, C.; Famoye, F. A new method for generating families of continuous distributions. Metron 2013, 71, 63–79. [Google Scholar] [CrossRef] [Green Version]
  7. Gomes-Silva, F.S.; Percontini, A.; de Brito, E.; Ramos, M.W.; Venâncio, R.; Cordeiro, G.M. The odd Lindley-G family of distributions. Austrian J. Stat. 2017, 46, 65–87. [Google Scholar] [CrossRef] [Green Version]
  8. Alizadeh, M.; Cordeiro, G.M.; Nascimento, A.D.; Lima, M.d.C.S.; Ortega, E.M. Odd-Burr generalized family of distributions with some applications. J. Stat. Comput. Simul. 2017, 87, 367–389. [Google Scholar] [CrossRef]
  9. Haq, M.; Elgarhy, M. The odd Fréchet-G family of probability distributions. J. Stat. Appl. Probab. 2018, 7, 189–203. [Google Scholar] [CrossRef]
  10. Nasiru, S. Extended odd Fréchet-G family of distributions. J. Probab. Stat. 2018, 2018. [Google Scholar] [CrossRef]
  11. Reyad, H.; Korkmaz, M.Ç.; Afify, A.Z.; Hamedani, G.; Othman, S. The Fréchet Topp Leone-G Family of Distributions: Properties, Characterizations and Applications. Ann. Data Sci. 2019, 1–22. [Google Scholar] [CrossRef]
  12. Bantan, R.A.; Jamal, F.; Chesneau, C.; Elgarhy, M. Type II power Topp-Leone generated family of distributions with statistical inference and applications. Symmetry 2020, 12, 75. [Google Scholar] [CrossRef] [Green Version]
  13. Almarashi, A.M.; Elgarhy, M.; Jamal, F.; Chesneau, C. The exponentiated truncated inverse Weibull-generated family of distributions with applications. Symmetry 2020, 12, 650. [Google Scholar] [CrossRef] [Green Version]
  14. Nadarajah, S.; Kotz, S. The exponentiated Fréchet distribution. Interstat Electron. J. 2003, 14, 1–7. [Google Scholar]
  15. Nadarajah, S.; Kotz, S. The exponentiated type distributions. Acta Appl. Math. 2006, 92, 97–111. [Google Scholar] [CrossRef]
  16. Kotz, S.; Nadarajah, S. Extreme Value Distributions: Theory and Applications; Imperial College Press: London, UK, 2000. [Google Scholar]
  17. Coles, S.; Bawa, J.; Trenner, L.; Dorazio, P. An Introduction to Statistical Modeling of Extreme Values; Springer: Berlin, Germany, 2001; Volume 208. [Google Scholar]
  18. Nadarajah, S.; Cordeiro, G.M.; Ortega, E.M.M. The Zografos–Balakrishnan-G family of distributions: Mathematical properties and applications. Commun. Stat. Theory Methods 2015, 44, 186–215. [Google Scholar] [CrossRef]
  19. Cordeiro, G.M.; Ortega, E.M.M.; Ramires, T.G. A new generalized Weibull family of distributions: Mathematical properties and applications. J. Stat. Distrib. Appl. 2015, 2, 13. [Google Scholar] [CrossRef] [Green Version]
  20. Klakattawi, H.S. The Weibull-Gamma Distribution: Properties and Applications. Entropy 2019, 21, 438. [Google Scholar] [CrossRef] [Green Version]
  21. Mudholkar, G.S.; Srivastava, D.K.; Kollia, G.D. A generalization of the Weibull distribution with application to the analysis of survival data. J. Am. Stat. Assoc. 1996, 91, 1575–1583. [Google Scholar] [CrossRef]
  22. Gupta, R.D.; Kundu, D. Exponentiated exponential family: An alternative to gamma and Weibull distributions. Biom. J. J. Math. Methods Biosci. 2001, 43, 117–130. [Google Scholar] [CrossRef]
  23. Stacy, E.W. A generalization of the gamma distribution. Ann. Math. Stat. 1962, 33, 1187–1192. [Google Scholar] [CrossRef]
  24. R Core Team. R: A Language and Environment for Statistical Computing; R Foundation for Statistical Computing: Vienna, Austria, 2013. [Google Scholar]
  25. Birnbaum, Z.W.; Saunders, S.C. Estimation for a family of life distributions with applications to fatigue. J. Appl. Probab. 1969, 6, 328–347. [Google Scholar] [CrossRef]
  26. Gupta, R.C.; Gupta, P.L.; Gupta, R.D. Modeling failure time data by Lehman alternatives. Commun. Stat.-Theory Methods 1998, 27, 887–904. [Google Scholar] [CrossRef]
  27. Cordeiro, G.M.; Ortega, E.M.; da Cunha, D.C. The exponentiated generalized class of distributions. J. Data Sci. 2013, 11, 1–27. [Google Scholar] [CrossRef]
  28. Abouammoh, A.; Abdulghani, S.; Qamber, I. On partial orderings and testing of new better than renewal used classes. Reliab. Eng. Syst. Saf. 1994, 43, 37–41. [Google Scholar] [CrossRef]
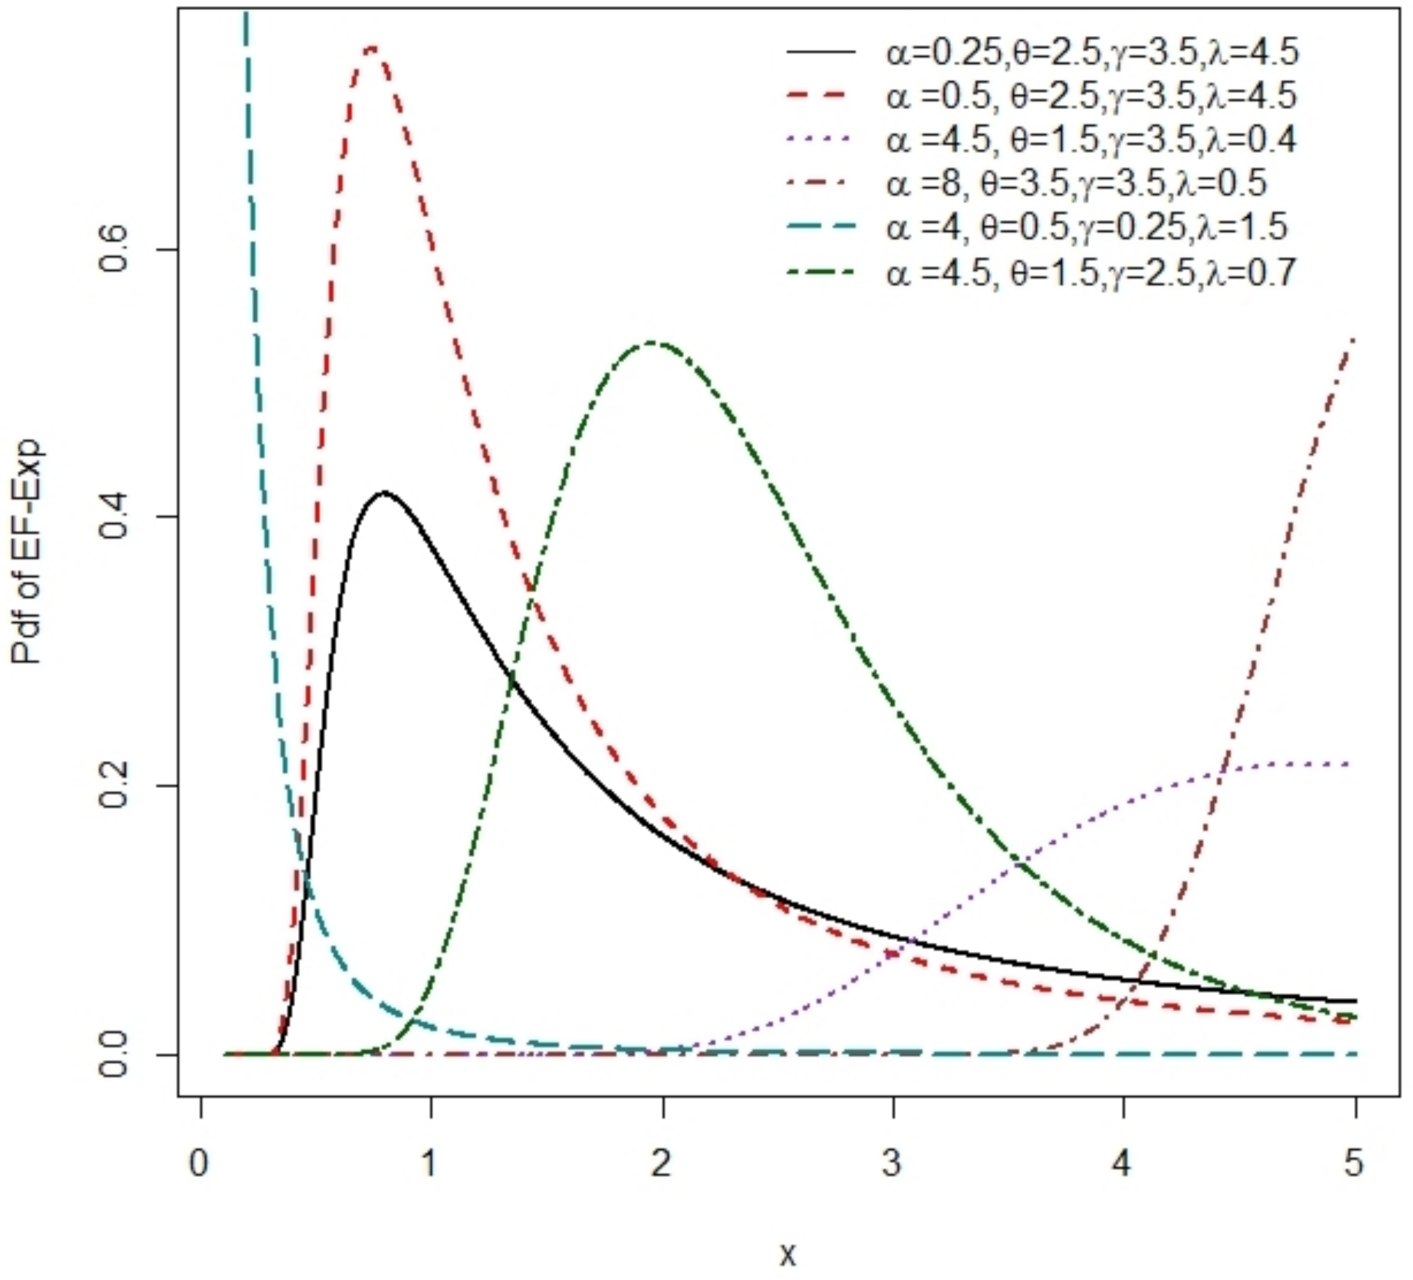
Figure 1. PDF plots of the EF-E distribution.
Symmetry 13 00572 g001
Figure 2. PDF plots of the EF-L distribution.
Symmetry 13 00572 g002
Figure 3. HF plots of the EF-E distribution.
Symmetry 13 00572 g003
Figure 4. HF plots of the EF-L distribution.
Symmetry 13 00572 g004
Figure 5. Fitted PDFs for the blood cancer data and the estimated cumulative distribution function (CDF) for the EF-exponential (EF-E) distribution.
Symmetry 13 00572 g005
Figure 6. Fitted PDFs for the EF-Lomax for the fatigue time data and the estimated CDF for the EF-Lomax distribution.
Symmetry 13 00572 g006
Table 1. EF-Lomax parameter estimates and relative mean square error (RMSE) for the two different sets.
Set I: Θ t r u = ( α = 6.0 , θ = 4.0 , γ = 2.0 , β = 0.5 , λ = 0.2 )
α θ γ β λ
n = 30 MLE5.61174.26081.69151.71630.7071
RMSE1.14360.56090.68741.75370.6173
n = 50 MLE5.98963.99991.83930.56240.2147
RMSE0.05320.00090.23170.38290.2857
n = 100 MLE6.00554.00111.82490.59440.2132
RMSE0.10360.00270.22020.44500.2871
n = 200 MLE5.98593.99981.82470.56820.2131
RMSE0.03130.00080.19570.37290.2870
Set II: Θ t r u = ( α = 6.0 , θ = 4.0 , γ = 2.0 , β = 0.5 , λ = 0.2 )
α θ γ β λ
n = 30 MLE2.12024.97563.14690.99550.9921
RMSE0.88090.07410.33500.57540.3170
n = 50 MLE2.03364.98303.11850.97970.9694
RMSE0.72720.05640.29250.51330.2741
n = 100 MLE1.99194.99373.11610.97710.9288
RMSE0.51420.03190.21870.36840.2300
n = 200 MLE2.00724.99943.08321.01260.9033
RMSE0.41930.02020.17420.32170.2237
Table 2. ML estimates and associated model criteria for the fatigue time data.
Distribution Estimates AICCAICK–S
EF-E12.012.352.250.01922.91923.320.0820
Exp-E281.640.04--929.22931.840.1082
Exp-F0.125.05184.57-956.37960.290.1328
EF5.79173.482.80-924.99928.920.0965
EG-F95.690.2024.3547.56959.72964.950.1457
Fréchet5.05120.78--954.37956.980.1328
Exponential0.01---1192.961194.270.4929
Table 3. ML estimates and associated model criteria for the blood cancer data.
Distribution Estimates AICCAICK–S
EF-L110.290.274.1138.990.02685.58687.200.1754
Exp-L12.570.0031.94--699.04699.660.2031
Exp-F45.791.1828.81--710.58713.220.2602
EF0.161953.57--744.84747.480.3834
EG-L3.012.830.010.22-742.81747.480.3235
EG-F13.920.920.7510.51-738.79742.310.3463
Lomax0.0020.58---746.97748.730.3275
Fréchet1.18717.98---708.57710.340.2627
Publisher’s Note: MDPI stays neutral with regard to jurisdictional claims in published maps and institutional affiliations.