Abstract
The increase in the throughput of digital television and radio broadcasting (DVB) channels can be achieved due to application of signals with a compact spectrum and a relatively small peak-to-average power ratio (PAPR). The reason is the usage of traveling wave tubes (TWT) for amplifying and transmitting signals from a satellite repeater in DVB-S2X systems. At the same time, given that the bandwidth allocated for transmission should be used as efficiently as possible, a high reduction rate of out-of-band emissions level is required. The most effective solution in this direction is the transition to spectrum-economic signals, such as optimal Faster-Than-Nyquist (FTN) signals, which can provide a certain reduction rate of the out-of-band emissions level and minimum acceptable PAPR. This article proposes a method for obtaining optimal FTN pulses, which have symmetry in time domain, with specified PAPR and reduction rate of out-of-band emissions for the quadrature phase shift keying (QPSK) and offset quadrature phase shift keying (OQPSK). The possibility of synthesizing signals with OQPSK modulation is presented theoretically for the first time. Optimal FTN signals can provide PAPR reduction by at most 3 dB and outperform known root raised cosine (RRC) pulses. The simulation model adopts an architecture for quadrature generation of optimal FTN signals with OQPSK modulation with blocks for adjustable pre-amplification, clipping, and power amplification. The proposed signals can be used to increase the spectral and energy efficiencies of satellite broadcasting systems, such as DVB-S2/S2X, as well as low-rate return channels of interactive broadcasting systems with a frequency resource shortage.
1. Introduction
Both single-carrier signals with multilevel modulation and multi-carrier signals with orthogonal frequency division multiplexing (OFDM) [1,2] have significant drawbacks. Such random signals have a high peak-to-average power ratio (PAPR), reaching a value of more than 10–15 dB. At the same time, in digital television and radio broadcasting (DVB) transmission equipment, especially that used in DVB-S2X satellite applications, traveling-wave tube (TWT) amplifiers with power of up to 1 kW and powerful transistors having power of up to 100 W [3,4,5,6] are used. These devices have a nonlinear frequency response with a relatively small linear region. Therefore, the developers of such equipment tend to develop signals able to satisfy the requirements not only for transmitting the maximum amount of information in the allocated frequency band but also for effective use of amplifying devices. The second requirement can be met by the application of signals with a reduced PAPR compared to known cases. In such conditions, the use of signals with a reduced PAPR increases the average power of the radiated oscillations while maintaining the same total operating energy costs. Therefore, either the quality of information detection may be improved or the distance between transmitting and receiving stations may be increased.
Recently, the option of using Faster-than-Nyquist (FTN) signals in DVB-S2X satellite application systems have been actively considered [7,8,9,10,11]. Typically, FTN signals are formed with the use of filtering method. It is based on the method of forming root raised cosine (RRC) pulses with time and spectral characteristics determined by the type of frequency response of the shaping filter with a roll-off factor . The energy efficiency is determined by the correlation properties of random FTN signals based on RRC pulses. In turn, the correlation properties of FTN signals depend on the frequency response of the filter. Long pulse duration significantly exceeds the symbol transmission time T and therefore causes random intersymbol interference (ISI) in signal packet. As a result, ISI leads to energy losses. Random signal packet based on RRC pulses has high PAPR. PAPR value depends on several factors: the depth of random ISI influenced by the duration of the applied pulses, the pulse shape, and the transmission rate of the channel symbols. For instance, a bandpass signal packet with binary phase shift keying (BPSK), pulse duration and roll-off factor transmitted at the rate has PAPR equal to 6 dB. Reducing roll-off factor to zero results into PAPR equal to 7 dB. An increase in pulse duration to = 16T causes an increase in PAPR by about 0.5 dB.
To reduce the PAPR, as a rule, the amplitude limitation of the emitted oscillations or clipping is used [12,13,14]. However, joint application of clipping and preamplifier can increase the average power of oscillations emitted by the transmitter and cause significant increases in the level of out-of-band emissions and correlation coefficient.
Another method for FTN signal generation assumes the synthesis of optimal pulse shapes. Optimal FTN signals obtained as the mathematical solution to the optimization problem [8,15,16,17] can provide high information transmission rates [18]. An integral part of the optimization process includes requirements for signal spectrum compactness, detection reliability, and technical and economic constraints. These requirements determine the time and spectral parameters of optimal pulses and random signal sequences. The duration of such signals exceeds the time interval of one information bit (for binary transmission without coding). The emerging ISI in the signal sequence is not random but controllable. The ISI level can be controlled at the stage of the optimization problem solving by introducing the constraint on the cross-correlation coefficient. The low value of this coefficient provides high energy efficiency of optimal FTN signals when coherent symbol-by-symbol detection algorithms are used.
Therefore, the possibility of obtaining optimal FTN pulse shapes with the constraint on the PAPR of a random signal sequence should be considered. It should be mentioned that it is not reasonable to expect revolutionary results in reducing PAPR because of the physical and mathematical reasons for the optimization problem-solving. However, a PAPR reduction of 2–3 dB can be expected. When optimizing the FTN pulse shape with the constraint on the PAPR, it is necessary to establish quantitative relations between the clipping level and the extension of the occupied frequency band, as well as the change in the cross-correlation coefficient value.
The main aim of the work is to determine the possibilities of reducing PAPR of oscillations by using finite-time optimal quadrature FTN signals with pulse duration exceeding the transmission time T of one symbol and with the constraint on PAPR.
The paper considers the time and spectral characteristics of random sequences of optimal FTN signals with offset quadrature modulation. The results of reducing the PAPR of oscillations are also analyzed. The possibilities of increasing the average power of radiated oscillations while maintaining the total operating energy cost unchanged are introduced. The rest of the work is organized as follows. In the theoretical part of the work (Section 2), the shape of FTN signals with offset quadrature modulation and the method of obtaining the pulse shapes by the optimization problem-solving are presented. The optimization criterion ensuring the fixed reduction rate of the level of out-of-band emissions outside the occupied frequency band is used. This section is divided into two subsections. Section 2.1 describes the features of the optimization problem-solving and the iterative procedure of minimizing the optimization functional. The forms of intermediate three-dimensional surfaces, providing local minima of the optimization functional, are shown. The examples of solutions to the optimization problem for different pulse duration are given in Section 2.2. In the practical part of the work, a simulation model of information transmission with the use of optimal FTN signals is presented. Section 3 contains the algorithm of the simulation model and the possibilities of simulation modeling. This section also includes the model of information transmission with the use of adjustable preamplifier and amplitude limiter in the radio transmission path. The results of simulation modeling for a channel with additive white Gaussian noise and for a frequency-flat Rayleigh fading channel are given in Section 4. Finally, Section 5 concludes this work, summarizing the results of applying offset quadrature optimal FTN signals with reduced PAPR of radiated oscillations.
2. Optimization Problem with Constraint on PAPR
Consider the representation of a random sequence of signals with offset quadrature phase shift keying (OQPSK). The transmitted binary message consisting of N characters with the symbol rate can be expressed as:
where denotes a channel alphabet symbol and denotes a rectangular pulse shape:
A signal sequence with OQPSK having amplitude , carrier frequency , and an arbitrary pulse shape can be expressed as:
To simplify calculations, the initial phase is set to . Note that the sequence (1) can be divided into two quadrature streams consisting of even and odd symbols transmitted at the rate of .
The shape of function in time interval (L = 1, 2, …) is determined as a solution to the optimization problem [8,19]. The main requirement of the optimal signal generation is the requirement for the maximum spectral filling of the allocated frequency band. This requirement is met by using the optimization criterion of ensuring the specified reduction rate of out-of-band emissions level. Solutions to this problem are considered in [20] for signals with binary phase shift keying (BPSK). The natural requirement for the cross-correlation coefficient (the condition of the guaranteed level of the BER performance), the pulse duration, and signal energy represent the optimization problem constraints. Consider the application of such signals with OQPSK and constraint on PAPR.
The optimization criterion of ensuring the specified reduction rate of the level of out-of-band emissions is adopted. The optimization function can be expressed as [19,20]:
In (6), the symmetrical weighting function (n = 1, 2, 3, …), together with the boundary conditions that are given below, determines the reduction rate of the energy spectrum level of the synthesized signals. The shapes of function are presented in Figure 1, where it can be seen that, by adjusting the value of n, it is possible to achieve the required reduction rate of the energy spectrum level.
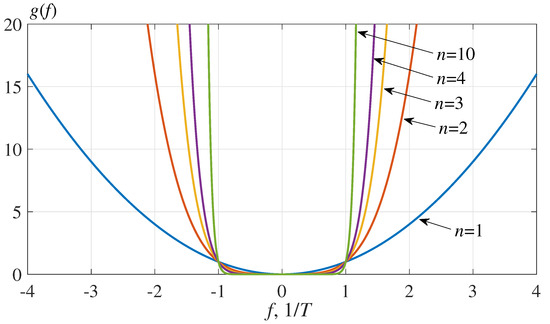
Figure 1.
Weighting function shape.
With a proper choice of the energy spectrum parameters of synthesized signals, the occupied frequency band can be determined based on the criterion of the energy spectrum level relative to the maximum value of the energy spectrum. For instance, corresponds to the occupied bandwidth for the power spectrum level of −30 dB.
The analytical solution to the optimization problem (6) is possible only for the parameters n = 1 and the pulse duration equal to T [21]. In [22], the analytical solution to more complex optimization cases with quadrature signals and is brought to the Lagrange equations, which can be solved numerically. When the number of optimization constraints or the values of optimization parameters (i.e., n, ) increase, the analytical closed-form solution cannot be obtained. To solve (6), numerical methods for solving the Lagrange equations can be applied [23].
The desired pulse shape is represented as the expansion in a limited Fourier series, where m denotes the number of expansion coefficients. Suppose that is an even and symmetric function in the interval :
The optimization problem (6) can be reduced to the problem of finding a set of coefficients that correspond to the minimum of a function of many variables [19,20]:
The value of m is determined based on the representation accuracy of sought function , and it is usually between 10 and 14 [20] for FTN signals with a duration of up to = 16–32 T.
The constraints on signal energy and boundary conditions that provide the energy spectrum reduction rate of at least are as follows [24]:
where denotes the kth derivative of the function .
The nonlinear inequality constraint on the ISI level can be expressed numerically using the cross-correlation coefficient [20]:
The bit rate R of binary channel symbols is included in constraint (10) and affects the cross-correlation coefficient. Introduce an additional constraint on the PAPR magnitude of the jth realization of a random signal packet . The maximum PAPR of signal packet (3) with a packet length , an average power , and a peak power can be calculated by:
The nonlinear inequality constraint on the PAPR may be expressed as follows:
where PAPR denotes the PAPR value before optimization with constraint (13) and PAPR denotes the PAPR value after optimization with (13). After optimization, the maximum PAPR of a signal packet consisting of symbols is reduced by maxPAPR dB.
A feature of solving the optimization problem (8) when using constraint (13) is that the shape of the optimal function will depend on the packet length . Moreover, with an increase in the pulse duration up to = 16T−32 T, the value needs to be increased significantly even for binary signals. Consider the solution of the optimization problem in such conditions in detail.
2.1. Optimization Problem-Solving Method
The procedure of numerical optimization problem solving was carried out in Matlab environment with the help of Optimization Toolbox. The functional has a ravine shape due to the presence of constraints (10) and (13). Functional (6) needs to be found for five optimization parameters: pulse duration , reduction rate of out-of-band emissions , cross-correlation coefficient , maximum peak-to-average power ratio max{PAPR}, and packet length . The packet length is taken into account in the constraint on PAPR. The optimization problem-solving method is as follows. The optimization procedure is divided into two parts. In the first part, only three parameters (, n, and ) are considered. In the second part, their values are fixed, and the five-dimensional space is transformed into the two-dimensional space with parameters max{PAPR} and .
The first part of the optimization procedure is presented in Figure 2. At the start, a rectangular pulse with duration is used. For this signal, it holds that n = 0, and the cross-correlation coefficient is at the symbol rate . At the first stage, the optimal pulse shape with a duration has to be found. An increase in the duration leads to the appearance of ISI and to an increase in the correlation coefficient to a certain value that does not exceed 0.5. The solution obtained at each stage is used as the initial value at the next stage. At the second stage, the required reduction rate of the out-of-band emissions is achieved, for example at . At the third stage, a constraint on the cross-correlation coefficient is introduced. Thus, after the third stage, the optimal pulse shape with a duration , a reduction rate of and correlation coefficient less than or equal to 0.1 is obtained. To obtain a pulse of a longer duration for a given correlation coefficient, the first and third stages are repeated. After completing the first part of the optimization, a pulse of duration = 4T with n = 2 and is obtained.
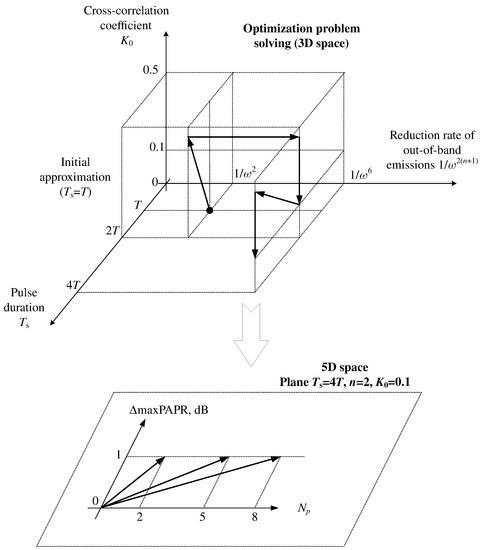
Figure 2.
The optimization problem-solving procedure.
In the second part of the optimization procedure, the limiting parameters max{PAPR} and are considered. By setting = 4T, , and , a plane is obtained. In Figure 2, different arrows correspond to different packet lengths used in the constraint on PAPR (13).
The iterative process of minimizing function (8) results in the expansion of coefficients into a limited Fourier series, where k = 0 … M. The surfaces of function (8) for several coefficients are presented in Figure 3.
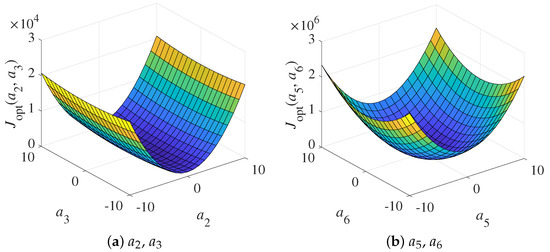
Figure 3.
Surfaces of the optimization function for the optimal function.
2.2. Results of Optimization Problem Solving
Note that the shape of the optimal function depends on the packet length . Start with the values and and estimate the dispersion of the parameters of the obtained optimal functions.
Consider the solution to the optimization problem for a transmission rate , a cross-correlation coefficient (10), and a pulse duration = 4T. Next, analyze the change in the shape of function and the corresponding spectral characteristics of the signal sequences, taking into account the constraint on maximum PAPR (up to 2–3 dB) for a different number of bits in the packet (Figure 4 and Figure 5 for = 4T).
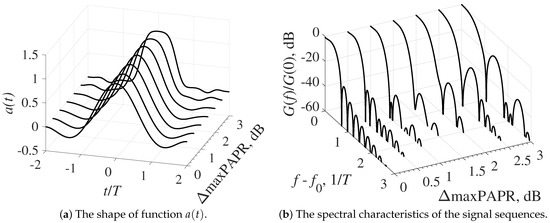
Figure 4.
Results of the optimization problem for = 4T with the constraint on the PAPR for the packet length .
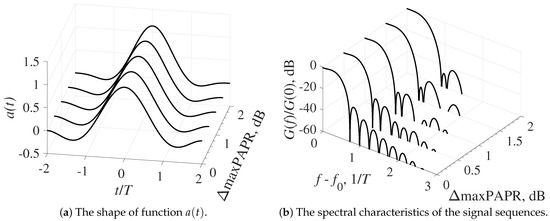
Figure 5.
Results of the optimization problem solving for with the constraint on PAPR for the packet length .
The analysis of time and spectral characteristics of optimal FTN signals with a fixed pulse duration of shows that the requirement for reducing the maximum PAPR of a packet by 3 dB leads to the significant change in the function shape, which is the most apparent for a small packet length, as shown in Figure 4. This change leads to the distortion in the normalized energy spectrum shape. The main lobe of the spectrum expands (see Figure 4 and Figure 5) and the levels of the side lobes closest to the main one increase, although the reduction rate of the level of out-of-band emissions remains unchanged.
Next, consider the solution to the optimization problem for optimal FTN signals with a pulse duration = 8T. As shown in Figure 6 and Figure 7, the change in the function shape mainly concerns the side lobes, which leads to the distortion in the energy spectrum of a random packet of signals.
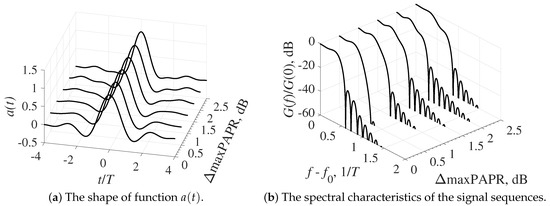
Figure 6.
Results of the optimization problem solving for = 8T with the constraint on PAPR for the packet length .
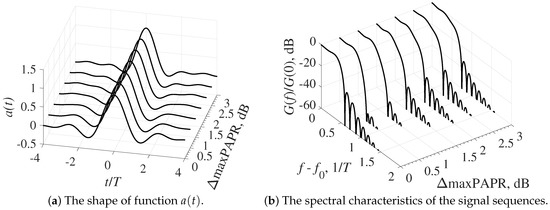
Figure 7.
Results of the optimization problem solving for = 8T with the constraint on PAPR for the packet length .
Based on the intermediate result of the synthesis of optimal FTN signals, it can be concluded that the introduction of a PAPR limitation by at most 3 dB for each of the quadrature components in (3) allows preserving the main spectral characteristics in a given format, i.e., a given reduction rate of the out-of-band radiation level remains unchanged. In this case, the occupied frequency band at the power spectral density level of −40 dB is equal to = (0.8–1). If this value is compared to a similar characteristic of the minimum shift keying (MSK) signals and Gaussian minimum shift keying (GMSK) signals, which are widely used in mobile communications, it can be found that, for MSK, the bandwidth is = (3.5–4) , and, for GMSK signals, the bandwidth is = (1.2–1.3) [25,26]. Thus, the optimal shapes of function provide a significant reduction in the occupied frequency band determined by the required level of out-of-band emissions.
The ultimate goal of the optimization problem is to determine the time and spectral characteristics of random sequences of optimal FTN signals with OQPSK. To achieve this, consider the shape of a packet consisting of 100 bits (3), with 50 bits in each quadrature channel. In Figure 8, the time diagrams of packets of optimal FTN signals with a pulse duration = 4T (Figure 8a) and = 8T (Figure 8b) obtained without taking into account the constraint (13) are shown.
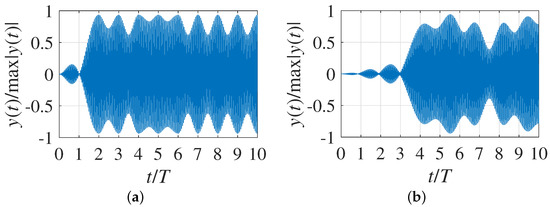
Figure 8.
The shape of normalized signal sequence with OQPSK for: (a) = 4T; and (b) = 8T.
Figure 9 shows the timing diagrams of optimal FTN signal packets with a pulse duration = 4T (Figure 9a) and = 8T (Figure 9b) with a constraint on maximum PAPR maxPAPR = 3 dB. Comparing the view of the sequences in Figure 8 and Figure 9, it can be seen that the introduction of the parameter of limitation on the value of PAPR into the optimization problem made it possible to obtain an increase in the average power of the emitted signals while maintaining the spectral and correlation characteristics unchanged. An increase in the duration of the optimal pulses from = 4T to = 8T leads, as expected, to an increase in the PAPR.
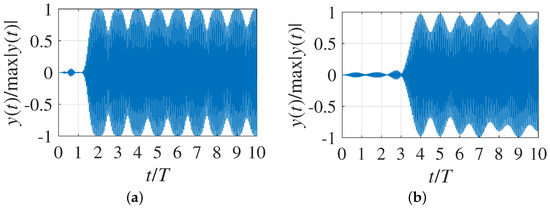
Figure 9.
Optimal FTN signal packet with OQPSK: (a) = 4T, , maxPAPR = 3 dB; and (b) = 8T, , maxPAPR = 3 dB.
Next, consider the proposed method of optimizing function for quadrature phase shift keying (QPSK) and binary phase shift keying (BPSK). The dependence of the PAPR of oscillations on the value maxPAPR is presented in Figure 10, where the symbol rate is , the pulse duration is = 4T, and the packet length is = 5 bits in Figure 10a, and = 8 bits in Figure 10b.
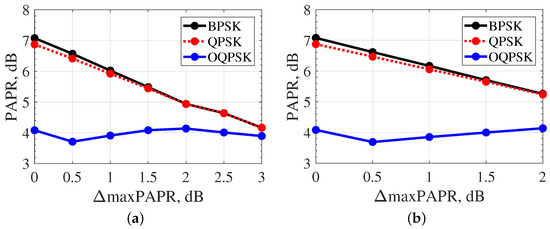
Figure 10.
Dependence of the PAPR value on maxPAPR for pulse duraton of = 4T: (a) ; and (b) .
As presented in Figure 10, when QPSK and BPSK are used, increasing the constraint on maxPAPR can significantly reduce the absolute value of the PAPR of the radiated oscillations, approximating its value to the PAPR value of the optimal FTN signals with OQPSK.The changing trend is the same for signals with a longer duration = 8T, as shown in Figure 11. However, the quantitative ratios of PAPR values change.
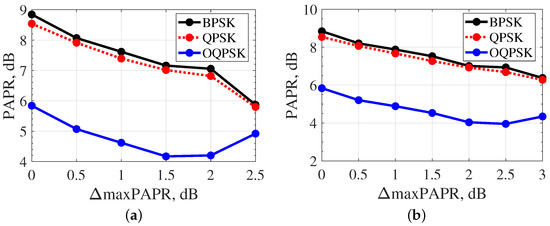
Figure 11.
Dependence of the PAPR value on maxPAPR for pulse duraton of = 8T: (a) ; and (b) .
For the optimal FTN signals with OQPSK, the quantitatively achievable PAPR values with the constraint on maxPAPR = 2.5 dB and maxPAPR = 3 dB increase from 4 to 4.5–5 dB. At the same time, the difference in the absolute PAPR values at maxPAPR of 2.5 and 3 dB for QPSK and BPSK modulations compared to the OQPSK modulation scheme is more than 1 and 2 dB, respectively.
As noted at the beginning of Section 2 when discussing constraint (13), it is necessary to estimate the minimum packet length which provides stable results in terms of PAPR. According to Figure 11, is the closest value to this minimum packet length. For this value of the packet length, the solutions to the optimization problem with the constraint on PAPR give a more stable result. The local minimum of the PAPR function for OQPSK with is less than for .
Consequently, it is necessary to consider the emerging opportunity to increase the BER performance by increasing the average power of the radiated oscillations at the output of the nonlinear power amplifier of the radio transmitter; for instance, by 2–2.5 dB, as shown in Figure 11b. It should be noted that, in this way, all spectral characteristics of the transmitted signals are preserved, and the same energy cost is guaranteed as in the case of using signals without constraint on the PAPR. The more detailed descriptions are presented in the following section.
3. Simulation Model
The BER performance of the optimal FTN signal detection was analyzed in the transmission channel without fading in the presence of additive white Gaussian noise (AWGN) with an average power spectral density of and in the channel with AWGN and Rayleigh fading. The scheme of the simulation model with an amplitude limiter is presented in Figure 12. This scheme can be applied to the DVB-S2X satellite systems in the presence of amplitude limitation. The symbols divided into two streams were fed to the input of the modulator of optimal FTN signals. The in-phase and quadrature component were offset by T.
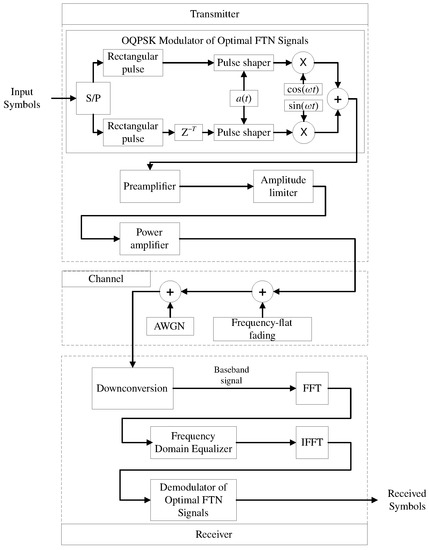
Figure 12.
Simulation model scheme.
To transmit a packet of optimal FTN signals with a reduced PAPR value, a preamplifier, an inertialess amplitude limiter, and a power amplifier were introduced. This part of the transmission path determined the spectral characteristics of the radiated oscillations and the signal-to-noise ratio (SNR), which further determined the BER performance.
The preamplifier has the ability to adjust the average power. The amplitude limiter in the simplest case has the AM/AM characteristic shown in Figure 13.
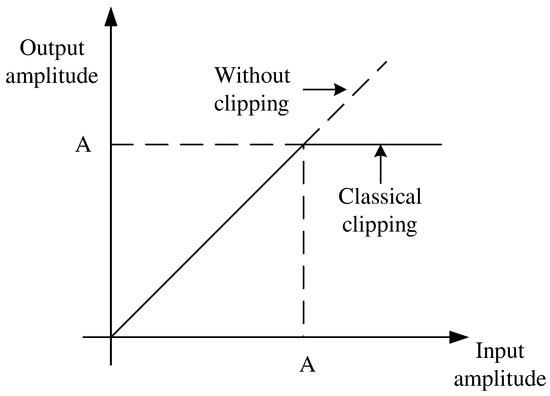
Figure 13.
Amplitude limiter AM/AM characteristic.
Based on the piecewise linear approximation of the AM/AM characteristic, it was assumed that the frequency bands of the power amplifier, preamplifier, and amplitude limiter were wider than the occupied frequency band of a random signal (Equation (3)).
In addition, the suppression of the spectrum components near frequencies that denoted multiples of the carrier frequency was considered sufficiently strong. Then, the real envelope of the signal packet at the output of the amplitude limiter was expressed as:
where denotes the real envelope of a signal (Equation (3)) at the input of the amplitude limiter and A denotes the threshold limiting the amplitude of the signal packet. The average power level of the preamplifier output was determined so that it ensured the transmission in the linear region of the characteristic of the amplitude limiter without limiting the oscillation amplitude, as presented in Figure 13.
The joint application of amplitude limiter and power amplifier is common in satellite digital broadcasting and television systems, and it is used under conditions of peak power limitation. Peak power limitation leads to the expansion in the spectrum of radiated oscillations and to the increase in the value of the cross-correlation coefficient of received signals. As a consequence, BER performance degrades. In general, it is proposed to use only the linear region of the signal characteristic, while PAPR reduction is ensured by the use of optimal pulse shapes.
The increase in of the radiated oscillations (13) occurred in the preamplifier, which provided linear amplification without going beyond the clipping level. Obviously, taking into account (13), the voltage gain of the preamplifier was equal to:
Thus, taking into account (14), at the power amplifier input, there would be a signal packet with a constant peak power but different level.
At the receiving device input, the frequency equalization of the channel frequency response was performed, as shown in Figure 12. The frequency response of the channel was evaluated using a known non-noisy signal passing through the Rayleigh-fading channel. Based on this evaluation, equalization was performed in the frequency domain using the obtained characteristic. After equalization, the mixture of the useful signal and noise, taking into account the Rayleigh fading, was fed to the input of the optimal FTN signal demodulator. The demodulator of optimal FTN signals employed an algorithm of symbol-by-symbol coherent detection. To calculate the BER performance of the detection, at least bits were transmitted.
4. Simulation Modeling Results
During the simulation, it was required to determine the PAPR value for a signal packet, consisting of 1000 binary bits of transmitted messages, as well as the BER performance when using optimal FTN signals with a reduced PAPR for channels with AWGN and channels with Rayleigh fading. The simulation model is used to calculate the probability of erroneous detection of channel symbols depending on the signal-to-noise ratio , where denotes the average bit energy. For each value of , the error probability was calculated and averaged over bits.
4.1. Occupied Frequency Band and PAPR of Oscillations
The change in the occupied frequency band depending on the additional constraint on the maximum PAPR value of the signal packet with the length (8) was analyzed. The frequency bands determined at the energy spectrum levels of −30 dB () and −60 dB () and the energy concentration of 99% in the band for optimal FTN signals () with the duration of = 4T are shown in Figure 14. The frequency bands for packet lengths of and participating in the solution of the optimization problem are presented in Figure 14a,b.
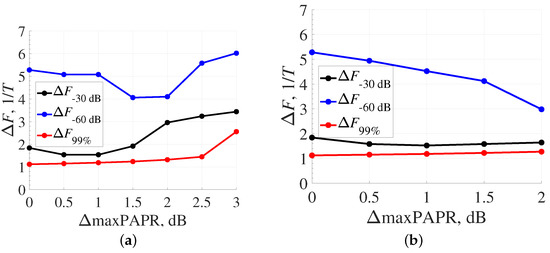
Figure 14.
Occupied frequency band dependence on maxPAPR for pulse duration of : (a) = 4T; and (b) = 8T.
Based on the results in Figure 14, the following conclusions can be drawn. First, the occupied frequency band , determined for the energy concentration of 99%, was close to the value of , which corresponds to the Nyquist barrier and weakly depends on the constraint parameter in the optimization problem. Second, the frequency band determined for the energy spectrum level of −60 dB () changed quite significantly and ranged from to for signals with the pulse duration of . With the decrease in the pulse duration to the value of , the fluctuations in the frequency band increased and reached the values = – and –, depending on the number of symbols taken into account during the optimization problem-solving process.
For reference, the exact values of for various parameters of optimal FTN signals are given in Table 1.

Table 1.
Occupied frequency band .
The values of the occupied frequency band containing 99% of signal energy (Figure 14) were compared with similar characteristics of the quadrature signals based on the RRC pulses. The occupied frequency band of the RRC pulses with a duration of was with a roll-off factor of the shaping filter . Thus, the band values for the optimal FTN signals and signals based on RRC pulses were practically the same.
Finally, the overall results of determining the PAPR of optimal FTN signal packet depending on the value of maxPAPR were analyzed. The PAPR values for a signal packet consisting of 1000 binary symbols are shown in Figure 15. These values were obtained by averaging over 1000 realizations of a random signal packet. As shown in Figure 15, with the increase in the limiting parameter maxPAPR, the PAPR value changed significantly. In addition, for signals with the pulse duration of , the PAPR value decreased from approximately 9 dB to approximately 6 dB. The same proportion was achieved for signals with the pulse duration of . However, the absolute PAPR values increased by about 2 dB while the pulse duration increased by two times.
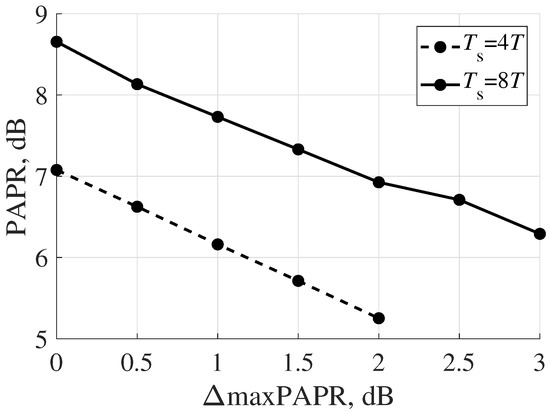
Figure 15.
PAPR values vs. the constraint on maximum PAPR of signal packet for BPSK.
4.2. BER Performance in AWGN Channel
First, the BER performance of quadrature signals with optimal function without offset (QPSK) was analyzed. Figure 16 shows the error probabilities from the signal-to-noise ratio when using the coherent element-by-element detection algorithm for optimal FTN signals with pulse duration and . In this case, it was assumed that there was no Doppler frequency shift. When determining the SNR, the energy of the optimal FTN signal was determined by taking into account (9). Therefore, when the oscillations in the preamplifier (Figure 12) were amplified, the signal energy increased according to (15).
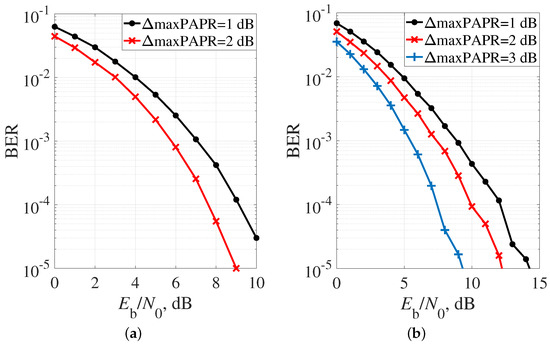
Figure 16.
BER performance of the optimal FTN signals with QPSK in the AWGN channel and pulse duration of: (a) ; and (b) .
Considering the dependencies presented in Figure 16, the following conclusions can be drawn. First, by increasing the average power of the transmitted signal packet without exceeding the clipping level, it is possible to obtain a certain energy gain. At the bit error probability of , these gains for signals with a pulse duration of were about 2 dB. For the signals with a duration of , these gains were also significant; for , the gain was 5 dB for .
The BER performance for the optimal FTN signals with OQPSK is shown in Figure 17. The signal parameters were the same as those in Figure 16. As displayed in Figure 17, an upward trend in energy gain for QPSK modulation was not very obvious. The energy gains did not exceed 1 dB for all the cases of the optimal FTN signals under study. However, as shown in Figure 10 and Figure 11, the absolute PAPR values of the signals with OQPSK were significantly lower than those of the signals with QPSK modulation.
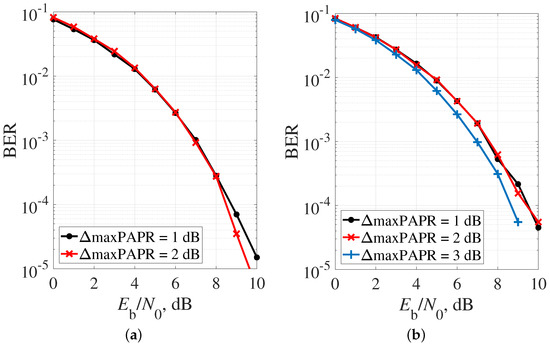
Figure 17.
BER performance of optimal FTN signals with OQPSK in AWGN channel and pulse duration of: (a) = 4T; and (b) = 8T.
4.3. BER Performance in Rayleigh-Fading Channel
The results of BER performance were also analyzed in the frequency-flat Rayleigh fading channel. As the optimal FTN signals with QPSK and OQPSK modulation, the signals formed on the basis of pulses with = 4T (Figure 5), = 8T (Figure 7), and were used.
As shown in Figure 18a, the use of optimal FTN signals with QPSK modulation and regulation of the average power of the radiated oscillations provides a higher BER performance in a channel with Rayleigh fading due to reduced PAPR. The energy gains in the range of error probabilities are about 0.5 dB when the cases with = 4T, maxPAPR = 0.5 dB, and maxPAPR = 2 dB are compared. The gain provided by optimal signals with pulse duration = 8T and maxPAPR = 3 dB compared to maxPAPR = 0.5 dB reaches 2.5 dB. In the case of OQPSK (Figure 18b), optimal FTN signals with = 8T can provide energy gain about 1.5 dB for error probability due to reduced PAPR (maxPAPR = 3 dB instead of maxPAPR = 0.5 dB).
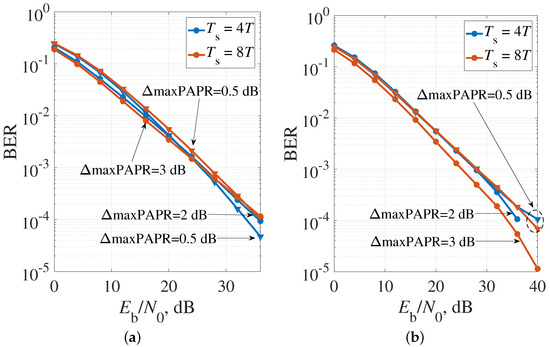
Figure 18.
BER performance of optimal FTN signals in frequency-flat Rayleigh channel: (a) QPSK; and (b) OQPSK.
By summarizing the results of the optimal FTN signals with OQPSK modulation based on the criterion of the specified reduction rate of the out-of-band emissions level, the following conclusions can be drawn. In terms of spectral efficiency, application of signals obtained through optimization allows reducing the occupied frequency band, and the introduction of the constraint maxPAPR, which limits the maximum PAPR value to 3 dB for each of the quadrature components in (3), allows maintaining the main spectral characteristics, i.e., a specified reduction rate of the level of out-of-band emissions, in a given format.
The found optimal shapes of function allow obtaining a significant decrease in the occupied frequency band, which is determined by the required level of out-of-band emissions. Thus, compared to the MSK and GMSK signals, the reduction in the occupied frequency band is about 4 and 1.3 times, respectively. This allows reducing the frequency plan of the data transmission network over digital television and radio broadcasting (DVB) channels, especially in satellite DVB-S2X applications, or to increase the data transmission rate when using the same frequency mask.
The energy costs in the channels with AWGN and channels with the Rayleigh fading when the proposed optimal FTN signals with OQPSK modulation are used are close to the energy costs of classical OQPSK signals with a rectangular pulse shape in quadrature channels and a wide occupied frequency bandwidth, which exceeds the bandwidth of the optimal FTN signals with OQPSK modulation by more than 20 times.
Therefore, the adjustment of the average power of the radiated oscillations while reducing the PAPR value of the radiated signals is a powerful tool for improving the energy efficiency of the optimal FTN signals with QPSK and OQPSK modulations. This also allows obtaining energy gains of 2–3 dB for channels with the additive noise.
5. Conclusions
In this paper, it is shown that an increase in the throughput of DVB channels, especially in satellite DVB-S2X applications, can be achieved by using optimal FTN signals with compact OQPSK modulation. A method for optimizing the shape of signals having a specified reduction rate of the out-of-band emission level, the minimum ISI level, and the required PAPR of the radiated oscillations is developed. For the first time, the possibility of synthesizing signals with OQPSK is shown, which provides not only high compactness of the spectrum and the required correlation properties but also makes it possible to regulate PAPR. This further provides the possibility of introducing regulation of the average power of a signal packet in the existing DVB-S2X systems, i.e., in devices amplifying oscillations of a satellite repeater using traveling wave tubes or powerful transistors. At the same time, using the proposed optimal FTN signals with OQPSK makes the frequency plan of the data transmission network able to be reduced, and the data transmission rate can be increased when the same frequency mask is used. Optimal FTN signals which can provide PAPR reduction by at most 3 dB were found. These signals also allow obtaining the energy gain up to 2 dB compared to known RRC pulses, while the occupied frequency bandwidth and transmission rate remain constant.
The simulation results show that the proposed optimal FTN signals with QPSK and OQPSK can be successfully used in channels when there is AWGN or Rayleigh fading since they are analyzed separately. The energy consumption in these channels is close to the energy consumption of classical OQPSK signals with a rectangular pulse shape in quadrature channels and wide frequency bandwidth. In addition, the adjustment of the average power of a signal packet makes it possible to obtain an energy gain of 2–3 dB while reducing the PAPR of the emitted signals.
The proposed signal can be used not only in DVB-S2X systems but also in low-rate return channels of interactive broadcasting systems with a frequency resource shortage. In addition, the proposed method paves the way for constructing signals for certain spectral and energy characteristics of transmission channels with a specific frequency mask, taking into account both the requirements for PAPR and the correlation properties of signal packets.
Author Contributions
Funding acquisition and supervision, S.B.M., W.X., and Y.X.; methodology, formal analysis, investigation, and simulation modeling, all authors; optimization problem solving, A.S.O.; writing and original draft preparation, S.B.M., A.S.O., and S.V.Z.; and full paper review and revision, M.L. All authors have read and agreed to the published version of the manuscript.
Funding
The research was funded by the Ministry of Science and Higher Education of the Russian Federation as part of World-class Research Center program: Advanced Digital Technologies (contract No. 075-15-2020-934 dated 17 November 2020), International Science & Technology Cooperation Program of China (2014DFR10240), the Fundamental Research Funds for the Central Universities (3072020CF0803), and the Opening Fund of Acoustics Science and Technology Laboratory (Grant No. SSKF2020010).
Conflicts of Interest
The authors declare no conflict of interest.
References
- Xing, Z.; Liu, K.; Tang, B.; Liu, Y. Novel PAPR Reduction Scheme Based on Piecewise Nonlinear Companding Transform in OFDM Systems. IEEE Commun. Lett. 2020, 24, 1757–1761. [Google Scholar] [CrossRef]
- Gao, S.; Zheng, J. Peak-to-Average Power Ratio Reduction in Pilot-Embedded OTFS Modulation Through Iterative Clipping and Filtering. IEEE Commun. Lett. 2020, 24, 2055–2059. [Google Scholar] [CrossRef]
- Ghosh, S.K. Travelling-Wave Tubes for Space Application: Present and Future. In Proceedings of the 2020 URSI Regional Conference on Radio Science ( URSI-RCRS), Varanasi, India, 12–14 February 2020; pp. 1–3. [Google Scholar] [CrossRef]
- Nguyen, K.T.; Pasour, J.; Vlasov, A.; Cooke, S.; Ludeking, L.; Levush, B.; Abe, D.K. US Naval Research Laboratory, Washington, DC, USA Oscillation characteristics in waveguide-based TWT amplifiers. In Proceedings of the 2015 IEEE International Vacuum Electronics Conference (IVEC), Beijing, China, 27–29 April 2015; pp. 1–2. [Google Scholar] [CrossRef]
- Smirnova, E.N.; Makarov, S.B.; Zavjalov, S.V.; Polozhintsev, B. Influence of the Amplitude Limitation of Signals with the sin(x)/x Envelope on the Spectral and Energy Characteristics. In Proceedings of the 2020 IEEE International Conference on Electrical Engineering and Photonics (EExPolytech), St. Petersburg, Russia, 15–16 October 2020; pp. 164–167. [Google Scholar] [CrossRef]
- Shahzad, A.; Xiong, N.; Irfan, M.; Lee, M.; Hussain, S.; Khaltar, B. A SCADA Intermediate Simulation Platform to Enhance the System Security. In Proceedings of the 2015 17th International Conference on Advanced Communication Technology (ICACT), Global IT Res Inst (GiRI), PyeonhChang, South Africa, 1–3 July 2015; pp. 368–373. [Google Scholar]
- Li, Q.; Gong, F.-K.; Song, P.-Y.; Li, G.; Zhai, S.-H. Beyond DVB-S2X: Faster-Than-Nyquist Signaling with Linear Precoding. IEEE Trans. Broadcast. 2020, 66, 620–629. [Google Scholar] [CrossRef]
- Makarov, S.B.; Liu, M.; Ovsyannikova, A.S.; Zavjalov, S.V.; Lavrenyuk, I.I.; Xue, W. Optimizing the Shape of Faster-Than-Nyquist (FTN) Signals With the Constraint on Energy Concentration in the Occupied Frequency Bandwidth. IEEE Access 2020, 8, 130082–130093. [Google Scholar] [CrossRef]
- Kwon, H.; Baek, M.; Yun, J.; Lim, H.; Hur, N. Design and performance evaluation of DVB-S2 system with FTN signaling. In Proceedings of the 2016 International Conference on Information and Communication Technology Convergence (ICTC), Jeju Island, Korea, 19–21October 2016; pp. 1210–1212. [Google Scholar] [CrossRef]
- Kim, P.; Oh, D. Design of a receiver faster than Nyquist signalling in DVB-S2 standard. In Proceedings of the 2014 International Conference on Information and Communication Technology Convergence (ICTC), Busan, Korea, 22–24 October 2014; pp. 989–990. [Google Scholar] [CrossRef]
- Hussain, S.; Kim, Y.C. Multilayer Communication Network Architecture for Wind Power Farm. In Proceedings of the 19th IEEE International Workshop on Computer Aided Modeling and Design of Communication Links and Networks (CAMAD), Athens, Greece, 1–3 December 2014; pp. 105–109. [Google Scholar]
- Gökceli, S.; Campo, P.P.; Levanen, T.; Yli-Kaakinen, J.; Turunen, M.; Allé, M. SDR Prototype for Clipped and Fast-Convolution Filtered OFDM for 5G New Radio Uplink. IEEE Access 2020, 8, 89946–89963. [Google Scholar] [CrossRef]
- Peng, S.; Liu, A.; Song, L.; Memon, I.; Wang, H. Spectral Efficiency Maximization for Deliberate Clipping-Based Multicarrier Faster-Than-Nyquist Signaling. IEEE Access 2018, 6, 13617–13623. [Google Scholar] [CrossRef]
- Zhao, J.; Ni, S.; Gong, Y. Peak-to-Average Power Ratio Reduction of FBMC/OQAM Signal Using a Joint Optimization Scheme. IEEE Access 2017, 5, 15810–15819. [Google Scholar] [CrossRef]
- Darwazeh, I.; Ghannam, H.; Xu, T. The First 15 Years of SEFDM: A Brief Survey. In Proceedings of the 2018 11th International Symposium on Communication Systems, Networks & Digital Signal Processing (CSNDSP), Budapest, Hungary, 18–20 July 2018; pp. 1–7. [Google Scholar] [CrossRef]
- Said, A.; Anderson, J.B. Bandwidth-efficient coded modulation with optimized linear partial-response signals. IEEE Trans. Inf. Theory 1998, 44, 701–713. [Google Scholar] [CrossRef]
- Snyman, J.A.; Wilke, D.N. Practical Mathematical Optimization: Basic Optimization; Springer: Berlin, Germany, 2018. [Google Scholar]
- Anderson, J.B.; Rusek, F.; Owall, V. Faster-Than-Nyquist Signaling. Proc. IEEE 2013, 101, 1817–1830. [Google Scholar] [CrossRef]
- Liu, M.; Xue, W.; Makarov, S.B.; Qi, J.; Li, B. Comparative Study of Analytic Solution and Numerical Solution of Baseband Symbol Signal Based on Optimal Generic Function. Math. Probl. Eng. 2019, 8045217. [Google Scholar] [CrossRef]
- Zavjalov, S.V.; Ovsyannikova, A.S.; Volvenko, S.V. On the Necessary Accuracy of Representation of Optimal Signals. Lect. Notes Comput. Sci. 2018, 11118 LNCS, 153–161. [Google Scholar] [CrossRef]
- Waldman, D.G.; Makarov, S.B. Synthesis of spectral-effective modulation techniques for digital communication systems. In Proceedings of the ICCSC’02. 1st IEEE International Conference on Circuits and Systems for Communications. Proceedings (IEEE Cat. No.02EX605), St. Petersburg, Russia, 26–28 June 2002; pp. 432–435. [Google Scholar] [CrossRef]
- Shang, W.; Xu, Y.; Qi, J.; Xue, W.; Makarov, S.B. Optimal waveform of the partial-respond signal based on minimum out-of-band radiation criterion. Appl. Sci. 2017, 7, 1086. [Google Scholar] [CrossRef]
- Liu, M.; Xue, W.; Jia, P.; Makarov, S.B.; Li, B. Research on spectrum optimization technology for a wireless communication system. Symmetry 2020, 12, 34. [Google Scholar] [CrossRef]
- Mason, S.J.; Zimmermann, H.J. Electronic Circuits, Signals and Systems; Wiley: New York, NY, USA, 1960. [Google Scholar]
- Feher, K. Wireless Digital Communications: Modulation And Spread Spectrum Applications; Prentice-Hall Of India Pvt. Limited: New Delhi, India, 1995. [Google Scholar]
- Anderson, J.B. Bandwidth Efficient Coding; John Wiley Sons: Hoboken, NJ, USA, 2017. [Google Scholar]


Publisher’s Note: MDPI stays neutral with regard to jurisdictional claims in published maps and institutional affiliations. |
© 2021 by the authors. Licensee MDPI, Basel, Switzerland. This article is an open access article distributed under the terms and conditions of the Creative Commons Attribution (CC BY) license (http://creativecommons.org/licenses/by/4.0/).