
EEG Frontal Asymmetry in Dysthymia, Major Depressive Disorder and Euthymic Bipolar Disorder


Abstract
1. Introduction
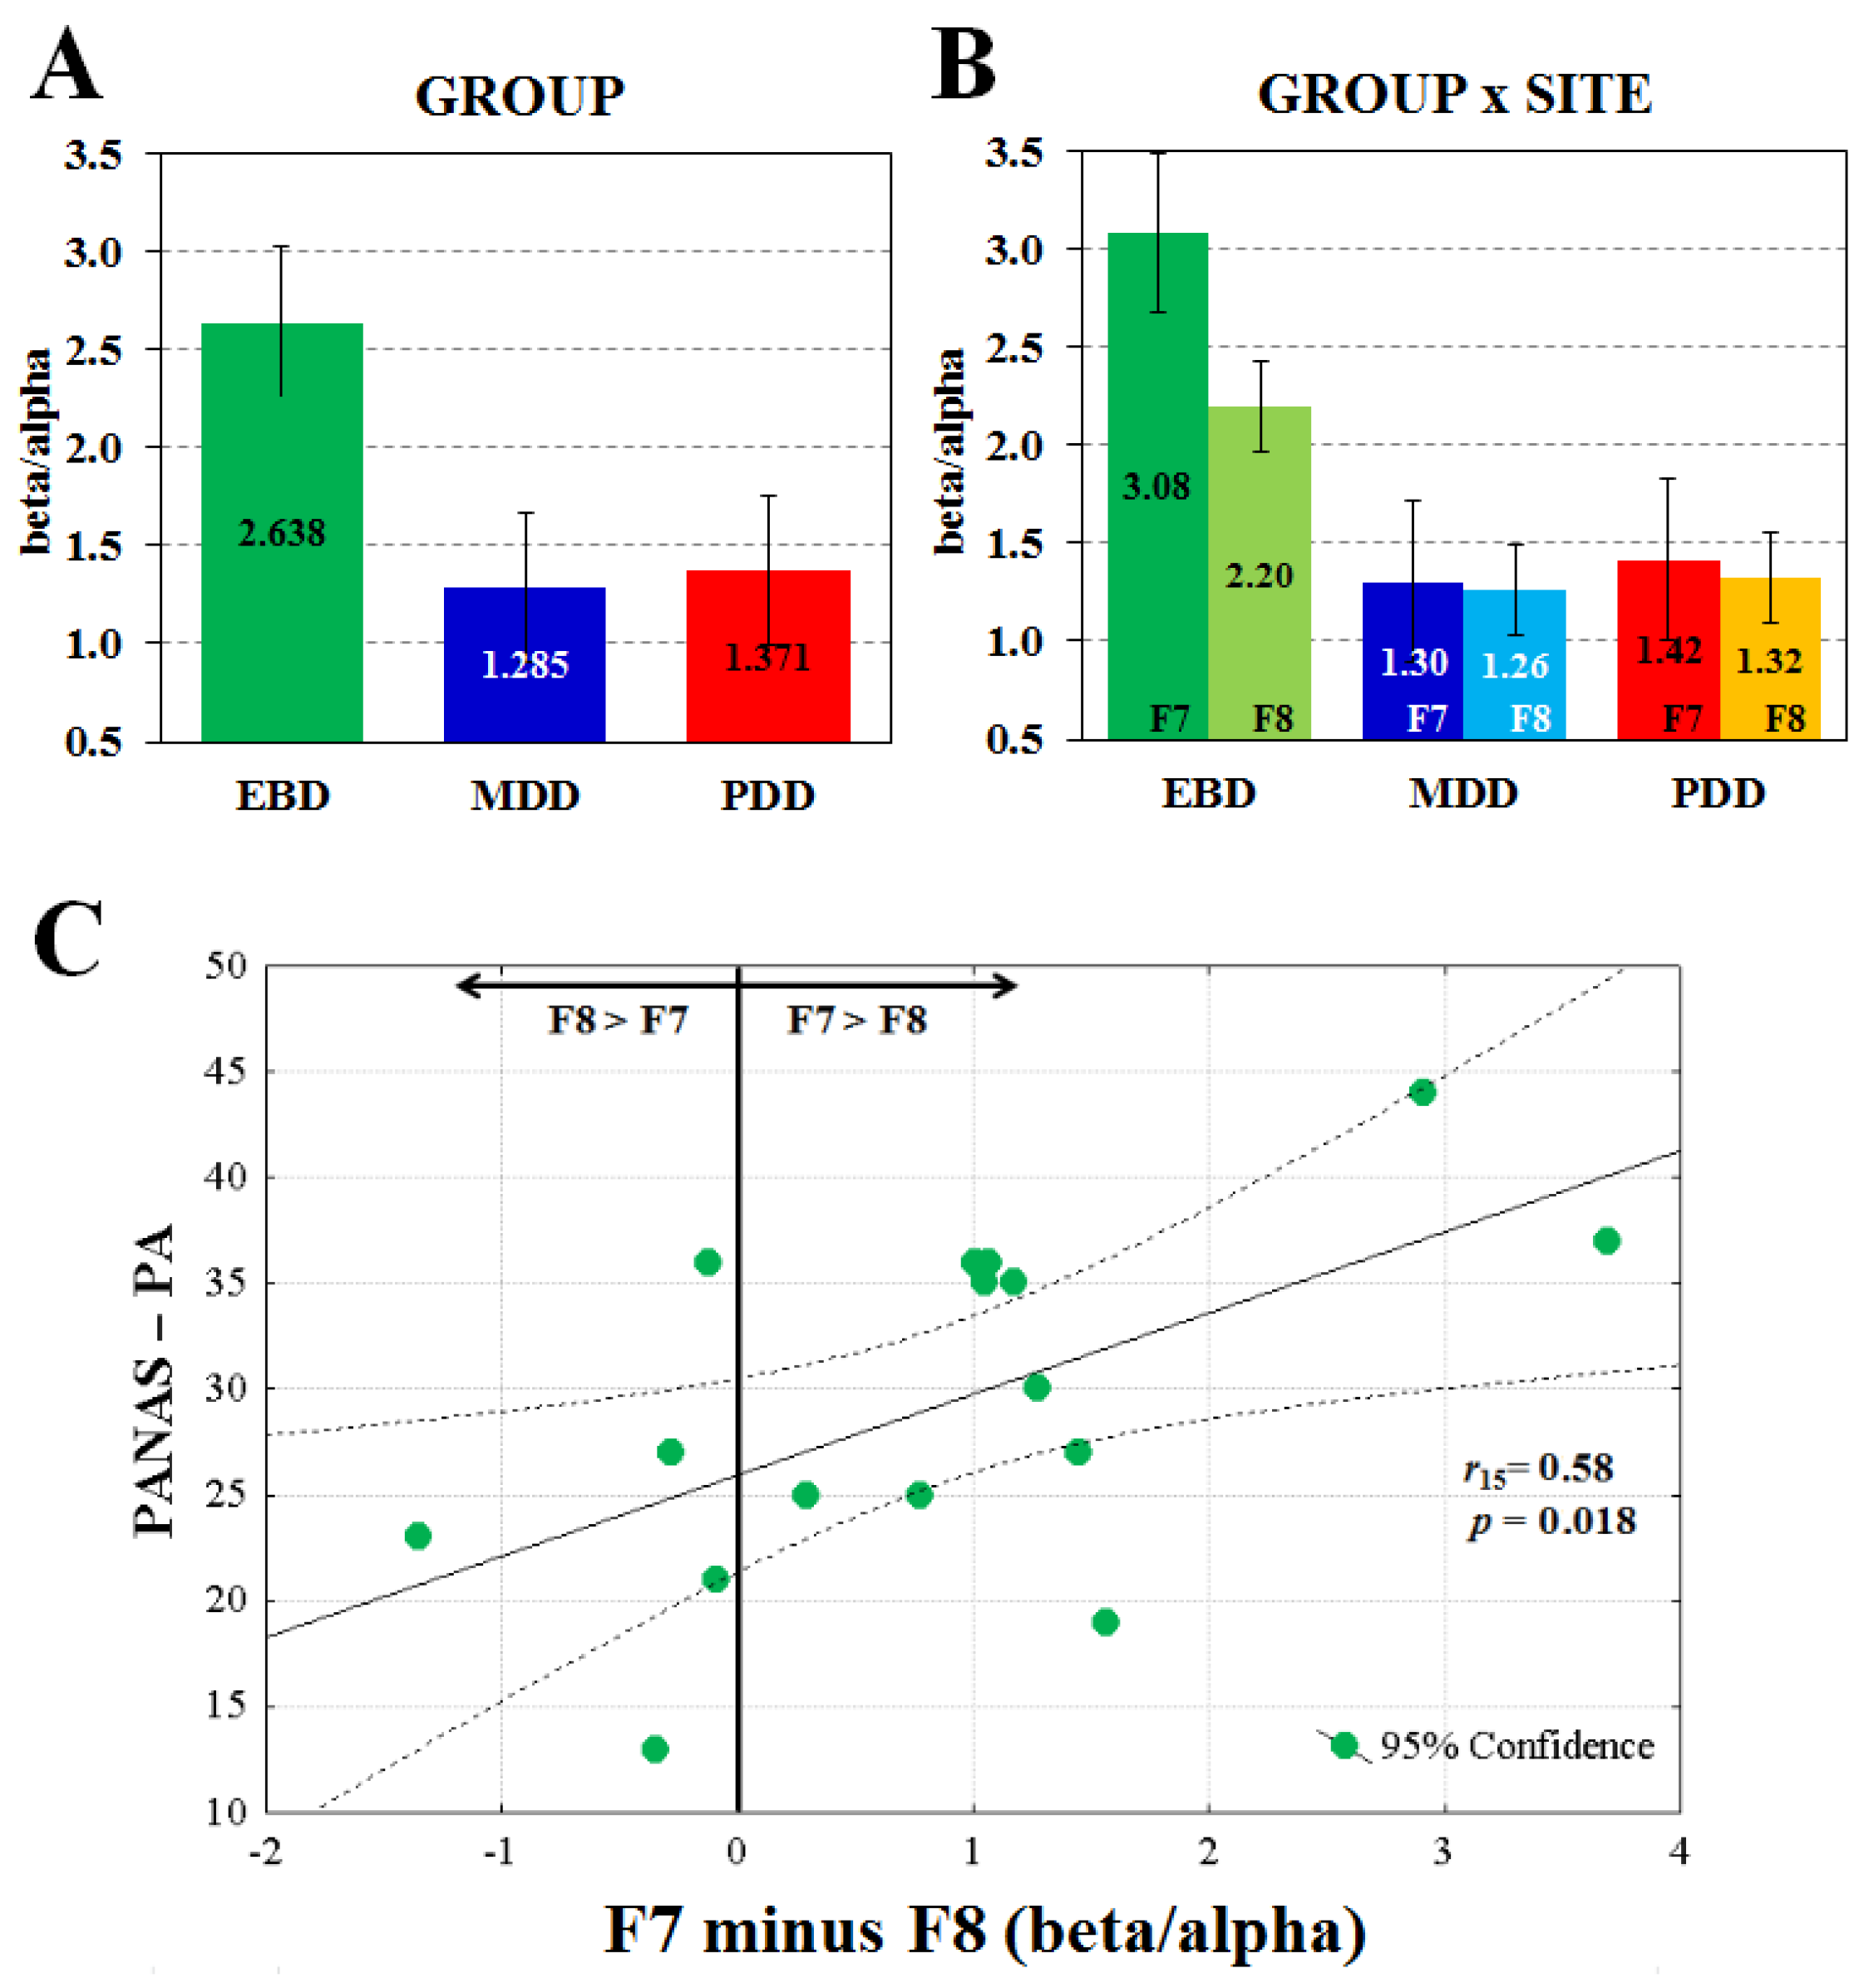
2. Results
3. Discussion
4. Materials and Methods
4.1. Participants
4.2. Apparatus and Physiological Recordings
4.3. Experimental Procedure and Data Analysis
Author Contributions
Funding
Institutional Review Board Statement
Informed Consent Statement
Data Availability Statement
Conflicts of Interest
Abbreviations
| EBD | Euthymic Bipolar Disorder |
| MDD | Major Depressive Disorder |
| PDD | Persistent Depressive Disorder (Dysthymia) |
| EEG | Electroencephalography |
| HAM-D | Hamilton Rating Scale for Depression |
| PANAS-PA | Positive and Negative Affect Schedule—Positive Affect |
| PANAS-NA | Positive and Negative Affect Schedule—Negative Affect |
| STAI-Y1 | State-Trait Anxiety Inventory—state form |
References
- American Psychiatric Association. Diagnostic and Statistical Manual of Mental Disorder, 5th ed.; DSM-5; American Psychiatric Association: Arlington, TX, USA, 2013. [Google Scholar]
- Klein, D.N.; Schwartz, J.E.; Rose, S.; Leader, J.B. Five-year course and outcome of dysthymic disorder: A prospective, naturalistic follow-up study. Am. J. Psychiatry 2000, 157, 931–939. [Google Scholar] [CrossRef] [PubMed]
- Yang, T.; Dunner, D.L. Differential subtyping of depression. Depress. Anxiety 2001, 13, 11–17. [Google Scholar] [CrossRef]
- Klein, D.N.; Santiago, N.J. Dysthymia and chronic depression: Introduction, classification, risk factors, and course. J. Clin. Psychol. 2003, 59, 807–816. [Google Scholar] [CrossRef] [PubMed]
- Schramm, E.; Klein, D.N.; Elsaesser, M.; Furukawa, T.A.; Domschke, K. Review of dysthymia and persistent depressive disorder: History, correlates, and clinical implications. Lancet Psychiatry 2020, 7, 801–812. [Google Scholar] [CrossRef]
- Ravindran, A.V.; Smith, A.; Cameron, C.; Bhatla, R.; Cameron, I.; Georgescu, T.M.; Hogan, M.J. Toward a functional neuroanatomy of dysthymia: A functional magnetic resonance imaging study. J. Affect. Disord. 2009, 119, 9–15. [Google Scholar] [CrossRef]
- Vilgis, V.; Chen, J.; Silk, T.J.; Cunnington, R.; Vance, A. Frontoparietal function in young people with dysthymic disorder (DSM-5: Persistent depressive disorder) during spatial working memory. J. Affect. Disord. 2014, 160, 34–42. [Google Scholar] [CrossRef]
- Stewart, J.L.; Coan, J.A.; Towers, D.N.; Allen, J.J. Frontal EEG asymmetry during emotional challenge differentiates individuals with and without lifetime major depressive disorder. J. Affect. Disord. 2011, 129, 167–174. [Google Scholar] [CrossRef]
- Allen, J.J.B.; Urry, H.L.; Hitt, S.K.; Coan, J.A. The stability of resting frontal electroencephalographic asymmetry in depression. Psychophysiology 2004, 41, 269–280. [Google Scholar] [CrossRef]
- Coan, J.A.; Allen, J.J.B. The state and trait nature of frontal EEG asymmetry in emotion. In The Asymmetrical Brain, 2nd ed.; Hugdahl, K., Davidson, R.J., Eds.; MIT Press: Cambridge, MA, USA, 2003; pp. 565–615. [Google Scholar]
- Davidson, R.J. Anterior electrophysiological asymmetries, emotion, and depression: Conceptual and methodological conundrums. Psychophysiology 1998, 35, 607–614. [Google Scholar] [CrossRef]
- Palmiero, M.; Piccardi, L. Frontal EEG asymmetry of mood: A mini-review. Front. Behav. Neurosci. 2017, 11, 224. [Google Scholar] [CrossRef]
- Spironelli, C.; Maffei, A.; Romeo, Z.; Piazzon, G.; Padovan, G.; Magnolfi, G.; Pasini, I.; Homen, F.G.; Concari, G.; Angrilli, A. Evidence of language-related left hypofrontality in Major Depression: An EEG Beta band study. Sci. Rep. 2020, 10, 8166. [Google Scholar] [CrossRef]
- Van der Vinne, N.; Vollebregt, M.A.; van Putten, M.J.A.M.; Arns, M. Frontal alpha asymmetry as a diagnostic marker in depression: Fact or fiction? A meta-analysis. NeuroImage Clin. 2017, 16, 79–87. [Google Scholar] [CrossRef]
- Nusslock, R.; Walden, K.; Harmon-Jones, E. Asymmetrical frontal cortical activity associated with differential risk for mood and anxiety disorder symptoms: An RDoC perspective. Int. J. Psychophysiol. 2015, 98, 249–261. [Google Scholar] [CrossRef]
- Allen, J.J.B.; Iacono, W.G.; Depue, R.A.; Arbisi, P. Regional electroencephalographic asymmetries in bipolar seasonal affective disorder before and after exposure to bright light. Biol. Psychiatry 1993, 33, 642–646. [Google Scholar] [CrossRef]
- Allen, J.J.B.; Coan, J.A.; Nazarian, M. What’s the difference? Issue and assumptions in the use of difference scores and other metrics of anterior brain asymmetry in emotion. Biol. Psychol. 2004, 67, 183–218. [Google Scholar] [CrossRef]
- Stewart, J.L.; Coan, J.A.; Towers, D.N.; Allen, J.J.B. Resting and task-elicited prefrontal EEG alpha asymmetry in depression: Support for the capability model. Psychophysiology 2014, 51, 446–455. [Google Scholar] [CrossRef]
- Pizzagalli, D.A.; Nitschke, J.B.; Oakes, T.R.; Hendrick, A.M.; Horras, K.A.; Larson, C.L.; Abercrombie, H.C.; Schaefer, S.M.; Koger, J.V.; Benca, R.M.; et al. Brain electrical tomography in depression: The importance of symptom severity, anxiety, and melancholic feature. Biol. Psychiatry 2002, 52, 73–85. [Google Scholar] [CrossRef]
- Reid, S.A.; Duke, L.M.; Allen, J.J.B. Resting frontal electroencephalographic asymmetry in depression: Inconsistencies suggest the need to identify mediating factors. Psychophysiology 1998, 35, 389–404. [Google Scholar] [CrossRef]
- Jesulola, E.; Christopher, F.; Sharpleya, C.F.; Bitsikab, V.; Agnewa, L.L.; Wilson, P. Frontal alpha asymmetry as a pathway to behavioural withdrawal in depression: Research findings and issues. Behav. Brain Res. 2015, 292, 56–67. [Google Scholar] [CrossRef]
- Koek, R.; Yerevanian, B.; Tachiki, K.; Smith, J.; Alcock, J.; Kopelowicz, K. Hemispheric asymmetry in depression and mania. A longitudinal QEEG study in bipolar disorder. J. Affect. Disord. 1999, 53, 109–122. [Google Scholar] [CrossRef]
- Diykh, M.; Li, Y.; Wen, P.; Li, T. Complex networks approach for depth of anesthesia assessment. Measurement 2018, 119, 178–198. [Google Scholar] [CrossRef]
- Diykh, M.; Abdulla, S.; Saleh, K.; Deo, R.C. Fractal dimension undirected correlation graph-based support vector machine model for identification of focal and non-focal electroencephalography signals. Biomed. Signal Process. Control 2019, 54, 101611. [Google Scholar] [CrossRef]
- Murakami, M.; Kominami, D.; Leibnitz, K.; Murata, M. Drawing Inspiration from Human Brain Networks: Construction of Interconnected Virtual Networks. Sensors 2018, 18, 1133. [Google Scholar] [CrossRef]
- Oakes, T.R.; Pizzagalli, D.A.; Hendrick, A.M.; Horras, K.A.; Larson, C.L.; Abercrombie, H.C.; Schaefer, S.M.; Koger, J.V.; Davidson, R.J. Functional Coupling of Simultaneous Electrical and Metabolic Activity in the Human Brain. Hum. Brain Mapp. 2004, 21, 257–270. [Google Scholar] [CrossRef]
- Moncrieff, J.; Cohen, D. Do antidepressants cure or create abnormal brain states? PLoS Med. 2006, 3, e240. [Google Scholar] [CrossRef]
- Fornaro, M.; Anastasia, A.; Novello, S.; Fusco, A.; Pariano, R.; De Berardis, D.; Solmi, M.; Veronese, N.; Stubbs, B.; Vieta, E.; et al. The emergence of loss of efficacy during antidepressant drug treatment for major depressive disorder: An integrative review of evidence, mechanisms, and clinical implications. Pharmacol. Res. 2019, 139, 494–502. [Google Scholar] [CrossRef]
- Watson, D.C.; Lee, A.; Tellegen, A. Development and validation of brief measures of positive and negative affect: The PANAS scales. J. Personal. Soc. Psychol. 1988, 54, 1063–1070. [Google Scholar] [CrossRef]
- Oldfield, R.C. The assessment and analysis of handedness: The Edinburgh inventory. Neuropsychologia 1971, 9, 97–113. [Google Scholar] [CrossRef]
- Hamilton, M. A rating scale for depression. J. Neurol. Neurosurg. Psychiatry 1960, 23, 56. [Google Scholar] [CrossRef]
- Spielberger, C.D.; Gorsuch, R.L.; Lushene, R.; Vagg, P.R.; Jacobs, G.A. Manual for the State-Trait Anxiety Inventory (Form Y); Psychologist Press: Palo Alto, CA, USA, 1983. [Google Scholar]
- Spironelli, C.; Angrilli, A. Posture used in fMRI-PET elicits reduced cortical activity and altered hemispheric asymmetry with respect to sitting position: An EEG resting state study. Front. Hum. Neurosci. 2017, 11, 621. [Google Scholar] [CrossRef]
- Angrilli, A.; Spironelli, C.; Elbert, T.; Crow, T.J.; Marano, G.; Stegagno, L. Schizophrenia as failure of left hemispheric dominance for the phonological component of language. PLoS ONE 2009, 4, e4507. [Google Scholar] [CrossRef] [PubMed]
- Spironelli, C.; Angrilli, A.; Calogero, A.; Stegagno, L. Delta EEG band as a marker of left hypofrontality in schizophrenia patients. Schizophr. Bull. 2011, 37, 757–767. [Google Scholar] [CrossRef] [PubMed]
- Crow, T.J. Schizophrenia as failure of hemispheric dominance for language. Trends Neurosci. 1997, 20, 33–343. [Google Scholar]
- Crow, T.J. Schizophrenia as the price that Homo sapiens pays for language: A resolution of the central paradox in the origin of the species. Brain Res. Rev. 2000, 31, 118–129. [Google Scholar] [CrossRef]
- Spironelli, C.; Angrilli, A.; Stegagno, L. Failure of language lateralization in schizophrenia patients: An ERP study on early linguistic components. J. Psychiatry Neurosci. 2008, 33, 235–243. [Google Scholar]
- Cutini, S.; Scatturin, P.; Zorzi, M. A new method based on ICBM152 head surface for probe placement in multichannel fNIRS. NeuroIamge 2011, 54, 919–927. [Google Scholar] [CrossRef]
- Oostenveld, R.; Praamstra, P. The five percent electrode system for high-resolution EEG and ERP measurements. Clin. Neurophysiol. 2001, 112, 713–719. [Google Scholar] [CrossRef]
- Bookheimer, S. Functional MRI of language: New approaches to understanding the cortical organization of semantic processing. Annu. Rev. Neurosci. 2002, 25, 151–188. [Google Scholar] [CrossRef]
- Hagoort, P. On Broca, brain, and binding: A new framework. Trends Cogn. Sci. 2005, 9, 416–423. [Google Scholar] [CrossRef]
- Fink, G.R.; Manjaly, Z.M.; Stephan, K.E.; Gurd, J.M.; Zilles, K.; Amunts, K.; Marshall, J.C. A Role for Broca’s Area beyond Language Processing: Evidence from Neuropsychology and fMRI. In Broca’s Region; Godzinsky, Y., Amunts, K., Eds.; Oxford University Press: New York, NY, USA, 2006; pp. 254–268. [Google Scholar]
- Brunyé, T.T. Non-invasive Brain Stimulation Effects on the Perceptual and Cognitive Processes Underlying Decision-making: A Mini Review. J. Cogn. Enhanc. 2021, 5, 233–244. [Google Scholar] [CrossRef]
- Guha, A.; Spielberg, J.M.; Lake, J.; Popov, T.; Heller, W.; Yee, C.M.; Miller, G.A. Effective Connectivity between Broca’s Area and Amygdala as a Mechanism of Top-Down Control in Worry. Clin. Psychol. Sci. 2020, 8, 84–98. [Google Scholar] [CrossRef]
- American Psychiatric Association. Diagnostic and Statistical Manual of Mental Disorders, 4th ed.; Text Revised; American Psychiatric Association: Washington, DC, USA, 2000. [Google Scholar]
- Young, R.C.; Biggs, J.T.; Ziegler, V.E.; Meyer, D.A. A rating scale for mania: Reliability, validity and sensitivity. Br. J. Psychiatry 1978, 133, 429–435. [Google Scholar] [CrossRef]
- Sheehan, D.V.; Lecrubier, Y.; Sheehan, K.H.; Amorim, P.; Janavs, J.; Weiller, E.; Hergueta, T.; Baker, R.; Dunbar, G.C. The Mini-International Neuropsychiatric Interview (M.I.N.I.): The development and validation of a structured diagnostic psychiatric interview for DSM-IV and ICD-10. J. Clin. Psychiatry 1998, 59, 22–33. [Google Scholar]
- First, M.B.; Spitzer, R.L.; Williams, J.B.W.; Gibbon, M. Structured clinical interview for DSM-IV Axis I disorders (SCID-I). In Handbook of Psychiatric Measures; Rush, A.J., Jr., First, M.B., Blacker, D., Eds.; American Psychiatric Association: Washington, DC, USA, 2000; pp. 49–53. [Google Scholar]
- Ille, N.; Berg, P.; Scherg, M. Artifact correction of the ongoing EEG using spatial filters based on artifact and brain signal topographies. J. Clin. Neurophysiol. 2002, 19, 113–124. [Google Scholar] [CrossRef]
- Spironelli, C.; Borella, E. Working memory training and cortical arousal in healthy older adults: A resting state EEG pilot study. Front. Aging Neurosci. 2021, 13, 718965. [Google Scholar] [CrossRef]


| EBD (n = 17) | MMD (n = 25) | PDD (n = 21) | Statistics | ||
|---|---|---|---|---|---|
| Socio-demographical data | |||||
| Age (years) | 51.5 ± 2.76 | 53.8 ± 2.28 | 59.1 ± 2.48 | F2,60 = 2.31 | ns |
| Gender | 7 M–10 F | 5 M–20 F | 7 M–14 F | all χ21 ≤ 2.22 | ns |
| Education (years) | 14.8 ± 0.90 | 10.6 ± 0.74 | 11.1 ± 0.81 | F2,60 = 7.14 | p = 0.001 |
| Handedness | 92.5 ± 1.87 | 94.0 ± 1.54 | 98.0 ± 1.68 | F2,60 = 2.67 | ns |
| Clinical data | |||||
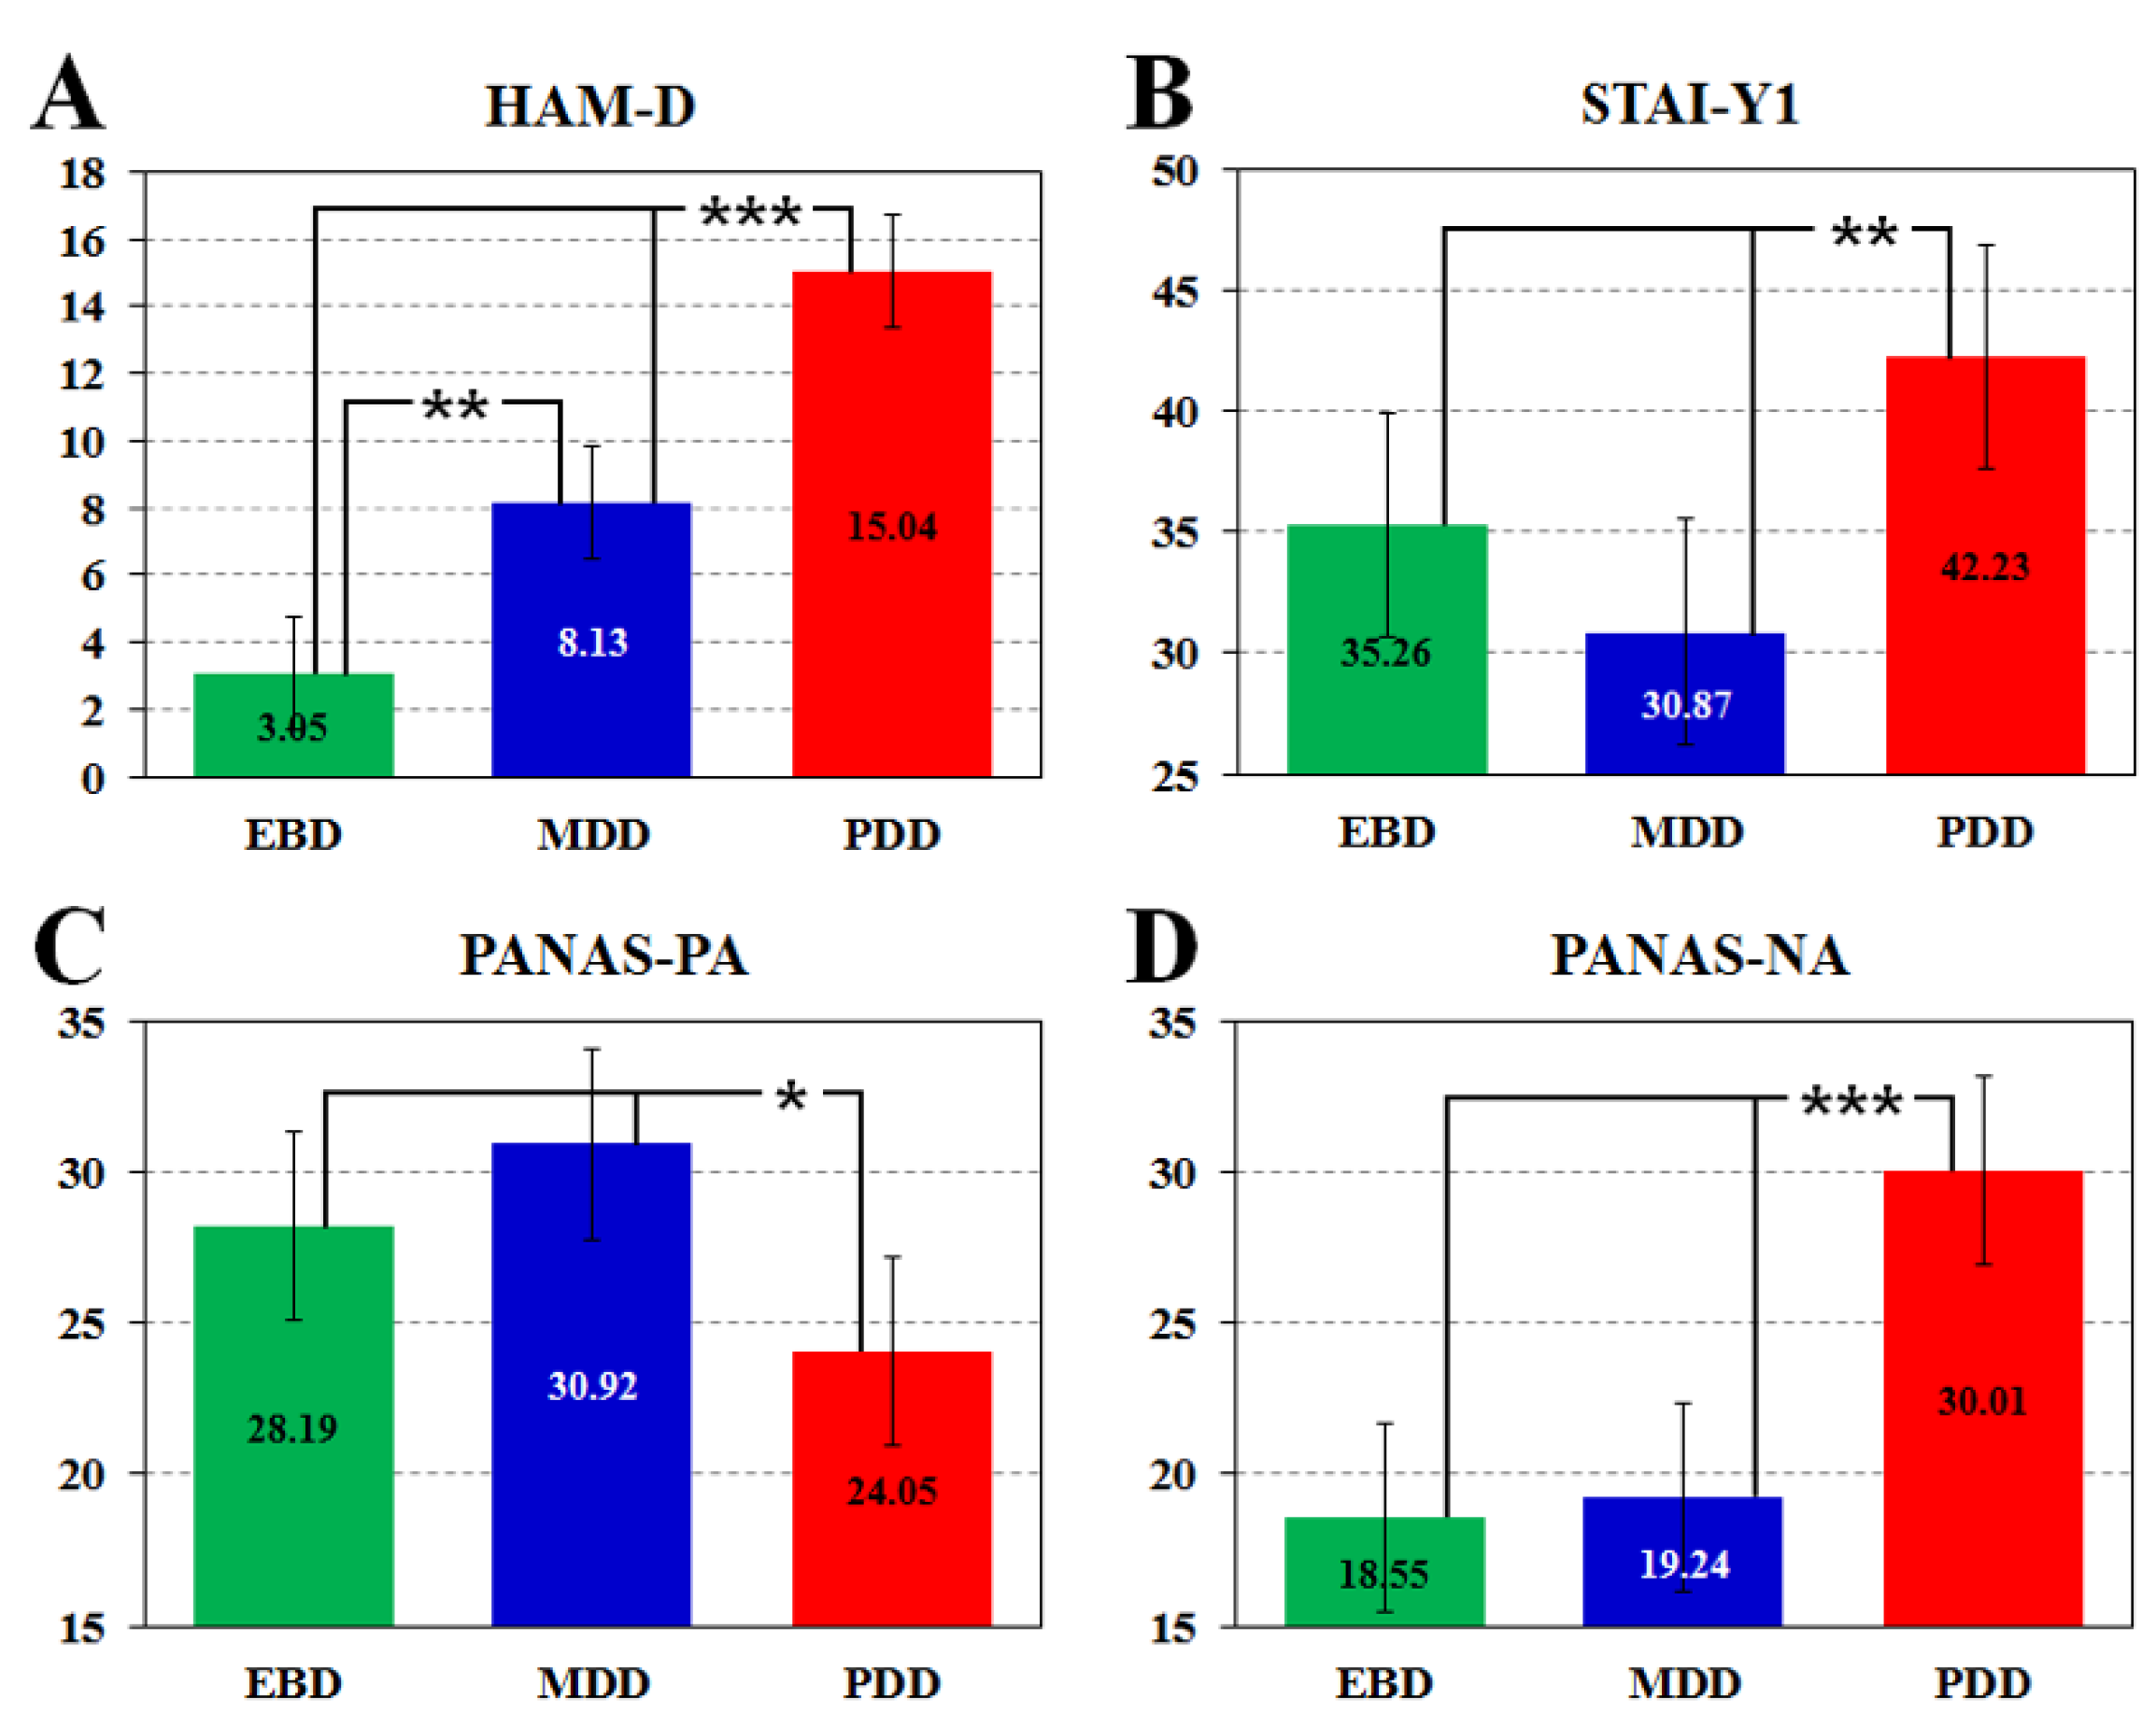
| HAM-D | 3.0 ± 2.14 | 8.1 ± 1.67 | 15.0 ± 1.79 | F2,59 = 37.90 | p < 0.001 |
| STAI-Y1 | 35.3 ± 5.94 | 30.9 ± 4.64 | 42.2 ± 4.98 | F2,59 = 5.79 | p < 0.01 |
| PANAS-PA | 28.2 ± 4.13 | 30.9 ± 3.12 | 24.0 ± 3.35 | F2,59 = 4.66 | p = 0.01 |
| PANAS-NA | 18.5 ± 3.99 | 19.2 ± 3.02 | 30.0 ± 3.24 | F2,59 = 15.27 | p < 0.001 |
| EBD (n = 17) | MMD (n = 25) | PDD (n = 21) | |||
|---|---|---|---|---|---|
| Mood Stabilizers | 14 | 8 | 2 | ||
| Carbolithium | 4 | 0 | 1 | ||
| Antiepileptics | 10 | 8 | 1 | ||
| Valproate | 7 | 2 | 1 | ||
| Lamotrigine | 2 | 5 | |||
| Gabapentin | 1 | ||||
| Pregabalin | 1 | ||||
| Antipsychotics | 16 | 5 | 15 | ||
| Atypical | 16 | 5 | 7 | ||
| Quetiapine | 10 | 2 | 3 | ||
| Asenapine | 4 | ||||
| Aripiprazole | 2 | 2 | 1 | ||
| Olanzapine | 3 | ||||
| Risperidone | 1 | ||||
| Typical | 0 | 0 | 8 | ||
| Perphenazine | 5 | ||||
| Phenothiazine | 1 | ||||
| Promazine hydrochloride | 2 | ||||
| Antidepressant | 5 | 31 | 29 | ||
| NDRI (Norepinephrine-Dopamine Reuptake Inhibitors) | 0 | 0 | 2 | ||
| Bupropion | 2 | ||||
| SARI (Serotonin Antagonist and Reuptake Inhibitors) | 0 | 1 | 5 | ||
| Trazodone | 1 | 2 | |||
| Vortioxetine | 3 | ||||
| SNRI (Serotonin-Norepinephrine Reuptake Inhibitors) | 2 | 11 | 7 | ||
| Duloxetine | 4 | 1 | |||
| Venlafaxine | 5 | 4 | |||
| Mirtazapine | 2 | 2 | 2 | ||
| SSRI (Selective Serotonin Reuptake Inhibitors) | 3 | 15 | 11 | ||
| Citalopram | 3 | ||||
| Escitalopram | 1 | 4 | 2 | ||
| Fluoxetine | 3 | 1 | |||
| Fluvoxamine | 1 | ||||
| Paroxetine | 2 | 5 | |||
| Sertraline | 1 | 3 | 3 | ||
| Tricyclics | 0 | 4 | 4 | ||
| Amitriptyline | 1 | 2 | |||
| Clomipramine | 2 | ||||
| Dosulepin | 2 | ||||
| Nortriptyline | 1 | ||||
| Anxiolytics | 1 | 8 | 31 | ||
| Benzodiazepine | 1 | 8 | 30 | ||
| Alprazolam | 1 | 7 | |||
| Bromazepam | 1 | ||||
| Clonazepam | 3 | 5 | |||
| Delorazepam | 1 | 2 | |||
| Diazepam | 1 | ||||
| Flurazepam | 1 | 7 | |||
| Lorazepam | 2 | 4 | |||
| Triazolam | 4 | ||||
| Thienodiazepine | 0 | 0 | 1 | ||
| Etiazolam | 1 | ||||
Publisher’s Note: MDPI stays neutral with regard to jurisdictional claims in published maps and institutional affiliations. |
© 2021 by the authors. Licensee MDPI, Basel, Switzerland. This article is an open access article distributed under the terms and conditions of the Creative Commons Attribution (CC BY) license (https://creativecommons.org/licenses/by/4.0/).
Share and Cite
Spironelli, C.; Fusina, F.; Bortolomasi, M.; Angrilli, A. EEG Frontal Asymmetry in Dysthymia, Major Depressive Disorder and Euthymic Bipolar Disorder. Symmetry 2021, 13, 2414. https://doi.org/10.3390/sym13122414
Spironelli C, Fusina F, Bortolomasi M, Angrilli A. EEG Frontal Asymmetry in Dysthymia, Major Depressive Disorder and Euthymic Bipolar Disorder. Symmetry. 2021; 13(12):2414. https://doi.org/10.3390/sym13122414
Chicago/Turabian StyleSpironelli, Chiara, Francesca Fusina, Marco Bortolomasi, and Alessandro Angrilli. 2021. "EEG Frontal Asymmetry in Dysthymia, Major Depressive Disorder and Euthymic Bipolar Disorder" Symmetry 13, no. 12: 2414. https://doi.org/10.3390/sym13122414
APA StyleSpironelli, C., Fusina, F., Bortolomasi, M., & Angrilli, A. (2021). EEG Frontal Asymmetry in Dysthymia, Major Depressive Disorder and Euthymic Bipolar Disorder. Symmetry, 13(12), 2414. https://doi.org/10.3390/sym13122414