
Development of a Chiral Capillary Electrophoresis Method for the Enantioseparation of Verapamil Using Cyclodextrins as Chiral Selectors and Experimental Design Optimization


 , ,
, ,
Abstract
:1. Introduction
2. Materials and Methods
2.1. Chemicals and Reagents
2.2. Instrumentation
2.3. Electrophoretic Conditions
2.4. Pharmaceutical Sample Preparation
3. Results
3.1. Preliminary Analysis
3.2. Method Optimization
3.3. Analytical Performance
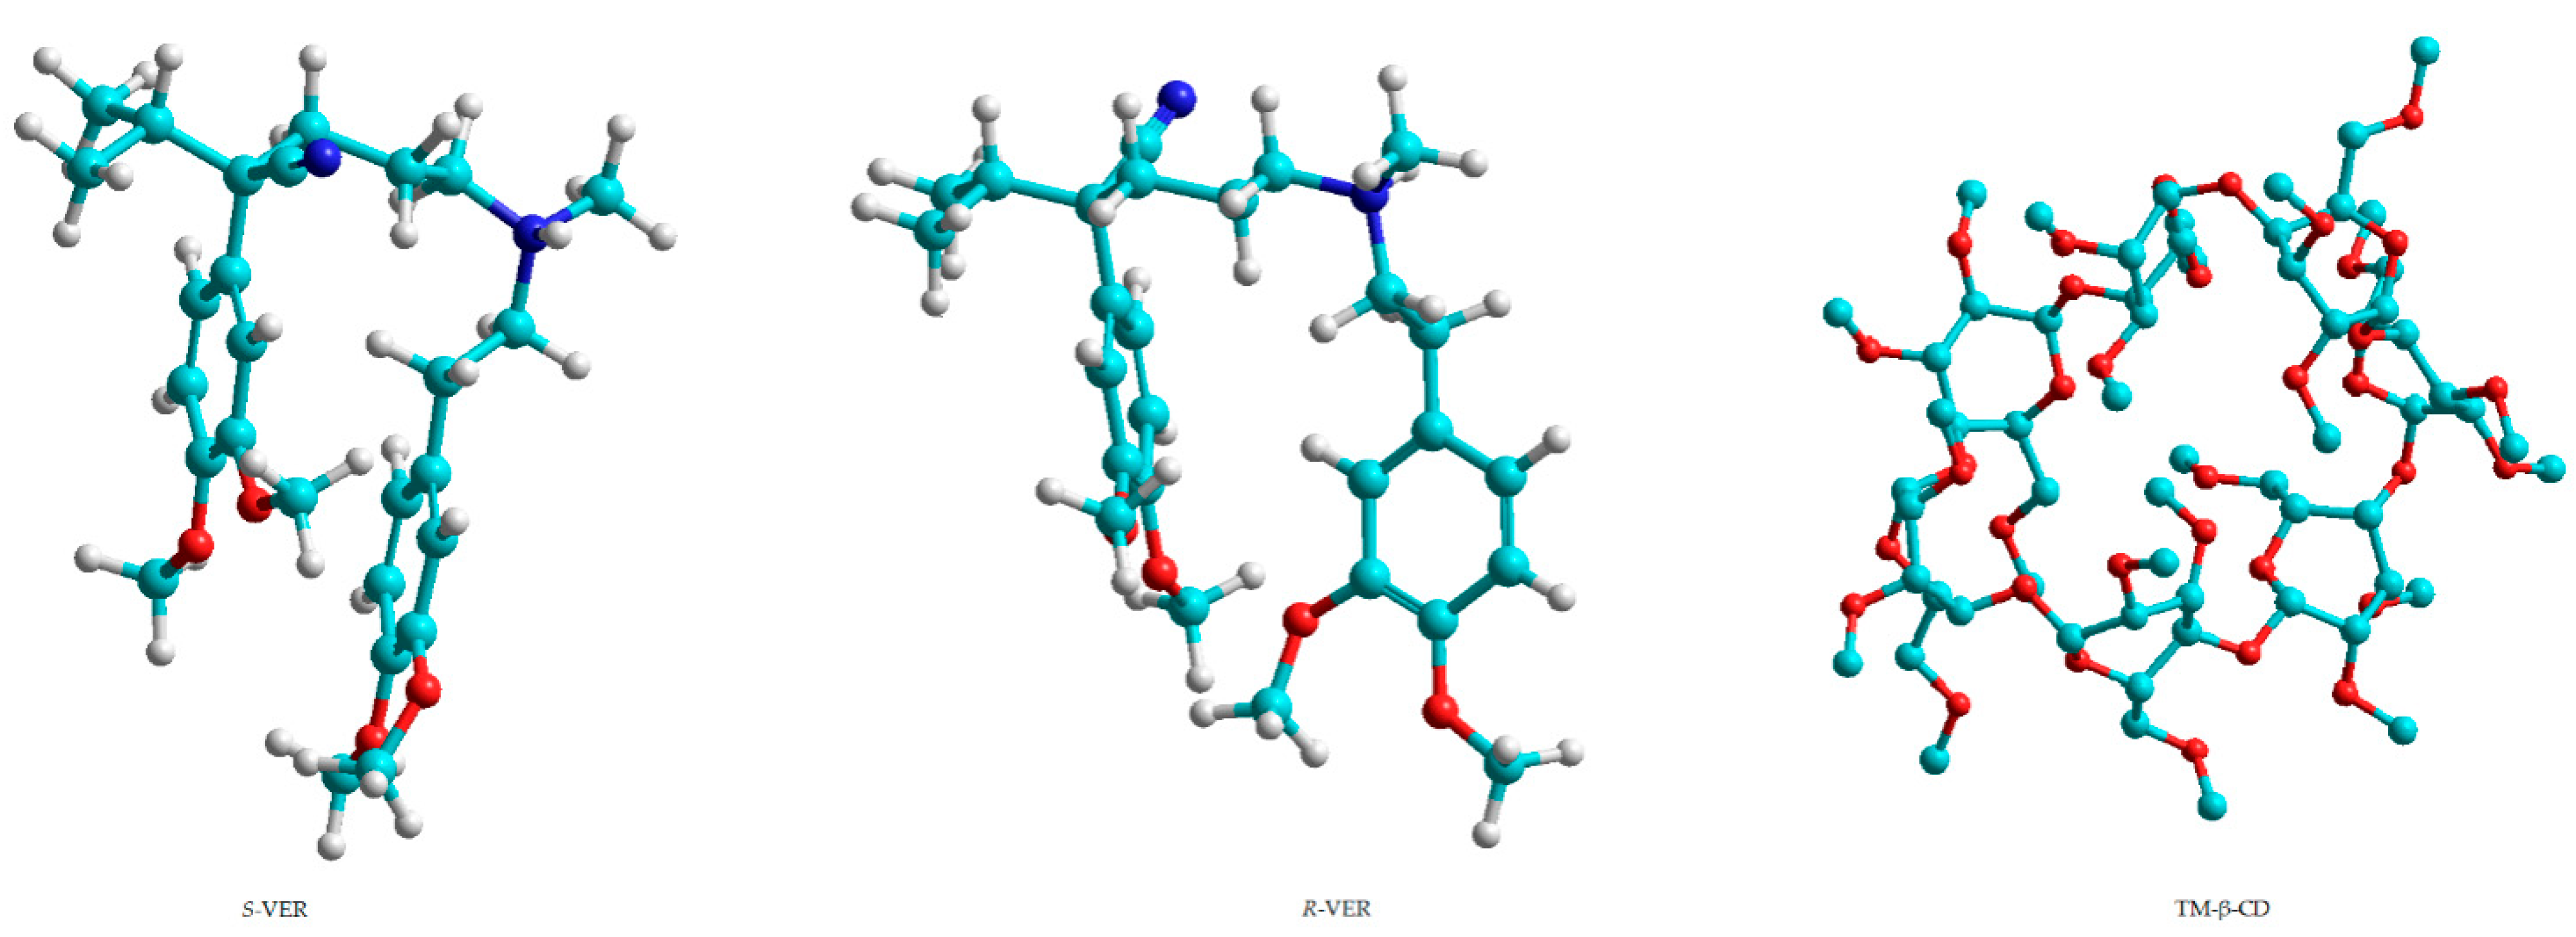
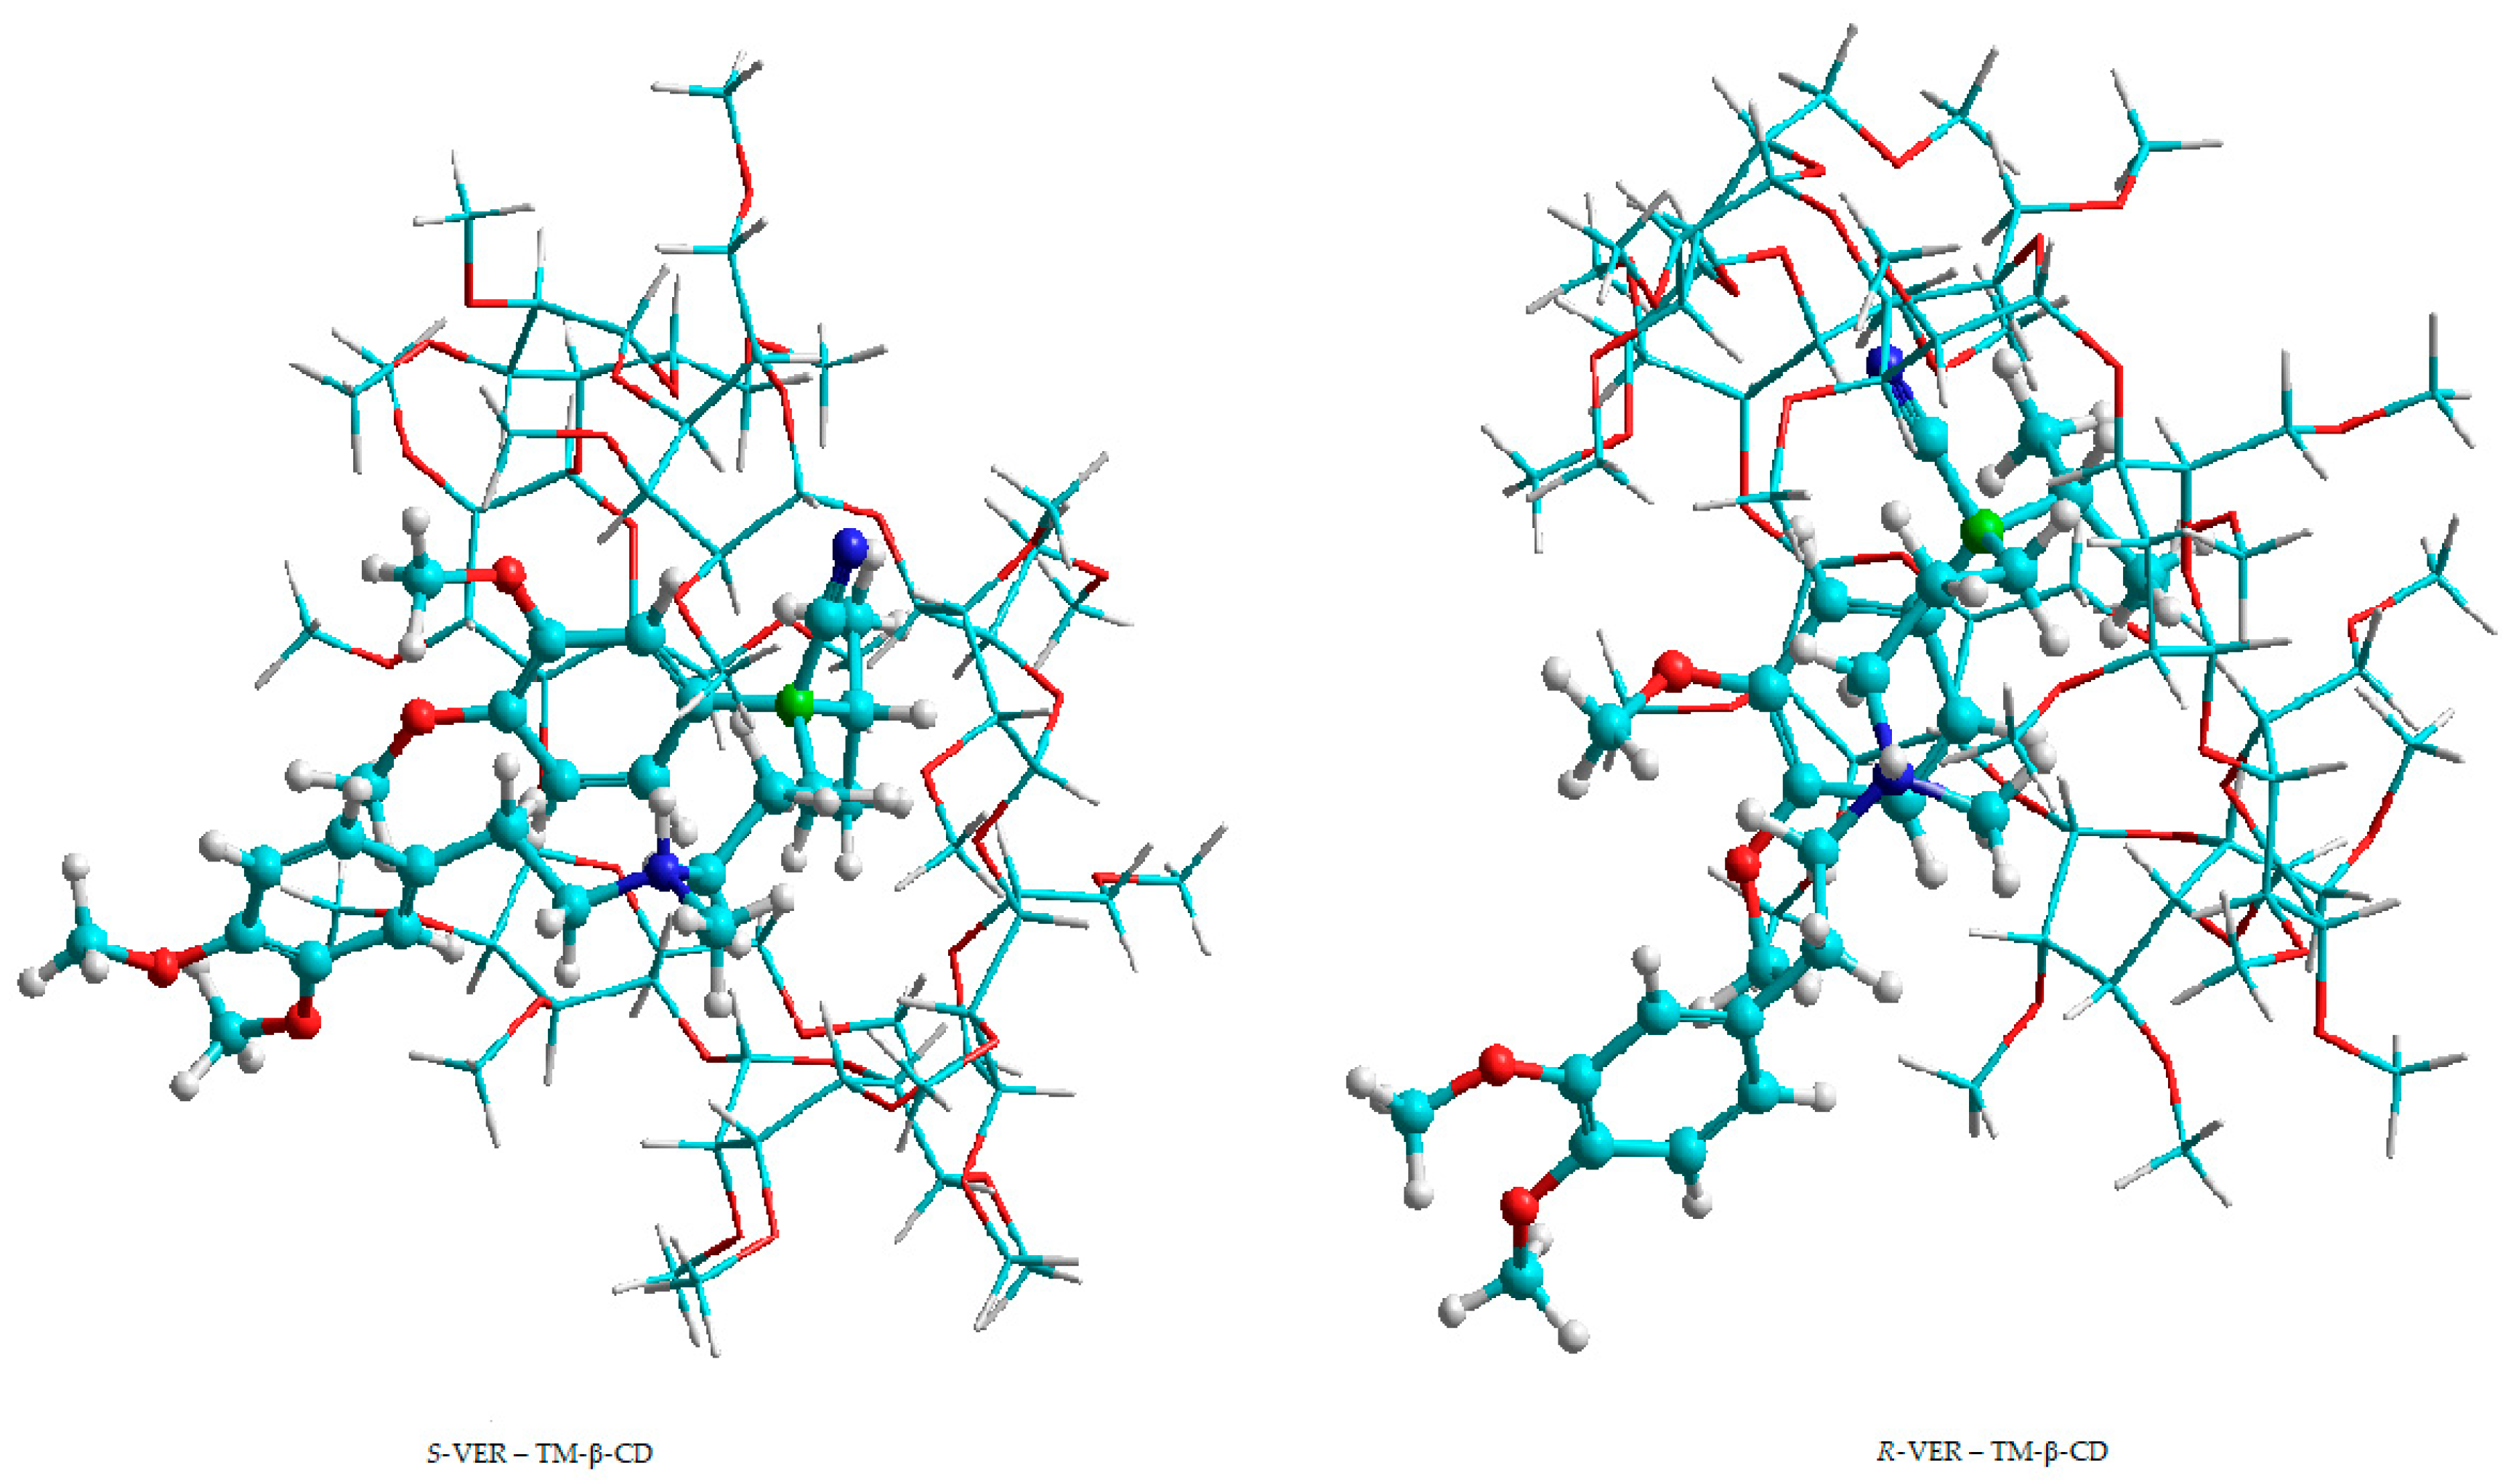
3.4. Molecular Modelling of VER-CD Complexes
4. Discussion
Author Contributions
Funding
Institutional Review Board Statement
Informed Consent Statement
Data Availability Statement
Conflicts of Interest
References
- Brooks, W.H.; Guida, W.C.; Daniel, K.G. The significance of chirality in drug design and development. Curr. Top Med. Chem. 2011, 11, 760–770. [Google Scholar] [CrossRef]
- Pepine, C.J.; Faich, G.; Makuch, R. Verapamil use in patients with cardiovascular disease: An overview of randomized trials. Clin. Cardiol. 1998, 21, 633–641. [Google Scholar] [CrossRef]
- Abernethy, D.R.; Wainer, I.W.; Longstreth, J.A.; Andrawis, N.S. Stereoselective verapamil disposition and dynamics in aging during racemic verapamil administration. J. Pharmacol. Exp. Ther. 1993, 266, 904–911. [Google Scholar]
- Gupta, S.K.; Atkinson, L.; Tu, T.; Longstreth, J.A. Age and gender related changes in stereoselective pharmacokinetics and pharmacodynamics of verapamil and norverapamil. Br. J. Clin. Pharmacol. 1995, 40, 325–331. [Google Scholar] [CrossRef] [Green Version]
- Fanali, S.; Chankvetadze, B. Some thoughts about enantioseparations in capillary electrophoresis. Electrophoresis 2019, 40, 2420–2437. [Google Scholar] [CrossRef]
- Bernardo-Bermejo, S.; Sánchez-López, E.; Castro-Puyana, M.; Marina, M.L. Chiral capillary electrophoresis. Trend Anal. Chem. 2020, 124, 115807. [Google Scholar] [CrossRef]
- Řezanka, P.; Navrátilová, K.; Řezanka, M.; Král, V.; Sýkora, D. Application of cyclodextrins in chiral capillary electrophoresis. Electrophoresis 2014, 35, 2701–2721. [Google Scholar] [CrossRef]
- Fukuda, I.M.; Pinto, C.F.F.; Moreira, C.D.S.; Saviano, A.M.; Lourenço, F.R. Design of experiments (DoE) applied to pharmaceutical and analytical quality by design (QbD). Braz. J. Pharm. Sci. 2018, 54, 1–16. [Google Scholar] [CrossRef]
- Dethy, J.M.; De Broux, S.; Lesne, M.; Longstreth, J.; Gilbert, P. Stereoselective determination of verapamil and norverapamil by capillary electrophoresis. J. Chromatogr. B Biomed. Appl. 1994, 654, 121–127. [Google Scholar] [CrossRef]
- Clothier, J.G.; Tomellini, S.A. Chiral separation of verapamil and related compounds using micellar electrokinetic capillary chromatography with mixed micelles of bile salt and polyoxyethylene ethers. J. Chromatogr. A 1996, 723, 179–187. [Google Scholar] [CrossRef]
- Chankvetadze, B.; Burjanadze, N.; Pintore, G.; Strickmann, D.; Bergenthal, D.; Blaschke, G. Chiral recognition of verapamil by cyclodextrins studied with capillary electrophoresis, NMR spectroscopy, and electrospray ionization mass spectrometry. Chirality 1999, 11, 635–644. [Google Scholar] [CrossRef]
- Resztak, M.; Główka, F.K. Stereoselective CZE method for analysis of verapamil and norverapamil in human plasma. Acta Pol. Pharm. 2013, 70, 395–401. [Google Scholar] [PubMed]
- Hamidi, S.; Jouyban, A. Capillary electrophoresis with UV detection, on-line stacking and off-line dispersive liquid–liquid microextraction for determination of verapamil enantiomers in plasma. Anal. Methods 2015, 7, 5820–5829. [Google Scholar] [CrossRef]
- Mohamed, N.A.L.; Kuroda, Y.; Shibukawa, A.; Nakagawa, T.; El Gizawy, S.; Askal, H.F.; El Kommos, M.E. Enantioselective binding analysis of verapamil to plasma lipoproteins by capillary electrophoresis–frontal analysis. J. Chromatogr. A 2000, 875, 447–453. [Google Scholar] [CrossRef]
- Ha, P.T.T.; Sluyts, I.; Van Dyck, S.; Zhang, J.; Gilissen, R.A.; Hoogmartens, J.; Van Schepdael, A. Chiral capillary electrophoretic analysis of verapamil metabolism by cytochrome P450 3A4. J. Chromatogr. A 2006, 1120, 94–101. [Google Scholar] [CrossRef] [PubMed]
- Asensi-Bernardi, L.; Martín-Biosca, Y.; Escuder-Gilabert, L.; Sagrado, S.; Medina-Hernández, M.J. In-line capillary electrophoretic evaluation of the enantioselective metabolism of verapamil by cytochrome P3A4. J. Chromatogr. A 2013, 1298, 139–145. [Google Scholar] [CrossRef] [PubMed]
- Martín-Biosca, Y.; Escuder-Gilabert, L.; Sagrado, S.; Medina-Hernández, M.J. Enantioselective study on the biodegradation of verapamil and citalopram by chiral capillary electrophoresis. Separations 2021, 8, 29. [Google Scholar] [CrossRef]
- Salido-Fortuna, S.; Greño, M.; Castro-Puyana, M.; Marina, M.L. Amino acid chiral ionic liquids combined with hydroxypropyl-β-cyclodextrin for drug enantioseparation by capillary electrophoresis. J. Chromatogr. A 2019, 1607, 460375. [Google Scholar] [CrossRef]
- Ding, Y.; Zhu, X.; Lin, B. Study of interaction between drug enantiomers and serum albumin by capillary electrophoresis. Electrophoresis 1999, 20, 1890–1894. [Google Scholar] [CrossRef]
- He, J.Y.; Shibukawa, A.; Zeng, M.; Amane, S.; Sawada, T.; Nakagawa, T. On-capillary sample preconcentration incorporated in chiral capillary electrophoresis. Anal. Sci. 1996, 12, 177–181. [Google Scholar] [CrossRef] [Green Version]
- Groom, C.R.; Bruno, I.J.; Lightfoot, M.P.; Ward, S.C. The Cambridge Structural Database. Acta Crystallogr. B Struct. Sci. Cryst. Eng. Mater. 2016, 72, 171–179. [Google Scholar] [CrossRef]
- Ferreira, S.C.; Bruns, R.E.; Ferreira, H.S.; Matos, G.D.; David, J.M.; Brandão, G.C.; da Silva, E.G.P.; Portugal, L.A.; dos Reis, P.S.; Souza, A.S.; et al. Box-Behnken design: An alternative for the optimization of analytical methods. Anal. Chim. Acta 2007, 597, 179–186. [Google Scholar] [CrossRef]
- Candioti, L.V.; de Zan, M.M.; Cámara, M.S.; Goicoechea, H.C. Experimental design and multiple response optimization. Using the desirability function in analytical methods development. Talanta 2014, 124, 123–138. [Google Scholar] [CrossRef] [PubMed]
- Ferreira, S.L.; Caires, A.O.; Borges, T.D.S.; Lima, A.M.; Silva, L.O.; dos Santos, W.N.L. Robustness evaluation in analytical methods optimized using experimental designs. Microchem. J. 2017, 131, 163–169. [Google Scholar] [CrossRef]
- Chankvetadze, B. Contemporary theory of enantioseparations in capillary electrophoresis. J Chrom. A 2018, 1567, 2–25. [Google Scholar] [CrossRef]


| pH | BGE Conc. [mM] | CD Conc. [mM] | Voltage [kV] | Temperature [°C] | Injection Pressure [mbar/s] | R | t1 (min) | t2 (min) |
|---|---|---|---|---|---|---|---|---|
| 4 | 50 | 20 | 25 | 20 | 50 | 1.18 | 2.64 | 2.69 |
| 5 | 50 | 20 | 25 | 20 | 50 | 1.25 | 2.53 | 2.63 |
| 6 | 50 | 20 | 25 | 20 | 50 | 1.02 | 2.38 | 2.44 |
| 5 | 25 | 20 | 25 | 20 | 50 | 1.08 | 2.43 | 2.50 |
| 5 | 100 | 20 | 25 | 20 | 50 | 1.17 | 3.45 | 3.56 |
| 5 | 50 | 10 | 25 | 20 | 50 | 0.65 | 2.15 | 2.20 |
| 5 | 50 | 15 | 25 | 20 | 50 | 0.85 | 2.45 | 2.51 |
| 5 | 50 | 20 | 20 | 20 | 50 | 1.34 | 3.70 | 3.80 |
| 5 | 50 | 20 | 30 | 20 | 50 | 0.96 | 1.82 | 1.89 |
| 5 | 50 | 20 | 25 | 15 | 50 | 1.34 | 2.88 | 3.00 |
| 5 | 50 | 20 | 25 | 25 | 50 | 1.08 | 2.47 | 2.55 |
| 5 | 50 | 20 | 25 | 20 | 40 | 1.26 | 2.64 | 2.72 |
| 5 | 50 | 20 | 25 | 20 | 30 | 1.28 | 2.72 | 2.80 |
| Run No | Factor A | Factor B | Factor C | Response 1 | Response 2 |
|---|---|---|---|---|---|
| 1 | 20 | 25 | 15 | 3.61 | 1.29 |
| 2 | 20 | 20 | 20 | 3.94 | 1.35 |
| 3 | 18 | 20 | 25 | 3.34 | 1.02 |
| 4 | 18 | 20 | 15 | 3.95 | 1.14 |
| 5 | 20 | 20 | 25 | 3.77 | 1.28 |
| 6 | 22 | 15 | 20 | 4.94 | 1.52 |
| 7 | 20 | 20 | 20 | 4.02 | 1.4 |
| 8 | 18 | 15 | 20 | 4.36 | 1.16 |
| 9 | 20 | 20 | 20 | 3.99 | 1.32 |
| 10 | 18 | 25 | 20 | 3.12 | 1.08 |
| 11 | 22 | 25 | 20 | 3.82 | 1.25 |
| 12 | 20 | 20 | 20 | 3.96 | 1.3 |
| 13 | 20 | 25 | 25 | 3.08 | 1.15 |
| 14 | 22 | 20 | 25 | 4.25 | 1.28 |
| 15 | 20 | 15 | 25 | 4.48 | 1.32 |
| 16 | 22 | 20 | 15 | 4.82 | 1.48 |
| 17 | 20 | 15 | 15 | 4.95 | 1.56 |
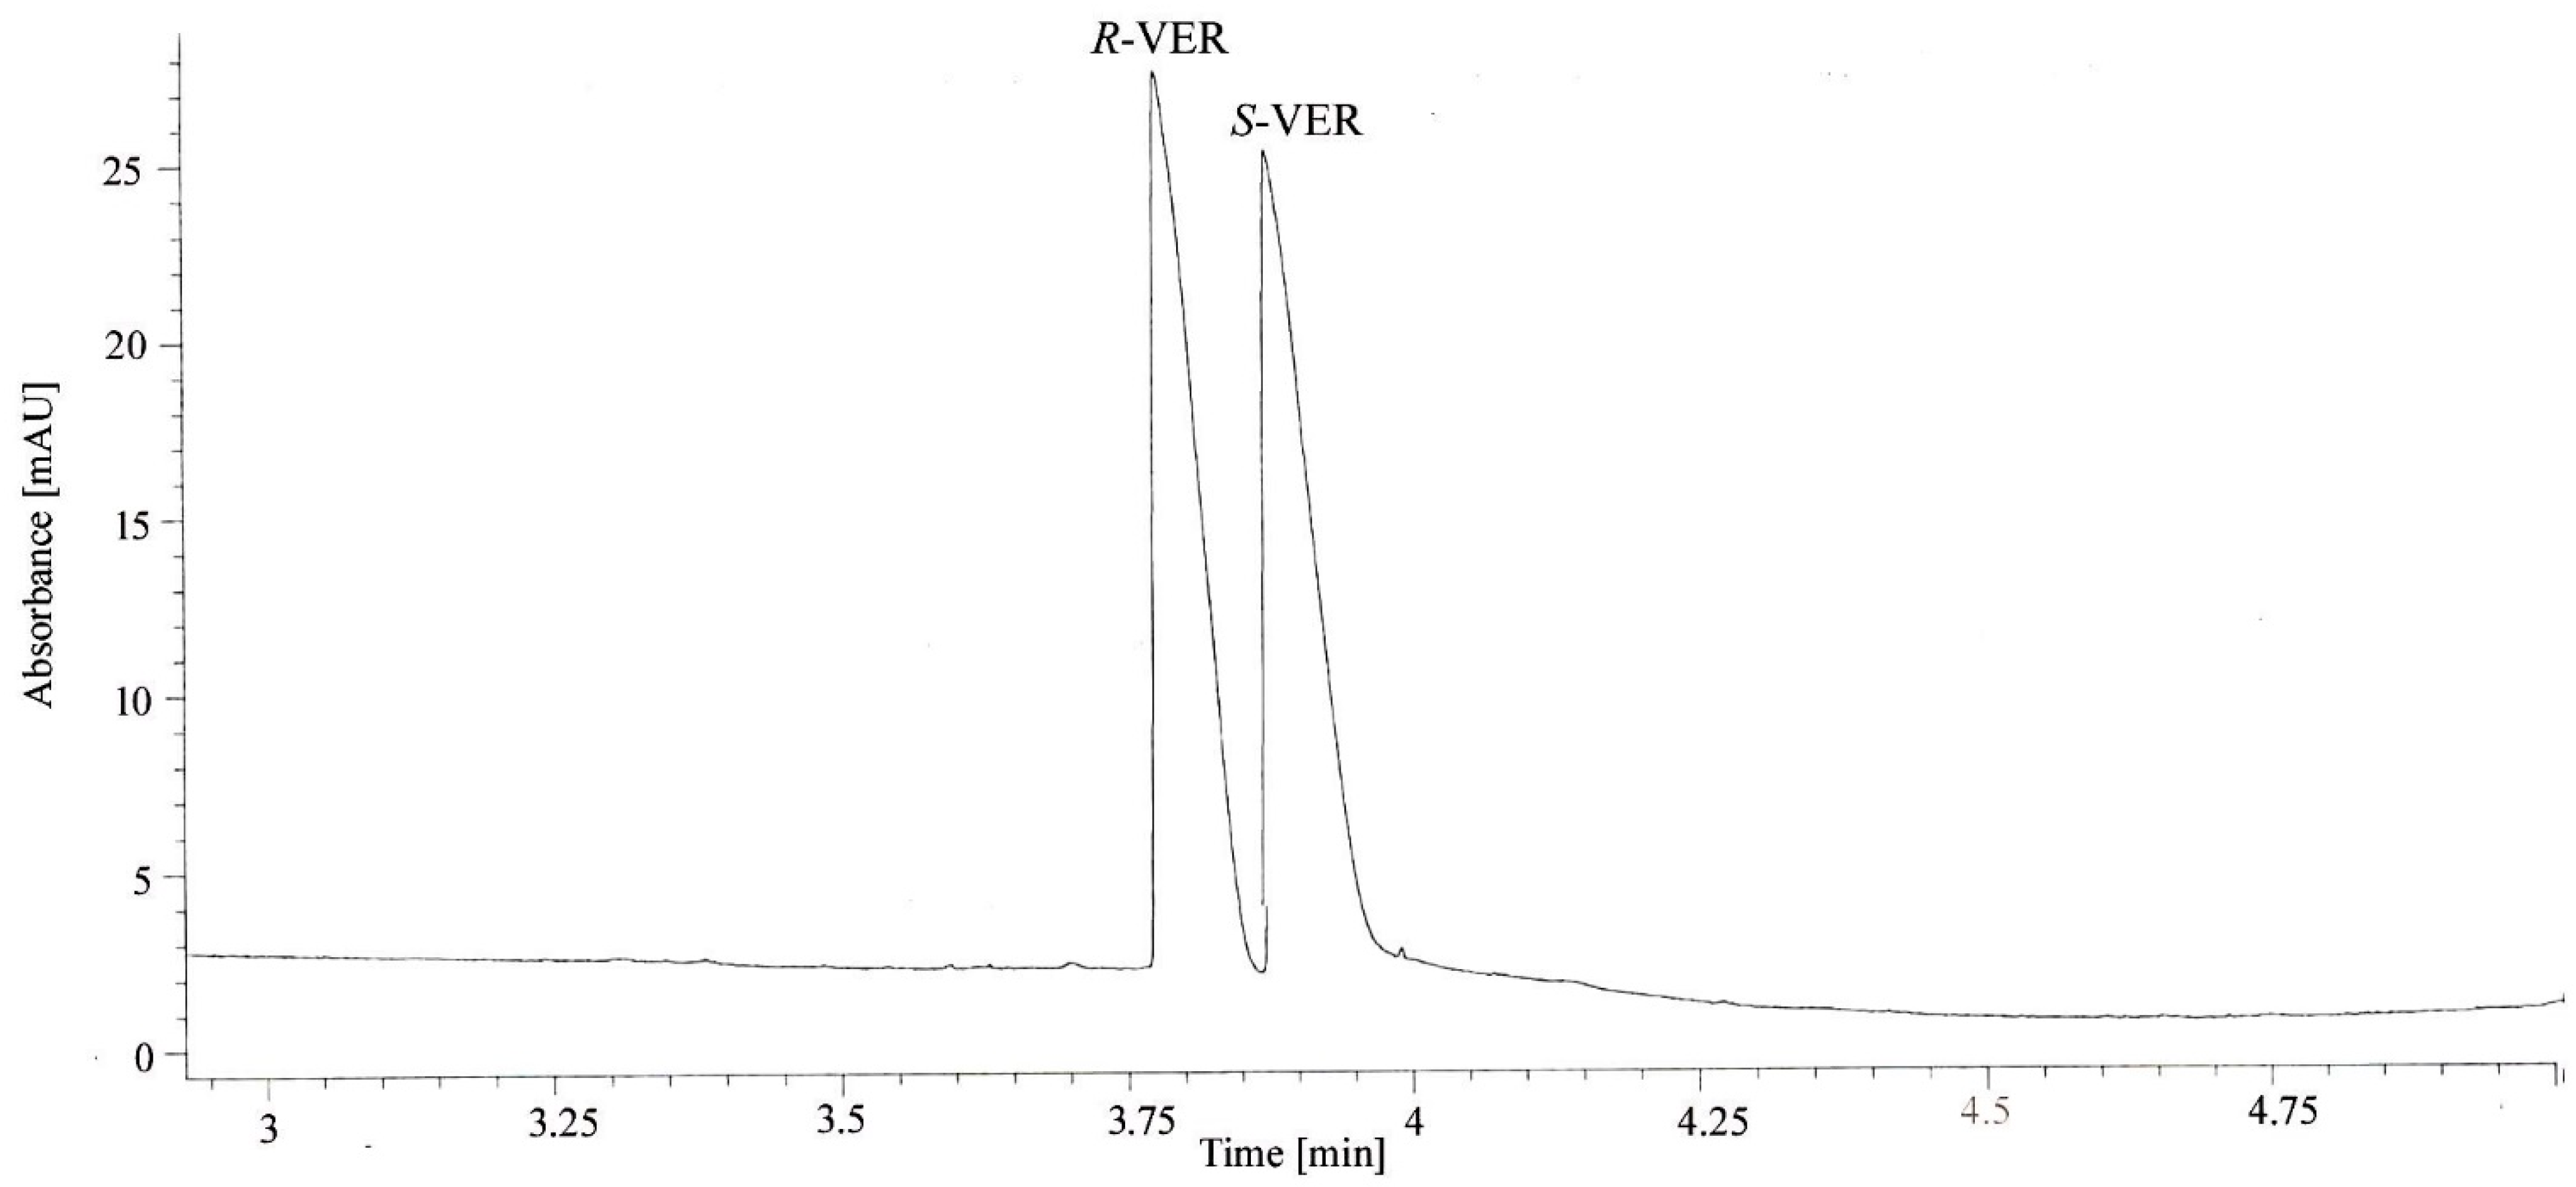
| Enantiomer | Time [min] | Area | Height | Symmetry | Nr Theoretical Plates | Rs | α |
|---|---|---|---|---|---|---|---|
| R-VER | 3.82 | 90.05 | 25.77 | 0.13 | 18277 | - | - |
| S-VER | 3.98 | 91.48 | 24.85 | 0.12 | 17545 | 1.58 | 1.04 |
| VER | R-VER | S-VER | |
|---|---|---|---|
| Precision | |||
| Intra-day precision (sample concentration = 0.15 mg/mL, n = 6) | RSD%, migration time | 0.03 | 0.03 |
| RSD%, peak area | 0.28 | 0.25 | |
| Inter-day precision (sample concentration = 0.15 mg/mL, n = 18) | RSD%, migration time | 0.05 | 0.06 |
| RSD%, peak area | 0.48 | 0.51 | |
| Accuracy (recovery % ± SD) | |||
| 0.15 mg/mL (n = 6) | 101.05 ± 0.41 | 99.55 ± 0.63 | |
| 0.1 mg/mL (n = 6) | 100.58 ± 1.02 | 100.82 ± 0.81 | |
| 0.075 mg/mL (n = 6) | 101.45 ± 1.32 | 99.87 ± 1.24 | |
| Linearity | |||
| Regression equation (0.015–0.3 mg/mL) | y = 275.42x + 0.0831 | y = 278.1x + 0.4209 | |
| Coefficient of correlation | 0.996 | 0.994 | |
| LOD (mg/mL) | 0.0096 | 0.0092 | |
| LOQ (mg/mL) | 0.0291 | 0.0278 | |
| Nr | Factor A | Factor B | Factor C | Factor D | Factor E | Response 1 | Response 2 |
|---|---|---|---|---|---|---|---|
| 1 | 50.00 | 21.00 | 5.00 | 20.00 | 15.00 | 3.49 | 1.49 |
| 2 | 55.00 | 21.50 | 5.50 | 19.00 | 14.00 | 3.55 | 1.55 |
| 3 | 45.00 | 21.50 | 5.50 | 19.00 | 16.00 | 3.52 | 1.46 |
| 4 | 55.00 | 20.50 | 5.50 | 21.00 | 14.00 | 3.48 | 1.50 |
| 5 | 45.00 | 20.50 | 4.50 | 21.00 | 14.00 | 3.44 | 1.47 |
| 6 | 50.00 | 21.00 | 5.00 | 20.00 | 15.00 | 3.49 | 1.49 |
| 7 | 55.00 | 21.50 | 4.50 | 19.00 | 14.00 | 3.54 | 1.53 |
| 8 | 45.00 | 21.50 | 5.50 | 21.00 | 14.00 | 3.51 | 1.47 |
| 9 | 55.00 | 20.50 | 4.50 | 19.00 | 16.00 | 3.52 | 1.53 |
| 10 | 55.00 | 21.50 | 4.50 | 21.00 | 16.00 | 3.55 | 1.52 |
| 11 | 50.00 | 21.00 | 5.00 | 20.00 | 15.00 | 3.49 | 1.48 |
| 12 | 45.00 | 21.50 | 4.50 | 21.00 | 16.00 | 3.52 | 1.48 |
| 13 | 55.00 | 20.50 | 5.50 | 21.00 | 16.00 | 3.51 | 1.50 |
| 14 | 50.00 | 21.00 | 5.00 | 20.00 | 15.00 | 3.5 | 1.49 |
| 15 | 45.00 | 20.50 | 5.50 | 19.00 | 16.00 | 3.45 | 1.47 |
| 16 | 45.00 | 20.50 | 4.50 | 19.00 | 14.00 | 3.46 | 1.48 |
| Pharmaceutical Product | Declared Enantiomers Quantity (mg) | Found Enantiomer Quantity (mg) ± SD (n = 3) | ||
|---|---|---|---|---|
| R-VER | S-VER | R-VER | S-VER | |
| Verapamil tablets (80 mg VER) | 40 | 40 | 39.85 ± 0.27 | 39.72 ± 0.32 |
Publisher’s Note: MDPI stays neutral with regard to jurisdictional claims in published maps and institutional affiliations. |
© 2021 by the authors. Licensee MDPI, Basel, Switzerland. This article is an open access article distributed under the terms and conditions of the Creative Commons Attribution (CC BY) license (https://creativecommons.org/licenses/by/4.0/).
Share and Cite
Cârcu-Dobrin, M.; Hancu, G.; Papp, L.A.; Fülöp, I.; Kelemen, H. Development of a Chiral Capillary Electrophoresis Method for the Enantioseparation of Verapamil Using Cyclodextrins as Chiral Selectors and Experimental Design Optimization. Symmetry 2021, 13, 2186. https://doi.org/10.3390/sym13112186
Cârcu-Dobrin M, Hancu G, Papp LA, Fülöp I, Kelemen H. Development of a Chiral Capillary Electrophoresis Method for the Enantioseparation of Verapamil Using Cyclodextrins as Chiral Selectors and Experimental Design Optimization. Symmetry. 2021; 13(11):2186. https://doi.org/10.3390/sym13112186
Chicago/Turabian StyleCârcu-Dobrin, Melania, Gabriel Hancu, Lajos Attila Papp, Ibolya Fülöp, and Hajnal Kelemen. 2021. "Development of a Chiral Capillary Electrophoresis Method for the Enantioseparation of Verapamil Using Cyclodextrins as Chiral Selectors and Experimental Design Optimization" Symmetry 13, no. 11: 2186. https://doi.org/10.3390/sym13112186
APA StyleCârcu-Dobrin, M., Hancu, G., Papp, L. A., Fülöp, I., & Kelemen, H. (2021). Development of a Chiral Capillary Electrophoresis Method for the Enantioseparation of Verapamil Using Cyclodextrins as Chiral Selectors and Experimental Design Optimization. Symmetry, 13(11), 2186. https://doi.org/10.3390/sym13112186