Article

Optimal Control of a Cell-to-Cell Fractional-Order Model with Periodic Immune Response for HCV

1
School of Mathematics and Physics, University of Science and Technology Beijing, Beijing 100083, China
2
School of Sciences, Beijing University of Posts and Telecommunications, Beijing 100700, China
*
Author to whom correspondence should be addressed.
Symmetry 2021, 13(11), 2121; https://doi.org/10.3390/sym13112121
Submission received: 14 October 2021 / Revised: 27 October 2021 / Accepted: 1 November 2021 / Published: 8 November 2021

Abstract

:
In this paper, a Caputo fractional-order HCV Periodic immune response model with saturation incidence, cell-to-cell and drug control was proposed. We derive two different basic reproductive numbers and their relation with infection-free equilibrium and the immune-exhausted equilibrium. Moreover, there exists some symmetry in the relationship between the two equilibria and the basic reproduction numbers. We obtain the global stability of the infection-free equilibrium by using Lyapunov function and the local stability of the immune-exhausted equilibrium. The optimal control problem is also considered and two control strategies are given; one is for ITX5061 monotherapy, the other is for ITX5061 and DAAs combination therapy. Matlab numerical simulation shows that combination therapy has lower objective function value; therefore, it is worth trying to use combination therapy to treat HCV infection.

1. Introduction

Hepatitis C virus (HCV), which is an enveloped flavivirus [1], causes both acute and chronic infection. It is reported that about 290,000 people have died of HCV infection so far; most of them from liver cirrhosis and hepatocellular carcinoma [2]. Hence, understanding the mechanism of HCV virus infection is very important for the treatment of HCV.
Mathematical models are widely used to study the dynamic behavior of HCV. At the same time, the development of mathematical theory also makes it possible for us to study the treatment of HCV. In 1998, Neumann et al. [3] proposed a simple integer-order HCV model with antiviral treatment. Furthermore, in 2005, Dahari et al. [4] extended the model in paper [3] to predict long-term response rates to interferon monotherapy and combination therapy. However, the development of fractional order generalizes the integer order. The reason is that, compared with integer order, it is non-local, so it is more suitable for dynamical systems with memory influences on their state variables [5], such as the immune response. So, some fractional-order models related to viruses were proposed by [6,7,8,9,10,11]. However, these models didn’t consider immune system.
With the development of molecular techniques, there have been fundamental insights into the molecular mechanisms of the immune system for HCV infection [12]. In 1996, Nowak et al. [13] presented a model to explore the relationship between antiviral immune responses, virus load, and virus diversity. In 2003, Wodarz [14] added antibody responses to investigate the role of cytotoxic T lymphocytes (CTLs) and antibody responses in HCV dynamics and pathology. However, the human immune system has high complexity. The immune would be influenced by taking some drugs regularly. Papers [15,16,17] considered periodic lytic immune response, whose main purposes were to study the effect of oscillation of the immune system on the viral dynamic behaviors. The model in paper [17] is presented as follows:
x ˙ = λ d 1 x β x y y ˙ = β x y a y p ( t ) y z z ˙ = c y z b z p ( t ) = β 0 + β 1 cos 2 π T t φ , 0 β 1 < β 0
where x, y, z denote uninfected cells, infected cells, CTLs respectively. Uninfected cells are assumed to be produced at the constant rate λ and become infected by infected cells at the rate of β x y . Infected cells are thus producted at the rate of β x y and become lysed by CTLs at a rate p ( t ) y z . p ( t ) stands for the strength of the lytic component. T(days) presents the period of oscillation of human immune system. β 0 is the basic strength of the lytic component, the amplitude parameter β 1 is the degree of oscillation of immune system, and φ is the acrophase. CTLs are produced at a rate c y z . The mortality rates of uninfected cells, infected cells and CTLs are d 1 x , a y and b z respectively. Except for p ( t ) , which varies with time, all parameters of system (1) are constants. However, [17] did not consider viruses.
It is known that cellular and humoral responses are of limited effectiveness in achieving viral responses in most patients with acute infection HCV [18]. It is generally believed that, due to factors such as delays in the life cycle of the virus and the evasion of immune responses, the cell-to-cell transmission of viral particles is far greater than a cell-free spread. In 2014, Fei Xiao et al. [19] showed that cell–cell transmission is the route of viral spread. Papers [20,21,22] proposed some cell-to-cell models, and in 2018, a mathematical model of HCV infection with cell-to-cell and cure rate was proposed by Sonjoy et al. [23]. This model is given by
x ˙ = λ d 1 x β 1 x v β 2 x y + α y y ˙ = β 1 x v + β 2 x y a y α y v ˙ = k y γ v p v z z ˙ = c v z b z
where x denotes uninfected hepatocytes, y represents infected hepatocytes, v and z denote free virus and CTLs respectively. The parameters of system (2) are all constants. α y denotes the cure rate of infected cells. Uninfected hepatocytes are produced at the constant rate λ , become infected hepatocytes at the rate of β 2 x y , and are infected by free virus at the rate of β 1 x v . Infected hepatocytes are produced at the rate of β 1 x v + β 2 x y . Free viruses are produced by infected hepatocytes at a rate k y and become lysed by CTLs at a rate p v z . CTLs are producted at the rate of c v z . The mortality rate of x, y, v and z are d 1 x , a y , γ v and b z , respectively. However, this model is not fractional-order and p is a constant. Meanwhile, this system did not consider the control of drugs.
After that, some authors extended the system (2). In 2020, a cell-to-cell model with humoral immunity is considered by Mausumi et al. [24]. After this, paper [25] further considered the time delay of humoral immunity. In addition, a stochastic HCV infection model with therapy was discussed by paper [26]. However, paper [24,25,26] did not consider fractional order.
It should be noted that the model (2) described the process of free virus infecting normal cells using bilinear incidence β x v , and so did paper [17,20,21,22,23]. Paper [27] uses Holling type-II incidence instead of bilinear incidence, that is β x v 1 + m x . Yang et al. [28] changed it to saturation incidence function β x v x + v , and the reproductive number is R 0 = β k μ ( a + δ ) , which seems more reasonable because it is independent of the number of total cells of liver. Since infected liver cells can also infect normal liver cells, it might also be better to replace β x y with β x y x + y .
HCV can be controlled in many ways. In 2016, Ian A et al. [29] proposed that ITX5061 blocks HCV entry and infection in vitro. The recent introduction of new direct-acting antivirals (DAAs), targeting HCV replication, allowed us to achieve sustained virological response (SVR) rates in over 90 % of treated patients [30]. In 2021 [31], efficacy and safety of pangenotypic DAAs against hepatitis C virus infection in Taiwan are proven.
Based on the above discussion, in order to better explain the phenomenon of HCV clinical treatment, we consider an HCV cell-to-cell fractional-order system with the saturation incidence rate. The model is as follows:
D α x = λ d 1 x β 1 ( 1 ϵ ) x v x + v β 2 x y x + y D α y = β 1 ( 1 ϵ ) x v x + v + β 2 x y x + y a y p ( t ) y z D α v = k ( 1 η ) y γ v D α z = q y z r z p ( t ) = m 0 + m 1 cos 2 π T t φ , 0 m 1 < m 0
where D α denotes the Caputo fractional derivative. The variable x, y, v and z and the parameter d 1 , k, a, β 1 , β 2 , γ and r have the same meaning as that in model (2). ϵ and η denote the efficacy of the drugs, namely, ITX5061 and DAAs. m 0 and m 1 have the same meaning as β 0 and β 1 , respectively, in model (1). Infected hepatocytes are lysed by CTLs at a rate p ( t ) y z . CTLs are producted by Infected hepatocytes at the rate of q y z .
This paper consists of the following seven parts: in part 2, some related definitions and lemmas were presented. The existence and uniqueness of positive solution of system (3) were proven in part 3. The stability of the equilibrium point of the system (3) was analyzed in part 4. The fifth part presents the theoretical analysis of the optimal control of the model. Numerical simulation and discussion are carried out in part 6, and in part 7, we give the conclusion.

2. Preliminaries

In this section, we give some basic definitions and lemmas of the Caputo fractional-order. We denote by A C n [ a , b ] the space of complex-valued functions f ( x ) which have continuous derivatives up to order n 1 on [ a , b ] , such that f ( n 1 ) ( x ) A C [ a , b ] : A C n [ a , b ] = ( f : [ a , b ] C and ( D n 1 f ) ( x ) A C [ a , b ] ( D = d d x ) ), C being the set of complex numbers. In particular, A C 1 [ a , b ] = A C [ a , b ] .
Definition 1 (see [32]).
Let α > 0 and n = [ α ] + 1 . If y ( x ) A C n [ a , b ] , then the Caputo fractional derivative ( D α y ) ( x ) exists almost everywhere on [ a , b ] , which is defined by
( D α y ) ( x ) = 1 Γ ( n α ) a x y ( n ) ( t ) ( x t ) α + 1 n d t
where Γ ( z ) = 0 e t t z 1 d t , [ α ] means the integral part of α, y ( n ) ( x ) is the usual derivative of y ( x ) of order n.
Lemma 1 (see [33]).
Assume that the vector function f : R + × R n R n satisfies the following conditions:
(i)
Function f t , X ( t ) is Lebesgue measurable with respect to t on R + ;
(ii)
Function f ( t , X ( t ) ) is continuous with respect to t on R n ;
(iii)
f t , X ( t ) / X is continuous with respect to X ( t ) on R n ;
(iv)
f t , X ω + λ X , t R + and X R n . Here, ω and λ are two positive constants; then, initial value problems
D α X ( t ) = f ( t , X ( t ) ) , X ( t 0 ) = X 0 , α 0 , 1 .
then, there exists a unique solution.
Lemma 2 (see [34]).
Let 0 < α 1 , a < b and f C [ a , b ] be such that D α f C [ a , b ] . Then, there exists some ξ ( a , b ) , such that
f ( b ) f ( a ) ( b a ) α = 1 Γ ( α + 1 ) D α f ( ξ ) .

3. The Existence and Uniqueness of Positive Solutions

Firstly, we analyze the system (3) without control; that is, ϵ = η = 0 .
Theorem 1.
The solution of system (3) is always non-negative.
Proof of Theorem 1.
For system (3), we can obtain
D α x ( t ) | x = 0 = λ > 0 D α y ( t ) | y = 0 = β 1 x v x + v 0 D α v ( t ) | v = 0 = k y 0 D α z ( t ) | z = 0 = 0
Based on Lemma 2, we can prove that the solution of the system (3) will remain non-negative for all t 0 . □
Let N ( t ) = x ( t ) + y ( t ) + a 2 k v ( t ) + m 0 m 1 q z ( t ) , we have
D α N ( t ) = λ d 1 x a 2 y ( p ( t ) ( m 0 m 1 ) ) y z a γ 2 k v m 0 m 1 q r z λ μ N ( t )
here μ = min d 1 , a 2 , γ , r , so we obtain
N ( t ) λ μ + N ( 0 ) E α μ t α + λ μ .
Let D = x ( t ) + y ( t ) + a 2 k v ( t ) + m 0 m 1 q z ( t ) λ μ , x , y , v , z 0 , it is easy to see that D is a positively invariant region for system (3).
Theorem 2.
For any initial condition in D , system (3) has a unique solution X = ( x , y , v , z ) .
Proof of Theorem 2.
We denote
f ( t , X ( t ) ) = λ d 1 x β 1 x v x + v β 2 x y x + y β 1 x v x + v + β 2 x y x + y a y p ( t ) y z k y γ v q y z r z
Obviously f ( t , X ( t ) ) satisfies conditions (i), (ii) and (iii) of Lemma 1, and we only prove that system (3) satisfies the last condition (iv) of Lemma 1.
In the case of HCV infection, let the whole hepatocytes population T ( t ) = x ( t ) + y ( t ) , then add the first two formulas of the system (3), and we get
D α T = λ d 1 x a y p ( t ) y z
from the biological significance, the death of infected hepatocytes is greater than the natural death of uninfected hepatocytes, so a d , then
D α T ( t ) λ d 1 x a y λ d 1 T
then, we have
T λ d 1 + T ( 0 ) E α d 1 t α + λ d 1 ; x ( t ) λ d 1 ; y ( t ) λ d 1
λ d 1 x β 1 x v x + v β 2 x y x + y λ + d 1 | x | + β 1 | v | + β 2 | y |
β 1 x v x + v + β 2 x y x + y a y p ( t ) y z β 1 | v | + β 2 | y | + a | y | + ( m 0 + m 1 ) λ d 1 | z |
| k y γ v | k | y | + γ | v | ; | q y z r z | q λ d 1 + r | z |
Therefore, we obtain
λ d 1 x β 1 x v x + v β 2 x y x + y β 1 x v x + v + β 2 x y x + y a y p ( t ) y z k y γ v q y z r z λ + M X ( t )
where M = max a , d 1 , k , γ , β 1 , β 2 , ( m 0 + m 1 ) λ d 1 , q λ d 1 + r . Vector field function f ( t , X ( t ) ) satisfies Lemma 1, so the solution of the system (3) exists and is unique. □

4. Stability Analysis

First, we obtain the basic reproduction number by paper [35] as
R 0 = β 2 γ + β 1 k a γ
There exists a disease-free equilibrium E 0 = ( x 0 , 0 , 0 , 0 ) = λ d 1 , 0 , 0 , 0 ; to find the immune-exhausted equilibrium point E 1 = ( x 1 , y 1 , v 1 , 0 ) , we solve the system
λ d 1 x β 1 x v x + v β 2 x y x + y = 0
β 1 x v x + v + β 2 x y x + y a y = 0
k y γ v = 0
From (19) to (21), we obtain the equation
β 1 k x x + v + β 2 γ x x + y a γ = 0
From (13), we can obtain x λ d 1 . Hence, there is no biological equilibrium when x > λ d 1 . Define the function m ( x ) on the interval 0 , λ d 1 by
m ( x ) = β 1 k x x + v + β 2 γ x x + y a γ
m ( x ) = k β 1 ( x + v ) 2 v + k d 1 x a γ + γ β 2 ( x + y ) 2 y + d 1 x a > 0
Therefore, m ( 0 ) = a γ and m ( λ / d 1 ) = a γ ( R 0 1 ) , for R 0 > 1 , there exists a unique immune-exhausted equilibrium E 1 = ( x 1 , y 1 , v 1 , 0 ) .
x 1 = B + B 2 4 A C 2 A , y 1 = λ d 1 x 1 a , v 1 = k γ y 1 .
Here, a 1 = 1 k d 1 a γ , a 2 = k λ a γ , b 1 = 1 d 1 a , b 2 = λ a , A = γ β 2 a 1 + k β 1 b 1 a γ a 1 b 1 , B = k β 1 b 2 + γ β 2 a 2 a γ ( a 1 b 2 + a 2 b 1 ) and C = a γ a 2 b 2 .
Theorem 3.
For system (3), if R 0 < 1 , the equilibrium E 0 is globally asymptotically stable.
Proof of Theorem 3.
Define a global Lyapunov function V
V ( t ) = y ( t ) + β 1 γ v ( t ) + m 0 m 1 q z ( t )
Then, we have
D α V ( t ) = β 1 x v x + v + β 2 x y x + y a y p ( t ) y z + β 1 γ ( k y γ v ) + m 0 m 1 q ( q y z r z ) = β 1 x x + v β 1 v + a y β 1 k a γ + β 2 x a ( x + y ) 1 p ( t ) y z + ( m 0 m 1 ) y z m 0 m 1 q r z β 1 x + v v 2 + a y ( R 0 1 ) ( p ( t ) ( m 0 m 1 ) ) y z m 0 m 1 q r z
Since R 0 < 1 , we have D α V 0 . Let M = ( x , y , v , z ) D , D α V = 0 , obviously M ( x , y , v , z ) D , y = 0 , v = 0 , z = 0 . Let E be the largest positively invariant subset of M, in the set,
D α x ( t ) = λ d 1 x ( t )
The solution is
x ( t ) = λ d 1 + x ( 0 ) E α ( d 1 t α ) + λ d 1
So, we obtain
lim t x ( t ) = λ d 1
by the positive invariance of E, we can learn E = E 0 , and by the Lvapunov–Lasalle theorem [36], all solutions in the set D are attracted to E 0 . Noting that E 0 is locally asymptotically stable, therefore E 0 is global asymptotically stable. □
Since E 1 is immune-exhausted equilibrium, it means that the CTL immune is not stimulated, so q y 1 r < 0 . We define the CTL immune reproductive number R 1 = q y 1 / r ; obviously, q y 1 r < 0 is equivalent to R 1 < 1 .
Theorem 4.
For system (3), when R 0 > 1 and R 1 < 1 ,
(i)
If D(P) > 0, the equilibrium E 1 is locally asmptotically stable for 0 < α < 1 ;
(ii)
If D(P) < 0, the equilibrium E 1 is locally asmptotically stable for 0 < α < 2 3 ;
Moreover, if R 1 > 1 , E 1 is unstable.
Proof of Theorem 4.
We discuss the local stability of the equilibriun E 1 ; the Jacobian matrix at E 1 is given by
J E 1 = t 1 β 2 x 1 2 ( x 1 + y 1 ) 2 t 2 0 t 1 d 1 t 3 t 2 p ( t ) y 1 0 k ( 1 η ) γ 0 0 0 0 q y 1 r
where
t 1 = β 1 v 1 2 ( x 1 + v 1 ) 2 + d 1 + β 2 y 1 2 ( x 1 + y 1 ) 2 ; t 2 = β 1 x 1 2 ( x 1 + v 1 ) 2 ; t 3 = a β 2 x 1 2 ( x 1 + y 1 ) 2
Obviously, t 1 > 0 , t 2 > 0 and t 3 > a β 2 x 1 x 1 + y 1 , from (22), we can obtain a β 2 x 1 x 1 + y 1 = k β 1 x 1 γ ( x 1 + v 1 ) , so t 3 > 0 .
The corresponding characteristic equation is
| λ E J E 1 | = [ λ ( q y 1 r ) ] P ( λ ) , P ( λ ) = λ 3 + a 1 λ 2 + a 2 λ + a 3
where
a 1 = γ + t 1 + t 3 > 0 a 2 = γ ( t 1 + t 3 ) + t 1 t 3 + β 2 x 1 2 ( x 1 + y 1 ) 2 ( t 1 d 1 ) k t 2 = γ ( t 1 + t 3 ) + t 1 t 3 + ( a t 3 ) ( t 1 d 1 ) a β 2 x 1 x 1 + y 1 γ x 1 x 1 + v 1 γ ( t 1 + t 3 ) + a t 1 a d 1 + t 3 d 1 γ t 3 x 1 x 1 + v 1 = γ t 3 v 1 x 1 + v 1 + γ t 1 + a ( t 1 d 1 ) + t 3 d 1 > 0 a 3 = γ t 1 t 3 + β 2 x 1 2 ( x 1 + y 1 ) 2 ( t 1 d 1 ) d 1 k t 2 = γ ( d 1 t 3 + a t 1 a d 1 ) d 1 k t 2 γ d 1 t 3 1 x 1 x 1 + v 1 + γ a ( t 1 d 1 ) > 0 a 1 a 2 a 3 > ( γ + t 1 + t 3 ) γ t 3 v 1 x 1 + v 1 + γ t 1 + a ( t 1 d 1 ) + t 3 d 1 γ ( d 1 t 3 + a t 1 a d 1 ) + d 1 k t 2 > 0
We can see the λ 1 = q y 1 r , when R 1 < 1 , λ 1 is negative and | arg ( λ 1 ) | = π > α π / 2 . From the Definition in paper [37], the discriminant D ( P ) of the polynomial equation λ 3 + a 1 λ 2 + a 2 λ + a 3 is as follows:
D ( P ) = 1 a 1 a 2 a 3 0 0 1 a 1 a 2 a 3 3 2 a 1 a 2 0 0 0 3 2 a 1 a 2 0 0 0 3 2 a 1 a 2 = 18 a 1 a 2 a 3 + ( a 1 a 2 ) 2 4 a 1 2 4 a 2 2 27 a 3 2
According to proposition 1 in paper [37], when R 1 < 1 , if D ( P ) > 0 , the equilibrium E 1 is locally asmptotically stable for 0 < α < 1 ; if D ( P ) < 0 , the equilibrium E 1 is locally asmptotically stable for 0 < α < 2 3 . If R 1 > 1 , E 1 is unstable. □

5. Optimal Control Problem

In this section, we consider the optimal control problem of system (3). Here, ϵ and η denote the effects of the drugs ITX5061 and DAAs, respectively. Suppose the curative effect is positive proportional to the dosage. We will give the optimal control strategy at the minimum expense within a supposed time. The objective function of the optimal control was given as follows [38], where t f is the endpoint of treatment.:
J ( u ) = 1 2 a 2 y 2 + a 3 v 2 + 1 2 0 t f b 2 y 2 + b 3 v 2 + c 1 ϵ 2 + c 2 η 2 d t
Here a 2 , a 3 , b 2 , b 3 , c 1 , c 2 represent the corresponding weight of each variable. Let X ( t ) = ( x ( t ) , y ( t ) , v ( t ) , z ( t ) ) , u = ( ϵ , η ) , X ( 0 ) = ( x 0 , y 0 , v 0 , z 0 ) , then we can obtain
D α X ( t ) = f ( X ( t ) , u , t ) X ( 0 ) = X 0
Then, the Hamilton function of J ( u ) was given as follows:
H = p 1 λ d 1 x β 1 ( 1 ϵ ) x v x + v β 2 x y x + y + p 2 β 1 ( 1 ϵ ) x v x + v + β 2 x y x + y a y p ( t ) y z + p 3 k ( 1 η ) y γ v + p 4 q y z r z + 1 2 b 2 y 2 + b 3 v 2 + c 1 ϵ 2 + c 2 η 2
According to Pontryagin’s minimum principle, the necessary conditions for the existence of the optimal solution of system (3) are shown as follows:
(i)
D α x = λ d 1 x β 1 ( 1 ϵ ) x v x + v β 2 x y x + y D α y = β 1 ( 1 ϵ ) x v x + v + β 2 x y x + y a y p ( t ) y z D α v = k ( 1 η ) y γ v D α z = q y z r z p ( t ) = m 0 + m 1 cos 2 π T t φ , 0 m 1 < m 0
(ii)
X ( 0 ) = X 0 ;
(iii)
D α p 1 = p 1 d 1 β 1 ( 1 ϵ ) v 2 ( x + v ) 2 β 2 y 2 ( x + y ) 2 + p 2 β 1 ( 1 ϵ ) v 2 ( x + v ) 2 + β 2 y 2 ( x + y ) 2 D α p 2 = p 1 β 2 x 2 ( x + y ) 2 + p 2 β 2 x 2 ( x + y ) 2 a p ( t ) z + p 3 k ( 1 η ) + p 4 q z + b 2 y D α p 3 = p 1 β 1 ( 1 ϵ ) x 2 ( x + v ) 2 + p 2 β 1 ( 1 ϵ ) x 2 ( x + v ) 2 p 3 γ + b 3 v D α p 4 = p 2 p ( t ) y + p 4 ( q y r )
(iv)
c 1 ϵ + p 1 β 1 x v x + v p 2 β 1 x v x + v = 0 c 2 η p 3 k y = 0
(v)
p 1 ( t f ) = 0 , p 2 ( t f ) = a 2 y ( t f ) , p 3 ( t f ) = a 3 v ( t f ) , p 4 ( t f ) = 0
So, we obtain the optimal control as:
ϵ = min max ( p 2 p 1 ) c 1 β 1 x v x + v , 0 , 1 η = min max p 3 k y c 2 , 0 , 1

6. Simulation and Discussion

In this part, we will present some numerical simulations. First of all, our model is not based on actual data, but only qualitative discussion, so the parameters can be taken within the range of biological significance. Secondly, the parameters in the literature that we refer to are also given on the basis of biological significance. Moreover, the parameter values were presented in Table 1. We give the simulation with different orders ( α = 0.95 , 0.9 , 0.8 ) , and the initial conditions are x 0 = 66 ; y 0 = 1000 ; v 0 = 2000 ; z 0 = 30 . Let the weight a 2 = 5000 ; a 3 = 0.01 ; b 2 = 0.1 ; b 3 = 0.1 ; c 1 = 0.01 ; c 2 = 0.1 .
  • Strategy A: monotherapy of control (i.e., ϵ 0 and η = 0 );
In this section, we simulated the optimal procedure without considering DAAs drug, that is η = 0 . We assume that the maximum and minimum treatment effects were 0.98 and 0.5 , respectively. The simulation results are shown in Figure 1 and Figure 2.
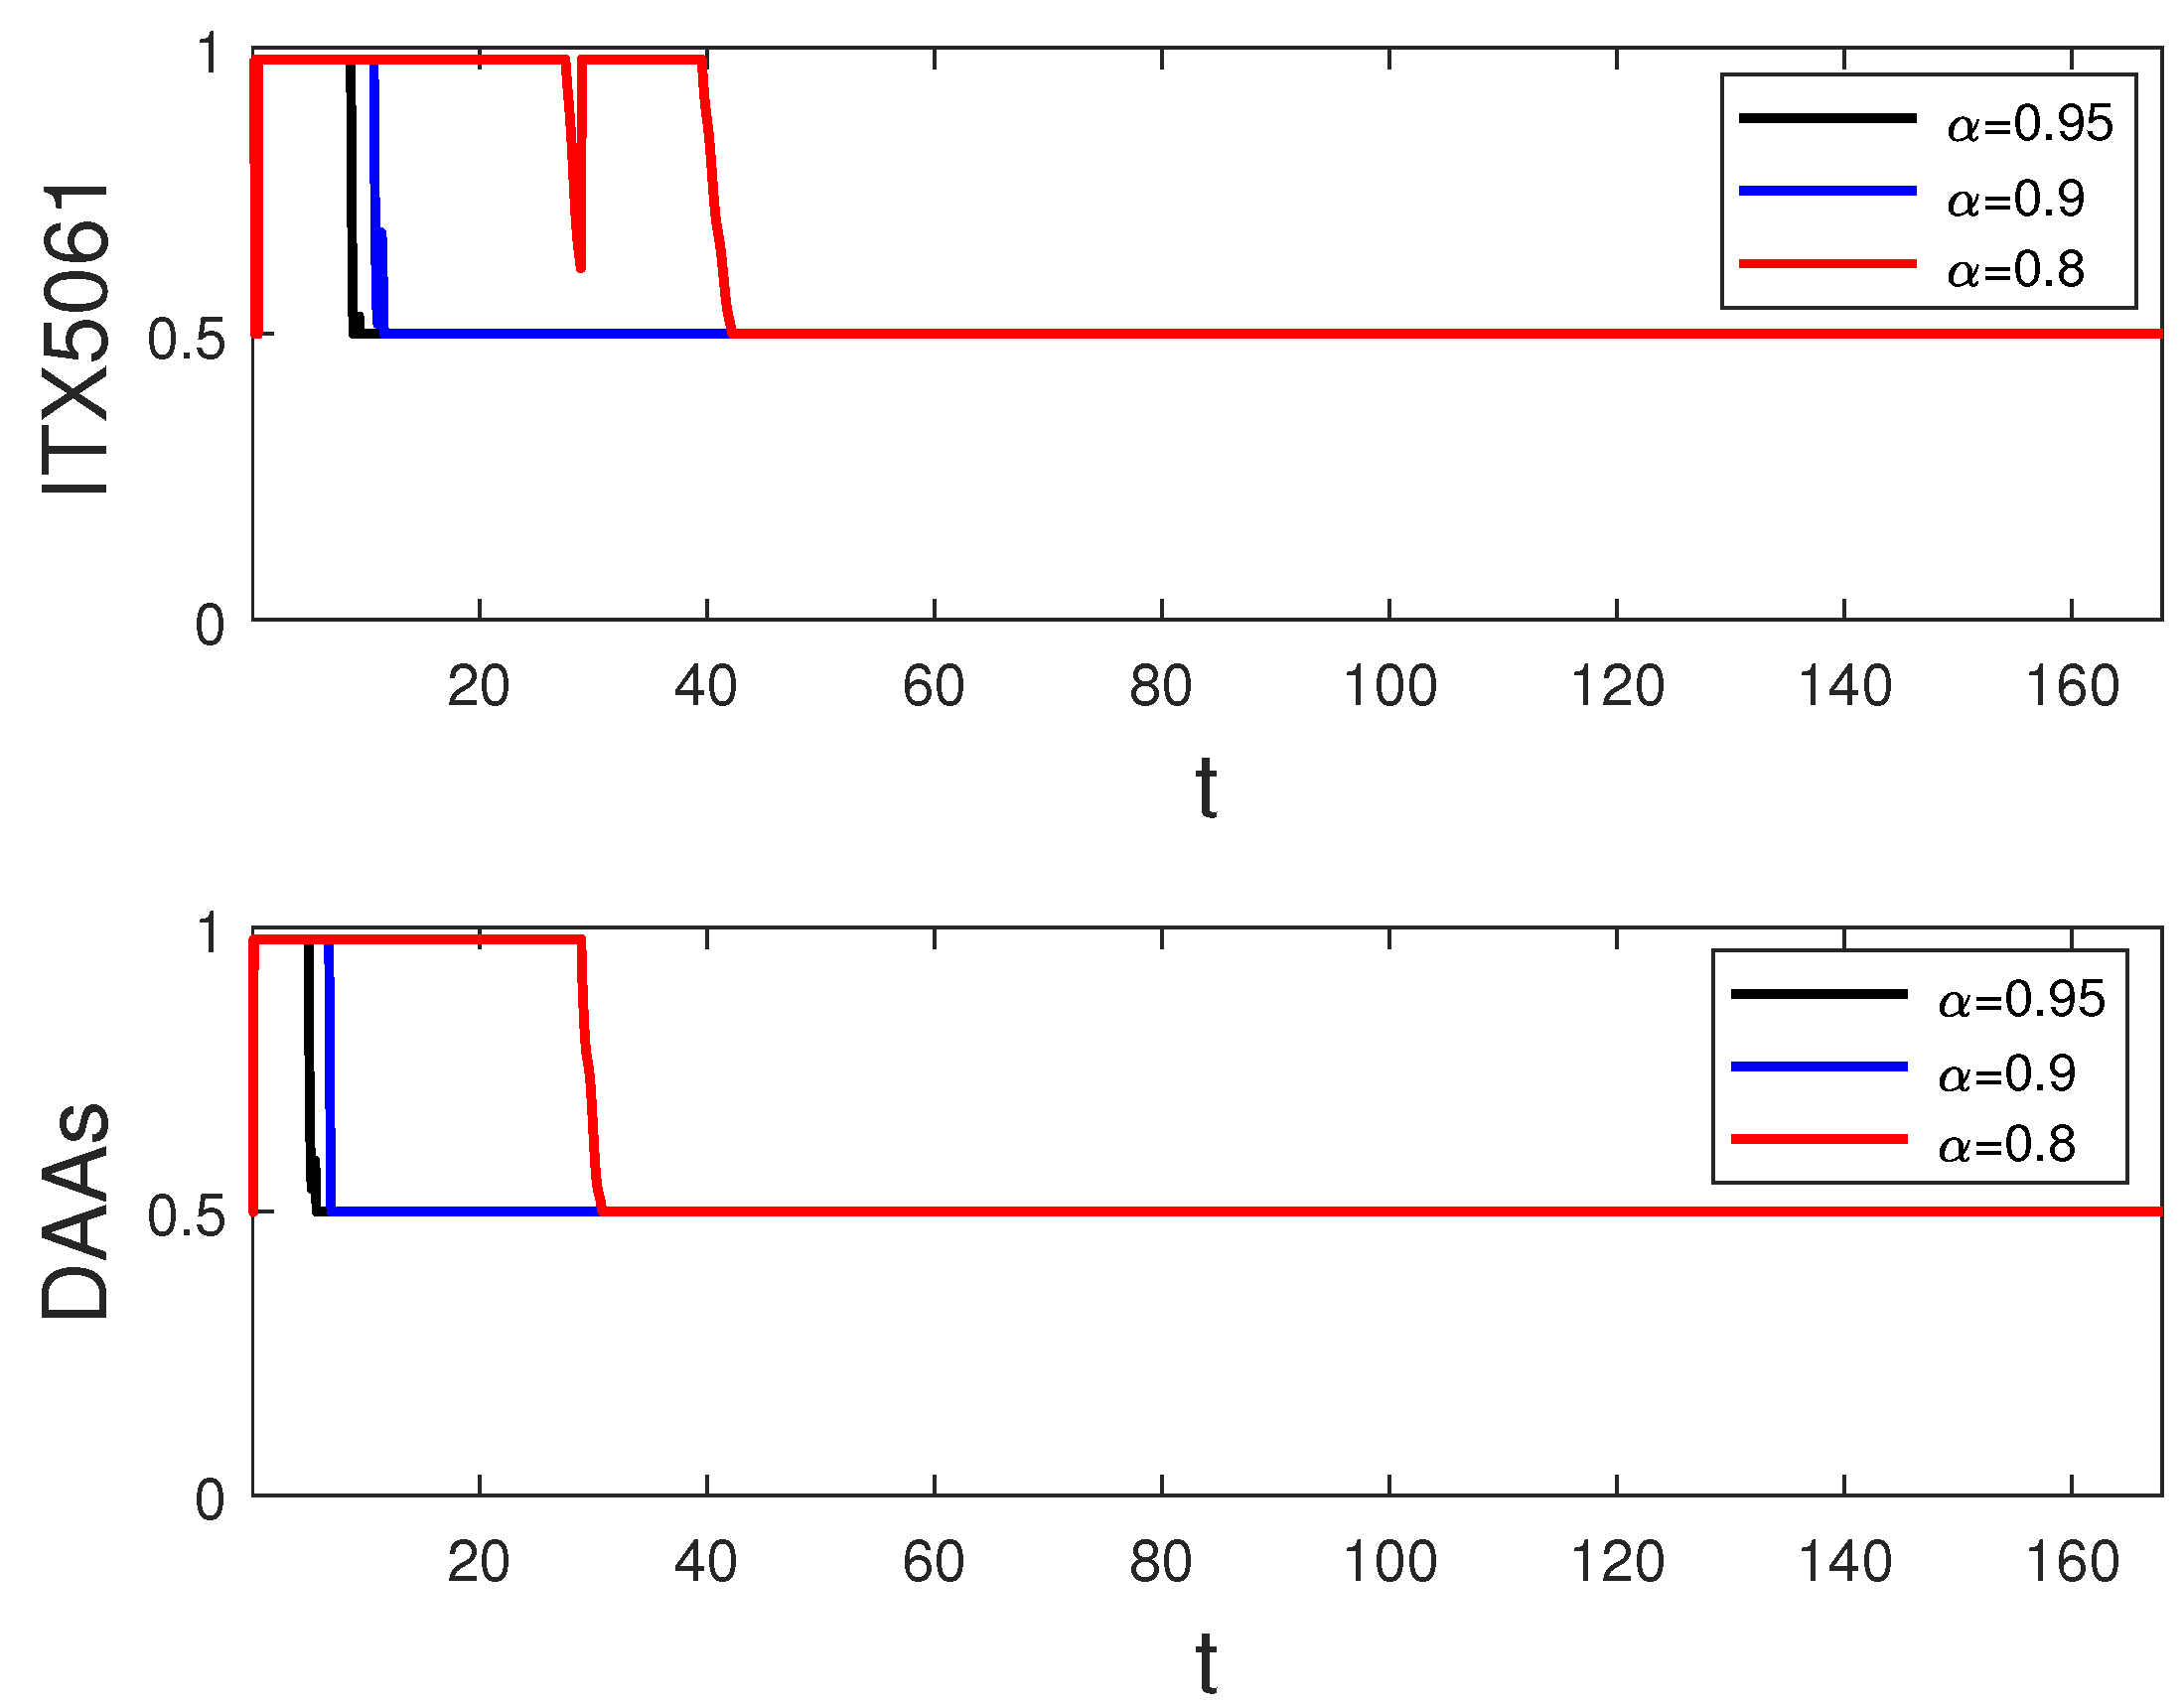
Figure 1 gives the optimal control strategy with different values of α ; we can see that the maximun dosage only should be used at the former stage, and then after a period of time, taking the dosage should be gradually reduced to a minimum. Obviously, the time points of minimum dosage are different with different α .
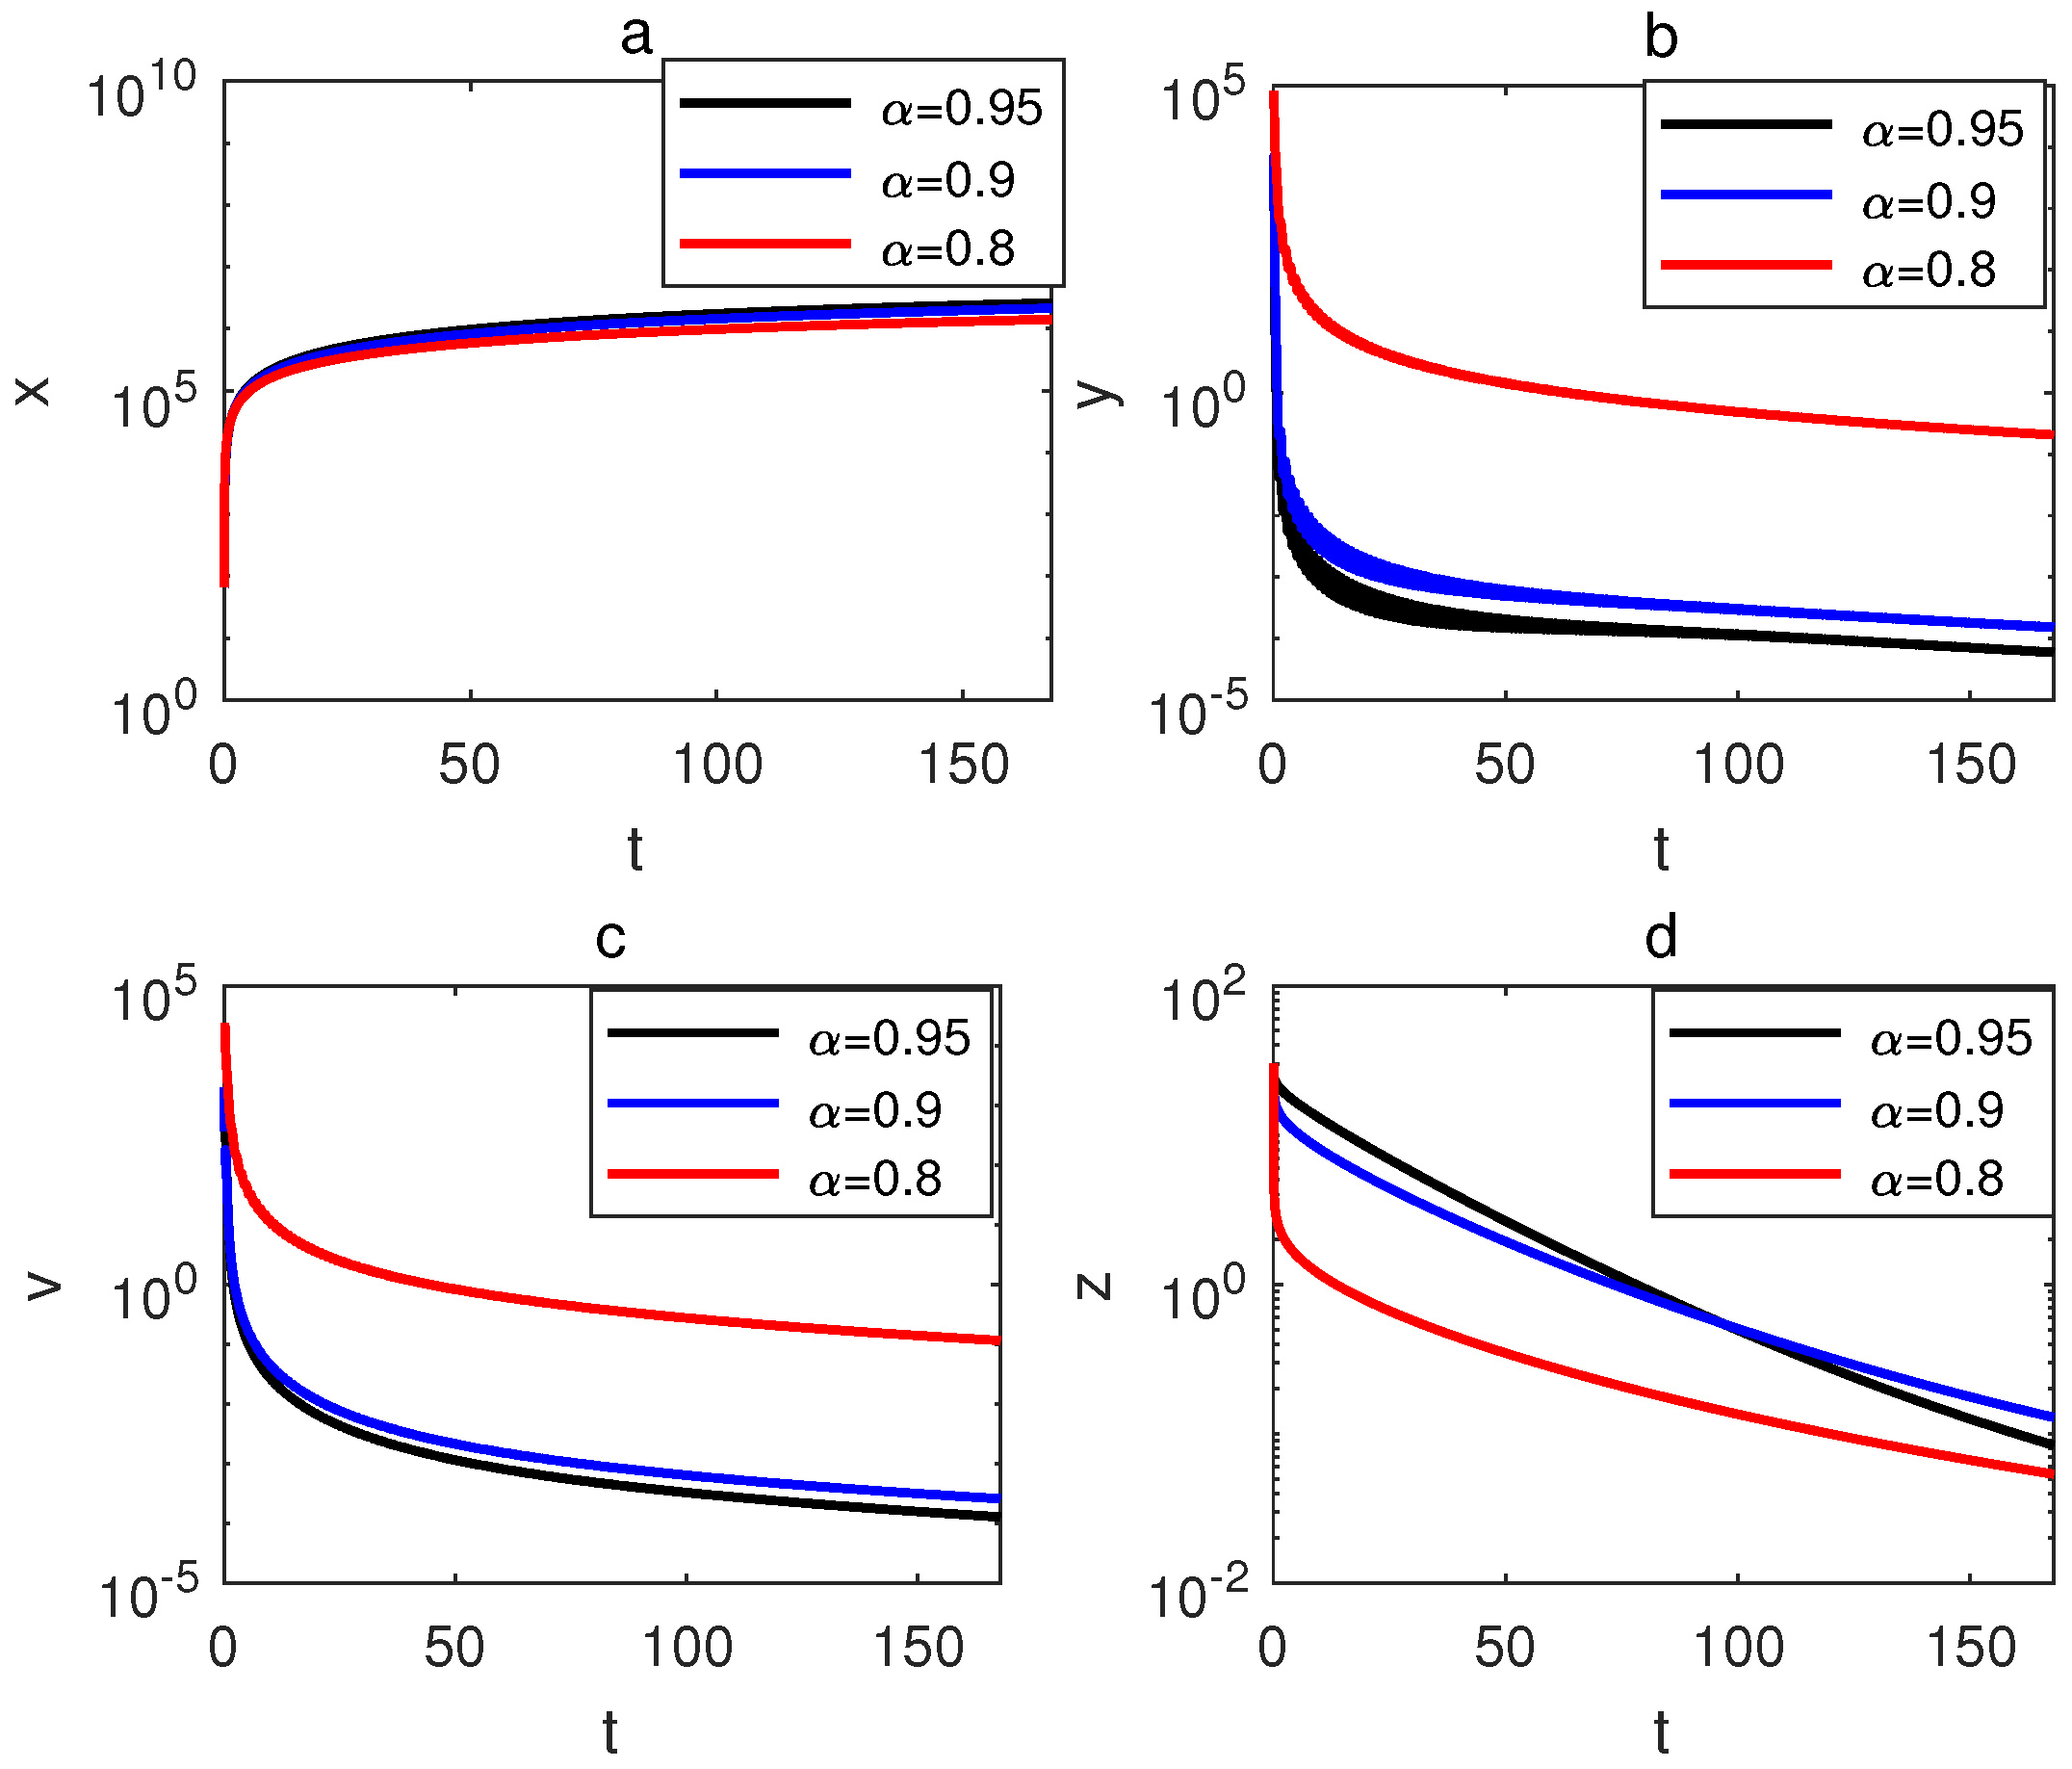
As for the therapy effect, we can see from Figure 2 that with the same initial conditions, the change rates and terminal values of infected hepatocytes, viruses and CTLs vary with α , which reflect individual differences. Therefore, it is worth trying to use fractional order model to describe the treatment of HCV infection.
Table 2 shows the objective functions values of optimal therapy, maximum effect and minimum effect. Obviously, compared with the objective function values of maximum effect and minimum effect, we find that the objective functions values of optimal therapy are lowest for different α values.
  • Strategy B: combination therapy of control (i.e., ϵ 0 and η 0 );
Next, we will present the optimal strategy for combination therapy of ITX5061 and DAAs, which means ϵ 0 , η 0 . The numerical simulation results are shown in Figure 3 and Figure 4.
We can see from Figure 3 that the maximum dose of ITX5061 and DAAs only needs to be used at the former stage. However, the time points of lowering the drug dose are different with different medicine when α is the same. In addition, the time when DAAs reach the lowest point first is related to the value of α , and so is ITX5061.
We also compared the objective function values of constant control ϵ = η = 0.98 and ϵ = η = 0.5 with optimal control. The results are shown in Table 3. We also find from Table 3 that the value of optimal control is lower than maximum effect and minimum effect when α is the same.
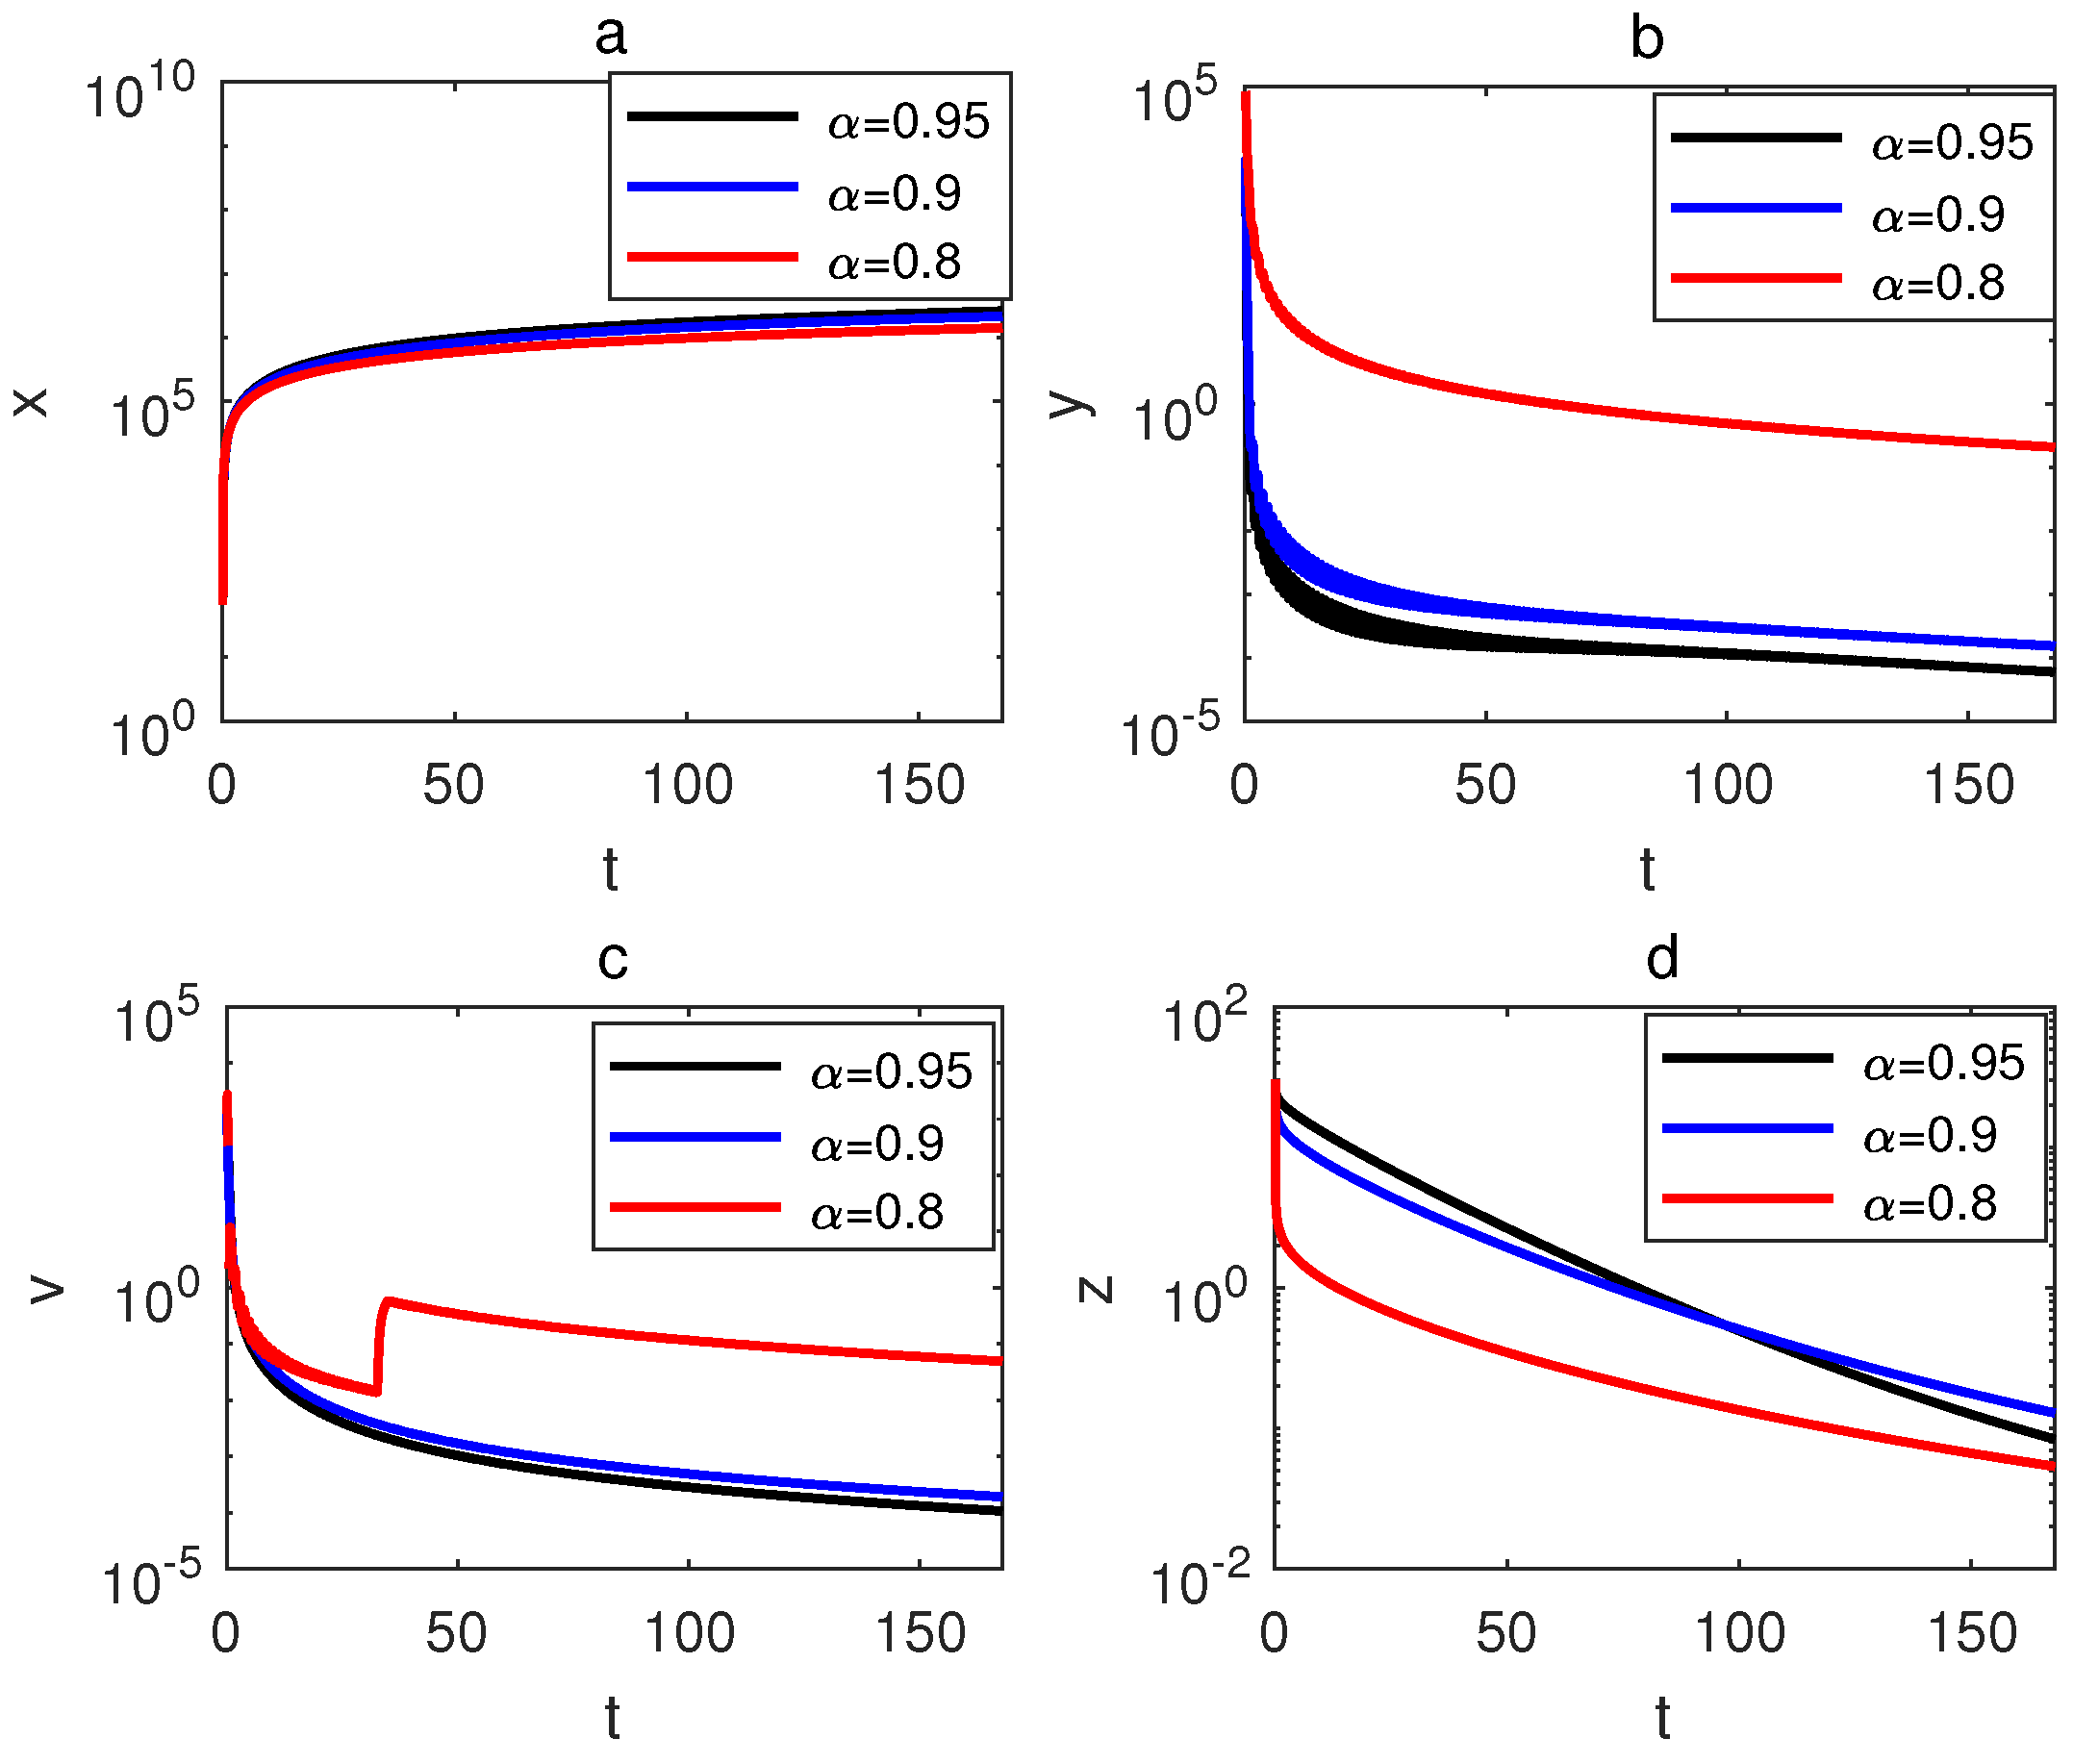
We compare the terminal value of infected cells and viruses between strategy A and B in Table 4 and Table 5. The results show that the terminal values of infected cells and viruses in strategy B are lower than that in strategy A. At the same time, by comparing Table 2 and Table 3, we can see that the objective function values of strategy A are higher than for strategy B. Therefore, the combination of ITX5061 and DAAs is more suitable for treating HCV.
From the simulation of strategy A and strategy B, we can also see that even if the treatment effect can be achieved in the end, the therapy strategy will vary with the order α , which also reflects the clinical personalized differences.

7. Conclusions

In this paper, we discussed a Caputo fractional-order HCV periodic immune response model with saturation incidence, cell-to-cell, and drug control. We proved the existence and uniqueness of positive solutions. We derived two different equilibrium E 0 and E 1 , and two different basic reproductive numbers R 0 and R 1 . And then, we dissused their relations between equilibrium and basic reproductive numbers. The result shows that R 0 > 1 is equivalent to the existence of E 1 . When R 0 < 1 , the equilibrium point E 1 is globally asymptotically stable, and when R 0 > 1 and R 1 < 1 , the immune-exhausted equilibrium is locally asymptotically stable. We condsidered the optimal control problem, and then gave two optimal control strategies. We compared the objective function of two strategies by simulating. The result shows that the combination of two drugs is better than any single drug in treating those infected with HCV. Even if patients take the same dose of drugs, different people will have different curative effects. The order of exactly fractional order can reflect individual differences in clinical treatment. Therefore, it is worth being used to study clinical phenomena.
On the other hand, we give an idealized result based on the assumption that the dosage is proportional to the effect, but unfortunately, we lack clinical experimental data.

Author Contributions

Supervision, Y.S.; Writing—original draft, X.Y.; Writing—review and editing, H.L. and X.Z. All authors have read and agreed to the published version of the manuscript.

Funding

This work is jointly supported by the Fundamental Research Funds for the Central Universities of China, grants 2020XD-A01-2, National Natural Science Foundation of China (71871233) and Beijing Natural Science Foundation (9182015), 2015 National traditional Medicine Clinical Research Base Business Construction Special Topics (JDZX2015299).

Conflicts of Interest

The authors declare no conflict of interest.

References

  1. Rosen, H. Clinical practice. Chronic hepatitis C infection. New Engl. J. Med. 2011, 364, 2429–2438. [Google Scholar] [CrossRef] [PubMed] [Green Version]
  2. World Health Organization WHO. Available online: https://www.who.int/health-topics/hepatitis#tab=tab_1 (accessed on 12 September 2021).
  3. Neumann, A.; Lam, N.; Dahari, H.; Gretch, D.; Wiley, T.; Layden, T.; Perelson, A. Hepatitis C Viral Dynamics in Vivo and the Antiviral Efficacy of Interferon-α Therapy. Science 1998, 282, 103–107. [Google Scholar] [CrossRef] [PubMed]
  4. Dixit, N.; Layden-Almer, J.; Layden, T.; Perelson, A. Modelling how ribavirin improves interferon response rates in hepatitis C virus infection. Nature 2004, 432, 922–924. [Google Scholar] [CrossRef] [PubMed]
  5. Stanislavsky, A. Memory effects and macroscopic manifestation of randomness. Phys. Review. E Stat. Phys. Plasmas Fluids Relat. Interdiscip. Top. 2000, 61, 4752–4759. [Google Scholar] [CrossRef] [Green Version]
  6. Rihan, F.A.; Sheek-Hussein, M.; Tridane, A.; Yafia, R. Dynamics of Hepatitis C Virus Infection: Mathematical Modeling and Parameter Estimation. Math. Model. Nat. Phenom. 2017, 12, 33–47. [Google Scholar] [CrossRef] [Green Version]
  7. Rihan, F.; Arafa, A.; Rakkiyappan, R.; Rajivganthi, C.; Xu, Y. Fractional-order delay differential equations for the dynamics of hepatitis C virus infection with IFN-α treatment. Alex. Eng. J. 2021, 60, 4761–4774. [Google Scholar] [CrossRef]
  8. Boukhouima, A.; Hattaf, K.; Yousfi, N. Dynamics of a Fractional Order HIV Infection Model with Specific Functional Response and Cure Rate. Int. J. Differ. Equ. 2017, 2017, 1–8. [Google Scholar] [CrossRef] [Green Version]
  9. Tamilalagan, P.; Karthiga, S.; Manivannan, P. Dynamics of fractional order HIV infection model with antibody and cytotoxic T-lymphocyte immune responses. J. Comput. Appl. Math. 2021, 382, 113064. [Google Scholar] [CrossRef]
  10. Naik, P.A.; Zu, J.; Owolabi, K.M. Global dynamics of a fractional order model for the transmission of HIV epidemic with optimal control. Chaos Solitons Fractals 2020, 138, 109826. [Google Scholar] [CrossRef]
  11. Khader, M.M. Numerical technique based on the interpolation with Lagrange polynomials to analyze the fractional variable-order mathematical model of the hepatitis C with different types of virus genome. Chaos Solitons Fractals 2021, 152, 111333. [Google Scholar] [CrossRef]
  12. Plauzolles, A.; Lucas, M.; Gaudieri, S. Hepatitis C Virus Adaptation to T-Cell Immune Pressure. Sci. World J. 2013, 2013, 673240. [Google Scholar] [CrossRef] [Green Version]
  13. Nowak, M.; Bangham, C. Population Dynamics of Immune Responses to Persistent Viruses. Science 1996, 272, 74–79. [Google Scholar] [CrossRef] [Green Version]
  14. Wodarz, D. Hepatitis C virus dynamics and pathology: The role of CTL and antibody responses. J. Gen. Virol. 2003, 84, 1743–1750. [Google Scholar] [CrossRef]
  15. Wang, K.; Wang, W.; Liu, X. Viral infection model with periodic lytic immune response. Chaos, Solitons Fractals 2006, 28, 90–99. [Google Scholar] [CrossRef]
  16. Canul-Pech, A.; Avila-Vales, E.; García-Almeida, G. Dynamics of a Viral Infection Logistic Model with Delayed Nonlinear CTL Response and Periodic Immune Response. J. Math. Res. 2016, 8, 78. [Google Scholar] [CrossRef] [Green Version]
  17. Ji, Y.; Min, L.; Zheng, Y.; Su, Y. A viral infection model with periodic immune response and nonlinear CTL response. Math. Comput. Simul. 2010, 80, 2309–2316. [Google Scholar] [CrossRef]
  18. Timpe, J.; Stamataki, Z.; Jennings, A.; Hu, K.; Farquhar, M.; Harris, H.J.; Schwarz, A.; Desombere, I.; Roels, G.; Balfe, P.; et al. Hepatitis C virus cell-cell transmission in hepatoma cells in the presence of neutralizing antibodies. Hepatology 2008, 47, 17–24. [Google Scholar] [CrossRef]
  19. Xiao, F.; Fofana, I.; Heydmann, L.; Barth, H.; Soulier, E.; Habersetzer, F.; Dofföel, M.; Bukh, J.; Patel, A.H.; Zeisel, M.; et al. Hepatitis C Virus Cell-Cell Transmission and Resistance to Direct-Acting Antiviral Agents. PLoS Pathog. 2014, 10, e1004128. [Google Scholar] [CrossRef] [Green Version]
  20. Lai, X.; Zou, X. Modeling cell-to-cell spread of HIV-1 with logistic target cell growth. J. Math. Anal. Appl. 2015, 426, 563–584. [Google Scholar] [CrossRef]
  21. Mojaver, A.; Kheiri, H. Dynamical analysis of a class of hepatitis C virus infection models with application of optimal control. Int. J. Biomath. 2016, 09, 1650038. [Google Scholar] [CrossRef]
  22. Dubey, B.; Dubey, P.; Dubey, U.S. Modeling the intracellular pathogen-immune interaction with cure rate. Commun. Nonlinear Sci. Numer. Simul. 2016, 38, 72–90. [Google Scholar] [CrossRef]
  23. Pan, S.; Chakrabarty, S.P. Threshold dynamics of HCV model with cell-to-cell transmission and a non-cytolytic cure in the presence of humoral immunity. Commun. Nonlinear Sci. Numer. Simul. 2018, 61, 180–197. [Google Scholar] [CrossRef]
  24. Dhar, M.; Samaddar, S.; Bhattacharya, P. Modeling the cell-to-cell transmission dynamics of viral infection under the exposure of non-cytolytic cure. J. Appl. Math. Comput. 2020, 65, 885–911. [Google Scholar] [CrossRef]
  25. Pan, S.; Chakrabarty, S.P. Hopf Bifurcation and Stability Switches Induced by Humoral Immune Delay in Hepatitis C. Indian J. Pure Appl. Math. 2020, 51, 1673–1695. [Google Scholar] [CrossRef]
  26. Badshah, Q.; Nisar, K.S.; ur Rahman, G.; Agarwal, R.P.; Islam, S. Stochastic modeling of within host dynamics of HCV model under therapy. Results Phys. 2021, 22, 103826. [Google Scholar] [CrossRef]
  27. Elaiw, A.M. Global stability of virus dynamics model with immune response, cellular infection and holling type-ii. J. Korean Soc. Ind. Appl. Math. 2019, 39–63. [Google Scholar] [CrossRef]
  28. Yang, L.; Su, Y.; Li, X.; Ye, Y. Analysis and Simulation of a Fractional Order Optimal Control Model for HBV. J. Funct. Spaces Appl. 2020, 2020, 1–14. [Google Scholar] [CrossRef]
  29. Rowe, I.A.; Tully, D.C.; Armstrong, M.J.; Parker, R.; Guo, K.; Barton, D.; Morse, G.D.; Venuto, C.S.; Ogilvie, C.B.; Hedegaard, D.L.; et al. Effect of scavenger receptor class B type I antagonist ITX5061 in patients with hepatitis C virus infection undergoing liver transplantation. Liver Transplant. 2016, 22, 287–297. [Google Scholar] [CrossRef] [Green Version]
  30. Bourliére, M.; Bronowicki, J.P.; de Lédinghen, V.; Hézode, C.; Zoulim, F.; Mathurin, P.; Tran, A.; Larrey, D.; Ratziu, V.; Alric, L.; et al. Ledipasvir-sofosbuvir with or without ribavirin to treat patients with HCV genotype 1 infection and cirrhosis non-responsive to previous protease-inhibitor therapy: A randomised, double-blind, phase 2 trial (SIRIUS). Lancet. Infect. Dis. 2015, 15, 397–404. [Google Scholar] [CrossRef]
  31. Chang, K.C.; Tung, S.Y.; Wei, K.L.; Shen, C.H.; Hsieh, Y.Y.; Chen, W.M.; Chen, Y.H.; Chen, C.H.; Yen, C.W.; Xu, H.W.; et al. Real-world efficacy and safety of pangenotypic direct-acting antivirals against hepatitis C virus infection in Taiwan. Sci. Rep. 2021, 11. [Google Scholar] [CrossRef]
  32. Kilbas, A.; Srivastava, H.; Trujillo, J. Theory and Applications of Fractional Differential Equations; Elsevier Science & Technology: Amsterdam, The Netherlands, 2006. [Google Scholar]
  33. Lin, W. Global existence theory and chaos control of fractional differential equations. J. Math. Anal. Appl. 2007, 332, 709–726. [Google Scholar] [CrossRef] [Green Version]
  34. Diethelm, K. Erratum: The mean value theorems and a Nagumo-type uniqueness theorem for Caputo’s fractional calculus. Fract. Calc. Appl. Anal. 2017, 20, 1567–1570. [Google Scholar] [CrossRef]
  35. Van den Driessche, P.; Watmough, J. Reproduction numbers and sub-threshold endemic equilibria for compartmental models of disease transmission. Math. Biosci. 2002, 180, 29–48. [Google Scholar] [CrossRef]
  36. Çiçek, M.; Yakar, C.; Oğur, B. Stability, Boundedness, and Lagrange Stability of Fractional Differential Equations with Initial Time Difference. Sci. World J. 2014, 2014, 7. [Google Scholar] [CrossRef] [Green Version]
  37. Ahmed, E.; Elgazzar, A. On fractional order differential equations model for nonlocal epidemics. Phys. A Stat. Mech. Its Appl. 2007, 379, 607–614. [Google Scholar] [CrossRef]
  38. Ding, Y.; Wang, Z.; Ye, H. Optimal Control of a Fractional-Order HIV-Immune System With Memory. IEEE Trans. Control Syst. Technol. 2012, 20, 763–769. [Google Scholar] [CrossRef]
  39. Wodarz, D. Mathematical models of immune effector responses to viral infections: Virus control versus the development of pathology. J. Comput. Appl. Math. 2005, 184, 301–319. [Google Scholar] [CrossRef]
  40. Rihan, F.; Velmurugan, G. Dynamics of fractional-order delay differential model for tumor-immune system. Chaos Solitons Fractals 2020, 132, 109592. [Google Scholar] [CrossRef]
  41. Dahari, H.; Lo, A.; Ribeiro, R.M.; Perelson, A.S. Modeling hepatitis C virus dynamics: Liver regeneration and critical drug efficacy. J. Theor. Biol. 2007, 247 2, 371–381. [Google Scholar] [CrossRef] [Green Version]
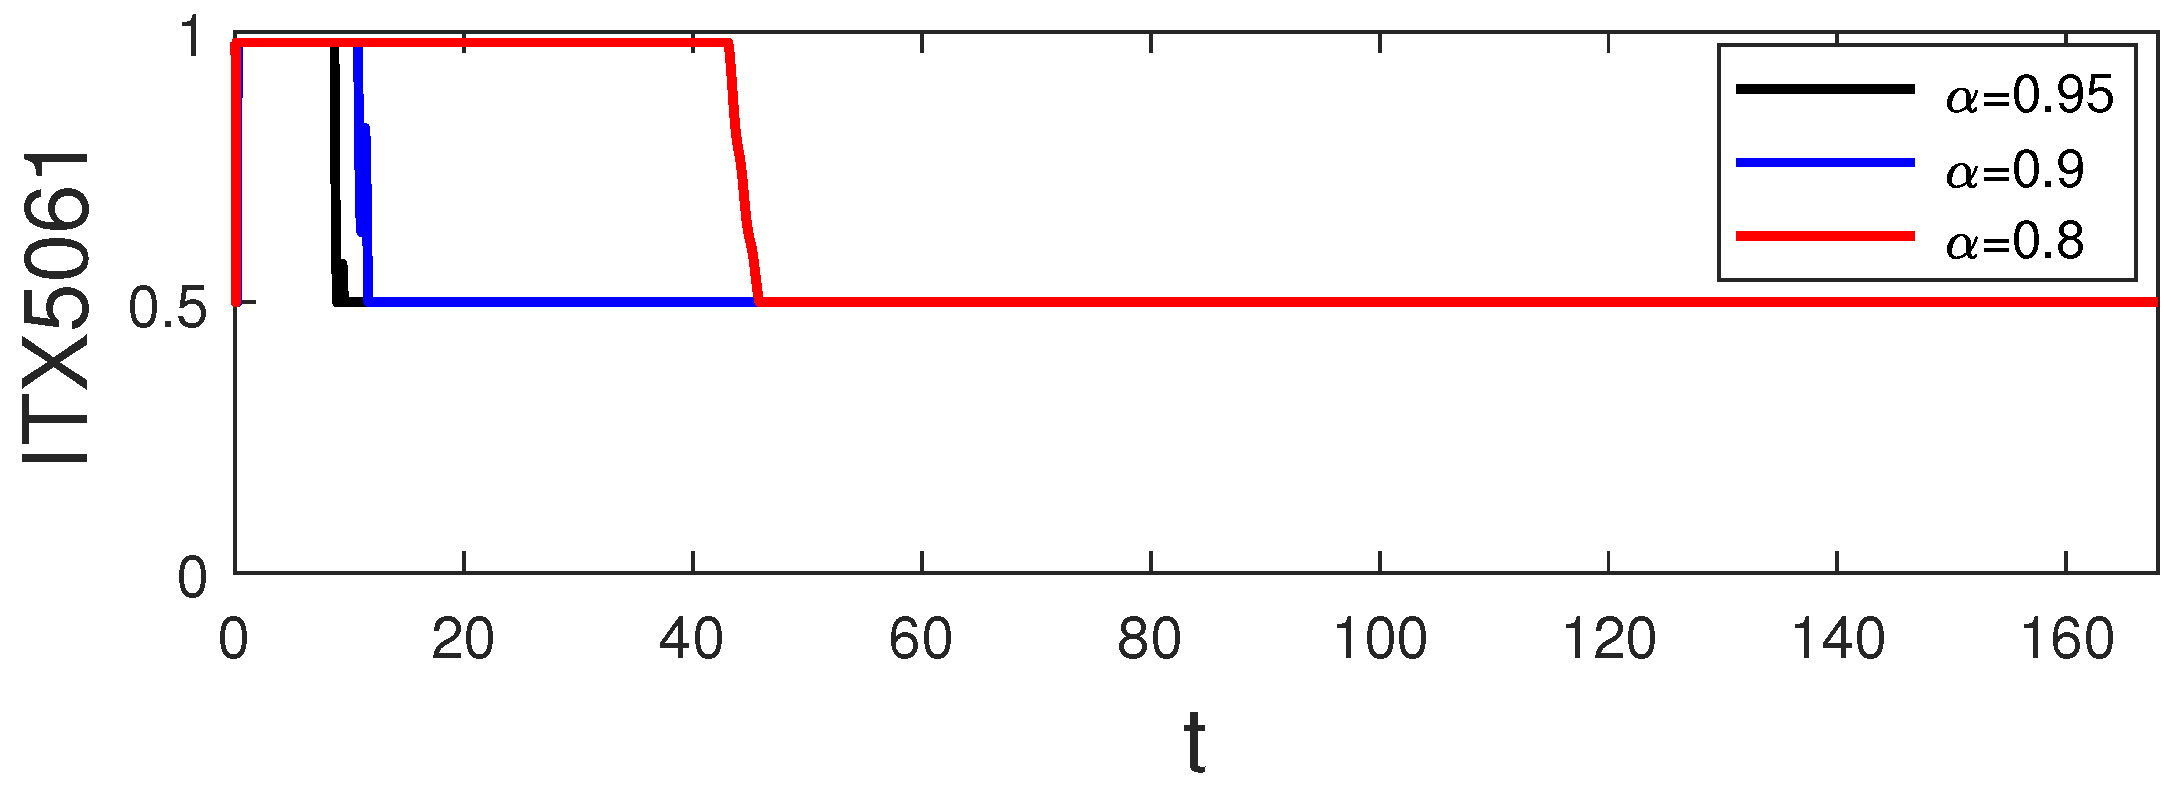
Figure 1. Optimal control Strategy A with ITX5061 with different order.
Symmetry 13 02121 g001
Figure 2. Dynamic route of uninfected hepatocytes, infected hepatocytes, viruses and CTLs under Strategy A. (a) Uninfected hepatocytes, (b) Infected hepatocytes, (c) viruses (d) CTLs.
Symmetry 13 02121 g002
Figure 3. Optimal control Strategy B ( ϵ 0 and η 0 ) with different order.
Symmetry 13 02121 g003
Figure 4. Dynamic route of uninfected hepatocytes, infected hepatocytes, viruses and CTLs under Strategy B. (a) Uninfected hepatocytes, (b) Infected hepatocytes, (c) viruses (d) CTLs.
Symmetry 13 02121 g004
Table 1. The parameter values of the system (3) while simulating.
ParametersDescriptionsValuesSources
λ Source rate of uninfected cell 6.67 × 10 6 × d 1 [28]
β 1 Virus-to-cell infection rate0.01[14,39]
β 2 Cell-to-cell infection rate0.01Proposed
d 1 Death rate of uninfected cell0.003785[40]
aDeath rate of infected cell1[41]
γ Death rate of virus6[41]
rDeath rate of B cell0.045[28]
kProduction rate of virus2.9[41]
qDevelopment rate of B cell 0.95 × 10 7 [28]
m 0 Basic strength of the lytic component1[17]
m 1 degree of oscillation of immune system0.5[17]
TPeriod of oscillation of human immune system1[17]
φ acrophase π / 12 [17]
Table 2. The objective function values of Strategy A, maximum effect and minimum effect, with different α .
α Optimal ControlMaximum EffectMinimum Effect
α = 0.95 42.9925123.187243.0139
α = 0.9 32.9840113.167732.9990
α = 0.8 5.8076 × 10 5 5.8159 × 10 5 5.8168 × 10 5
Table 3. The objective function values of Strategy B, maximum effect and minimum effect with different α .
α Optimal ControlMaximum EffectMinimum Effect
α = 0.95 37.0631115.001442.1320
α = 0.9 16.910894.779330.7539
α = 0.8 3.8144 × 10 5 3.8168 × 10 5 5.4375 × 10 5
Table 4. Compare the terminal values of infected cells between strategy A and strategy B.
α Strategy AStrategy B
α = 0.95 5.9517  × 10 5 5.9513  × 10 5
α = 0.9 1.5242  × 10 4 1.5206  × 10 4
α = 0.8 0.20640.2062
Table 5. Compare the terminal values of viruses between strategy A and strategy B.
α Strategy AStrategy B
α = 0.95 1.2798  × 10 4 1.0766  × 10 4
α = 0.9 2.5854  × 10 4 1.9272  × 10 4
α = 0.8 0.11530.0495
Publisher’s Note: MDPI stays neutral with regard to jurisdictional claims in published maps and institutional affiliations.