1. Introduction
Tunnel engineering, a branch of underground engineering, generally has randomness and uncertainty in its surroundings. Up to now, there are still significant challenges in accurately assessing the bearing state and safety characteristics of tunnel lining structure, such as accurately determining the actual stress state and the characteristics and process of structural failure.
For in-service tunnels in various service conditions (e.g., service environment, service life, grade, structural type, design load, and maintenance mode), researchers have analyzed the key factors influencing structural service state and evaluated the technical state of lining structure (health state) based on maintenance detected data. However, most studies have mainly focused on qualitative discussions on characteristics such as safety characteristics [
1,
2].
For the mechanical properties of in-service tunnels, most existing studies have concentrated on analyzing the development process and change features of stress, deformation, and failure of the tunnel structure under defect conditions. That means, the existing studies mainly have focused on the evolution process, displacement properties, failure mode, internal force analysis, and variation laws of the tunnel-lining safety factor under defect conditions. Some studies have only focused on the mechanical characteristics and damage evolution law of surrounding rock and lining, lacking the corresponding analysis of the bearing capacity.
The bearing capacity of tunnel lining structure is decided by multiple complex conditions, such as the grade of the surrounding rock, ground stress field, structure category, defects, stress state (e.g., tensile stress, compressive stress, shear stress, and different stress combinations). The keywords directly related to bearing capacity in the literature are: bearing performance, bearing characteristics, bearing capacity, bearing safety factor of lining, and ultimate bearing capacity.
A number of studies have been reported in the literature to analyze the evolution of tunnel bearing performance under defect conditions (e.g., corrosion of circumferential bolts in shield tunnels [
3]) or reinforcement conditions (e.g., reinforcement of metro shield tunnel by bonding steel plate [
4]), in which the tunnel bearing performance is described by the mechanical behavior, deformation characteristics, and failure mode of the tunnel lining structure. Analysis methods (i.e., calculation methods of tunnel bearing capacity) mostly rely on numerical models such as finite element models (three-dimensional solid fine finite element models or finite element models with variable material physical and mechanical parameters) reflecting the various characteristics of factors. Some studies are combined with engineering examples and verified by full-scale or similar model tests; the others are combined with detected data to evaluate the bearing capacity of the existing tunnel structure through finite element numerical simulation.
According to New Austrian Tunnelling Method, the tunnel structure includes surrounding rock and lining support structure, and the surrounding rock is the main supporting structure. Mechanical loads including extrusion force, action of confined water, and expansion force of rock and soil are applied on the tunnel structure by rock and soil around the tunnel structure under various working conditions. For in-service tunnels with lining structure, the structural state (e.g., the structural bearing capacity in this study) is mostly reflected in the working state (i.e., damage state) of the lining. Meanwhile, most of the existing studies on the bearing capacity of the tunnel structures are presented based on the lining structure state, and some data and achievements have been preliminarily accumulated. Some researchers simply studied the bearing capacity of lining structure under defect conditions and regarded the bearing capacity of lining structure as that of the tunnel structure. Though the function of surrounding rock was considered according to tunnel engineering analysis methods (e.g., stratum structure method) in these studies, the cooperative bearing capacity between the surrounding rock and lining structure was not incorporated into these studies. A lack of research on the physical mechanisms of cooperative bearing between the surrounding rock and lining structure and considering the current research basis and engineering requirements, therefore, the bearing capacity evolution of the tunnel structure is preliminarily obtained according to the bearing state evolution of lining structure in this study. Moreover, the subsequent study on the bearing capacity of the tunnel structure will be carried out from the view of cooperative bearing between the surrounding rock and lining structure.
The bearing capacity of the tunnel structure is the essential basis for the structural safety of tunnel engineering. As mentioned above, a systematic study on the bearing capacity of the tunnel structure is still lacking due to the randomness and uncertainty in the surrounding environment of the tunnel. The conceptual model, physical mechanism, characterization factor, and action path of the bearing capacity of the tunnel structure are unclear, and the analysis of the bearing capacity is preliminary, in existing studies, on the mechanical behavior of the tunnel structure. The analysis and research system of the bearing capacity of the tunnel structure is defined and proposed in this study. The analysis framework of the bearing capacity is established using relative change value of the bearing capacity, and the framework is combined with relevant mechanical data of the tunnel structure to preliminarily study loss laws of the bearing capacity of the tunnel structure under different characteristic factors, and mainly analyze the key points of bearing capacity research. The abovementioned work will accumulate experience for future related research.
2. Influencing Factors
It is noted that the structural performance indexes of in-service tunnels have experienced a considerable extent change subjected to various defect factors, which is the main difference between in-service tunnels and the new tunnels. Therefore, the analysis of the bearing capacity of the in-service tunnel structure should consider the current actual situation of the tunnels. Influencing factors will lead to internal force or stress redistribution of the tunnel structure, which has an important impact on the bearing performance of structures/members. For example, the distribution characteristics of defects (e.g., cracks) reflect the stress distribution and stiffness loss of the structure/members, resulting in a decrease in the bearing performance of the overall structure or local structural failure/instability. In the structural analysis and calculation, the influence of existing defects should be incorporated into structural analysis models, and this needs a classification and description method of factors. The main description methods of tunnel defects include methods based on defect visibility, defect apparent characteristics, defect location attributes, structural health state, and defect causes.
As given in
Table 1, to study the loss laws of the bearing capacity of the tunnel structure under the technical conditions of lining damage and considering the quantitative characterization of factors, on-site detection methods, and influence paths, influencing factors are attributed to external load action and material deterioration (decrease in section strength).
The external load action covers all external factors leading to the insufficient bearing capacity of the lining structure and mainly refers to the pressure action generated by surrounding rock including loose pressure, topographic or geological bias, formation landslide, and expansive geotechnical pressure. In addition, the cavity behind the lining also belongs to the external load action.
Material deterioration, which covers all internal causes leading to insufficient bearing capacity of lining structure, mainly contains a decrease in lining concrete strength, corrosion of lining reinforcement, lining delamination and peeling, and insufficient lining thickness. It is noted that lining thickness is a typical criterion for assessing material deterioration. For instance, a decrease in lining concrete strength can be assessed according to the effective lining thickness.
3. Theoretical Analysis
3.1. Relative Loss Rate of Bearing Capacity
In studies on the bearing capacity of tunnel lining structure reported in the literature, ultimate bearing capacity, failure load, safety factor of dangerous section, bearing safety factor, peak load of defective lining, initial cracking load, tunnel quality, and bending stiffness are employed to characterize the bearing capacity [
5,
6,
7,
8,
9,
10,
11,
12,
13,
14,
15,
16,
17]. Moreover, adopted methods, calculation models, related theories, structural forms, and criteria for judgment are different when calculating the bearing capacity of tunnel lining structure in the literature.
To comprehensively consider the differences among the above studies, the relative loss rate of the bearing capacity of tunnel lining structure,
DR, is defined as the following form:
where
Q0 is the bearing capacity of relatively complete tunnel lining structure, and
Qi is the bearing capacity of tunnel lining structure under various working conditions (technical status). The concept focuses on the relative loss value of the bearing capacity under defect conditions, emphasizing that the loss is caused by the characteristics of defects/diseases concerned, and does not pay attention to what the so-called “relative integrity (complete)” in the concept specifically refers to. That is, it is only required to be “complete” relative to defects, and the research only focuses on the impact of defects on the bearing capacity. Specifically, in this study, we do not pay attention to the specific values of
Q0 and
Qi in Equation (1), but only pay attention to the loss of
DR (relative to 100%). Meanwhile, owing to the complexity of the tunnel structure, the specific values of
Q0 and
Qi are difficult to be clearly expressed and accurately obtained at present. For different objects of
Q0 and
Qi (such as vertical load, inclined load, and other different forms of load-bearing environment), the
DR may only be the relative loss rate corresponding to a certain load-bearing environment. However, from the perspective of design safety reserve and structural operation safety, regardless of the load environment, the action path on relative concepts is comparable for the influence of the concerning factors (function law).
3.2. Relative Value of Defect Indexes
In actual engineering, it is necessary to conduct an on-site inspection for defects of lining structure, analyze the defect mode and size, and describe the defect characteristics (obtain the related indexes). Structural indexes of tunnel lining such as lining thickness and span are different in actual engineering. Following the method defining the loss rate of the bearing capacity, relative value is used to describe the characteristic indexes of defects. Curved wall arched symmetric tunnel structure (a structural type) is the primary research object in this study.
Defect degree indexes of lining (e.g., crack depth and degree of insufficient thickness) are defined as loss degree relative to the integrity (e.g., lining thickness, tensile strength, and elastic modulus). For example, the thinning ratio is loss degree of lining thickness [
13]. Loss degree,
δ, and thinning ratio, Γ, are defined as follows:
where
ξ0 is the relatively complete value of the index (e.g., thickness
h0), and
ξi is the actual value of the index under various working conditions (e.g., thickness
hi).
The defect location index can be the horizontal distance from the arch crown, and the value can be expressed by the value of lining span, d. In addition, the defect location indexes can also be the relative location of lining structure signs such as the arch crown, spandrel, and side wall, and the indexes can be quantified by the included angle between springing line and location.
The range indexes (circumferential direction) can be represented by the angle centered on the structure sign locations such as arch crown and spandrel.
3.3. Analytical Method
By comparing bearing characteristics of relatively complete structure and structure under various working conditions, sensitivity of the bearing capacity of lining structure to defect indexes (factors) is analyzed. For example, the sensitive locations of bearing capacity loss can be found after studying location indexes of lining structure under defect conditions. According to the inspection results, the bearing capacity of the tunnel structure under current working conditions can be assessed using corresponding methods.
Firstly, the loss rate of the bearing capacity of the tunnel lining structure can be obtained with changes in a single defect index following the single index method. Then, the loss rate of the bearing capacity under multiple complex conditions can be obtained based on the results of the single defect index. This study focuses on relative loss rate with changes in a single defect index. For example, the bearing capacity of the lining structure with a single crack is analyzed. After that, the bearing capacity of the lining structure with various combinations of multiple defects is preliminary predicted.
According to the quantitative analysis results (numerical results, model results, monitoring, and measurement results) on the stress characteristics of lining structure presented in the existing literature, relative loss rate of the bearing capacity is counted using the proposed analytical method. As shown in
Table 2,
Table 3 and
Table 4, three factors including crack, insufficient lining thickness, and cavity are selected to preliminarily analyze and interpret.
4. Discussion
Based on the above analysis, definition, and simple statistics of the analysis data on mechanical properties of tunnel structures, taking three factors including cracks, insufficient lining thickness, and cavity as examples, loss laws of the bearing capacity with changes in certain factors are preliminarily discussed, and the analysis methods of the bearing capacity of tunnel structures are interpreted.
4.1. Overall Trend Analysis and Linear Model
The test data of relative loss rate of the bearing capacity under defect conditions are shown in
Figure 1,
Figure 2,
Figure 3 and
Figure 4 (The figures are separately placed in the following section together with the corresponding specific description). The relationship between defect indexes and the relative loss rate of the bearing capacity is obtained according to the change trends in
Figure 1,
Figure 2,
Figure 3 and
Figure 4. Data laws are not completely consistent, and there are some differences in the change trends obtained by different researchers. Even if the change trends are the same, the amplitude of relative loss rate with changes in the same factor is different, as well as the change rates. On the one hand, this may be related to the definition of relative loss rate of the bearing capacity and its first-order value used in the statistical comparison (higher-order or other more complex expressions of the relative loss rate of the bearing capacity may cover more factors and the laws are more obvious). On the other hand, this may also be related to analysis methods, calculation processes, judgment methods (i.e., criteria) for the bearing capacity. Thus, further research about this topic is necessary.
In general, the simplest linear model can be employed to describe the relationship between defect indexes and the relative loss rate of the bearing capacity. Due to the description form of the factors, the zero point of the factor exactly corresponds to that of the relative loss rate, which means the model passes through the original point (i.e., complete bearing capacity state) in the figure. The following form of the linear model is adopted:
where
fi is a certain defect factor, and
λi is the slope of the linear model corresponding to a certain factor. The approximate linear models corresponding to different factors are given in
Figure 1,
Figure 2 and
Figure 3. Similar conclusions were summarized by other researchers, and most of the related studies were conducted by numerical simulation.
4.2. Logistic Growth Model
In practice, the observation and analysis of the loss effect of defect factors on the bearing capacity show that, under a certain defect condition, the bearing capacity loss is first slow, and then the loss accelerates after reaching a certain degree (i.e., accelerated lesion stage), the loss slows down again when approaching the ultimate bearing capacity. That means the loss laws follow the variation laws of the S-shaped curve. Variation laws of test data in
Figure 1 and
Figure 2 show that the changes in the relative loss rate of the bearing capacity follow an S-shaped curve, especially the relative loss rate of the bearing capacity expressed by the failure load in the model tests under defect conditions. The S-shaped curve model can better describe the variation laws of the relative loss rate of the bearing capacity under the abovementioned defect conditions.
The logistic growth model accurately describes the growth laws of the population by considering the environmental carrying capacity (maximum carrying capacity) and change rates, and reflects the processes of occurrence, development, and reaching the limit (maturity or saturation) of things (population). The logistic growth model is used to describe plant population diseases in ecology, describe population growth in demography, and predict foundation settlements in civil engineering [
15]. In recent years, some researchers have tried to use the logistic growth model to describe the loss laws of the bearing capacity of the tunnel lining structure.
The logistic growth model is employed to describe the relationship between defect indexes and relative loss rate of the bearing capacity, which can be expressed as follows [
14]:
where
fi is a certain defect factor,
Di is the maximum relative loss rate of the bearing capacity under a certain defect condition (e.g., 100% representing a complete loss in extreme cases and a specific value representing limit loss corresponding to a single factor), and parameters (
ki and
si) reflects the change rates of the relative loss rate of the bearing capacity under a certain defect condition.
4.3. Loss Laws Analysis of Factor Model
4.3.1. Crack depth factor
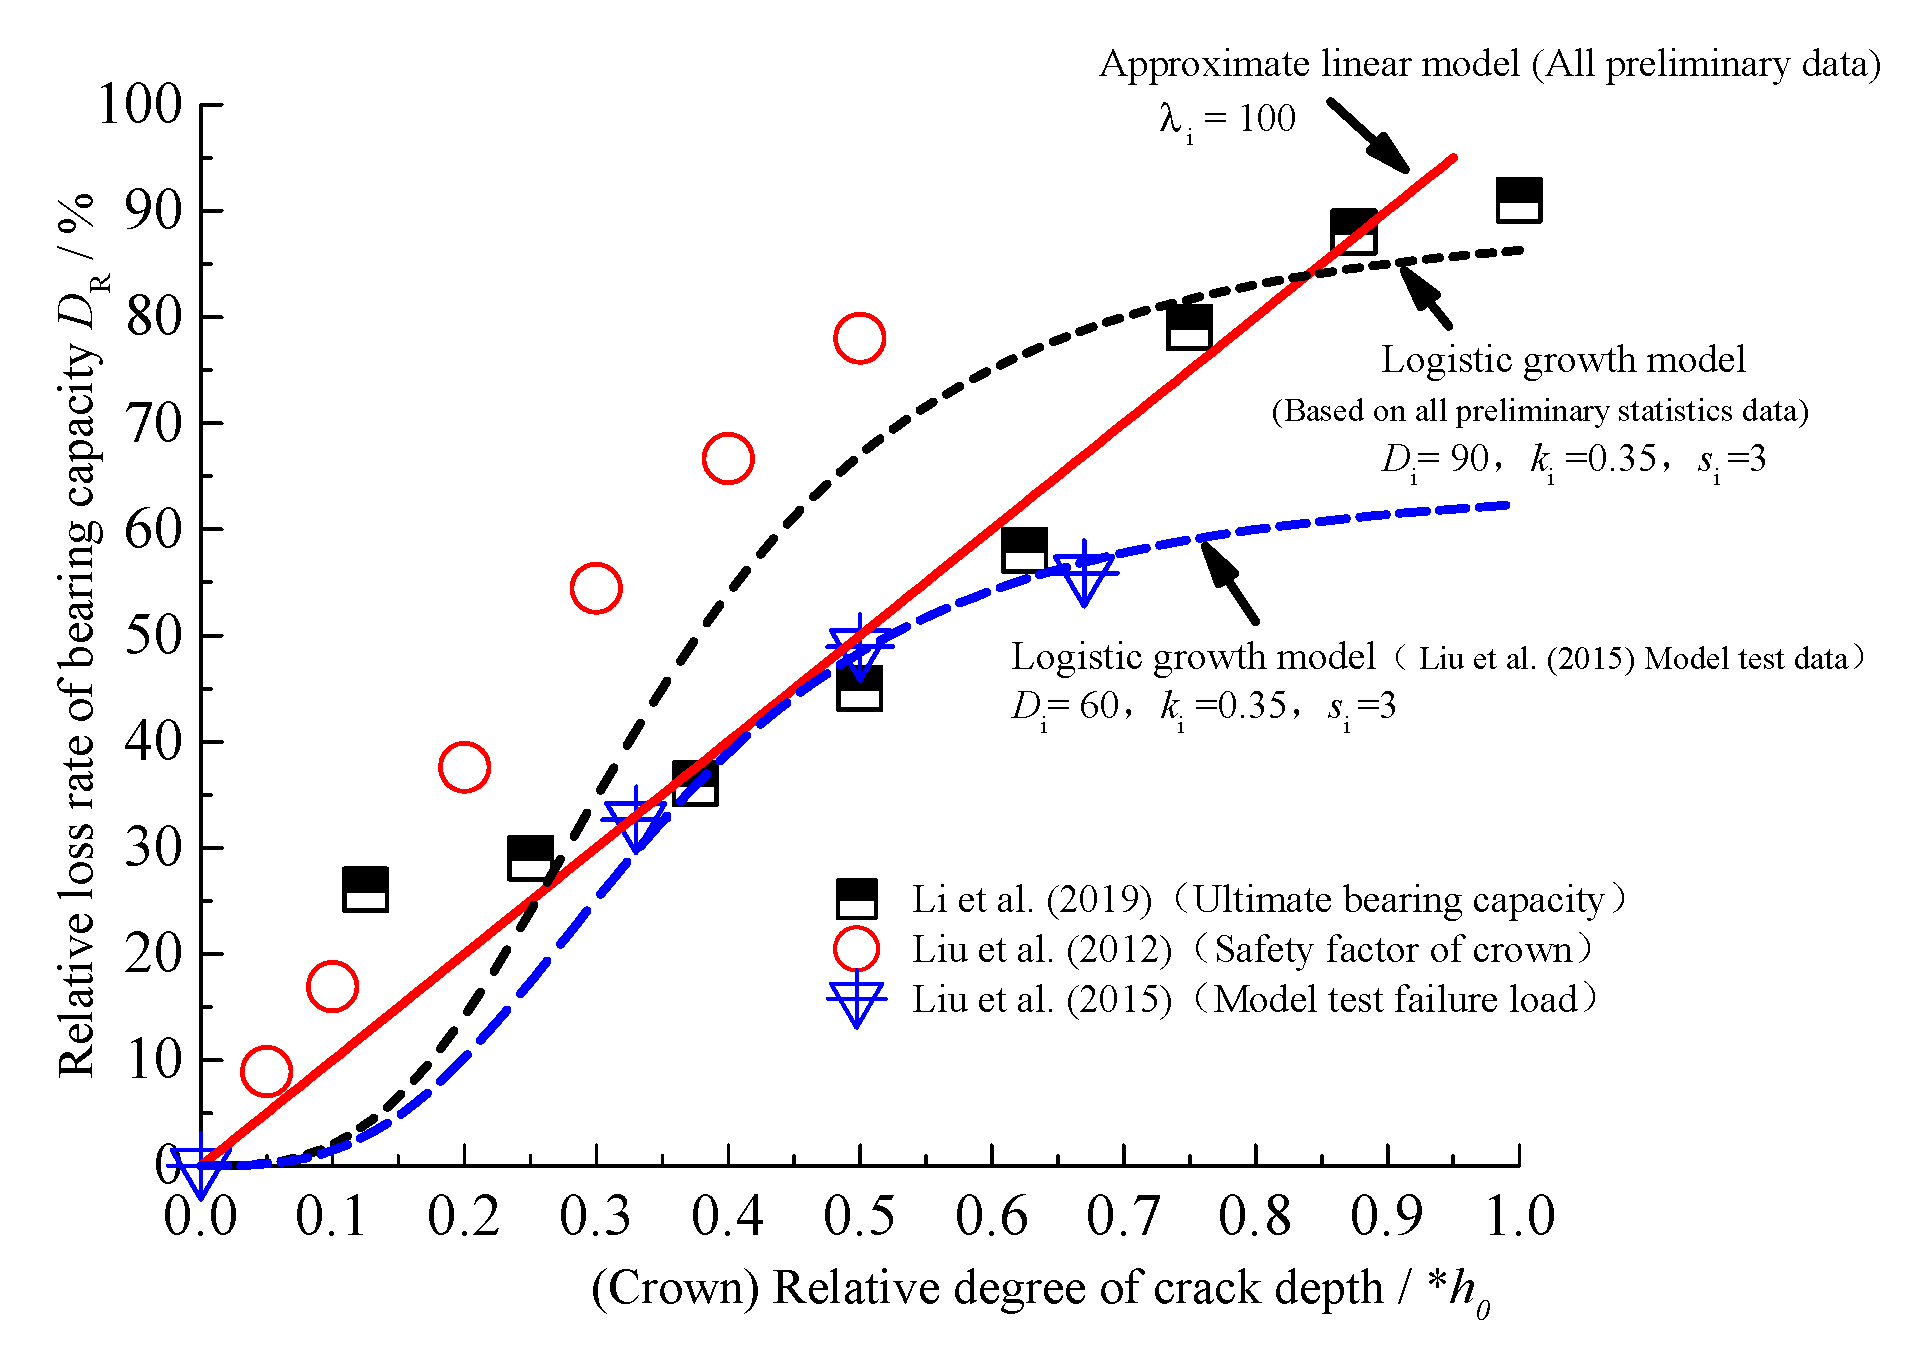
As shown in
Figure 1, the logistic growth model is selected to fit the data of relative loss rate of the bearing capacity, which is characterized by failure load and bending stiffness reported in model tests of Liu Xuezeng (2015). Moreover, an approximate linear model fitted on all statistical data is also given in
Figure 1. From the preliminary fitting results, the accuracy of the model is closely related to the variation range of working conditions (described by the bearing capacity index
Di in the model) involved in the tests. In the follow-up study on a single defect index, all possible working conditions in practice should be considered to appropriately select the models.
4.3.2. Insufficient Thickness Factor
The relationship between the relative degree of insufficient thickness at the arch crown and the relative loss rate of the bearing capacity is given in
Figure 2a. The logistic growth model is used to fit the similar model test results reported by Li Ming (2011), and variation laws of the bearing capacity and division of loss stage are consistent between model results and test results. In addition, an approximate linear model fitted on all numerical data at the arch crown is shown in
Figure 2a. In
Figure 2b, an approximate linear model is also selected to describe the relationship between the relative degree of insufficient overall thickness and the relative loss rate of the bearing capacity.
In
Figure 2, the loss data of the bearing capacity from numerical simulation results of different researchers show a linear variation trend in general. However, the slopes of linear models vary greatly because of the approximation of the surrounding rock and lining structure system and the characterization of the bearing capacity in the numerical simulation. Variation laws of the safety factor are generally used to describe the bearing capacity of lining structure in the calculation, which means the safety factor is the bearing capacity, whereas this method is inappropriate under certain conditions. For example, the distributed bending moment of local parts decreases because of the decrease in local stiffness (internal force redistribution caused by structural member damage), which is more significant than the decrease in ultimate bending capacity. This behavior will lead to increased safety factor in calculation, while the bearing capacity of the overall structure will decrease in practice.
The parameters of the logistic growth model for insufficient thickness at the arch crown in
Figure 2a and crack depth at the arch crown in
Figure 1 are consistent, which means the loss laws of the bearing capacity due to crack depth and insufficient thickness at the arch crown are similar. The bearing capacity control section generally appears in the arch crown when the overall thickness is insufficient, which results in the linear models for insufficient overall thickness (
Figure 2b), insufficient thickness at the arch crown (
Figure 2a), and crack depth at the arch crown (
Figure 1) being similar. The similarities of the above variation laws originate from the ratio of relatively complete thickness used in the factor description.
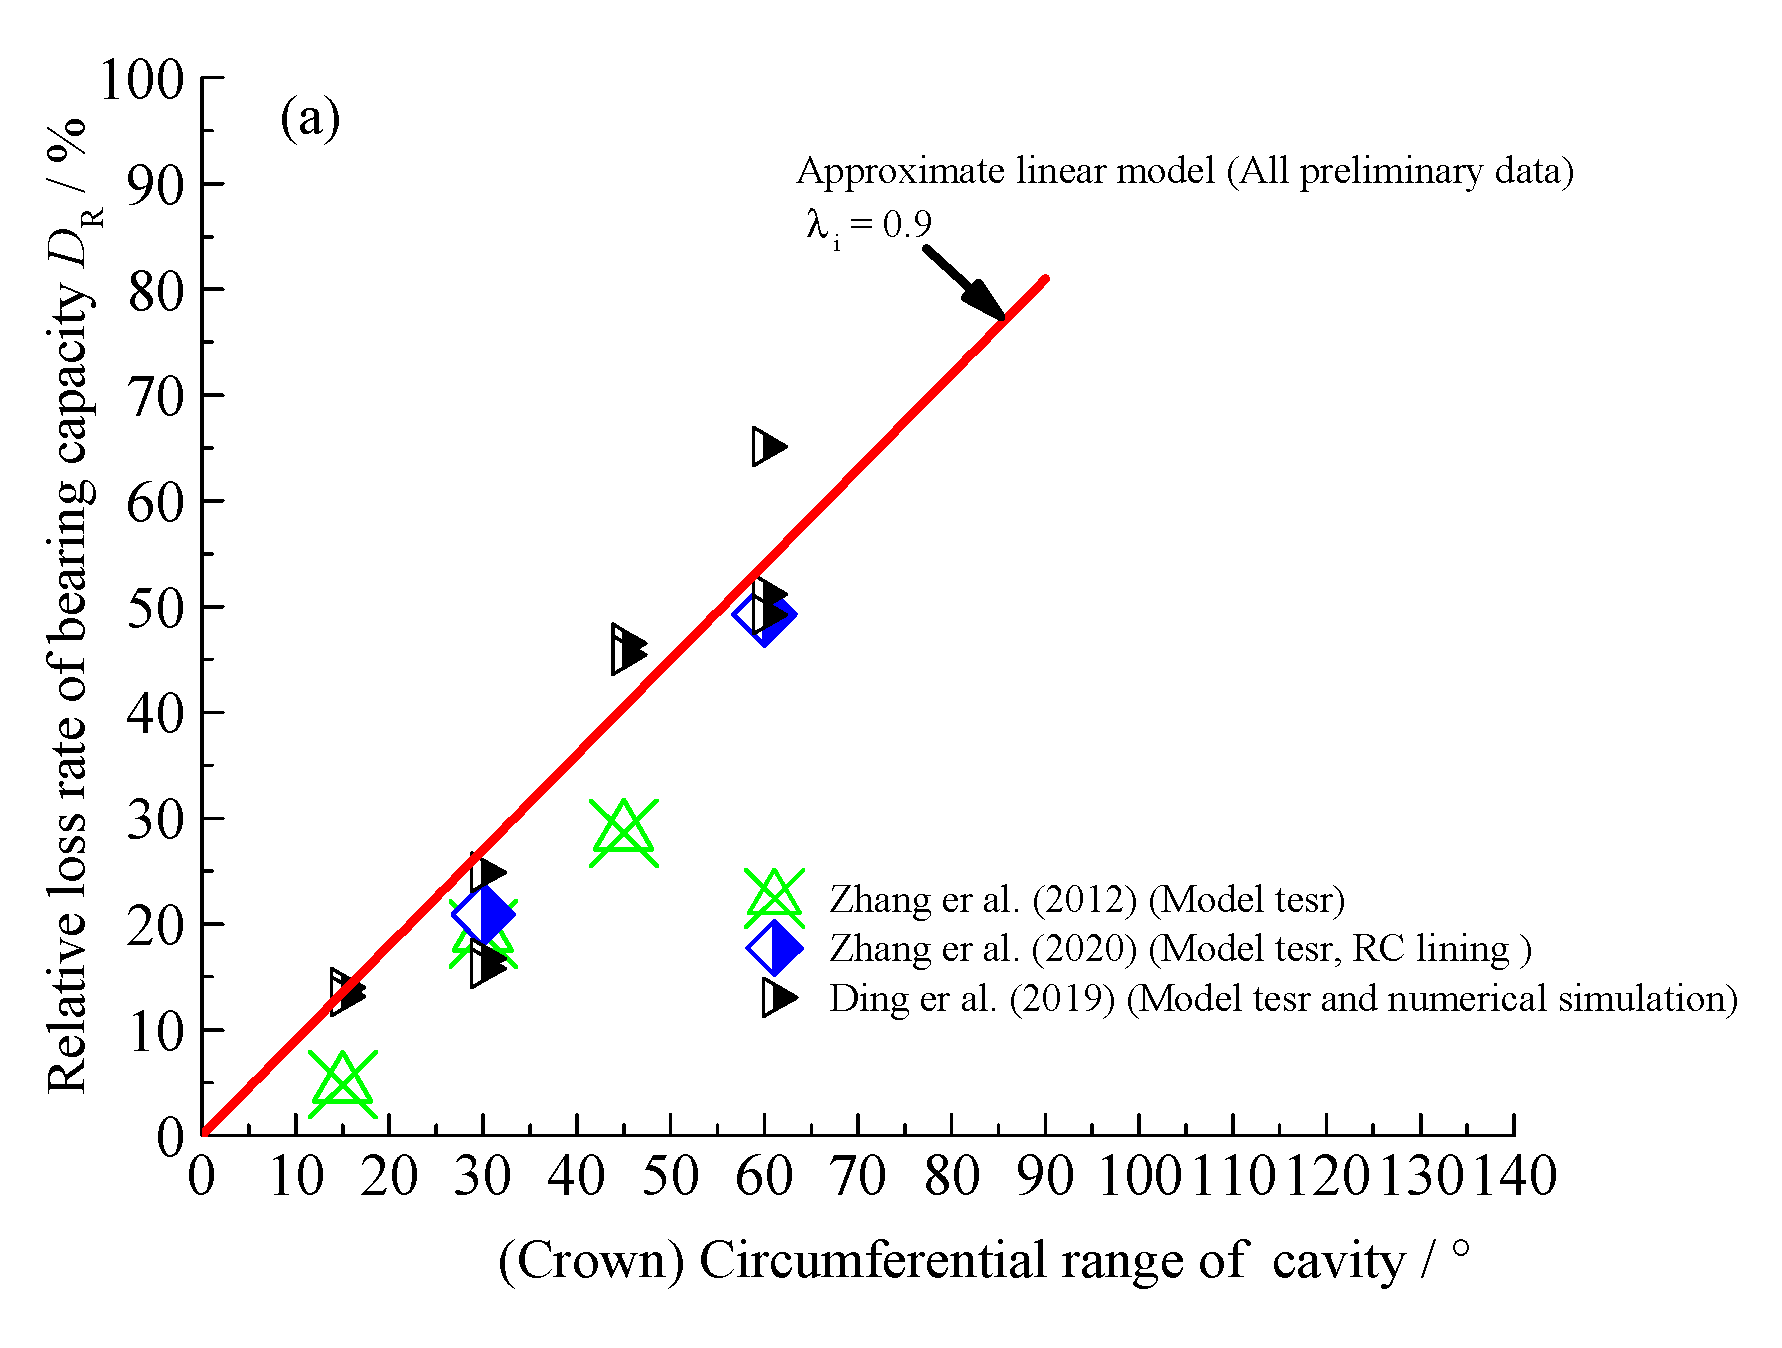
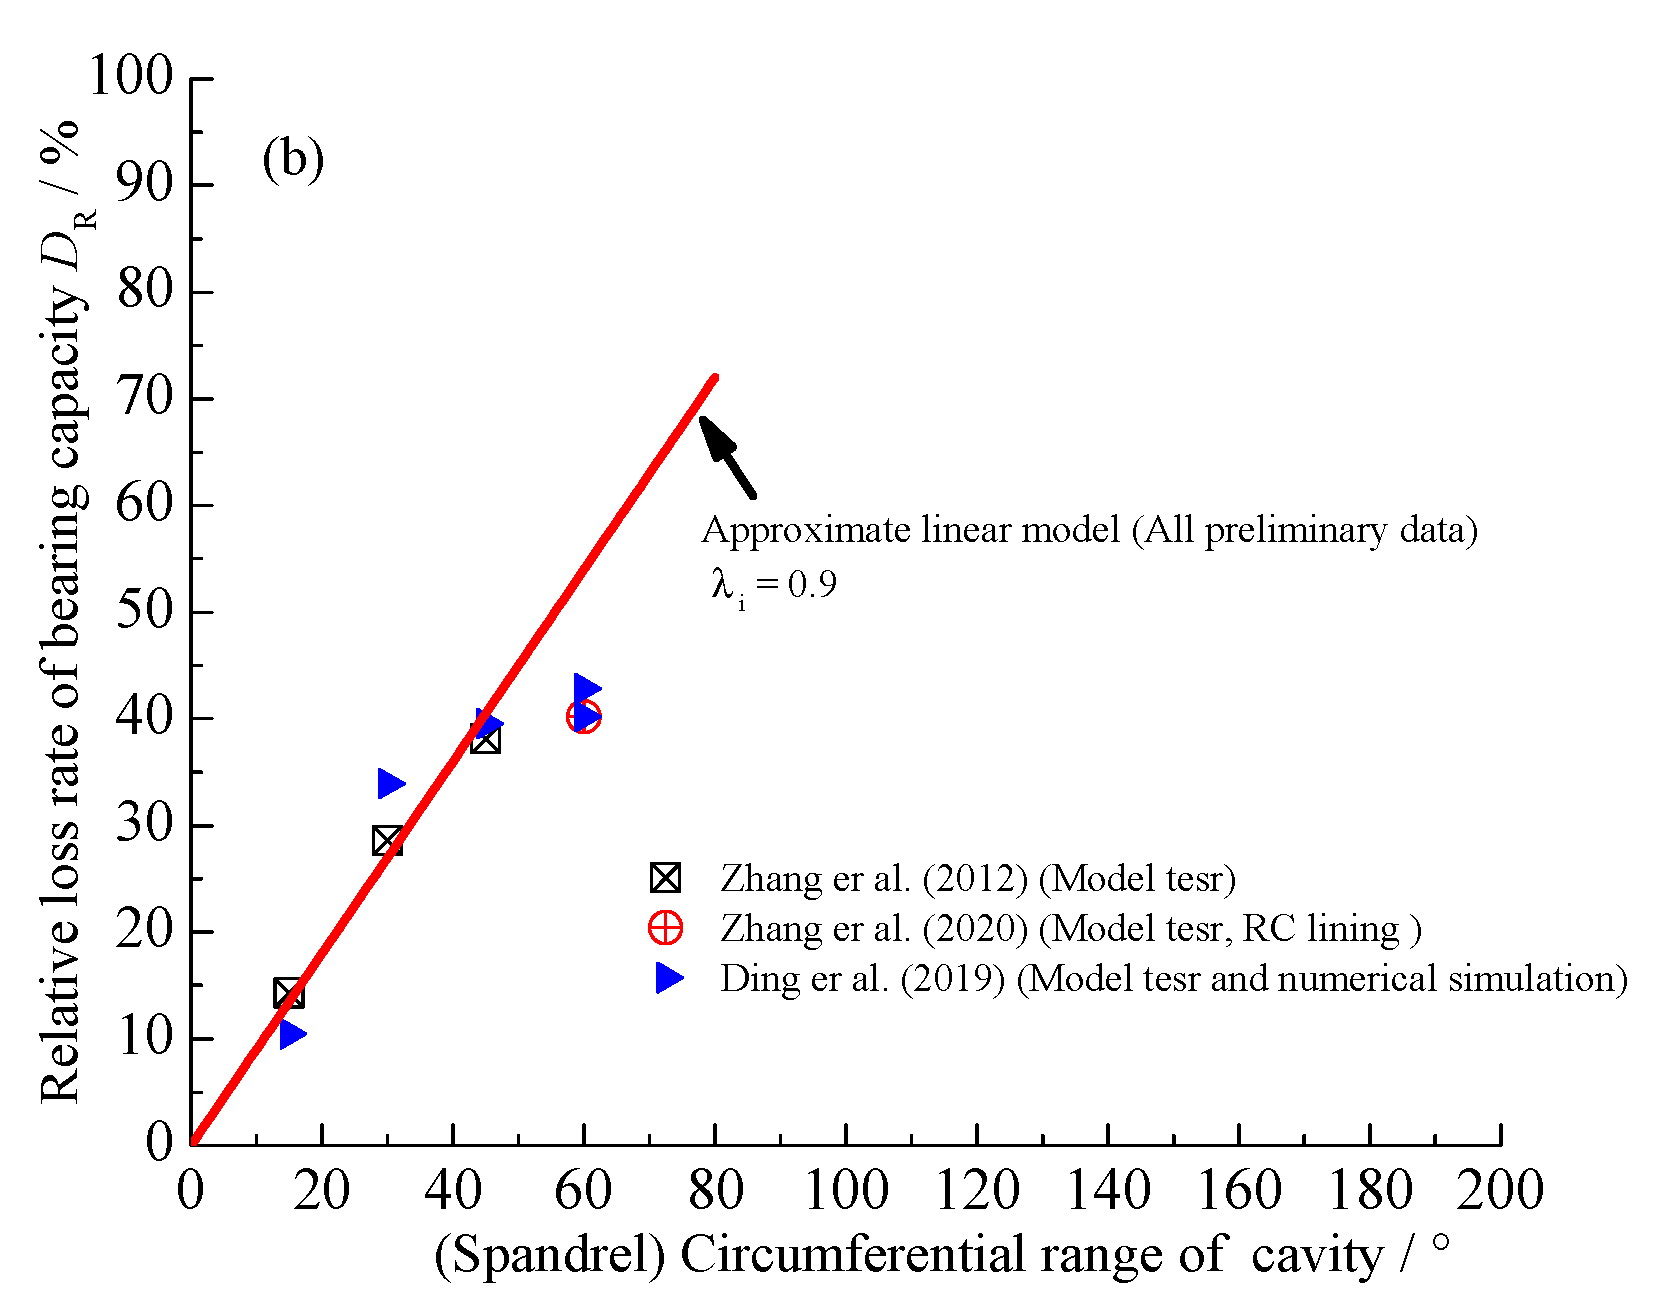
4.3.3. Cavity Factor
The relationship between the circumferential range of the cavity and the relative loss rate of the bearing capacity is presented in
Figure 3. The data on the circumferential range of cavity at the arch crown and at spandrel are presented in
Figure 3a,b, respectively. Most data related to the bearing capacity in
Figure 3 come from model tests. The relative loss rate of the bearing capacity linearly increases with increasing circumferential range of cavity. The approximate linear models fitted on all data are also given in
Figure 3, and the parameters of approximate linear models for the arch crown and spandrel are similar. However, the working conditions involved in the model tests and the variation range of factors are limited. Even if the factor values are the same, the amplitude of the relative loss rate of the bearing capacity may be different. For example, the numerical data on NC lining and RC lining in the model tests of Zhang Sen (2020) corresponds to the above description (test results for NC lining are not shown in
Figure 3).
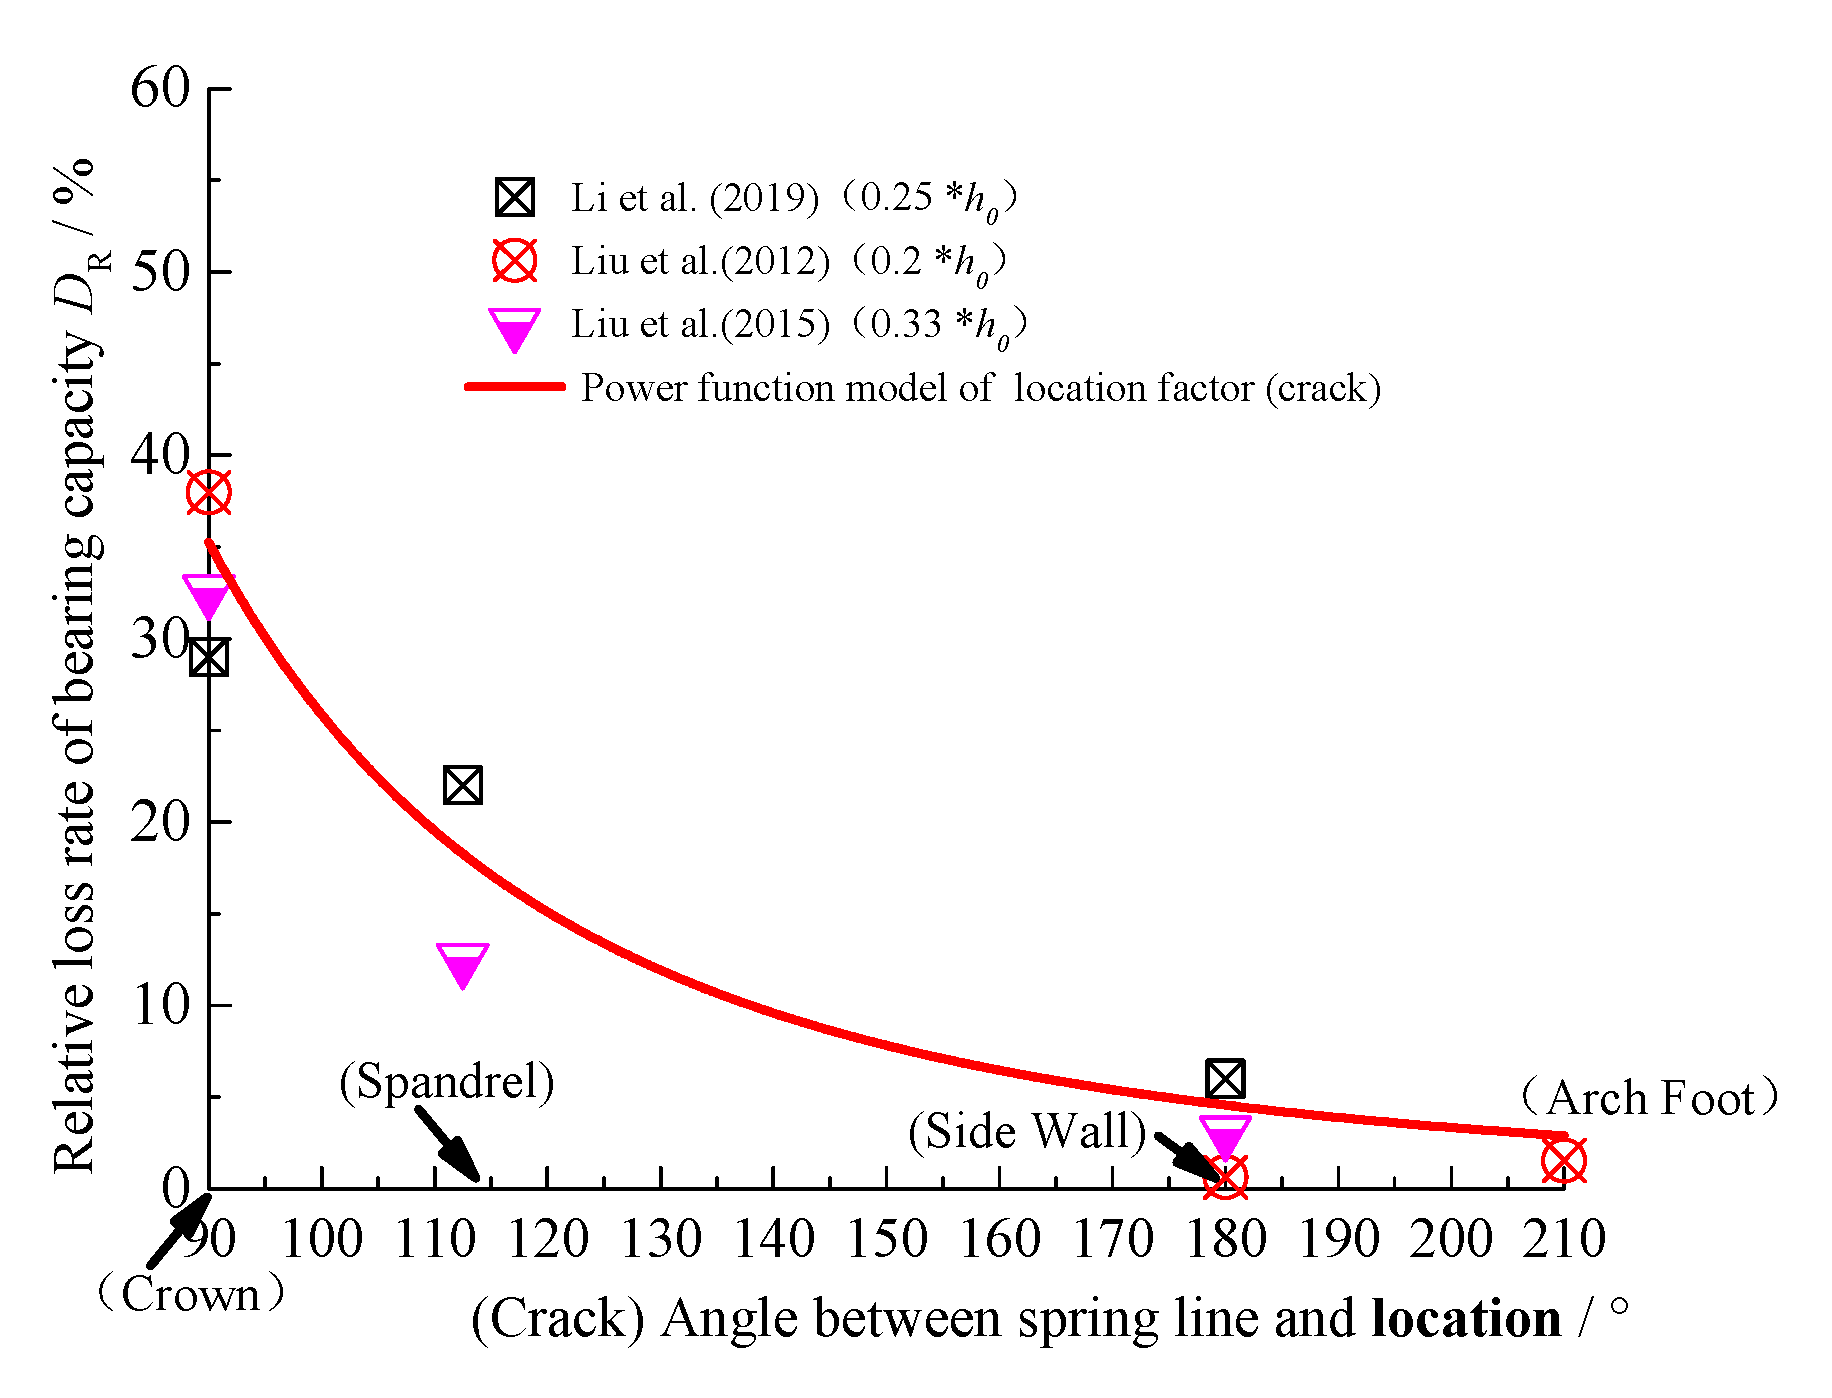
4.3.4. Location Factor
Figure 4 shows the relationship between crack location and relative loss rate of the bearing capacity. Crack location is quantified by the included angle between the springing line and crack location. Arch crown, spandrel, and other structure signs are marked in
Figure 4. By fitting all data in
Figure 4, the relationship between crack location and relative loss rate of the bearing capacity can be described by the following equation:
where
mi and
ni are model parameters. As shown in
Figure 4, the crack at arch crown has a more significant loss effect on the bearing capacity.
4.3.5. Coupling of Different Factors
To comprehensively consider the coupling effects of multiple factors, the simplest method is to consider how to couple single-factor models. For instance, Equations (4) and (6) can be combined to consider the loss effects of crack location and crack depth. The coupling model can be expressed as follows:
where
fi and
fj are crack location factor and crack depth factor, respectively.
4.4. Suggestions
In general, because the approximation of the tunnel surrounding rock and lining structure system and the characterization of the bearing capacity are not completely clear in the current research, the criteria of the bearing capacity index (factors) of the tunnel structure are inconsistent. For example, using safety factor to describe the bearing capacity in some cases is inappropriate. In addition, there is still a lack of systematic and reliable research for a single index. The bearing capacity loss of the in-service tunnel structure is the result of multiple factors (defects). In practice, multiple parameter indexes (factors) are coupled and there are many combinations (working/defects conditions), which cannot be all modeled through the analysis. This paper suggests that the analysis can be carried out for a single index first. By combining with numerical analysis, model tests, and on-site monitoring, and at the same time strengthening the accumulation of engineering experience (in order to determine the single-factor models more accurately, all working conditions that may occur in practice should be considered), the quantitative or statistical relationship (change stage) between single factor and relative loss rate of the bearing capacity is presented. After that, the working conditions of multi-factor coupling can be analyzed based on the determinant or coupling analysis method. The change stages of the bearing capacity are divided according to indexes to provide a reference basis for urgent needs in engineering such as maintenance opportunity and safety (health) analysis.
Meanwhile, a machine learning algorithm has the advantages of simple modeling and efficient calculation compared with traditional analysis methods. Calculating the relative loss rate of the bearing capacity using a machine learning algorithm is a further explored direction. Moreover, the stability of tunnel lining structure under defect conditions (whether it will develop soon) is also an important research direction.
5. Conclusions
The analysis framework of the bearing capacity of the tunnel structure is discussed and a method describing the bearing capacity loss of the tunnel structure is proposed in this study. Moreover, loss laws of the bearing capacity of the tunnel structure under different characteristic factors are preliminarily researched based on relevant mechanical data of the tunnel structure.
(1) Considering the current research basis and engineering requirements, loss laws of the bearing capacity of the tunnel structure can be preliminarily obtained according to the technical conditions of lining damage. From the technical conditions of lining damage, the influencing factors of the bearing capacity of the tunnel structure are attributed to external load action and material deterioration. In addition, the factor characteristics can be quantified by three main indexes including location, degree, and range. It is noted that the analysis of the bearing capacity should be based on the current conditions of influencing factors.
(2) The bearing capacity of the tunnel structure is expressed from the preliminarily defined concepts of relative loss rate of the bearing capacity and relative value of corresponding index, which means the change laws of the bearing capacity are described from the view of the relative state.
(3) Based on the definitions and rules of the bearing capacity of the tunnel structure, the related data on stress characteristics of lining structure reported in the literature are statistically analyzed again from the view of loss laws of the bearing capacity. Three factors including crack, insufficient lining thickness, and cavity are preliminarily analyzed and interpreted.
(4) The study of the loss law of the bearing capacity of the tunnel structure can firstly give a more comprehensive and accurate loss model of a single factor, and then analyze the complex working conditions of multi-factor coupling through coupling methods (such as participation coefficients, etc.). At the same time, the application of new methods (suitable for multiple factors function simulation) such as machine learning should be explored.


