Abstract
In recent years, the violation and fluctuation of system voltage has occurred with greater frequency with the integration of high-penetration distributed photovoltaic generation. In this paper, the voltage violation and fluctuation in a high-penetration distributed photovoltaic integrated system is analyzed, and then a corresponding suppression strategy is proposed. Firstly, based on solar cell and photovoltaic control system models, the influence factors of photovoltaic output are analyzed. Secondly, the voltage violation and fluctuation caused by photovoltaic integration is analyzed, and the quadratic parabola relationship between bus voltage fluctuation and photovoltaic power variation is constructed. Next, according to the virtual synchronous generator characteristic of distributed photovoltaics, a double-hierarchical suppression strategy is proposed to make full use of reactive power regulation capability, which can maintain the symmetry of power supply while meeting standard requirements. The proposed strategy can conveniently realize quick response and support the photovoltaic extensive access. Moreover, with the employment of the proposal, the system voltage violation and fluctuation can be suppressed effectively. Finally, considering the photovoltaic access location, capacity, and partial shading, the effectiveness of the proposed strategy is verified in IEEE 33-bus distribution system with field measured data. After distributed photovoltaic accesses the system, more than 60% of buses appear to have undergone bus voltage violation. With the proposed method, more than 20% of the voltage deviation and more than 6% of the voltage fluctuation are effectively suppressed so that the system voltage can be kept below 1.07 p.u. and the voltage fluctuation can be kept within 4%, meeting the requirements of power quality standards.
1. Introduction
In recent years, under the circumstances of global energy shortage and serious environmental damages which urgently need to be addressed, renewable energy generation has maintained a rapid development trend all over the world [1,2,3]. China proposes to achieve the goal of proportion of non-fossil energy in total energy consumption reaching about 20% by 2030 [1] while striving to achieve carbon neutrality by 2060. The European Union plans to achieve at least a 32% share for renewable energy by 2030 [2]. The United States predicts that renewable energy will account for more than 36% in 2050 [3]. As a major type of renewable energy, photovoltaic (PV) power generation has been widely studied [4,5], due to its characteristics of green, clean, widespread, etc. At present, a large-scale distributed grid-connected photovoltaic system is gradually developing, and the penetration of distributed photovoltaic generation is increasing in the distribution network [6,7].
However, the integration of high penetration of distributed photovoltaic generation has high potential to cause the violation and fluctuation of system voltage, thus endangering the safe and stable operation of the power system and strengthening the asymmetry issue of the distribution network [8]. Notton et al. [8] synthesized the reasons to predict solar fluctuations, and showed that variability and stochastic variation of renewable sources have a cost, sometimes a high cost. In the paper, voltage violation indicates that the voltage deviated to be larger than its upper limit, and voltage fluctuation refers to the change or continuous change of RMS value over a given period of time. According to the Chinese standards, the voltage deviation needs to be kept within the range of +7% to −10% of the nominal voltage, and the voltage variation range shall not exceed 4%. Thus, when the voltage is higher than 1.07 p.u. and the voltage variation exceeds 4%, the suppressed strategy for voltage needs to be taken.
Due to natural environment influences—e.g., insolation, temperature, and clouds—the photovoltaic power output continues to change and has obvious uncertainty characteristics. Large-scale grid-connected distributed PV generation with uncertainty characteristics causes an asymmetry of power supply and demand, and intensifies the power fluctuation during power system operation, and this may cause the system voltage to exceed the safe operation range [9], resulting in safety problems such as frequency stability [10]. Moreover, although the voltage fluctuation may be within the voltage range, due to the rapid change frequency, it may also interfere with the normal operation of load or equipment, or even result in voltage flicker. Correspondingly, with PV integration, voltage violation and fluctuation has become the main power quality problem and it cannot be ignored. Previous research has resulted in lots of beneficial studies on the measures of power fluctuation suppression—including system control, power prediction, and so on. Guo et al. [11] proposed a double-time-scale active distribution network voltage control strategy to coordinate and optimize the state of reactive power compensation equipment and the output of distributed generation based on different time scales, so as to reduce the average voltage deviation of the system. Liu et al. [12] proposed an improved whale algorithm based on a support vector machine model to predict photovoltaic power accurately, which is conducive to the symmetry of system supply and demand and the application of clean energy and sustainable development. Eftekharnejad et al. [13] proposed a method for obtaining the optimal operation state of a system with high PV penetration by investigating the impact of generation redispatch or displacement. With the improvement of photovoltaic penetration, the voltage violation and fluctuation in the distribution system under the influence of PV location, capacity, and weather will be further aggravated. However, with high-penetration of distributed photovoltaic access—especially partial shading—the impact analysis in the existing studies is not comprehensive enough. Therefore, the penetration and insolation influences on the voltage level of distributed PV integrated distribution systems cannot be ignored and this subject is further analyzed in this paper.
Moreover, the employment of large-scale photovoltaic inverters will also reduce the stability of distribution systems [8]. With the large-scale integration of distributed PV generation in the distribution network, the whole distribution system has gradually developed into an active network, which not only results in system voltage violation and fluctuation, but also causes the change of system power flow and voltage distribution. In the distribution system, distributed PV generators are mostly connected to the network through power electronic converters which lack the rotating inertia of traditional generators, and whose low inertia and weak damping [14] reduce the stability margin of the system. Thus, power fluctuations caused by asymmetry of power supply and requirement will further aggravate the instability risk of power systems. In order to improve power system stability, reasonable control and compensation measures should be taken, and virtual synchronous generator (VSG) technology provides an effective solution. Through the VSG technology, the system components such as renewable energy [15], energy storage [16], electric vehicle [17], and direct current transmission converter [18] can simulate the inertia of rotating motors to obtain a certain inertia and support system frequency modulation. Combining PV generation with VSG technology, the active power reserve scheme can be used to effectively improve the inertia of distribution systems with high-penetration PV generation [19,20,21,22]. Du et al. [19] examined the small-signal angular stability affected by VSG and also proposed a modal proximity method to avoid the VSG detrimental impact. Li et al. [20] constructed a novel VSG system based on a transfer function, and then optimized the model parameters to improve the frequency control ability. Asrari et al. [21] developed the VSG-based vector-controlled converter impedance model to analyze the effectiveness on power transfer capability, while the weak AC power grid voltage is asymmetric and traditional control method has no corresponding measures. Chen and O’Donnell [22] proposed a VSG control method constrained by stability considerations when the converter and line dynamic features are considered. While the existing studies mainly focused on the control method of the converter, ignoring the effect of system coordinated control. On the basis of existing studies, the voltage violation and fluctuation can be suppressed more effectively with the combination of VSG and system control method.
Considering high-penetration and partial shading affect, the voltage violation and fluctuation caused by photovoltaic integration is analyzed, and a double-hierarchical suppression strategy is proposed in this paper. Firstly, the influence factors of photovoltaic output are analyzed by using solar cell model and photovoltaic control system model. Secondly, through the simplified PV system model, the relationship between system voltage and distributed photovoltaic location and capacity is analyzed to further clarify the impact of power fluctuation on system voltage. Then, a double-hierarchical voltage violation and fluctuation suppression strategy is proposed by using the characteristics of virtual synchronous generator of distributed photovoltaic inverter. Finally, the effects of photovoltaic access capacity and partial shadow on the system voltage are analyzed in IEEE 33-bus distribution system, and the improvement effect of the proposed control method on the voltage level under high penetration and partial shadow is verified. Compared with the traditional method, the contributions of the proposed strategy are as follows:
- The proposed strategy not only reduces the harmful effect of high-penetration photovoltaic integration on voltage, but also deals with the voltage violation and fluctuation caused by partial shadow effectively;
- According to the bus voltage value, the local control hierarchy of the proposed strategy is convenient to realize a quick response, and also easy to support distributed generation extensive access;
- By ranking the reactive power output capacity, the proposal with global control can make full use of reactive power regulation ability of photovoltaic inverters under various conditions, especially the partial shadow situation, to improve the voltage stability of the system.
The remainder of the paper is depicted as follows: the photovoltaic generation model—including solar cell and control system under partial shadow condition—is introduced in the following section. Moreover, the voltage with distributed photovoltaic access is analyzed in Section 3, and the double-hierarchical voltage violation and fluctuation suppression strategy is proposed in Section 4. Case studies and the results to demonstrate the effectiveness are carried out in Section 5. Section 6 presents the conclusions.
2. Photovoltaic Generation Model
2.1. Solar Cell Model
The spectral distribution and sunlight irradiance will directly affect the output current and voltage of solar cells, thus affecting the output power of solar cells. When sunlight shines on the surface of the solar cell, it can be regarded as a current source, and the equivalent circuit is shown in Figure 1. In the figure, the photogenerated current Iph is generated by the solar cell under illumination, which is affected by the cell material, illumination intensity, and ambient temperature. ID represents the reverse saturation current of the diode. RSH is the bleeder resistance, and RS is the series resistance, which contains the resistance between two electrodes, the surface resistance, and the body resistance.
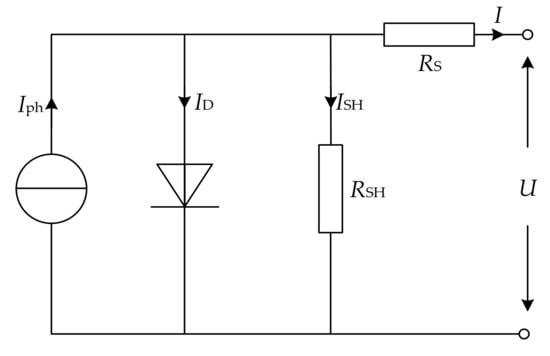
Figure 1.
Equivalent circuit of solar cell.
Generally, the bleeder resistance RSH is thousands of ohms, and RS is relatively small in practical projects. The influence of parallel branch current ISH and series resistance RS are usually ignored. Therefore, the relationship between the short-circuit current ISC and the open circuit voltage UOC for solar cells can be obtained as
where A is the PN-junction ideality factor; k donates the Boltzmann constant and its value is 1.38 × 10⁻²³ J/K; T is Kelvin thermodynamic temperature; q represents unit of electric quantity and its value is 1.6 × 10⁻¹⁹ C.
According to the short-circuit current ISC and open circuit voltage UOC, the output power of solar cell Pout can be obtained by
where Ffill is the fill factor which is used to measure the solar cell output characteristics and related to the series and parallel relationship for solar cells. Generally, the fill factor Ffill is in the range of 0.7~0.85. The solar cell output efficiency Rrate can be obtained by
where P is the rated power of a solar cell.
2.2. Photovoltaic System Model
The voltage level for single solar cell is low, which is not enough to meet the grid connection requirement. Therefore, multiple solar cells need to be connected in series to increase the voltage to meet the grid connection requirement, and multiple solar cells in series can form the PV power generation unit to obtain higher power by parallel connection. Furthermore, with the continuous scale expansion of PV generation, the mismatch between load and source characteristics for solar cells will cause a significant power loss [23]. Thus, maximum power point tracking (MPPT) technique has become the main control method with respect to maximum power at present [23,24]. The MPPT algorithm features few hardware requirements and simple maintenance. Its implementation mainly depends on a specific microcontroller, which is programmed to generate the duty cycle required to reach the maximum power point and control the boost circuit. The control system model for PV generation is shown in Figure 2. In the figure, sinusoidal pulse width modulation (SPWM) is employed, and it is the most widely used modulation method in photovoltaic inverters.
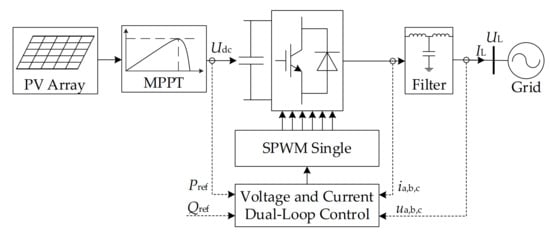
Figure 2.
Control system model of PV generation.
The main MPPT algorithms include constant voltage method, pilot cell method, look up table method, perturb and observe (P&O) method, etc. Among these, the P&O method is the most widely used algorithm in engineering [23,24], and the flowchart is shown in Figure 3. In the figure, U(k) and I(k) are respectively the voltage and current of the kth recording time, and P(k) is the power of the kth recording time. D is the duty ratio, and ΔD is the adjustment quantity of duty ratio.
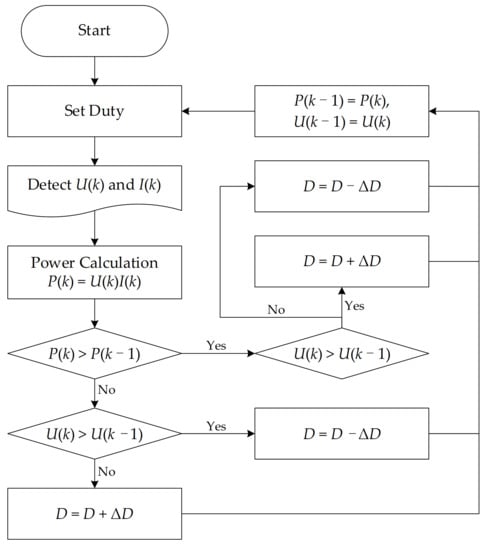
Figure 3.
Flowchart of P&O method.
According to the characteristics of solar cells, photovoltaic power generation is related to the irradiance and temperature. When the temperature is constant, the I-U (current-voltage) curve and P-U (power-voltage) curve clusters of photovoltaic cells under different insolation are shown in Figure 4.
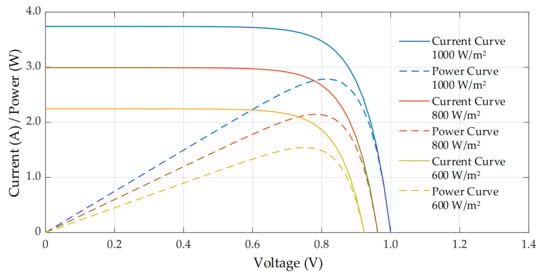
Figure 4.
Solar cell characteristic with different insolation and constant temperature.
From the figure, it can be seen that the maximum output power Pmax of solar cells changes obviously with the change of insolation, and set the corresponding voltage Umax of maximum output power point. The greater the insolation of the environment, the corresponding I-U curve will shift upward, that is, the short-circuit current will increase. When the voltage is between 0 and close to Umax, the current basically does not change with voltage variations, and the corresponding P-U curve is also almost linear. However, when the voltage exceeds Umax, the current drops rapidly, thus the overall P-U curve presents single peak state. Moreover, the intersection of the I-U or P-U curve and the x-axis represents the open circuit voltage UOC, and the insolation has little impact on UOC form the above figure.
When multiple solar cells connect in series and in parallel, the PV array is formed and can generate greater voltage and current. In the case of shading, the photovoltaic output will drop sharply, resulting in large voltage fluctuation. Due to shading, cloudy and changing weather, etc., the illumination on the surface of solar cells will be uneven distribution in the natural environment, affecting the efficiency of PV power generation. Under the influence of clouds, partial shadow conditions have a great impact on photovoltaic characteristics. In the PV array, several solar cells are connected in series, when one of the solar cells is partially sheltered, the illuminations received by solar cells are different, and consequently the maximum output power of PV generation is affected.
The photovoltaic array in four insolation conditions are set in the paper, which contains five solar cells connected in series. The illuminations accepted by each cell are different, and the specific parameter settings are shown in Table 1. The P-U curves for the photovoltaic array output under the four insolation conditions are shown in Figure 5.

Table 1.
Parameters of different insolation conditions.
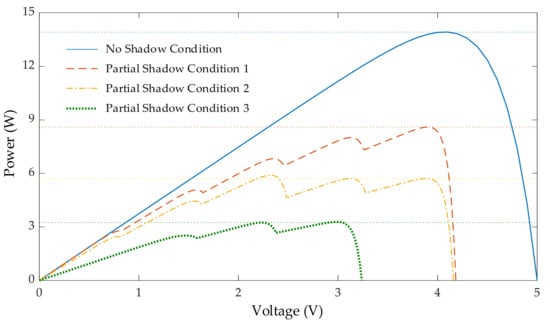
Figure 5.
PV array characteristic under different insolation conditions.
It can be clearly compared from the figure that, due to the partial shadow, the output power of PV generation system has strong fluctuation, and will further affect the power quality. Moreover, under partial shadow conditions, there may be a certain gap between the local maximum power point and the real global maximum power point. In this figure, the intersection of the horizontal dotted line and the P–U curve is the local maximum power point, and it is also the power point in actual operation. While the local maximum power point is not the real global maximum power point in the P–U curve. The probability of falling into the local maximum power point will increase, also resulting in a lot of energy waste and power fluctuation. Therefore, the partial shading cannot be ignored when analyzing the bus voltage of PV generation system.
3. Voltage Analysis with Distributed Photovoltaic Integration
The simplified equivalent circuit for distribution system with distributed photovoltaic generator connected is shown in Figure 6. In the equivalent circuit, E∠0˚ and UL∠δ represent the bus voltage of point of common coupling (PCC) and PV access bus. ZT∠θ is the equivalent branch impedance. PPV and QPV are respectively the active and reactive powers of PV generator, PL and QL are respectively the active and reactive powers of load.
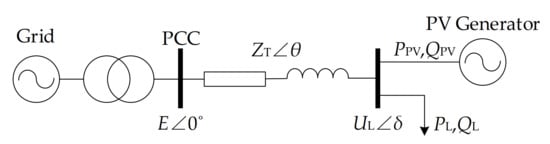
Figure 6.
Simplified equivalent circuit with distributed PV generator.
Generally, distributed photovoltaic power generation operates in constant power factor control mode. With the power factor F, the following relationship of active and reactive powers of the PV generator is
Based on the principle of power flow calculation, the relations of voltage and power can be obtained as
where P and Q are respectively the active and reactive powers of bus with PV generator and load. Then, based on the Equation (5), the relationship between UL and powers can be calculated as
When the active and reactive powers change form P and Q to P + ΔP and Q + ΔQ, the bus voltage will transfer to ULC = UL + ΔUL with the change of power symmetry. The relationship between bus voltage ULC and changes of active and reactive powers is
From the equation, the voltage fluctuation ΔUL causing by PV generation integration can be obtained as
From the analysis, the distributed photovoltaic generation has great impact on the PV access bus and is obviously affected by the change of photovoltaic capacity and location. With the increase of photovoltaic capacity, the voltage will change, especially when the load demand is small and the photovoltaic output is large. With the decrease of the electrical distance, the impact on PCC voltage will increase. Under the partial shading, the change of insolation will also cause output power variation and then affect the system voltage. Furthermore, because the voltage fluctuation reflected by ΔUL is relatively small, cubic and quartic terms can be ignored in Equation (8), thus the relationship between voltage and active and reactive power represents a quadratic parabola.
Moreover, it can be seen that when active and reactive powers have the opposite change trends for by adjusting ΔQ, the bus voltage violation and fluctuation can be suppressed which is caused by the change of active power ΔP. Under the condition of given load capacity, the voltage variation trend of PV access bus caused by the change of photovoltaic capacity is shown in Figure 7, and the curves in Figure 7 are calculated for the fixed load.
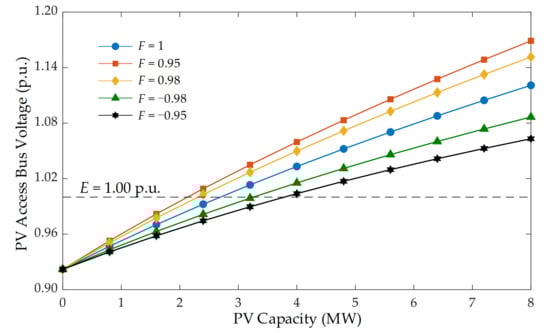
Figure 7.
Comparison of bus voltage variation trend with different power factors.
From the results in Figure 7, under different power factor F for PV inverter, the voltage variation trends of PV access bus are different. The overall variation trend with the specific power factor presents a quadratic parabola. When the photovoltaic inverter outputs reactive power, the smaller the power factor is, the greater the maximum voltage is. When the photovoltaic inverter absorbs reactive power, the smaller the absolute value of power factor is, the smaller the maximum voltage is. Thus, by adjusting reactive power of PV inverter, the bus voltage violation and fluctuation can be suppressed effectively.
4. Voltage Violation and Fluctuation Suppression Method
Currently, the photovoltaic inverter has certain reactive power regulation ability so that it can absorb or deliver reactive power, according to the current voltage situation of the PV access bus [15,16], as shown in Figure 8. In the figure, SPV,1, SPV,2, and SPV,3 represent the apparent power of photovoltaic inverters with different capacities, respectively. φ is the power factor angle, and power factor F = cosφ. φmax and φmin represent the maximum and minimum allowable power factor angle φ of photovoltaic inverter.
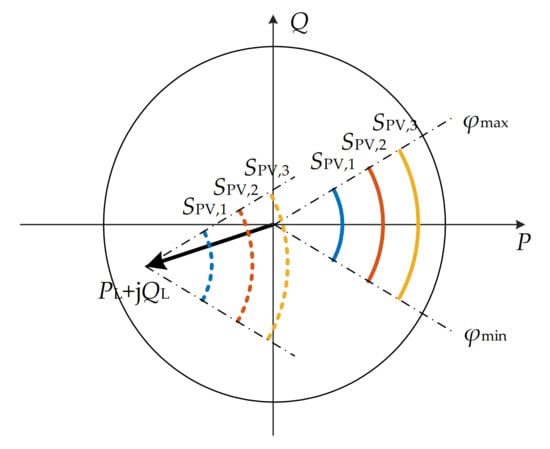
Figure 8.
Power vector diagram of photovoltaic bus.
It can be seen from the above figure that, under different PV inverter capacities, the PV access bus can operate in different quadrants, which may absorb or deliver reactive power, and thereby the PV inverter shows the VSG characteristics. According to the above voltage analysis, the voltage can be controlled effectively with the injected reactive power. Considering that if only a large amount of reactive power is injected to suppress the voltage drop, it will lead to the overheating of the inverter and the mis-operation of the overcurrent protection. Thus, the local control method for power factor can be employed to ensure the reactive power remains within an acceptable range.
In this local control method, the reactive power of the photovoltaic inverter is adjusted by changing the power factor. The reactive power QPV adjusts in the opposite direction according to the rise or fall of the bus voltage UL caused by the active power PPV, which can control the bus voltage UL within the specified range. Namely, when the bus voltage rises, the photovoltaic inverter has leading power factor and absorbs reactive power; when the bus voltage reduces, the photovoltaic inverter has lagging power factor and delivers reactive power.
However, when some photovoltaic generators are affected by clouds, shadows, etc., it will affect the output of the PV power supply, resulting in the bus voltage reduction of the PV access bus. At this time, the influence on the bus voltage with the highest value may be relatively small. If only the local control of photovoltaic inverter is adopted, the reactive power absorbed by the photovoltaic generator will be reduced, which may further increase the maximum bus voltage in the system. Furthermore, the global voltage control measure is introduced to reduce the high-penetration and partial shading influences on system voltage violation and fluctuation. Consequently, a double-hierarchical voltage violation and fluctuation suppression strategy for a distributed PV integrated system is proposed in the paper. The framework of the suppression strategy is shown in Figure 9. Four bus voltage reference values are set in the proposal, including maximum and minimum acceptable voltages Uacc,max and Uacc,min, and maximum and minimum adjustable voltages Uadj,max and Uadj,min. k1 and k2 are the adjust slopes for power factor angle φ, as shown in Figure 9. It should be noted that different setting parameters may have different improvement effects.
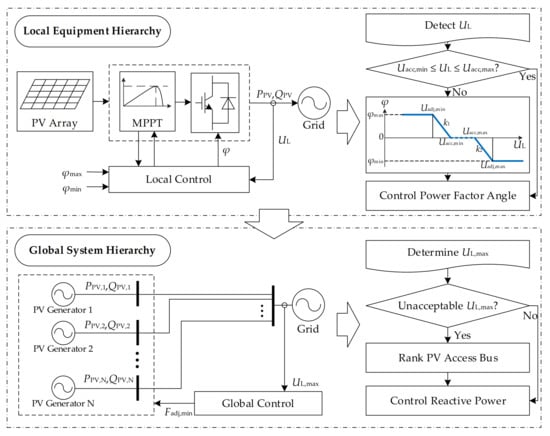
Figure 9.
The framework of voltage violation and fluctuation suppression strategy.
The specific implementation for the double-hierarchical voltage violation and fluctuation suppression strategy is listed as follows:
- Local Equipment Control: Set the initial value of power factor angle φ to zero. Compare the PV access bus voltage UL with the four bus voltage reference values. If UL is in the range of Uacc,min and Uacc,max, keep the power factor angle φ constant. Otherwise, according to the voltage change ΔUL, set the power factor angle φ of PV inverter as follows. After the power factor angle φ is set, maintain the power factor angle φ for a period of time, until the voltage change ΔUL in the next time-period is detected.
- When bus voltage UL is smaller than Uadj,min, set the power factor angle φ to φmax;
- When bus voltage UL is in the range of Uadj,min and Uacc,min, the power factor angle φ = φ + k1ΔUL and φ changes from φmax to 0;
- When bus voltage UL is in the range of Uacc,max and Uadj,max, the power factor angle φ = φ + k2ΔUL and φ changes from 0 to φmin;
- When bus voltage UL is larger than Uadj,max, set the power factor angle φ to φmin.
- Global System Control: Judge the maximum bus voltage UL,max in the power system whether less than the maximum acceptable voltage Uacc,max. If so, keep the power factor constant, and the global control is not performed. Otherwise, UL,max is not acceptable, and rank all PV access buses with the electrical distance between maximum voltage bus and PV access location. The electrical distance is determined by the branch impedance between the between maximum voltage bus and PV access location. The greater the branch impedance value, the farther the electrical distance. Then the electrical distance is arranged from small to large. According to the ranking results, set power factor angle φ to the minimum adjustable power factor Fadj,min of each PV access bus one by one to further improve reactive power, until the maximum bus voltage UL,max reduces to an acceptable range or all PV inverter power factor angles have been set.
With the combination of VSG and system control, the suppression for voltage violation and fluctuation is more effective. On the one hand, since only the local bus voltage value is employed, the control complexity is reduced, and the local control is convenient to realize the quick response of photovoltaic inverter. It is easy to support extensive access for distributed photovoltaic generator. Moreover, additional loss of PV inverter will not increase with power factor change. On the other hand, the global control makes full use of the reactive power regulation ability and virtual synchronous characteristics of the photovoltaic inverter. The strategy can effectively suppress the impact of partial shadow on the system voltage. Although the local control strategy may decrease up to about 5% of the active power output and reduce the photovoltaic operation efficiency, it can effectively ensure the system voltage within the limit, and enhance the safe and stable operation ability of the power system.
5. Case Studies
In this section, the impacts of distributed PV integration partial shading are further analyzed, and the effectiveness of proposed voltage suppression measure is verified. Firstly, the relationship between bus voltage and PV access location and capacity is analyzed. Then, the partial shadow affect is analyzed under different PV output conditions in the four areas. Finally, by employing practical PV generation and residential load output characteristics, the effectiveness of the proposed double-hierarchical voltage violation and fluctuation suppression strategy is verified.
The IEEE 33-bus distribution system is used as the test case [25], as shown in Figure 10. In the system, Bus 1 is set to the balance node and the other buses are set to PQ nodes. The distribution system is divided into four areas to further analyze the influence of partial shading.
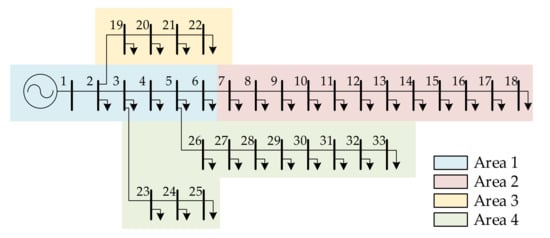
Figure 10.
IEEE 33-bus distribution system with regional division.
According to the analysis of bus voltage with distributed photovoltaic integration, the photovoltaic access location and capacity has a great impact on the system voltage. To facilitate analysis the impact of PV generation, the PV penetration RPV is defined as in the paper,
5.1. Analysis of Photovoltaic Access Capacity
In order to verify the impact of photovoltaic access location and capacity on system voltage, Bus 12 and Bus 29 in IEEE 33-bus distribution system are selected. The comparisons of the voltage variation trends without and with 0.3 MW, 0.9 MW, and 1.2 MW photovoltaic capacity access are shown in Figure 11 and Figure 12, respectively.
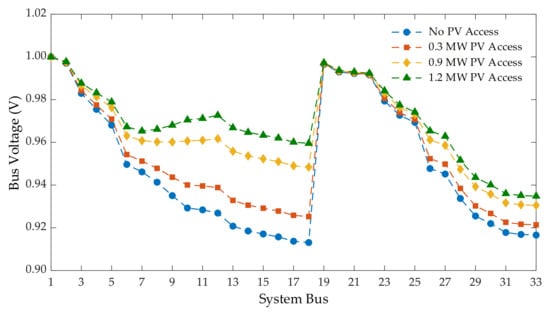
Figure 11.
Voltage variation with different PV capacity access in Bus 12.
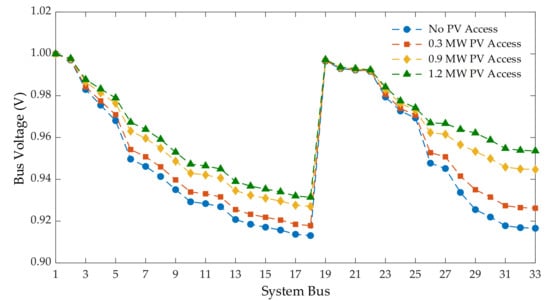
Figure 12.
Voltage variation with different PV capacity access in Bus 29.
According to the results in the above figures, the increase of accessed distributed photovoltaic capacity has an obvious effect on the voltage. Meanwhile, for any bus in the system, the voltages of all buses in the system will be affected when distributed photovoltaic generation connected to the grid. However, when different buses are connected to the same photovoltaic capacity, the voltage variation trends of each bus are different, that is, the voltage sensitivity is different.
Figure 13a,b show the variation curve of bus voltage with photovoltaic penetration when PV access to Bus 12 and Bus 29, respectively. Under the same photovoltaic permeability, the voltage variation trends of each bus are different, and the PV access bus has the highest sensitivity. Regardless of the time-series fluctuation of photovoltaic output, it can be seen that the voltage variation trend of each bus is similar, showing quadratic parabola variation characteristics to the previous theoretical analysis.
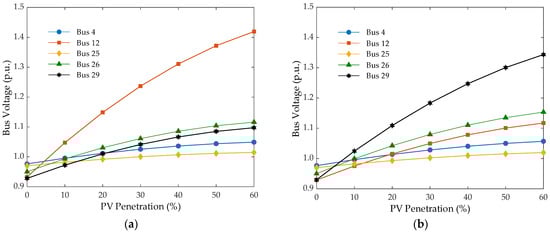
Figure 13.
Voltage variations of different buses with PV permeability: (a) PV access in Bus 12; (b) PV access in Bus 29.
In practice, the photovoltaic location and capacity configurations may be different. To obtain the maximum photovoltaic power generation capacity that the distribution system can accommodate under the condition that the voltage does not exceed the limit, the capacity of all photovoltaic access buses is randomly allocated. In the random process, the uniform distribution is used in assignment of PV capacity, and the change of the maximum bus voltage in the distribution system is observed, as shown in Figure 14.
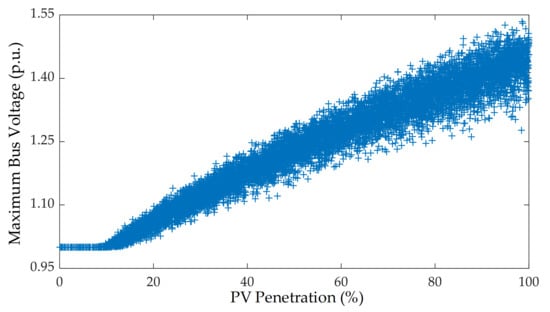
Figure 14.
Maximum voltage variation trend under random PV capacity distribution.
From the figure, when the PV penetration is less than 20%, the system voltage is lower than 1.10 p.u. and the system can remain relatively stable. When the PV penetration is in the range of 20% and 40%, the maximum system voltage is related to the PV access position. When the PV penetration is more than 40%, the system voltage will exceed the limit, which will cause severe voltage fluctuation. Therefore, the PV location is also a critical factor affecting system voltage violation and fluctuation. For further improving the photovoltaic access capacity of distributed system, it is necessary to propose reasonable voltage violation and fluctuation suppression measure.
5.2. Analysis of Partial Shadow
In order to further analyze the influence of photovoltaic output change on system voltage when partial shadow phenomenon occurs, four cases with different partial shading conditions are set in this paper. Different insolation conditions are set in different areas shown in Figure 10 to simulate the partial shading phenomenon in the actual system operation. The specific parameters of photovoltaic output in different areas of each case are listed in Table 2.
Table 2.
Parameters of different output conditions in four areas.
When partial shadow occurs under the parameter settings of Table 2 and photovoltaic capacity are randomly distributed in different areas, the maximum bus voltage variations of the four cases in the distribution system are shown in Figure 15.
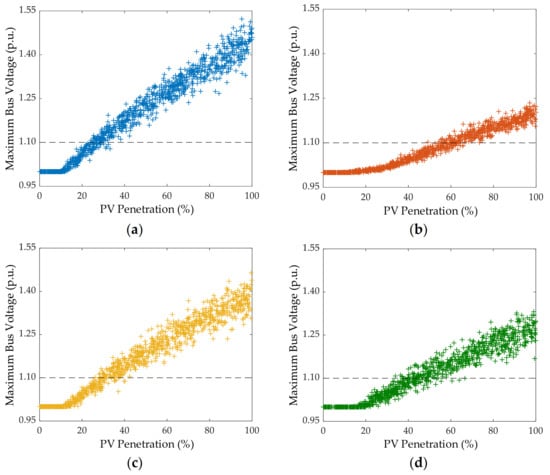
Figure 15.
Maximum voltage variations with PV penetration under different output conditions: (a) Maximum voltage variations of Case 1; (b) Maximum voltage variations of Case 2; (c) Maximum voltage variations of Case 3; (d) Maximum voltage variations of Case 4.
Through the comparison of Figure 14 and Figure 15, the change of the maximum bus voltage value can reflect the degree of system voltage violation and fluctuation. The greater the change of the maximum bus voltage, the more obvious the system voltage violation and fluctuation. From the comparisons, it can be seen that the influence of shading in different areas on system voltage is different. Among them, the photovoltaic output setting of Case 2 has the greatest impact on the maximum value of system voltage, which will also cause more obvious fluctuation of distribution system voltage.
In addition, in order to analyze the influence of partial shadow in different areas on system voltage violation and fluctuation, photovoltaic generator is connected to the end bus of each area—i.e., Buses 6, 18, 22, and 33—with the same capacity of 2 MW. Under different photovoltaic access locations, the comparison of voltage values of all buses in the distribution system is shown in Figure 16.
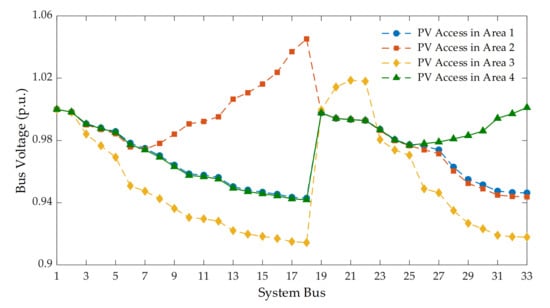
Figure 16.
Comparison of bus voltages when PV access in different areas.
It can be seen that the access of the photovoltaic generator at the end bus of Area 2 has the greatest impact on the overall voltage of the system, reflecting that when partial shading occurs in Area 2, the system voltage violation and fluctuation will be more obvious. Moreover, the access of photovoltaic generation at the end buses of Area 3 and Area 4 also has a relatively large impact on the system voltage, while the access of photovoltaic generation in Area 1 has a relatively small impact on the system voltage. According to the theoretical analysis in Section 3, when the electrical distance between the photovoltaic bus and PCC bus is closer, the impact on the PCC bus voltage will be more obvious.
5.3. Analysis of Voltage Suppression Strategy
In order to verify the effectiveness of the proposed strategy in the paper, the field measured photovoltaic output and residential load powers in Shandong Province somewhere are employed for analysis, and the photovoltaic output and residential load powers are recorded every 15 min. Figure 17a shows the measured photovoltaic output power curves of a typical sunny day and a typical cloudy day, and Figure 17b shows the residential load power on a typical working day. In the figure, PPV,max and PPV,min are the maximum and minimum photovoltaic output powers, respectively, and the minimum output power PPV,min is 0. PL,max and PL,min are respectively the maximum and minimum powers of residential load.
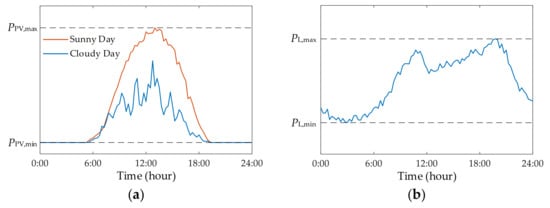
Figure 17.
Voltage variations of different buses with PV permeability: (a) PV access in Bus 12; (b) PV access in Bus 29.
For photovoltaic output, whether it is in the sunny or cloudy day, the output peak power will be reached around 13:00 (hour:minute). Due to sunrise and sunset, the photovoltaic output power is zero at the period before 5:30 and after 19:00. For residential load, the load power consumption is relatively large during the daytime and relatively small at nighttime, and the residential load power consumption will reach the peak value around the times of 11:00 and 20:00.
Assume that Area 2 and Area 3 are under normal illumination, and partial shadow occurs in Area 1 and Area 4 in IEEE-33 bus distribution system. Therefore, the PV output curve on a sunny day is adopted for the PV access in Area 2 and Area 3, while the PV output curve on a cloudy day is adopted in Area 1 and Area 4. Nine buses are accessed with PV generator of the same capacity of 2 WM, which contain Buses 6, 10, 12, 13, 17, 21, 25, 29, and 32. The IEEE 33-bus distribution system with PV integration is shown in Figure 18.
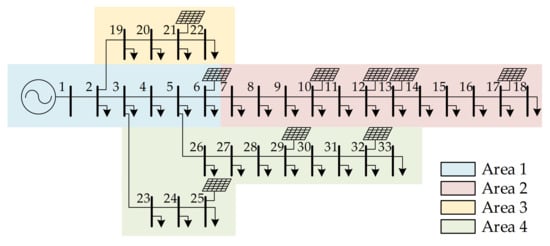
Figure 18.
IEEE 33-bus distribution system with PV integration.
All loads in the system adopt the residential load power consumption curve in Figure 17b. The load varies from 50% to 120%, so as to simulate the load power consumption from light to heavy of the system. The time-varying voltage of each bus can be obtained through power flow calculation, and the time-varying bus voltage of each area in one day is shown in Figure 19.
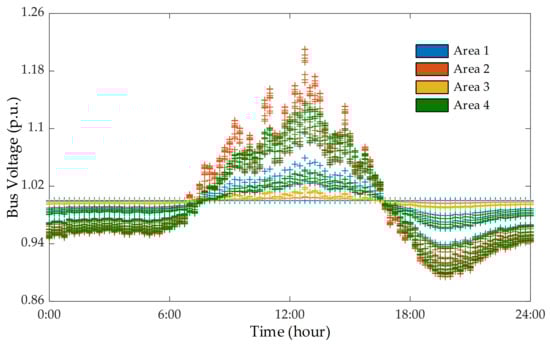
Figure 19.
Time-varying voltages of distribution system in one day.
As shown in the figure, the obvious voltage violation and fluctuation in the system mainly appears in Area 2 and Area 4. Bus voltage violation occurs in 21 buses, more than 60%. At about the time of 13:00, due to the peak photovoltaic output, the system bus voltage exceeded the limit seriously, up to about 1.20 p.u. According to the relevant standard of the allowable voltage range in distribution network, the voltage at noontime has seriously exceeded the allowable range. Meanwhile, in the time period of 11:00 to 15:00, the voltage difference at each measured time is relatively large, which will cause serious voltage violation and fluctuation. At about the time of 20:00—that is, the photovoltaic output is zero and the load power consumption reaches the peak value—the voltage shortage is serious. The voltage fluctuation is defined as the percentage of voltage change based on the previous time in the paper, and the voltage fluctuation is more than 6% by calculation. However, due to the lack of regulation capacity of photovoltaic at night, the paper mainly analyzes the time period from 7:00 to 18:00, which demonstrates obvious impact from photovoltaic power, and the time period after 20:00 is not considered.
The proposed voltage violation and fluctuation strategy in the paper is then applied to the distribution system, and the bus voltage of each area in one day by employing the proposed method is shown in Figure 20.
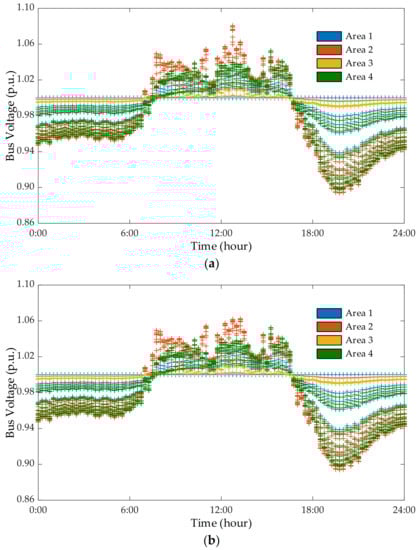
Figure 20.
Time-varying voltages of distribution system in one day after employing voltage violation and fluctuation strategy. (a) Voltages after using local equipment control strategy; (b) Voltages after using the double-hierarchical voltage violation and fluctuation suppression strategy.
For the double-hierarchical voltage violation and fluctuation suppression strategy—referred to the relevant standards of the allowable voltage range in distribution network, including relevant Chinese standards—the maximum and minimum acceptable voltages Uacc,max and Uacc,min are respectively set to 1.04 p.u. and 0.96 p.u., and the maximum and minimum adjustable voltages Uadj,max and Uadj,min are set to 1.07 p.u. and 0.90 p.u., respectively. In order to improve the PV active power output, the power factor of photovoltaic inverter is set to 0.95 to −0.95 in local equipment control hierarchy, and the adjustable power factor is set to −0.8 in global system control hierarchy. The time-varying system voltage only adopting local equipment control strategy is shown in Figure 20a, and the time-varying voltage after using the double-hierarchical voltage violation and fluctuation suppression strategy is shown in Figure 20b.
According to Figure 20a, when the distribution system only adopts the local control strategy, the system voltage can be effectively suppressed and the voltage violation and fluctuation is relatively small. However, due to the peak photovoltaic output at about noontime, only local control strategy cannot effectively suppress the voltage, and some bus voltages are still out of the range of 1.07 p.u. and 0.90 p.u. As shown in Figure 20b, when the proposed double-hierarchical control strategy is employed, it can make full use of the reactive power regulation ability of the photovoltaic inverter to control the voltage for each system bus within the allowable voltage range. Consequently, the proposal can effectively solve the issue of voltage exceeding specified limits.
Furthermore, the voltage fluctuation trend after applying the double-hierarchical voltage fluctuation suppression strategy is shown in Figure 21. It can be seen that the voltage variation is less than 4%, and thus the suppression of voltage fluctuation is verified.
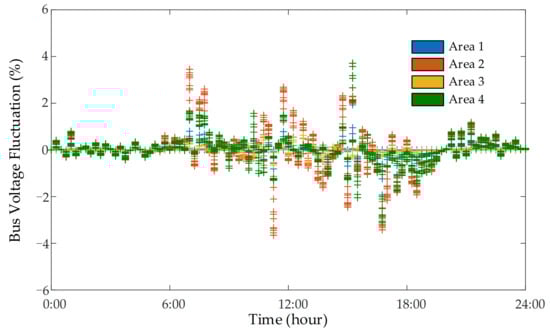
Figure 21.
Voltage fluctuation trend of distribution system after employing voltage violation and fluctuation strategy.
With the above analysis, the voltage violation and fluctuation are obvious with the high-penetration PV integration. The voltage violation and fluctuation may result in safety problems, and interfere with the normal operation of load or equipment, which is harmful to the distribution system operation. By employing the proposed strategy, the suppression effectiveness of voltage violation and fluctuation is verified, and the harmful effect of high-penetration photovoltaic integration on voltage is reduced.
6. Conclusions
In terms of different proportion and partial shadow influences of distributed photovoltaic integration, the resulting voltage violation and fluctuation issue is analyzed, and then a double-hierarchical voltage violation and fluctuation suppression strategy is proposed in this paper. The proposed approach is examined in a IEEE 33-bus distribution system. The following conclusions can be drawn from the work:
- The quadratic relationship between photovoltaic power output change and bus voltage fluctuation is analyzed and verified in this paper. With the relationship, the system voltage level can be effectively measured under various influence factors, such as distributed photovoltaic location and capacity, partial shading, etc.;
- In order to make full use of the reactive power regulation ability of photovoltaic generator and keep the symmetry of power supply and demand, the double-hierarchical voltage violation and fluctuation suppression strategy is proposed, which is not only convenient to realize quick response for voltage violation and fluctuation suppression, but also can support extensive access.
- The proposed strategy is employed in distributed photovoltaic generation access power system in this paper, and the proposal verifies the effectiveness in suppressing voltage violation and fluctuation in the IEEE 33-bus distribution system.
Future research will focus on considering renewable energy and load uncertainty in system control with high-penetration distributed photovoltaic generation, and it is interesting to carry out the proposal combined with engineering practice. Moreover, due to the extensive application of distributed photovoltaic generation and power electronic conversion devices, the power quality issues—which include harmonic, sag and swell, and so on—are also of great significance topics. With this topic, future research directions mainly include the frequency fluctuation, the harmonic coupling mechanism, the influence analysis of power electronic converter, the location and traceability method for power quality disturbance, the low voltage ride through capability of converter, and so on.
Author Contributions
Conceptualization, Y.L. (Yahui Li) and Y.S.; Methodology, Y.L. (Yahui Li); Software, Y.L. (Yahui Li); Validation, Y.L. (Yahui Li), Y.S. and J.Z.; Formal analysis, K.L.; Investigation, Y.L. (Yahui Li) and Y.P.; Resources, J.Z. and Y.P.; Data curation, J.Z.; Writing—original draft preparation, Y.L. (Yahui Li); Writing—review and editing, Y.L. (Yahui Li), Y.S., and Y.L. (Yongliang Liang); Visualization, Y.L. (Yahui Li); Supervision, Y.S. and K.L. All authors have read and agreed to the published version of the manuscript.
Funding
This research was funded by the National Natural Science Foundation of China, grant number 51977123, Key R&D Program of Shandong Province, grant number 2019GGX103008, and Young Scholar Program of Shandong University, grant number 2016WLJH07.
Data Availability Statement
The data presented in this study are available on request from the corresponding author.
Conflicts of Interest
The authors declare no conflict of interest.
References
- Renewable Energies Offer the Way Ahead. Available online: http://english.www.gov.cn/news/top_news/2018/12/20/content_281476443537100.htm (accessed on 20 December 2018).
- 2030 Climate and Energy Framework. Available online: https://ec.europa.eu/clima/policies/strategies/2030_en (accessed on 20 September 2020).
- Annual Energy Outlook 2021. Available online: https://www.eia.gov/outlooks/aeo (accessed on 3 February 2020).
- Wang, C.-N.; Dang, T.-T.; Tibo, H.; Duong, D.-H. Assessing Renewable energy production capabilities using DEA window and fuzzy TOPSIS model. Symmetry 2021, 13, 334. [Google Scholar] [CrossRef]
- Preda, S.; Oprea, S.-V.; Bâra, A.; Belciu, A. PV forecasting using support vector machine learning in a big data analytics context. Symmetry 2018, 10, 748. [Google Scholar] [CrossRef] [Green Version]
- Cavana, M.; Mazza, A.; Chicco, G.; Leone, P. Electrical and gas networks coupling through hydrogen blending under increasing distributed photovoltaic generation. Appl Energy 2021, 290, 116764. [Google Scholar] [CrossRef]
- Lin, Q.; Liu, L.-J.; Yuan, M.; Ge, L.-J.; Zhang, M. Choice of the distributed photovoltaic power generation operating mode for a manufacturing enterprise: Surrounding users vs a power grid. J. Clean. Prod. 2021, 293, 126199. [Google Scholar] [CrossRef]
- Notton, G.; Nivet, M.L.; Voyant, C.; Paoli, C.; Darras, C.; Motte, F.; Fouilloy, A. Intermittent and stochastic character of renewable energy sources: Consequences, cost of intermittence and benefit of forecasting. Renew. Sust. Energ. Rev. 2018, 87, 96–105. [Google Scholar] [CrossRef]
- Tonkoski, R.; Lopes, L.A.C.; El-Fouly, T.H.M. Coordinated active power curtailment of grid connected PV inverters for overvoltage prevention. IEEE Trans. Sustain. Energy 2011, 2, 139–147. [Google Scholar] [CrossRef]
- Rahmann, C.; Castillo, A. Fast Frequency Response Capability of Photovoltaic Power Plants: The Necessity of New Grid Requirements and Definitions. Energies 2014, 7, 6306–6322. [Google Scholar] [CrossRef]
- Guo, Y.; Wu, Q.; Gao, H.; Huang, S.; Zhou, B.; Li, C. Double-time-scale coordinated voltage control in active distribution networks based on MPC. IEEE Trans. Sustain. Energy 2020, 11, 294–303. [Google Scholar] [CrossRef]
- Liu, Y.-W.; Feng, H.; Li, H.-Y.; Li, L.-L. An improved whale algorithm for support vector machine prediction of photovoltaic power generation. Symmetry 2021, 13, 212. [Google Scholar] [CrossRef]
- Eftekharnejad, S.; Heydt, G.T.; Vittal, V. Optimal generation dispatch with high penetration of photovoltaic generation. IEEE Trans. Sustain. Energy 2015, 6, 1013–1020. [Google Scholar] [CrossRef]
- Teimourzadeh, S.; Aminifar, F.; Davarpanah, M.; Shahidehpour, M. Adaptive control of micro-grid security. IEEE Trans. Smart Grid 2018, 9, 3909–3910. [Google Scholar] [CrossRef]
- Nian, H.; Jiao, Y. Improved virtual synchronous generator control of DFIG to ride-through symmetrical voltage fault. IEEE Trans. Energy Convers. 2020, 35, 672–683. [Google Scholar] [CrossRef]
- Tabar, V.S.; Jirdehi, M.A.; Hemmati, R. Sustainable planning of hybrid micro-grid towards minimizing environmental pollution, operational cost and frequency fluctuations. J. Clean. Prod. 2018, 203, 1187–1200. [Google Scholar] [CrossRef]
- Li, P.; Hu, W.; Xu, X.; Huang, Q.; Liu, Z.; Chen, Z. A frequency control strategy of electric vehicles in microgrid using virtual synchronous generator control. Energy 2019, 189, 116389. [Google Scholar] [CrossRef]
- Fathi, A.; Shafiee, Q.; Bevrani, H. Robust frequency control of microgrids using an extended virtual synchronous generator. IEEE Trans. Power Syst. 2018, 33, 6289–6297. [Google Scholar] [CrossRef]
- Du, W.; Fu, Q.; Wang, H.F. Power system small-signal angular stability affected by virtual synchronous generators. IEEE Trans. Power Syst. 2019, 34, 3209–3219. [Google Scholar] [CrossRef]
- Li, L.; Li, H.; Tseng, M.-L.; Feng, H.; Chiu, A.S.F. Renewable energy system on frequency stability control strategy using virtual synchronous generator. Symmetry 2020, 12, 1697. [Google Scholar] [CrossRef]
- Asrari, A.; Mustafa, M.; Ansari, M.; Khazaei, J. Impedance analysis of virtual synchronous generator-based vector controlled converters for weak AC grid integration. IEEE Trans. Sustain. Energy 2019, 10, 1481–1490. [Google Scholar] [CrossRef]
- Chen, J.; O’Donnell, T. Parameter constraints for virtual synchronous generator considering stability. IEEE Trans. Power Syst. 2019, 34, 2479–2481. [Google Scholar] [CrossRef]
- Verma, D.; Nema, S.; Shandilya, A.M.; Dash, S.K. Maximum power point tracking (MPPT) techniques: Recapitulation in solar photovoltaic systems. Renew. Sust. Energ. Rev. 2016, 54, 1018–1034. [Google Scholar] [CrossRef]
- Basha, C.H.; Rani, C. Different Conventional and soft computing MPPT techniques for solar PV systems with high step-up Boost converters: A comprehensive analysis. Energies 2020, 13, 371. [Google Scholar] [CrossRef] [Green Version]
- Baran, M.E.; Wu, F.F. Network reconfiguration in distribution systems for loss reduction and load balancing. IEEE Trans. Power Deliv. 1989, 4, 1401–1407. [Google Scholar] [CrossRef]
Publisher’s Note: MDPI stays neutral with regard to jurisdictional claims in published maps and institutional affiliations. |
© 2021 by the authors. Licensee MDPI, Basel, Switzerland. This article is an open access article distributed under the terms and conditions of the Creative Commons Attribution (CC BY) license (https://creativecommons.org/licenses/by/4.0/).