
The Significance of Chimpanzee Occipital Asymmetry to Hominin Evolution


Abstract
:1. Introduction
2. Materials and Methods
Statistical Analyzes
3. Results
4. Discussion
Author Contributions
Funding
Data Availability Statement
Acknowledgments
Conflicts of Interest
References
- LeMay, M. Morphological cerebral asymmetries of modern man, fossil man and nonhuman primate. Ann. N. Y. Acad. Sci. 1976, 280, 349–366. [Google Scholar] [CrossRef] [PubMed]
- Holloway, R.L.; De La Coste-Lareymondie, M.C. Brain endocast asymmetry in pongids and hominids: Some preliminary findings on the paleontology of cerebral dominance. Am. J. Phys. Anthropol. 1982, 58, 101–110. [Google Scholar] [CrossRef] [PubMed]
- Balzeau, A.; Gilissen, E.; Grimaud-Hervé, D. Shared pattern of endocranial shape asymmetries among great apes, anatomically modern humans, and fossil hominins. PLoS ONE 2011, 7, 29581. [Google Scholar] [CrossRef] [PubMed] [Green Version]
- Gratiolet, L.P. Mémoire sur les Plis Cérébraux de L’homme et des Primates; Bertrand, A., Ed.; Betrand: Paris, France, 1854. [Google Scholar]
- Connolly, J.C. External Morphology of the Primate Brain; Thomas, C.C., Ed.; Bannerstone House: Springfield, IL, USA, 1950. [Google Scholar]
- Duvernoy, H. The Human Brain; Springer: New York, NY, USA, 1991. [Google Scholar]
- Holloway, R.L.; Broadfield, D.C.; Yuan, M.S. Morphology and histology of chimpanzee primary visual striate cortex indicate that brain reorganization predated brain expansion in early hominid evolution. Anat. Rec. A Discov. Mol. Cell Evol. Biol. 2003, 273, 594–602. [Google Scholar] [CrossRef] [PubMed]
- Falk, D.; Zollikofer, C.P.E.; Ponce de León, M.; Semendeferi, K.; Alatorre Warren, J.L.; Hopkins, W.D. Identification of in vivo Sulci on the External Surface of Eight Adult Chimpanzee Brains: Implications for Interpreting Early Hominin Endocasts. Brain Behav. Evol. 2018, 91, 45–58. [Google Scholar] [CrossRef] [PubMed]
- Falk, D. A reanalysis of the South African australopithecine natural endocasts. Am. J. Phys. Anthropol. 1980, 53, 525–539. [Google Scholar] [CrossRef] [PubMed]
- Holloway, R. Revisiting the South African Taung australopithecine endocast: The position of the lunate sulcus as determined by the stereoplotting technique. Am. J. Phys. Anthropol. 1981, 56, 43–58. [Google Scholar] [CrossRef]
- Cointepas, Y.; Mangin, J.F.; Garnero, L.; Poline, J.B.; Benali, H. BrainVISA: Software platform for visualization and analysis of multi-modality brain data. NeuroImage 2001, 13, 98. [Google Scholar] [CrossRef]
- Gomez-Robles, A.; Hopkins, W.D.; Sherwood, C.C. Increased morphological asymmetry, evolvability and plasticity in human brain evolution. Proc. R Soc. B 2013, 280, 20130575. [Google Scholar] [CrossRef] [PubMed] [Green Version]
- Cignoni, P.; Callieri, M.; Corsini, M.; Dellepiane, M.; Ganovelli, F.; Ranzuglia, G. MeshLab: An Open-Source Mesh Processing Tool. In Proceedings of the Sixth Eurographics Italian Chapter Conference, Salerno, Italy, 2–4 July 2008; pp. 129–136. [Google Scholar]
- Bailey, R.C.; Byrnes, J. A new, old method for assessing measurement error in both univariate and multivariate morphometric studies. Syst. Zool. 1990, 39, 124–130. [Google Scholar] [CrossRef]
- Legendre, P.; Legendre, L. Numerical Ecology, 3rd ed.; Elsevier: Oxford, UK, 2012; Volume 24. [Google Scholar]
- Pearson, A.; Polly, P.D.; Bruner, E. Making sense of modern human sulcal pattern variation, brain size and temporal lobe boundaries: Implications for fossil Homo. Am. J. Phys. Anthropol. 2021, 174, 83. [Google Scholar]
- Press, W.H.; Teukolsky, S.A.; Vetterling, W.T.; Flannery, B.P. Numerical Recipes in C; Cambridge University Press: Cambridge, UK, 1992. [Google Scholar]
- Simpson, G.G.; Roe, A.; Lewontin, R.C. Quantitative Zoology, Rev. ed.; Dover Publications: New York, NY, USA, 2003. [Google Scholar]
- Smith, R.J. Allometric scaling in comparative biology: Problems of concept and method. Am. J. Phys. Anthropol. 1984, 246 Pt 2, R152–R160. [Google Scholar] [CrossRef] [PubMed]
- Pearson, A.; Polly, P.D.; Bruner, E. Is the middle cranial fossa a reliable predictor of temporal lobe volume in extant and fossil anthropoids? Am. J. Phys. Anthropol. 2020, 172, 698–713. [Google Scholar] [CrossRef] [PubMed]
- Hammer, Ø.; Harper, D.A.T.; Ryan, P.D. PAST: Paleontological Statistics Software Package for Education and Data Analysis. Palaeontol. Electron. 2001, 4, 9. [Google Scholar]


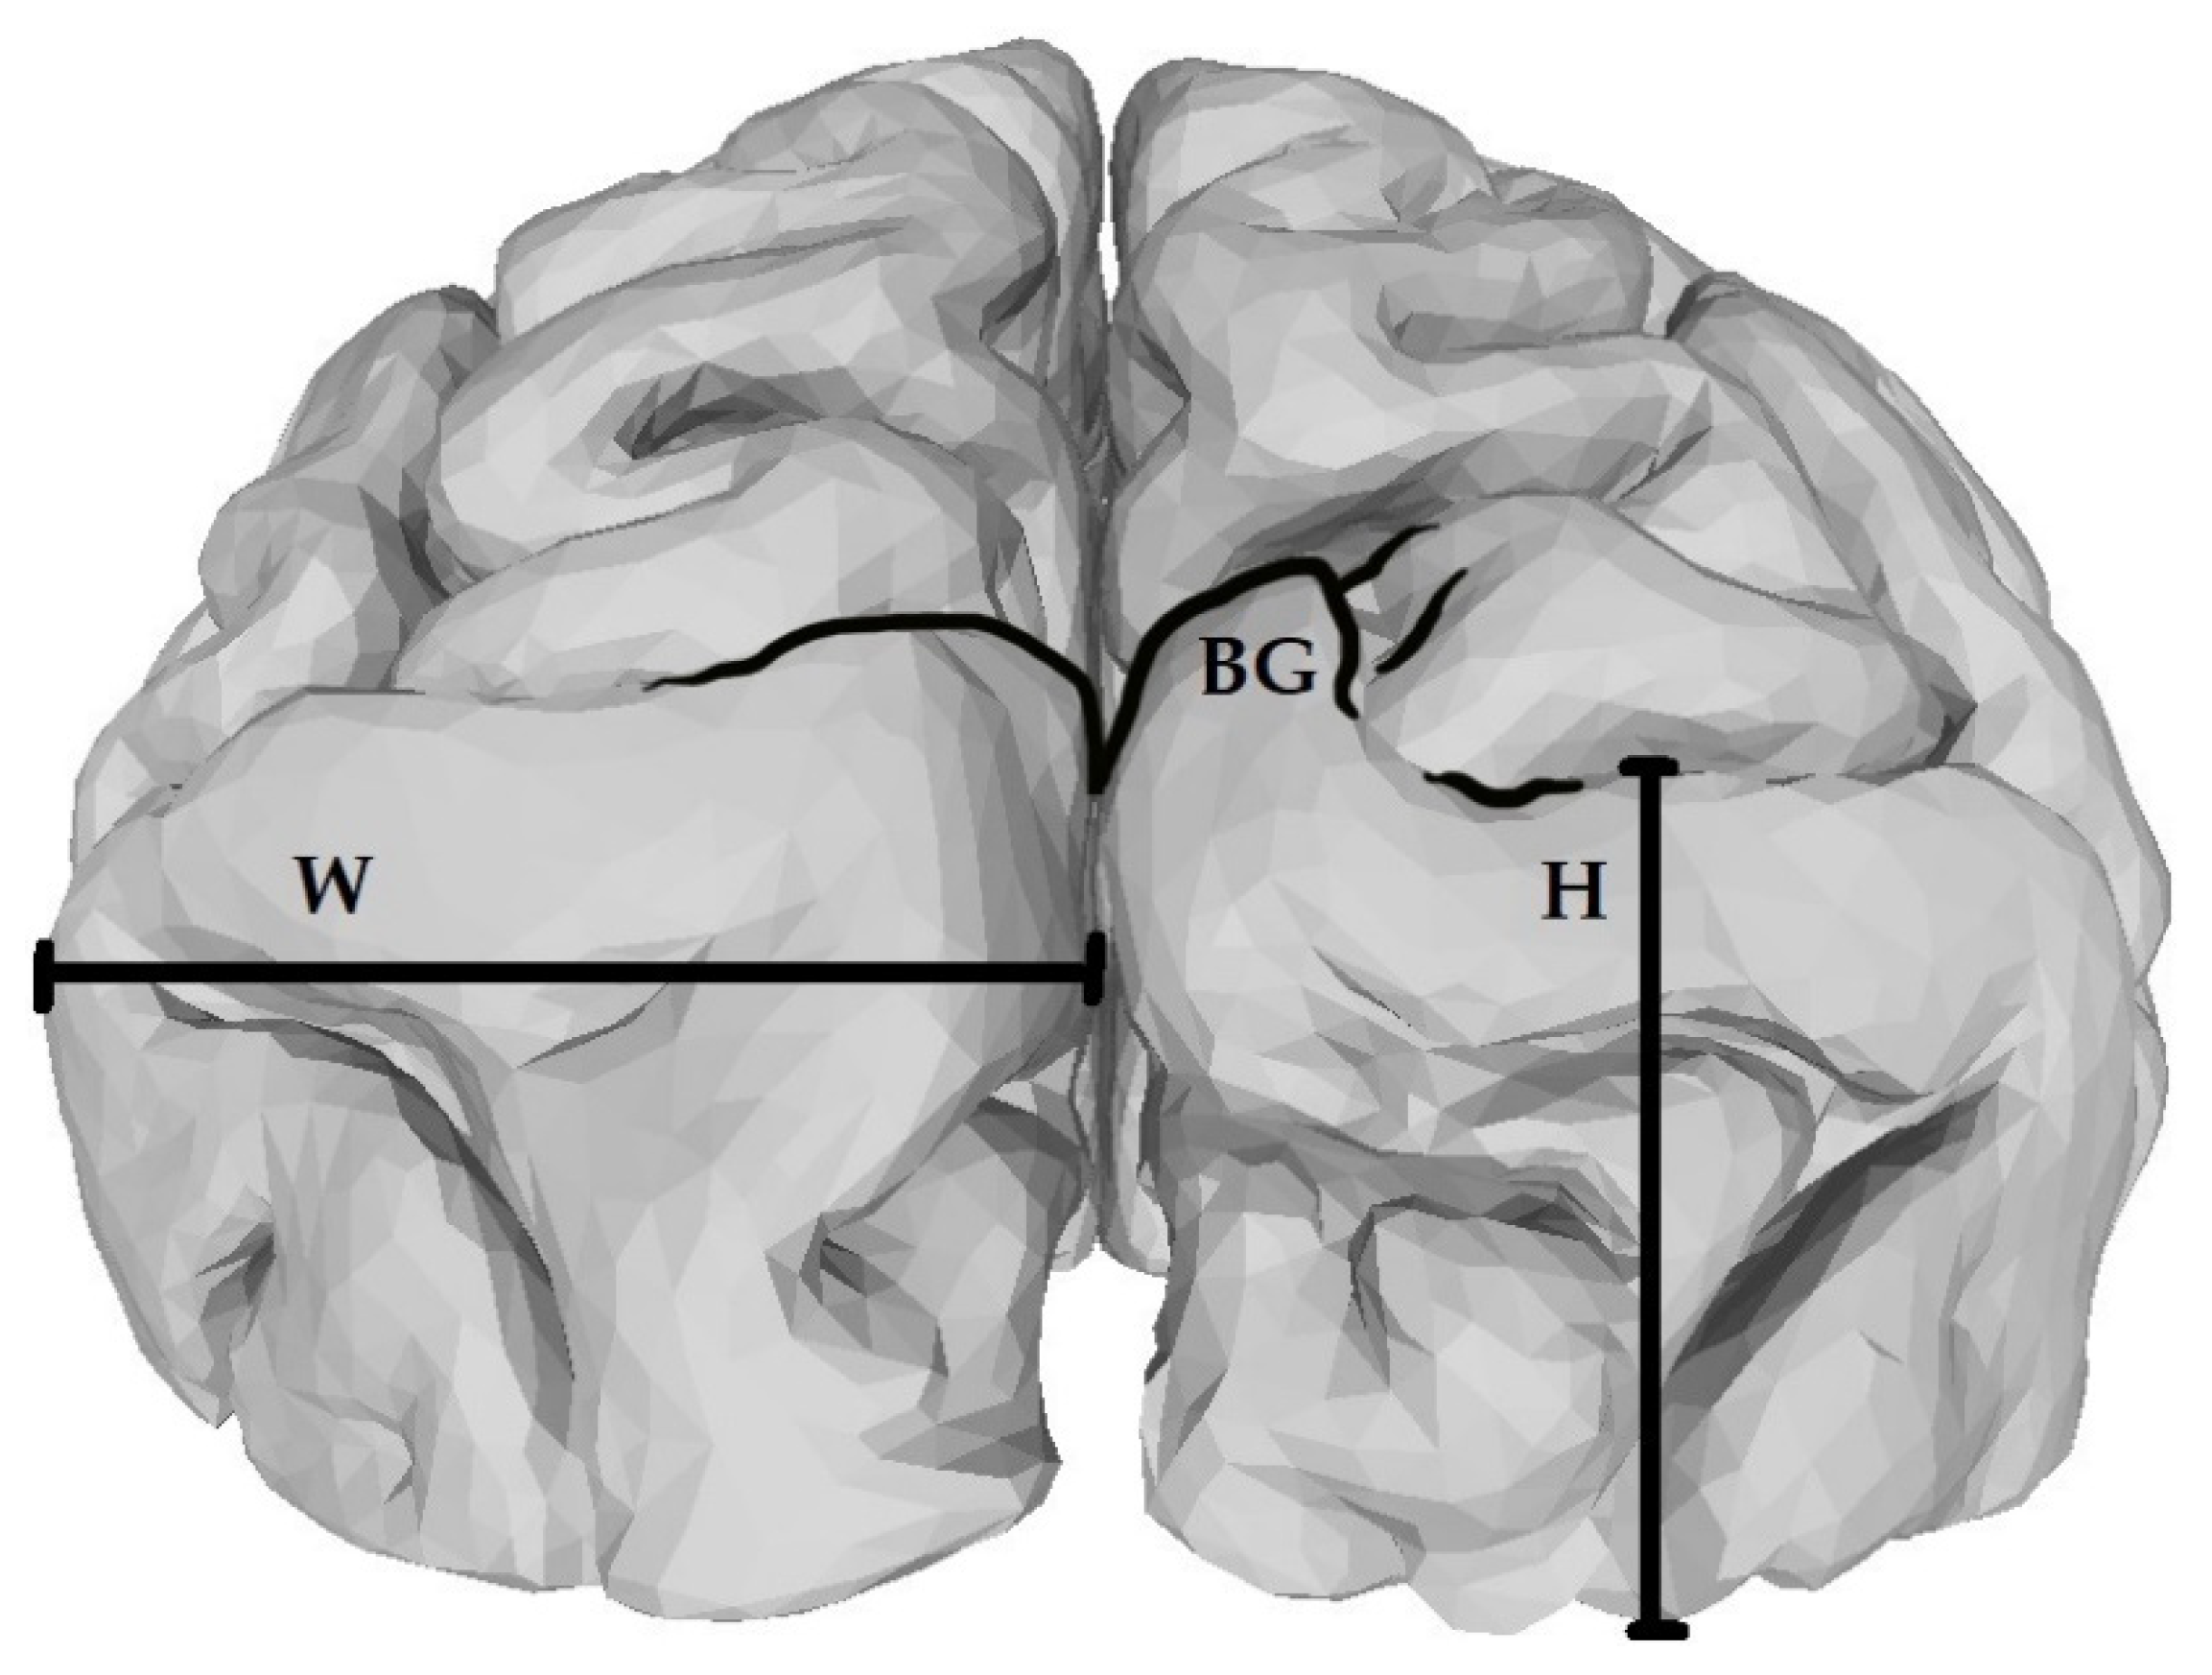
| Subject | Height 1 | Width | Bridge 2 | ||||
|---|---|---|---|---|---|---|---|
| L | R | L | R | L | R | Both | |
| Abby | 36 | 38 | 38 | 37 | N | N | N |
| Agatha | 42 | 44 | 47 | 46 | N | N | N |
| Ahni | 28 | 31 | 35 | 36 | N | N | N |
| Akimel | 42 | 41 | 39 | 41 | N | N | N |
| Alex * | 26 | 27 | 34 | 34 | Y | Y | Y |
| Alpha | 33 | 35 | 36 | 39 | N | N | N |
| Amanda | 41 | 41 | 37 | 37 | N | N | N |
| Angie | 27 | 30 | 35 | 35 | Y | N | N |
| Artemus | 32 | 33 | 35 | 35 | N | Y | N |
| Arthur | 38 | 37 | 33 | 35 | N | N | N |
| Artifee * | 39 | 37 | 37 | 36 | N | N | N |
| Augusta | 38 | 35 | 32 | 34 | N | N | N |
| Azalea | 36 | 38 | 33 | 37 | N | N | N |
| Bahn | 35 | 36 | 33 | 33 | N | N | N |
| Barbara | 42 | 43 | 37 | 37 | N | N | N |
| Bart | 31 | 29 | 37 | 37 | N | Y | N |
| Bashful * | 31 | 32 | 34 | 34 | N | N | N |
| Becca | 36 | 38 | 28 | 30 | N | N | N |
| Beleka | 32 | 31 | 28 | 30 | N | N | N |
| Bernadette | 35 | 39 | 32 | 36 | N | N | N |
| Bernie | 24 | 26 | 27 | 26 | N | N | N |
| Beta | 29 | 29 | 29 | 29 | N | N | N |
| Betty * | 44 | 44 | 36 | 38 | N | N | N |
| Billy * | 33 | 39 | 31 | 33 | N | N | N |
| Bo * | 35 | 33 | 33 | 33 | N | N | N |
| Boka | 42 | 42 | 38 | 37 | Y | Y | Y |
| Brandy | 35 | 34 | 26 | 29 | N | N | N |
| Bria | 34 | 38 | 38 | 40 | Y | Y | Y |
| Brodie | 33 | 33 | 31 | 31 | N | N | N |
| Callie | 40 | 40 | 32 | 32 | N | N | N |
| Carl * | 37 | 32 | 33 | 34 | Y | Y | Y |
| Chechkel | 43 | 42 | 38 | 41 | N | N | N |
| Cheeta * | 45 | 44 | 37 | 39 | N | N | N |
| Cheopi | 34 | 34 | 31 | 32 | N | N | N |
| Chester | 28 | 36 | 37 | 37 | Y | Y | Y |
| Chinook | 35 | 38 | 36 | 36 | N | N | N |
| Chip * | 33 | 34 | 36 | 36 | Y | Y | Y |
| Christa | 43 | 43 | 34 | 37 | N | N | N |
| Chuhia | 37 | 40 | 34 | 34 | N | Y | N |
| Cissie | 38 | 41 | 35 | 37 | N | N | N |
| Coco | 31 | 32 | 37 | 38 | Y | Y | Y |
| Cybil | 27 | 28 | 33 | 34 | Y | Y | Y |
| Dara | 36 | 39 | 36 | 34 | N | N | N |
| David * | 29 | 29 | 37 | 35 | N | Y | N |
| Drew | 37 | 36 | 37 | 40 | N | Y | N |
| Duff | 39 | 39 | 35 | 37 | N | N | N |
| Edwina * | 31 | 32 | 32 | 32 | N | N | N |
| Eesha | 30 | 32 | 33 | 33 | N | N | N |
| Ehsto | 42 | 44 | 45 | 45 | N | N | N |
| Elvira | 39 | 39 | 38 | 37 | Y | Y | Y |
| Elwood * | 39 | 40 | 35 | 35 | N | N | N |
| Emily * | 30 | 32 | 35 | 35 | N | N | N |
| Eniga | 39 | 40 | 35 | 35 | N | N | N |
| Evelyne | 32 | 29 | 29 | 29 | N | N | N |
| Faye | 37 | 38 | 35 | 38 | N | N | N |
| Fiona | 38 | 41 | 38 | 37 | N | N | N |
| Foxy | 37 | 36 | 35 | 35 | N | N | N |
| Frannie | 34 | 35 | 34 | 34 | N | N | N |
| Fritz | 38 | 40 | 34 | 36 | N | N | N |
| Gaygos | 36 | 35 | 39 | 39 | N | N | N |
| Gelb | 37 | 38 | 31 | 33 | N | N | N |
| Gigi | 34 | 33 | 35 | 35 | N | N | N |
| Gimp | 32 | 33 | 36 | 35 | Y | N | N |
| Gisoki | 38 | 40 | 30 | 35 | N | N | N |
| Haakid | 36 | 37 | 38 | 41 | N | N | N |
| Hannah | 35 | 35 | 32 | 33 | N | N | N |
| Helga | 30 | 27 | 33 | 35 | Y | Y | Y |
| Heppie | 42 | 42 | 36 | 37 | N | N | N |
| Hobbes | 30 | 36 | 33 | 32 | Y | N | N |
| Hodari | 36 | 36 | 37 | 37 | N | N | N |
| Huey | 37 | 29 | 37 | 38 | N | Y | N |
| Hug | 31 | 36 | 36 | 36 | N | N | N |
| Huhkalig | 38 | 38 | 35 | 36 | N | N | N |
| Iyk | 31 | 35 | 33 | 35 | N | N | N |
| Jacqueline | 33 | 31 | 34 | 34 | N | Y | N |
| Jadyh | 31 | 33 | 33 | 34 | N | N | N |
| Jake | 38 | 40 | 36 | 37 | N | N | N |
| Jamie | 38 | 37 | 37 | 38 | N | N | N |
| Jane | 33 | 32 | 38 | 37 | N | N | N |
| Jarred * | 32 | 33 | 33 | 33 | N | N | N |
| Jcarter | 35 | 31 | 32 | 34 | N | Y | N |
| Jewelle | 28 | 27 | 30 | 29 | Y | Y | Y |
| Jolson * | 38 | 38 | 39 | 38 | N | N | N |
| Summary Statistics (Known Sample) | ||||
|---|---|---|---|---|
| L Height | R Height | L Width | R Width | |
| N | 15 | 15 | 15 | 15 |
| Min | 26 | 27 | 31 | 32 |
| Max | 45 | 44 | 39 | 39 |
| Sum | 522 | 526 | 522 | 525 |
| Mean | 34.8 | 35.06667 | 34.8 | 35 |
| Std. error | 1.40814 | 1.31 | 0.57 | 0.53 |
| Variance | 29.74286 | 25.78095 | 4.885714 | 4.285714 |
| Stand. dev | 5.453701 | 5.077495 | 2.210365 | 2.070197 |
| Median | 33 | 33 | 35 | 35 |
| 25 percentile | 31 | 32 | 33 | 33 |
| 75 percentile | 39 | 39 | 37 | 36 |
| Skewness | 0.4577742 | 0.476494 | 0.108067 | 0.613097 |
| Kurtosis | −0.4279719 | −0.52249 | −0.60243 | −0.46667 |
| Geom. mean | 34.40985 | 34.73166 | 34.73453 | 34.94389 |
| Coeff. var | 15.67156 | 14.47955 | 6.351624 | 5.914848 |
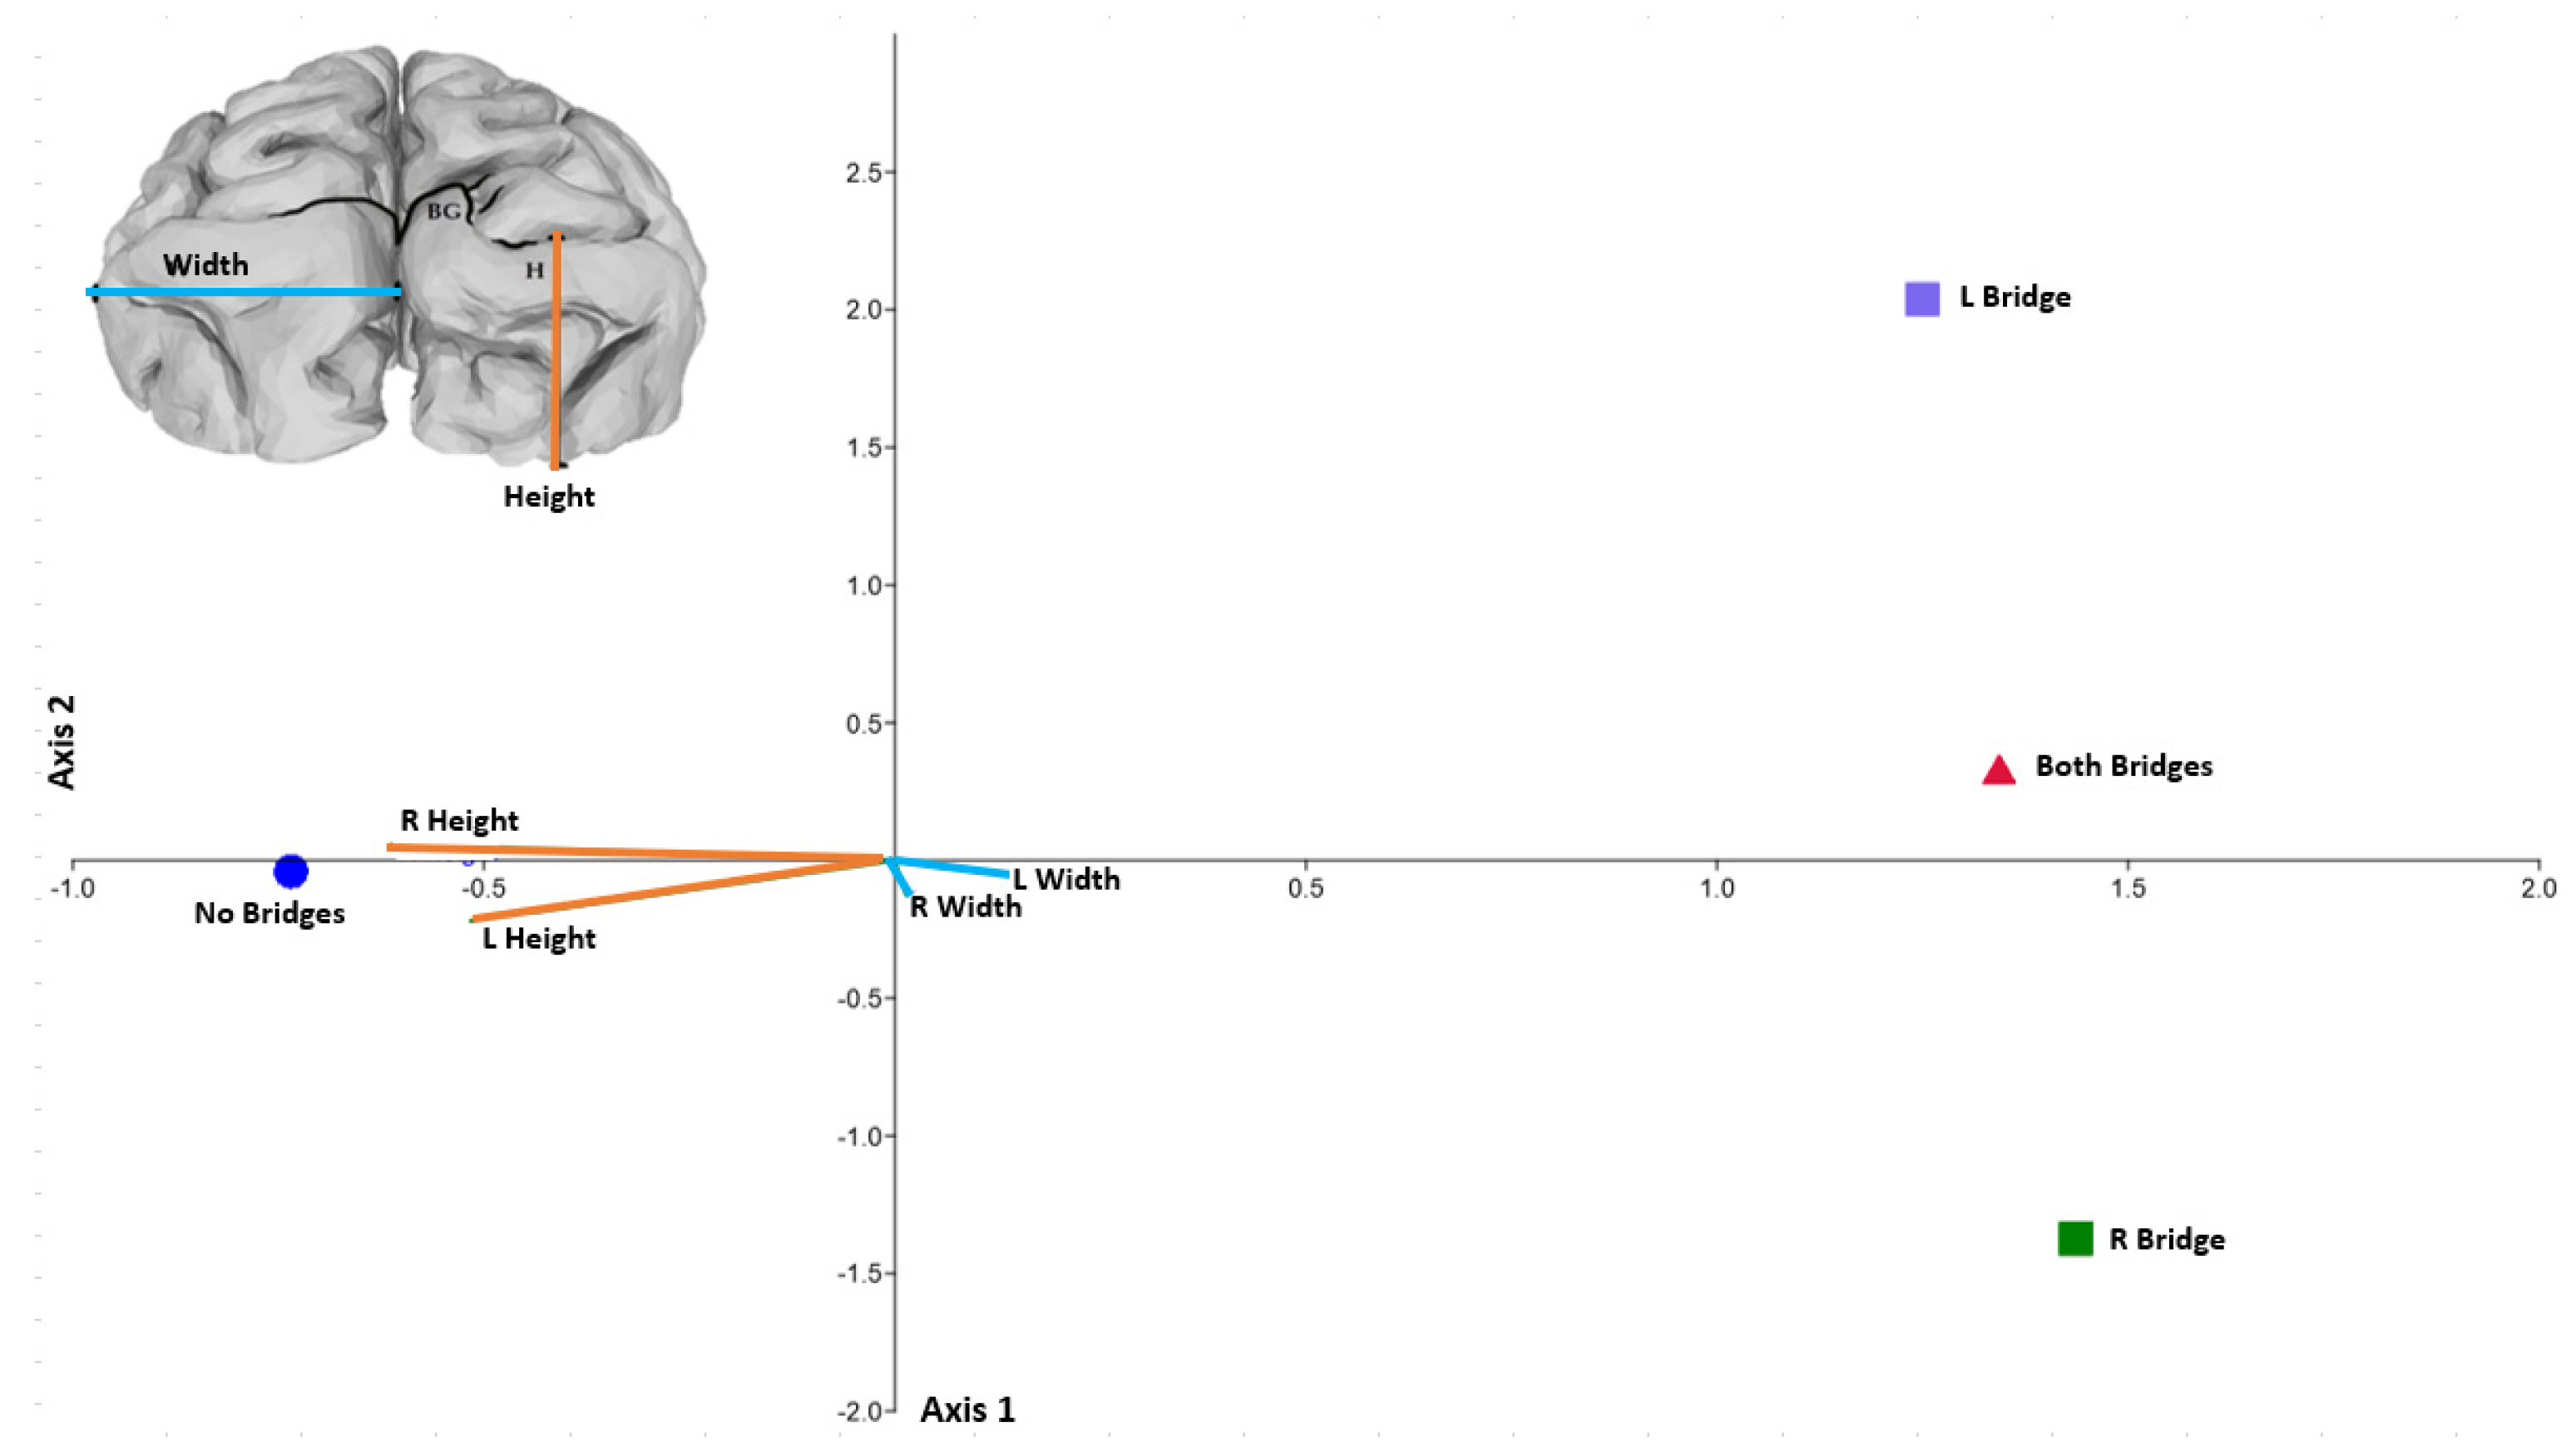
| Axis | Eigenvalue | Percentage | p-Value |
|---|---|---|---|
| 1 | 0.2851 | 89.14 | 0.001 |
| 2 | 0.0347 | 10.86 | 0.002 |
| Correlation Table | |||||||
|---|---|---|---|---|---|---|---|
| L Height | R Height | L Width | R Width | L Bridge 1 | R Bridge 1 | N Bridge 1 | |
| L Height | 0.0001 | 0.0001 | 0.0001 | 0.0022 | 0.0161 | 0.0026 | |
| R Height | 0.0001 | 0.0001 | 0.0001 | 0.0101 | 0.0008 | 0.0002 | |
| L Width | 0.0001 | 0.0001 | 0.0001 | 0.6361 | 0.3920 | 0.4240 | |
| R Width | 0.0001 | 0.0001 | 0.0001 | 0.8226 | 0.7199 | 0.9431 | |
| L Bridge | 0.0022 | 0.0101 | 0.6361 | 0.8226 | 0.0001 | 0.0001 | |
| R Bridge | 0.0161 | 0.0008 | 0.3920 | 0.7199 | 0.0001 | 0.0001 | |
| N Bridge | 0.0026 | 0.0002 | 0.4240 | 0.9431 | 0.0001 | 0.0001 | |
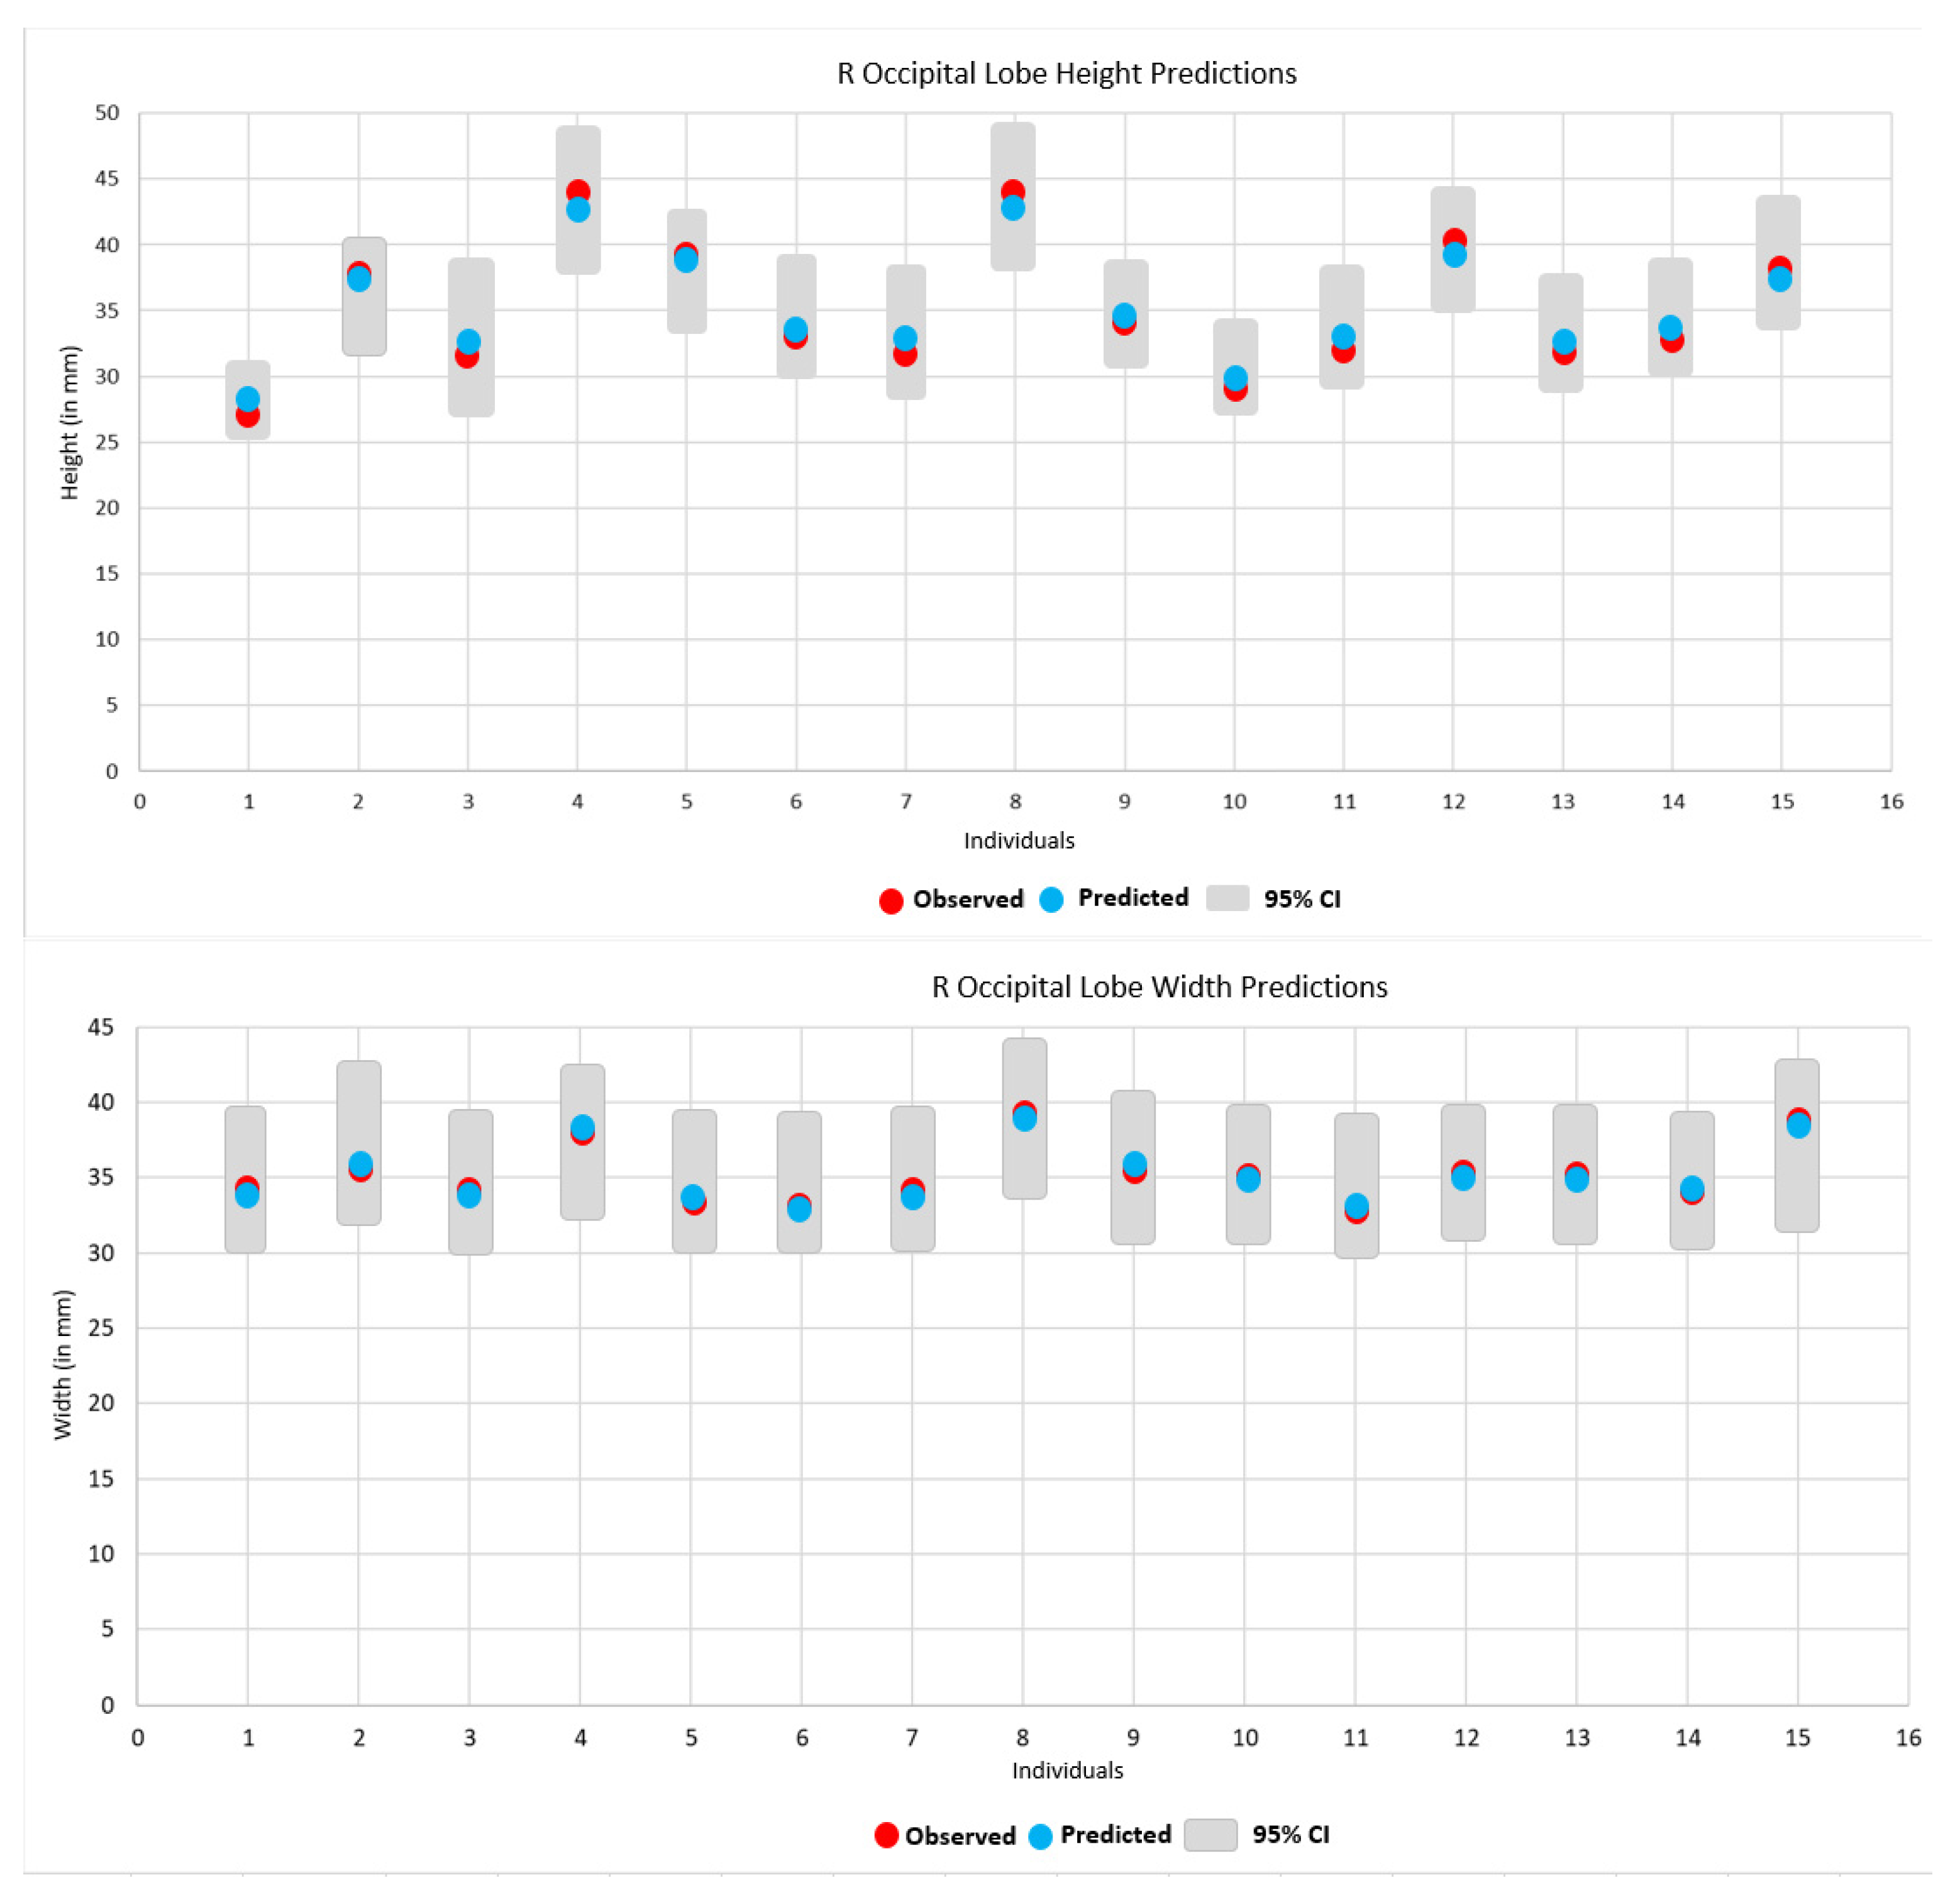
| Right Lobe Regression Statistics | |||||
|---|---|---|---|---|---|
| Metrics | a | b | s.e | r | p |
| R Height | 0.82901 | 0.61434 | 0.11182 | 0.90 | 0.0001 |
| R Width | 0.79421 | 0.73609 | 0.12819 | 0.86 | 0.0001 |
| Left Lobe Regression Statistics | |||||
| Metrics | a | b | s.e | r | p |
| L Height | 0.97553 | 0.07749 | 0.13158 | 0.90 | 0.0001 |
| L Width | 0.94058 | 0.20515 | 0.15181 | 0.86 | 0.0001 |
| Percentage Prediction Error | ||||
|---|---|---|---|---|
| Height | Width | |||
| Subject | L | R | L | R |
| Alex | 1% | 1% | 0% | 0% |
| Artifee | −2% | 1% | −1% | 1% |
| Bashful | 1% | 0% | 0% | 0% |
| Betty | 0% | −1% | 1% | −2% |
| Billy | 4% | −4% | 2% | −1% |
| Bo | −2% | 2% | 0% | 0% |
| Carl | −4% | 4% | 1% | 0% |
| Cheeta | −1% | 0% | 1% | −2% |
| Chip | 1% | 0% | 0% | 0% |
| David | 0% | 1% | −2% | 1% |
| Edwina | 1% | 0% | 0% | 1% |
| Elwood | 0% | −1% | 0% | 0% |
| Emily | 2% | −1% | 0% | 0% |
| Jarred | 1% | 0% | 0% | 0% |
| Jolson | 0% | 0% | −1% | 0% |
| Relability of Prediction Errors | ||||
| Subject | Height | Width | ||
| Alex | 0% | 0% | ||
| Artifee | 3% | 2% | ||
| Bashful | −1% | 0% | ||
| Betty | 0% | −3% | ||
| Billy | −9% | −3% | ||
| Bo | 4% | 1% | ||
| Carl | 8% | −1% | ||
| Cheeta | 1% | −3% | ||
| Chip | −1% | 0% | ||
| David | 1% | 3% | ||
| Edwina | −1% | 1% | ||
| Elwood | −1% | 0% | ||
| Emily | −3% | 0% | ||
| Jarred | −1% | 1% | ||
| Jolson | 0% | 1% | ||
| Prediction of Height and Width | ||||
|---|---|---|---|---|
| Subject | Height 1 | Width 1 | ||
| R | L | R | L | |
| Alex 2 | 28 (27) | 26 (26) | 34 (34) | 34 (34) |
| Artifee 2 | 37 (37) | 39 (39) | 36 (36) | 37 (37) |
| Bashful 2 | 33 (32) | 31 (31) | 34 (34) | 34 (34) |
| Betty 2 | 43 (44) | 43 (44) | 38 (38) | 36 (36) |
| Billy 2 | 39 (39) | 33 (34) | 34 (33) | 31 (31) |
| Bo 2 | 34 (33) | 35 (35) | 34 (33) | 33 (33) |
| Carl 2 | 33 (32) | 37 (37) | 34 (34) | 33 (33) |
| Cheeta 2 | 43 (44) | 44 (45) | 38 (39) | 37 (37) |
| Chip 2 | 34 (34) | 33 (33) | 36 (36) | 36 (36) |
| David 2 | 30 (29) | 29 (29) | 35 (35) | 37 (37) |
| Edwina 2 | 33 (32) | 31 (31) | 33 (32) | 32 (32) |
| Elwood 2 | 39 (40) | 39 (39) | 35 (35) | 35 (35) |
| Emily 2 | 33 (32) | 30 (30) | 35 (35) | 35 (35) |
| Jarred 2 | 34 (33) | 32 (32) | 34 (33) | 33 (33) |
| Jolson 2 | 38 (38) | 38 (38) | 38 (39) | 39 (38) |
| Abby | 38 (38) | 36 (36) | 37 (37) | 38 (39) |
| Agatha | 43 (44) | 41 (42) | 44 (46) | 46 (47) |
| Ahni | 32 (31) | 28 (28) | 36 (36) | 35 (35) |
| Akimel | 40 (41) | 41 (42) | 40 (41) | 39 (39) |
| Alpha | 35 (35) | 33 (33) | 38 (39) | 36 (36) |
| Amanda | 40 (41) | 40 (41) | 37 (37) | 37 (37) |
| Angie | 31 (30) | 27 (27) | 35 (35) | 35 (35) |
| Artemus | 34 (33) | 32 (32) | 35 (35) | 35 (35) |
| Arthur | 37 (38) | 38 (37) | 35 (35) | 33 (33) |
| Augusta | 35 (35) | 38 (38) | 34 (34) | 32 (32) |
| Azalea | 38 (38) | 36 (36) | 37 (37) | 33 (33) |
| Bahn | 36 (36) | 35 (35) | 34 (33) | 33 (33) |
| Barbara | 42 (43) | 41 (42) | 37 (37) | 37 (37) |
| Bart | 30 (29) | 31 (31) | 37 (37) | 37 (37) |
| Becca | 38 (38) | 36 (36) | 31 (30) | 28 (28) |
| Beleka | 32 (31) | 32 (31) | 31 (30) | 28 (28) |
| Bernadette | 39 (39) | 35 (35) | 36 (36) | 32 (32) |
| Bernie | 28 (26) | 24 (24) | 28 (27) | 27 (26) |
| Beta | 30 (29) | 29 (29) | 30 (29) | 29 (29) |
| Boka | 41 (42) | 41 (42) | 37 (37) | 38 (38) |
| Brandy | 34 (34) | 35 (35) | 30 (29) | 26 (26) |
| Bria | 38 (38) | 34 (34) | 39 (40) | 38 (39) |
| Brodie | 34 (33) | 33 (33) | 32 (31) | 31 (31) |
| Callie | 39 (40) | 39 (40) | 33 (32) | 32 (32) |
| Chechkel | 41 (42) | 42 (43) | 40 (41) | 38 (38) |
| Cheopi | 34 (34) | 34 (34) | 33 (32) | 31 (31) |
| Chester | 36 (36) | 28 (28) | 37 (37) | 37 (37) |
| Chinook | 38 (38) | 35 (25) | 36 (37) | 36 (37) |
| Christa | 42 (43) | 42 (43) | 37 (37) | 34 (34) |
| Chuhia | 39 (40) | 37 (37) | 34 (34) | 34 (34) |
| Cissie | 40 (41) | 38 (38) | 37 (37) | 35 (35) |
| Coco | 33 (32) | 31 (31) | 38 (38) | 37 (37) |
| Cybil | 29 (28) | 27 (27) | 34 (34) | 33 (33) |
| Dara | 39 (39) | 36 (36) | 34 (34) | 36 (36) |
| Drew | 36 (36) | 37 (37) | 39 (40) | 37 (37) |
| Duff | 39 (39) | 39 (39) | 37 (37) | 35 (35) |
| Eesha | 33 (32) | 30 (30) | 34 (33) | 33 (33) |
| Ehsto | 43 (44) | 41 (42) | 43 (45) | 44 (45) |
| Elvira | 39 (39) | 39 (39) | 37 (37) | 38 (38) |
| Eniga | 39 (40) | 39 (39) | 35 (35) | 35 (35) |
| Evelyne | 30 (29) | 32 (32) | 30 (29) | 29 (29) |
| Faye | 38 (38) | 37 (37) | 38 (38) | 35 (35) |
| Fiona | 40 (41) | 38 (38) | 37 (37) | 38 (38) |
| Foxy | 36 (36) | 37 (37) | 35 (35) | 35 (35) |
| Frannie | 35 (35) | 34 (34) | 34 (34) | 34 (34) |
| Fritz | 39 (40) | 38 (38) | 36 (36) | 34 (34) |
| Gaygos | 35 (35) | 36 (36) | 38 (39) | 39 (39) |
| Gelb | 38 (38) | 37 (37) | 34 (33) | 31 (31) |
| Gigi | 34 (33) | 34 (34) | 35 (35) | 35 (35) |
| Gimp | 34 (33) | 32 (32) | 35 (35) | 36 (36) |
| Gisoki | 39 (40) | 38 (39) | 35 (35) | 30 (30) |
| Haakid | 37 (37) | 36 (36) | 40 (41) | 38 (38) |
| Hannah | 35 (35) | 35 (35) | 34 (33) | 32 (32) |
| Helga | 28 (27) | 30 (30) | 35 (35) | 33 (33) |
| Heppie | 41 (42) | 41 (42) | 37 (37) | 36 (36) |
| Hobbes | 36 (36) | 30 (30) | 33 (32) | 33 (33) |
| Hodari | 36 (36) | 36 (36) | 37 (37) | 37 (37) |
| Huey | 30 (29) | 37 (37) | 38 (38) | 37 (37) |
| Hug | 36 (36) | 31 (31) | 36 (36) | 36 (36) |
| Huhkalig | 38 (38) | 38 (38) | 36 (36) | 35 (35) |
| Iyk | 35 (35) | 31 (31) | 35 (35) | 33 (33) |
| Jacqueline | 32 (31) | 33 (33) | 34 (34) | 34 (34) |
| Jadyh | 34 (33) | 31 (31) | 34 (34) | 33 (34) |
| Jake | 39 (40) | 38 (38) | 37 (36) | 36 (37) |
| Jamie | 37 (37) | 38 (38) | 38 (38) | 37 (37) |
| Jane | 33 (32) | 33 (33) | 37 (38) | 38 (37) |
| Jcarter | 32 (31) | 35 (35) | 34 (34) | 32 (32) |
| Jewelle | 28 (27) | 28 (28) | 30 (29) | 30 (30) |
Publisher’s Note: MDPI stays neutral with regard to jurisdictional claims in published maps and institutional affiliations. |
© 2021 by the authors. Licensee MDPI, Basel, Switzerland. This article is an open access article distributed under the terms and conditions of the Creative Commons Attribution (CC BY) license (https://creativecommons.org/licenses/by/4.0/).
Share and Cite
Hurst, S.; Holloway, R.; Pearson, A.; Bocko, G. The Significance of Chimpanzee Occipital Asymmetry to Hominin Evolution. Symmetry 2021, 13, 1862. https://doi.org/10.3390/sym13101862
Hurst S, Holloway R, Pearson A, Bocko G. The Significance of Chimpanzee Occipital Asymmetry to Hominin Evolution. Symmetry. 2021; 13(10):1862. https://doi.org/10.3390/sym13101862
Chicago/Turabian StyleHurst, Shawn, Ralph Holloway, Alannah Pearson, and Grace Bocko. 2021. "The Significance of Chimpanzee Occipital Asymmetry to Hominin Evolution" Symmetry 13, no. 10: 1862. https://doi.org/10.3390/sym13101862
APA StyleHurst, S., Holloway, R., Pearson, A., & Bocko, G. (2021). The Significance of Chimpanzee Occipital Asymmetry to Hominin Evolution. Symmetry, 13(10), 1862. https://doi.org/10.3390/sym13101862