Article

Numerical Study on Effects of Pipeline Geometric Parameters on Release Characteristics of Gas Extinguishing Agent

1
School of Chemistry and Chemical Engineering, Nanjing University of Science and Technology, Nanjing 210094, China
2
Poly Orica Management Co., Ltd., Weihai 264200, China
*
Author to whom correspondence should be addressed.
Symmetry 2021, 13(10), 1766; https://doi.org/10.3390/sym13101766
Submission received: 24 August 2021 / Revised: 17 September 2021 / Accepted: 18 September 2021 / Published: 23 September 2021
(This article belongs to the Special Issue Asymmetry in Fire Dynamics and Modelling)

Abstract

:
In order to guide the optimization design of the pipeline network of the aircraft-fixed gas fire extinguishing system and improve its fire extinguishing performance, FLUENT software was used to simulate the influence of pipeline parameters such as diameter, length, and roughness on the release characteristics of the fire extinguishing agent. It can be found that the extinguishing agent can be divided into liquid and vapor extinguishing agents in the fire extinguishing pipeline system during the release. The spatial distribution and proportion of the liquid and vapor extinguishing agents are asymmetric. Results show that the peak value of the pressure drop rate ( d P m a x ) has a good quadratic function relationship with the pipeline diameter ( D ) and the functional relationship is d P m a x = 22.224 + 2.782 D + 0.089 D 2 , which means that the peak value increased significantly with the increase in the pipeline diameter. Moreover, when the pipeline diameter is 25 mm , the average pressure drop rate of the vessel is about 35.02 MPa / s , which is 5.97 times the value of the average pressure drop rate when the pipeline diameter is 10 mm . With the increase in the pipeline diameter, the release time decreases significantly, the mass flow rate increases obviously, while the gasification ratio decreases rapidly at first and then increases slightly. The pipeline length also has a significant influence on the release characteristics of the extinguishing agent. With the increase in the pipeline length, the release time and the gasification ratio increase linearly, while the mass flow rate decreases linearly. Compared with the pipeline diameter and pipeline length, the influence of the pipeline roughness on the release characteristics of the extinguishing agent is weak. With the increase in the pipeline roughness, the release time and the gasification ratio of the extinguishing agent increases slowly, while the mass flow rate decreases slowly.

1. Introduction

An inflight fire can lead to disastrous consequences within a very short time. Therefore, in order to ensure fire safety, the fire extinguishing system has become an essential fixed firefighting facility on an aircraft [1]. Extremely strict requirements were put forward for its fire extinguishing performance. Fire extinguishing performance has been one of the hotspots in fire research in recent years [2,3,4]. Studies have shown that the performance of the extinguishing system is closely related to the geometric characteristics of the piping system [2,5,6,7,8]. In fact, the gas extinguishing agent can usually be divided into liquid and vapor extinguishing agents during the release, and their spatial distribution and proportion are asymmetric. Reasonable design of the pipe network of the fire extinguishing system can greatly improve the safety performance of the aircraft fire protection under the same amount of fire extinguishing agent. Therefore, studying the effects of the pipeline geometric parameters on the flow and release characteristics of the extinguishing agent in the pipeline, which can provide a theoretical basis for the optimization design of the aircraft fire extinguishing system, has important practical value.
In recent years, the research on aircraft fire extinguishing systems mainly focused on the flow and diffusion characteristics of the extinguishing agent in the cabin [9,10,11,12,13,14], there are few studies on the flow and release characteristics of the extinguishing agent in the pipeline. As early as 1976, Williamson [8] studied the flow characteristics of nitrogen-pressurized Halon 1301 agent released through pipelines. The pipe length and pipe roughness affected the flow characteristics of the fire extinguishing agent. In addition, the pipeline length significantly affects the terminal pressure of the pipe, thereby affecting the mass flow rate of the extinguishing agent. A homogeneous model to numerically calculate the pressure drop and the flow rate of the extinguishing agent was established by Elliott et al. [15] to analyze the characteristics of the transient flow of the Halon 1301 agent in the pipeline. Moreover, Tuzla et al. [16] developed a computer code to calculate the single-phase and two-phase flow characteristics of the extinguishing agent in the pipeline and realized the calculation of the pressure drop during the flow of the extinguishing agent in the pipeline. It is worth noting that the pipeline parameters have an important influence on the flow and release characteristics, such as mass flow rate, release duration and phase transition rate of the fire extinguishing agent in the pipeline, which further affects the spatial movement and concentration distribution of the fire extinguishing agent in the protected space, thus affecting the overall firefighting efficacy of the aircraft fire extinguishing system. That is, the study of the influence of pipeline characteristics on the release behavior of fire extinguishing agents has great scientific significance and practical application value.
With the rapid development of computer science and technology, computational fluid dynamics (CFD) technology, as a numerical method, is gradually becoming mature, and its application in fluid machinery is becoming more and more extensive. As the currently well-developed and commonly used CFD software, FLUENT, which is with a variety of optional solvers, powerful grid support capabilities and pre-processing functions, is widely used in simulating turbulent flow, heat transfer, chemical reactions, and multiphase fluid flow. Using FLUENT software, Kim et al. [17] numerically studied the flow characteristics of the Halon 1301 agent in the pipeline of the aircraft extinguishing system. It was found that the flow characteristics of the agent were significantly affected by the rupture surface area and the pipeline diameter mainly due to the change of the flow resistance. Using FLUENT software, Bykov et al. [18] performed the simulation of piston acceleration process in the combustion light-gas gun and validated the simulation models based on experimental data. It is shown that the developed models could provide adequate accuracy for determining the system’s intraballistic characteristics. In order to optimize automatic fire extinguishing system designs for military ground vehicles, using CFD techniques, Korivi et al. [19] developed a unique physics-based modeling and simulation methodology, which is applicable to the simulation of the transport of various gas suppressants in pipes. The simulation results match qualitatively very well for overall suppression time with the test results. Moradikazerouni et al. [20] developed a unique 0D/3D approach for modeling a closed pressurized cylindrical tank driven by natural convection. It is shown that the proposed method accounts for different flow dynamics and can be employed to derive an adaptive low-dimensional performance model for different applications. Therefore, it is scientifically feasible to use FLUENT to simulate the release and flow behavior of the fire extinguishing agent Halon 1301 in the pipeline.
Moreover, in order to fully promote the protection of the ozone layer, the European Union stipulated that the use of halon in aircraft fire extinguishing systems should be completely stopped before 2040. However, at present, the airworthiness standards of aircraft fire extinguishing systems are mainly for Halon 1301 fire extinguishing systems. Before there is a suitable alternative system, the Halon 1301 fixed-fire extinguishing system is still a reliable and necessary system for aircraft fire extinguishing occasions. It is of great significance to study the influence of the parameters of the fire extinguishing pipeline in the fire extinguishing system on the release and flow characteristics of fire extinguishing agents such as Halon 1301. However, the influence mechanism of the pipeline geometric parameters on the release and flow characteristics of the gas fire extinguishing agent is unclear, especially in terms of gasification characteristics during the pipeline flow. Therefore, based on the pipeline fire extinguishing system simulation model, the influence of pipeline geometric parameters including pipeline diameter, pipeline length, and pipeline roughness on the release and flow behavior of the fire extinguishing agent including liquid and vapor extinguishing agents is studied in this work. The liquid and vapor extinguishing agents were symmetrically investigated to comprehensively understand the flow characteristics of the extinguishing agent. This work is believed to make up for the lack of aircraft fire extinguishing systems in the study of fire extinguishing pipelines and guide the optimization design of the pipe network of the aircraft fire extinguishing system.

2. Numerical and Experimental Setup

2.1. Governing Equations and Boundary Conditions

As shown in Figure 1a, a three-dimensional unsteady state simulation model of the fire extinguishing system was developed by using FLUENT software to study the flow characteristics of the extinguishing agent in the pipeline. As shown in Figure 1b, the unstructured grids were divided by the Robust (Octree) method, and the grid type was set as tetrahedral/mixed, to improve the grid adaptability to the complex structure of the fire extinguishing system. In order to reduce the gradients of physical parameters in the iterative calculations and improve the stability and accuracy of the solution, meshes were refined in the wall area, the pipe connection area, the pipe diameter change area, and the pipe outlet area.
Since the flow of nitrogen-pressurized Halon 1301 agent in the pipeline was a gas–liquid dispersed bubble flow with less than 0.01 inches bubble diameters [8], the mixture model is used to simulate the gas–liquid two-phase flow in this study. The process of the extinguishing agent flowing in the pipeline is considered as a gas–liquid homogeneous balanced multi-phase flow, and each phase shared the same pressure and velocity field, and the slip velocity between phases is ignored. In the mixture model, the governing equations describing the flow are presented as follows:
Continuity equation [21]:
t ( ρ m ) + · ( ρ m v m ) = 0
Momentum equation [21]:
t ( ρ m v m ) + · ( ρ m v m 2 ) = P + · [ μ m ( v m + v m T ) ] + ρ m g + F + · ( k = 1 n α k ρ k v d r , k 2 )
Energy equation [21]:
t k = 1 n ( α k ρ k E k ) + · k = 1 n ( α k v k ( ρ k E k + P ) ) = · ( k e f f T ) + S E
Volume fraction of discrete phase P [21]:
t ( α p ρ p ) + · ( α p ρ p v m ) = S M
In the formulas, v m = k = 1 n α k ρ k v k ρ m represents the average mass velocity; ρ m = k = 1 n α k ρ k is the mixed density; F is a body force; v d r , k is the drift velocity for secondary phase k . P is the pressure; μ m = k = 1 n α k μ k + μ t , m represents the mixed viscosity; μ t , m is the vortex viscosity of mixed turbulence; E k = h k P ρ k + v k 2 2 represents the internal energy; k e f f = k = 1 n α k ( k k + k t ) is the effective thermal conductivity; α k is the volume fraction of k phase; n is the number of phases; S M = m ˙ v l m ˙ l v represents the interphase mass transfer rate [21]. The turbulence model is the realizable k-ε model and the near-wall region adopts a scalable wall function approach.

2.2. Phase Transition Model

According to Karathanassis’s [22] study, when simulating the compressible flow of nozzle and high-pressure pipeline, the molecular motion theory (Hertz–Knudsen equation) method can obtain the best accuracy between the thermodynamic equilibrium theory, the bubble dynamics method and the semiempirical correlation for the fast boiling correction method. Since high pressures still occur during the release of the extinguishing agent through the pipeline, the Hertz–Knudsen equation was adopted to describe the release of the extinguishing agent in the pipeline. The Hertz–Knudsen equation was combined with the Clapeyron–Clausius equation to describe the evaporation and condensation processes as follows:
The evaporation process ( T > T s a t ) can be expressed as [23]:
m ˙ l v = r e α l ρ l T T s a t T s a t
The condensation process ( T < T s a t ) can be expressed as [23]:
m ˙ v l = r c α v ρ v T T s a t T s a t
In the formulas, T s a t represents the saturation temperature of the medium. r e and r c are the time relaxation factors to adjust the rate of phase transition. The values of r e and r c have significant effects on the accuracy of numerical simulations. Convergence problems will happen when r e and r c have large values, while deviation problems will occur when r e and r c have small values. In this study, the values of r e and r c were both set as 100 according to Fang’s [24] study.

2.3. Numerical Process

In this study, the geometric model is divided into unstructured grids throughout the structure by using ICEM CFD software. In order to ensure grid independence, grid sensitivity was studied. As can be seen from Figure 2 that the simulation results of the bottle pressure with the cell numbers 104,806 and 224,948 are almost consistent. However, the solution time of the latter was about twice that of the former. Considering the calculation cost and grid sensitivity, the calculation domain was divided into 104806 cells in this study. Except that the outlet of the pipeline is set as the pressure outlet boundary condition, the rest are set as the wall boundary conditions. The phase transition model is accomplished by using a User-Defined Function (UDF). The pressure-based separated implicit unsteady solver was employed for numerical calculation. Each parameter in the model was discretized in a second-order accuracy format. During the simulation, the time step was set to be 1 × 10 4   s before convergence, and it was set to be 2 × 10 4   s after convergence. Except that the convergence criterion of the energy equation was set as 1 × 10 6 , the convergence criteria of the other equations were set as 1 × 10 3 . Using a computer with an Intel Xeon E5-2670 CPU for the simulation, it took about 21 h to complete the simulation of one case.

2.4. Verification of Simulation Model

As shown in Figure 3, an experimental apparatus that is consistent with the simulation model was set up for the extinguishing agent release experiments. In the experimental device, the fire extinguishing bottle was connected to the valve inlet through a right-angled pipe, and the valve outlet was connected to a straight-through pipe. The extinguishing bottle which had a volume of about 1.4 L was made of 316 L stainless steel. There was a pressure transmitter installed at the top of the extinguishing bottle to detect the pressure in the vessel, and another pressure transmitter was installed at the end of the pipeline to detect the pressure at the pipeline outlet. Both transmitters have a range of 0~5 MPa and a precision of ±0.04%.
The experimental steps mainly include: Firstly, the fire extinguishing bottle was vacuumed. Secondly, 1.195   kg of the Halon 1301 agent was filled into the extinguishing bottle. Thirdly, nitrogen was slowly charged into the extinguishing bottle to increase its pressure to 4.832 MPa . Then, the extinguishing bottle was kept at a room temperature of 293.25 K for 1 h to make the extinguishing agent and the nitrogen sufficiently dissolved. Finally, the valve was quickly opened to test the release characteristics of the extinguishing agent.
As shown in Figure 4, the vessel pressure of the simulation results and the experimental results during the release are in good agreement, and the trend of the two curves is consistent, which indicates that the simulation model established in this study is reliable. Therefore, it was employed to carry out the subsequent simulation of the release and flow process of the extinguishing agent in the pipelines with different geometric parameters.

3. Results and Discussion

The flow of the gas extinguishing agent from the container to the pipeline is a typical unsteady flow process. In this process, the extinguishing agent is not only constrained by the pipeline wall but also has significant heat exchange with the pipeline wall and obvious gasification phase transition. Therefore, the release and flow process of the gas extinguishing agent is a considerably transient and complex gas–liquid two-phase flow, which results in that the spatial distribution and proportion of liquid and vapor extinguishing agents are asymmetric. And their characteristics are inevitably affected by the geometric parameters of the pipeline such as diameter, length, and roughness, which will be discussed in the following sections.

3.1. Effects of Pipeline Diameter on the Flow Characteristics

The pipe diameter is an important technical parameter of pipelines, which often has significant effects on the flow characteristics of their internal medium. In order to study the influence of the pipeline diameter on the flow and release characteristics of the Halon 1301 agent, the diameters of the Pipe 1 and Pipe 2 shown in Figure 3 were both set to 10 mm , 15 mm , 20 mm and 25 mm respectively, which is for the contrast test with the same filling status of the extinguishing bottle. The lengths of Pipe 1 and Pipe 2 were set to 220 mm and 427.7 mm , respectively. The initial filling pressure of the extinguishing bottle was 4.832 MPa and the filling amount of the extinguishing agent was 1.195 kg . At the temperature of 294.25 K , the volume percentages of the Halon 1301 agent in the gas phase and liquid phase were 47.21 % and 94.90 % , respectively, and the remaining proportions were occupied by the compressed nitrogen.

3.1.1. Effects of Pipeline Diameter on the Release Time

The release duration of the extinguishing agent is an important target to measure the performance of the gas extinguishing system. The length of the release time significantly affects the spatial and temporal distribution characteristics of the extinguishing agent in protected spaces, which not only affects the fire extinguishing rate but also affects the interaction time between the extinguishing agent and high-temperature flames, thereby affecting the amount of toxic and harmful products generated by the thermal decomposition of the extinguishing agent [25,26,27].
Figure 5a,b show the variation curves of the vessel pressure and the pressure drop rate during the release under the conditions of different pipeline diameters, respectively. It can be seen from Figure 5a that, under the conditions of the same filling amount of the extinguishing agent, the total release duration decreased significantly with the increase in the pipeline diameter. As shown in Figure 5b, the overall pressure drop rate of the vessel increases with the increase in the pipeline diameter. In addition, at the initial stage of the release, there is an obvious peak occurring in the pressure drop rate curve, and the peak value increased significantly with the increase in the pipeline diameter. In this study, the values of the pressure drop peak corresponding to the four pipeline diameters from thin to thick were 14.72 MPa / s , 39.06 MPa / s , 69.73 MPa / s and 103.01 MPa / s , respectively. It can be found that the peak value has a good quadratic function relationship with the pipeline diameter, and the fitting result is shown in Equation (7).
d P m a x = 22.224 + 2.782 D + 0.089 D 2
where d P m a x represents the maximum pressure drop rate of the vessel ( MPa / s ); D denotes the pipeline diameter ( mm ).
In order to reveal the release process of the extinguishing agent, the pressure and the pressure drop rate of the vessel and the mass flow rate of the extinguishing agent at the pipeline outlet were compared, as shown in Figure 5c, it can be seen from the figure that the pressure of the vessel drops rapidly at the beginning of the release, and an obvious peak occurs in the pressure drop rate curve of the vessel. At this moment, the extinguishing agent was about to be sprayed out of the pipeline. Then the mass flow rate of the extinguishing agent at the pipeline outlet increases rapidly to the peak value, while the pressure drop rate of the vessel decreased rapidly. Therefore, it can be inferred that this stage was the process of rapid filling of the pipeline by the extinguishing agent. In this paper, this stage was named Phase I: the rapid pipeline filling by the extinguishing agent.
Then, the mass flow rate of the extinguishing agent at the pipeline outlet which is decreased slowly at first and then decreased rapidly shows a two-stage trend. While the pressure drop rate of the vessel decreased at first and then increased. In addition, by comparing the mass flow rate of the extinguishing agent with that of the nitrogen, it can be seen that the mass flow rate of the nitrogen started to increase slowly from the inflection point (as shown by the red arrow in Figure 5c) of the above mentioned two-stage trend, indicating that the compressed nitrogen in the vessel begins to release gradually at this moment. Thus, it can be inferred that the first-half stage (Part 1) should be the continuous release of the liquid extinguishing agent in the vessel, and the remained half stage (Part 2) was the release of the residual liquid extinguishing agent in the pipeline after the complete release of liquid extinguishing agent in the vessel. In this paper, this phase was named Phase II: the concentrated release of the liquid extinguishing agent.
Finally, the mass flow rate of the extinguishing agent and the compressed nitrogen at the pipeline outlet decreased gradually until the release ended. Meanwhile, the pressure drop rate of the vessel decreased gradually to zero. It can be speculated that this stage should be the release of the residual gaseous extinguishing agent and the compressed nitrogen through the pipeline. In this paper, it was named Phase III: the release of the residual gases.
In order to analyze the difference in the release time of the extinguishing agent under different pipeline diameter conditions, as shown in Figure 5d, the duration of the liquid extinguishing agent ( t L 1301 ) , the total release time of the extinguishing agent ( t T 1301 ) , and the percentage of the liquid release time to the total release time ( P e r t ) were plotted against the pipeline diameter. It can be seen from the figure that t L 1301 and t T 1301 both decreased significantly with the increase in the pipeline diameter, which can be fitted by the exponential functions. The fitting results are shown as Equations (8) and (9), respectively. However, P e r t did not change significantly with the increase in the pipeline diameter, which means that under the same conditions of the extinguishing bottle and the pipeline length, increasing the pipeline diameter is conducive to the rapid release of the extinguishing agent. Especially when the pipeline diameter was relatively small (such as 10 mm and 15 mm ), with the increase in the pipeline diameter, the release duration of the extinguishing agent decreased significantly, while the decreasing rate of the release duration slows down gradually. Combined with the aforementioned analysis of the release process, it can be inferred that the increase in the pipeline diameter not only increased the mass flow rate of the liquid extinguishing agent flowing into the pipeline but also reduced the resistance loss during the flow, which was conducive to the rapid release of the extinguishing agent. However, due to the limited driving capacity of the extinguishing bottle, the pressure drop rate of the vessel increased significantly with the increase in the pipeline diameter, resulting in the decrease in the driving force for the extinguishing agent, which in turn was not conducive to the rapid release of the extinguishing agent.
t L 1301 = 0.082 + 5.574 × 0.802 D
t T 1301 = 0.123 + 6.784 × 0.823 D
where t L 1301 and t T 1301 denote the liquid release time ( s ) and the total release time ( s ) of the extinguishing agent, respectively; D denotes the pipeline diameter ( mm ).

3.1.2. Effects of Pipeline Diameter on the Mass Flow Rate

Mass flow rate is one of the important parameters to characterize the release rate of fire extinguishing systems, which directly reflects the amount of the extinguishing agent released into the protected space per unit time, and has a vital influence on the establishment of the extinguishing concentration in protected spaces. There is obvious vaporization during the release of the Halon 1301 agent in the pipeline, and the vaporization rate not only affects the release rate of the extinguishing agent but also affects its flow and diffusion characteristics in protected spaces. Therefore, it is necessary to study the characteristics of the mass flow rates of the liquid and gaseous extinguishing agents flowing in the pipeline, respectively.
Figure 6a,b show the mass flow rate curves of the liquid and gaseous extinguishing agents at the pipeline outlet under different pipeline diameter conditions, respectively. It can be seen from these two figures that with the increase in the pipeline diameter, the mass flow rates of the liquid extinguishing agent and the gaseous extinguishing agent both increased significantly, while the release durations of them both decreased significantly. In addition, as shown in Figure 6a, when the pipeline diameter was relatively small (10 mm and 15 mm ), the mass flow rate of the liquid extinguishing agent in Phase II decreased monotonically, while when the pipeline diameter was relatively large (20 mm and 25 mm ), the mass flow rate of the liquid extinguishing agent in Phase II showed a non-monotonic trend, as shown by the ellipses in Figure 6a, which indicates that when the pipeline diameter is large, the gas–liquid two-phase flow of the extinguishing agent in the pipeline becomes more complicated.
In order to further analyze the difference of the mass flow rate of the extinguishing agent under different pipeline diameter conditions, taking the maximum (25 mm ) and the minimum (10 mm ) pipeline diameters in this study as examples, the mass flow rates of the extinguishing agent and the compressed nitrogen, and the pressure drop rate of the vessel were plotted, as shown in Figure 6c,d, respectively. It can be seen from Figure 6c,d that the mass flow rate of the gaseous extinguishing agent is much lower than that of the liquid extinguishing agent in the whole release process under these two different pipeline diameter conditions and the release process presented the same stage characteristics described in Section 3.1.1, namely: Phase I: rapid filling of the pipeline by the extinguishing agent; Phase II: concentrated release of the liquid extinguishing agent; Phase III: release of the residual gases. By comparing Figure 6c with Figure 6d, it can be found that there are significant differences between the release characteristics in Phase II under the two different pipeline diameter conditions. Firstly, in the Part 1 stage, when the pipeline diameter was 10   mm , the pressure drop rate of the vessel was relatively small (the average value was about 5.86 MPa / s ) and decreases slowly with time, and the mass flow rate of the liquid extinguishing agent decreased while that of the gaseous extinguishing agent increased, indicating that the gasification rate of the extinguishing agent increased continuously during this stage; While, when the pipeline diameter was 25 mm , the pressure drop rate of the vessel was significantly larger than that of 10   mm (the average value was about 35.02 MPa / s ) and decreased rapidly with time, and the mass flow rate of the liquid extinguishing agent showed a non-monotonic variation trend, and that of the gaseous extinguishing agent decreased rapidly at first and then increased significantly, which indicates that the gasification rate of the extinguishing agent decreased rapidly at first and then increased significantly during this stage. Secondly, in the Part 2 stage, when the pipeline diameter was 10   mm , the mass flow rate of the gaseous extinguishing agent decreased with time, and that of the nitrogen increased slowly at the beginning of this stage; While, when the pipeline diameter was 25   mm , the mass flow rate of the gaseous extinguishing agent decreased rapidly at first and then increased slowly, and that of the nitrogen increased significantly at the beginning of this stage, it can be inferred that the rapid outflow of the compressed nitrogen accelerated the gasification rate of the extinguishing agent to a certain extent.
In order to compare the differences between the liquid mass flow rate and the total mass flow rate of the extinguishing agent, taking the case with the pipeline diameter of 20   mm as an example, the variation curves of the two mass flow rates with time were shown in Figure 7a. As can be seen from the figure, the liquid phase mass flow rate of the extinguishing agent was close to the total mass flow rate throughout the release process, and the trend of the two curves was consistent. The maximum difference between the two parameters was 0.69   kg / s (about 6.6 % of the total mass flow rate at that moment), which showed that the release of the extinguishing agent was still dominated by the liquid agent under this relatively large pipeline diameter.
Considering that the extinguishing agent was mainly released in Phase II, in order to analyze the difference of the release rate of the extinguishing agent under different pipeline diameter conditions, the maximum mass flow rates of the liquid extinguishing agent and that of the total extinguishing agent (represented by m ˙ L m a x and m ˙ T m a x , respectively) and the average mass flow rates of the liquid extinguishing agent and that of the total extinguishing agent (represented by m ˙ L a v g and m ˙ T a v g , respectively) in Phase II were plotted against the pipeline diameter, as shown in Figure 7b. It can be seen from the figure that the four parameters all showed a good quadratic function relationship with the pipeline diameter, and the fitting results are shown in Equations (10)–(13) respectively. In addition, both m ˙ T m a x m ˙ L m a x and m ˙ T a v g m ˙ L a v g increased gradually with the increase in the pipeline diameter, indicating that the gasification rate of the extinguishing agent during the release increased with the increase in the pipeline diameter. This may be because the gas–liquid two-phase flow of the extinguishing agent became more complex with the increase in the pipeline diameter.
m ˙ L m a x = 1.676 + 0.250 D + 0.022 D 2
m ˙ T m a x = 1.117 + 0.161 D + 0.026 D 2
m ˙ L a v g = 1.290 + 0.135 D + 0.015 D 2
m ˙ T a v g = 1.203 + 0.111 D + 0.017 D 2
where m ˙ L m a x and m ˙ T m a x denote the maximum mass flow rates of the liquid extinguishing agent and that of the total extinguishing agent ( kg / s ), respectively; m ˙ L a v g and m ˙ T a v g denote the average mass flow rates of the liquid extinguishing agent and that of the total extinguishing agent in Phase II ( kg / s ), respectively; D denotes the pipe diameter ( mm ).
In order to further analyze the influence of the pipeline diameter on the gasification rate of the extinguishing agent during the release, the per unit area mass flow rates of the extinguishing agent were plotted against the pipeline diameter, as shown in Figure 7c (the maximum mass flow rate per unit area of the liquid extinguishing agent and that of the total extinguishing agent were represented by m ¯ ˙ L m a x and m ¯ ˙ T m a x , respectively, and the average mass flow rate per unit area of the liquid extinguishing agent and that of the total extinguishing agent in Phase II were represented by m ¯ ˙ L a v g and m ¯ ˙ T a v g , respectively). It can be seen from the figure that with the increase in the pipeline diameter, m ¯ ˙ L m a x , m ¯ ˙ T m a x , m ¯ ˙ L a v g and m ¯ ˙ T a v g all increased at first and then decreased. Under the conditions of the four pipeline diameters adopted in this study, m ¯ ˙ L m a x and m ¯ ˙ T m a x varied slightly with the pipeline diameter (the maximum values of these two parameters are 1.06 times and 1.04 times of the minimum values, respectively), and their maximum values both appear at the pipeline diameter of 15 mm . While the variations of m ¯ ˙ L a v g and m ¯ ˙ T a v g with the pipeline diameter are larger than m ¯ ˙ L m a x and m ¯ ˙ T m a x (the maximum values of m ¯ ˙ L a v g and m ¯ ˙ T a v g are 1.18 times and 1.20 times of the minimum values, respectively), and the maximum values of m ¯ ˙ L a v g and m ¯ ˙ T a v g both appear at the pipeline diameter of 20 mm .
The reasons why the aforementioned maximum mass flow rate per unit area varied slightly with the pipeline diameter may be due to the fact that, on the one hand, the flow resistance of the extinguishing agent in the pipeline decreased with the increase in the pipeline diameter, which was conducive to the increase in the maximum velocity of the extinguishing agent; On the other hand, the pressure drop rate of the vessel increased with the increase in the pipeline diameter, resulting in the decrease in the driving force for the extinguishing agent, which in turn reduced the maximum velocity of the extinguishing agent. For the average mass flow rate per unit area, there were more influencing factors. In addition to the above reasons, it was also affected by two other aspects: on the one hand, the large pipeline diameter was conducive to significantly reduce the release time of the extinguishing agent (as shown in Figure 5d), which reduced the heat absorption of the extinguishing agent from the environment and reduced its gasification rate; On the other hand, it may also be related to the flow state in the Part 2 stage. The large cross-sectional area of the pipeline made the liquid extinguishing agent and the compressed nitrogen mixed intensely in this stage, and the nitrogen flowed out of the pipe too quickly, which was not conducive to the full utilization of its driving capability. In addition, it can be seen from Figure 7c that when the pipeline diameter was large, m ¯ ˙ T m a x m ¯ ˙ L m a x and m ¯ ˙ T a v g m ¯ ˙ L a v g were significantly greater than those when the pipeline diameter was small, and the values of these two parameters at the pipeline diameter of 25   mm were 2.1 times and 1.7 times of those at the pipeline diameter of 10   mm , respectively. This indicated that the large pipeline diameter will accelerate the gasification rate of the extinguishing agent during the pipe flow, which may be due to the pressure drop rate of the vessel increased with the increase in the pipeline diameter so that the pressure of the extinguishing agent during the flow decreased and the degree of the superheat increased.

3.1.3. Effects of Pipeline Diameter on the Gasification Ratio

The vaporization of the extinguishing agent occurs during the flow in the pipeline, which not only affects the transport efficiency of the extinguishing agent in the pipeline and then affects its mass flow rate and release time, but also affects its performance of heat absorption through gasification in the protected space. Therefore, it is necessary to study the gasification characteristics of the extinguishing agent under different pipeline diameters.
Figure 8 shows the comparison curves between the flow velocity at the pipeline outlet and the total mass flow rate of the extinguishing agent when the pipeline diameter was 20 mm . It can be seen from the figure that in Phase I, an obvious peak appeared in the flow velocity curve at the beginning of the release, at this moment the extinguishing agent had not yet flowed out of the pipeline. Therefore, it can be inferred that this peak velocity should be caused by the rapid discharge of the original gas in the pipeline.
In Phase II, the total mass flow rate and the flow velocity both showed obvious two-stage characteristics: In the Part 1 stage, the total mass flow rate of the extinguishing agent decreased gradually, while the flow velocity at the pipeline outlet decreased slowly; In the Part 2 stage, the total mass flow rate of the extinguishing agent decreased rapidly, while the flow velocity at the pipeline outlet increased rapidly. This indicated that there was a significant change in the state of the fluid in the pipeline between the Part 1 stage and the Part 2 stage, and it can well confirm the previous speculation about Part 1 and Part 2, that is: the Part 1 stage was mainly the concentrated release of the liquid extinguishing agents, and the Part 2 stage was the release of the residual liquid extinguishing agents in the pipeline carried by the compressed nitrogen after the release of the liquid extinguishing agent in the vessel was completed.
In Phase III, the outlet velocity decreased rapidly to zero, and the mass flow rate of the extinguishing agent gradually decreased from a small initial value to zero, which also confirms the inference in the previous section that this stage was a single-phase flow of the mixture of the compressed nitrogen and the gaseous extinguishing agent.
In addition, through the further analysis of Phase II shown in Figure 8, it can be found that in the Part 1 stage, the flow velocity at the pipeline outlet decreased slowly, while the mass flow rate of the extinguishing agent decreased significantly, which indicated that the average nominal density of the extinguishing agent decreased continuously in this stage. However, according to the analysis in Section 3.1.2, it can be seen that the compressed nitrogen in the vessel had not yet flowed out, which means that the decrease in average nominal density was mainly due to the continuous gasification of the extinguishing agent; In the Part 2 stage, since there was no liquid extinguishing agent flowed into the pipeline from the vessel, the residual liquid extinguishing agents in the pipeline carried by the compressed nitrogen were released in a gas–liquid two-phase mixed state. In this stage, due to the rapid decrease in the liquid extinguishing agent content in the pipeline, the flow velocity at the pipeline outlet increased rapidly.
Figure 9 shows the variation of the percentage of the gas mass to the total mass of the extinguishing agent released through the pipeline with the pipeline diameter. It can be seen from the figure that, with the increase in the pipeline diameter, the gasification ratio of the extinguishing agent released through the pipeline decreased at first and then increased. It can be fitted by a quadratic polynomial function, and the fitting result is shown in Equation (14). It can be concluded that the pipeline diameter had a significant impact on the gasification ratio of the extinguishing agent during the pipe flow. Therefore, in the design of the fire extinguishing system, the pipeline diameter should be reasonably matched according to the drive capability of the extinguishing bottle so as to reduce the gasification ratio of the extinguishing agent during the release.
P e r g a s = 14.780 0.676 D + 0.016 D 2
where P e r g a s represents the mass percentage of the vaporized extinguishing agent during the pipe flow ( % ); and D denotes the pipeline diameter ( mm ).

3.1.4. Summary

In this section, the effects of the pipeline diameter on the flow characteristics including release time, mass flow rate and gasification ratio of the extinguishing agent are discussed respectively. Results show that the pipeline diameter has a positive effect on the release and flow of the extinguishing agent Halon 1301. With the increase in the pipeline diameter, the liquid release time and the total release time of the extinguishing agent both decrease significantly, while the gasification ratio of the extinguishing agent decreases at first and then increases. The maximum mass flow rate and the average mass flow rate in the intermediate concentrated release stage both increase significantly with the increase in the pipeline diameter, while the per unit area mass flow rate of the extinguishing agent increases at first and then decreases with the increase in the pipeline diameter.

3.2. Effects of Pipeline Length on the Flow Characteristics

The length of the pipeline often seriously affects the flow characteristics of the medium in it. In order to study the influence of the pipeline length on the flow characteristics of the extinguishing agent, in the study of this section, as shown in Figure 3, the filling condition of the extinguishing bottle and the pipeline diameter were kept unchanged, only changed the length of Pipe 2, which was set to 126 mm , 427.7 mm , 926 mm , 2000 mm and 3043.9 mm respectively for the comparison tests. The initial filling pressure of the vessel was 4.83 MPa , and the filling amount of the extinguishing agent was 1.195   kg . At the environment temperature of 294.25   K , the volume percentages of the Halon 1301 agent in the gas phase and liquid phase were 47.21 % and 94.90 % , respectively, and the remaining proportions were occupied by the compressed nitrogen. In addition, considering the problem of non-monotonous changes of the liquid mass flow rate in Phase II when the pipeline diameter exceeded 20   mm as found in the study in Section 3.1, in order to minimize the influences of the pipeline diameter factor, the diameters of the Pipe 1 and Pipe 2 were both set as 15   mm in this study.

3.2.1. Effects of Pipeline Length on the Release Time

Figure 10a,b show the variation curves of the pressure and the pressure drop rate of the vessel with time under different pipeline lengths. As can be seen from the two figures, with the increase in the pipeline length, the release duration of the extinguishing agent increased, and the moment when the second peak (as shown by the arrows in Figure 10b) of the pressure drop rate appeared (according to the analysis in Section 3.1.1, it corresponds to the moment when the release of the liquid extinguishing agent was completed, that is, the boundary between Phase II and Phase III) was delayed and the value of the peak decreased. This indicated that the duration of Phase II increased with the increase in the pipeline length, and the conversion process between Phase II and Phase III tended to be flat. In addition, it can be seen from Figure 10b that at the beginning of the release, the peak value of the pressure drop rate did not change much with the pipeline length, while with the increase in the pipeline length, the average pressure drop rate between the two peaks decreased and the duration between the two peaks increased. This may be because the first peak of the pressure drop rate corresponds to the moment that the extinguishing agent begins to flow into the pipe and since the extinguishing agent has not flowed a long distance along the pipe at this moment, the peak value is less affected by the pipeline length. However, in the stage between the two peaks, which corresponded to the concentrated release of the liquid extinguishing agent, with the increase in the pipeline length, the resistance loss along the pipeline increased, and the flow rate of the extinguishing agent decreased. Therefore, in this stage, the release time increased and the pressure drop rate of the vessel decreased with the increase in the pipeline length.
Figure 10c shows the release duration of the liquid extinguishing agent ( t L 1301 ), the total release time of the extinguishing agent ( t T 1301 ), the length of time used for the pipeline filling ( t F i l l i n g ) and the percentage of the liquid release time to the total release time ( P e r t L 1301 ) under different pipeline length conditions. It can be seen from the figure that these four parameters were all increased linearly with the increase in the pipeline length. The fitting results are shown in Equations (15)–(18) respectively. It can be concluded that the pipeline length had a significant effect on the release rate of the extinguishing agent. The increase in the pipeline length not only increased the time of the pipeline filling in Phase I but also increased the ratio of the liquid release time to the total release time. This may be because, on the one hand, the resistance loss along the pipeline increased with the increase in the pipeline length, and the pipeline filling time and the extinguishing agent release time also increased, this may cause the increase in the heat absorption of the extinguishing agent from the environment and the increase in the gasification rate, which was not conducive to the rapid release of the extinguishing agent. On the other hand, the pressure drop rate of the vessel decreased with the increase in the pipeline length, which was conducive to maintain a relatively high release pressure in the pipeline, and in turn slowed down the gasification rate of the extinguishing agent to a certain extent, which was beneficial to the rapid release of the extinguishing agent in the form of liquid.
t L 1301 = 0.215 + 0.152 L
t T 1301 = 0.398 + 0.190 L
t F i l l i n g = 0.005 + 0.058 L
P e r t L 1301 = 56.889 + 4.339 L  
where L represents the length of the pipeline ( m ).

3.2.2. Effects of Pipeline Length on the Mass Flow Rate

Figure 11a,b show the curves of the liquid mass flow rate and the gaseous mass flow rate of the extinguishing agent with time under different pipeline length conditions. It can be seen from these two figures that with the increase in the pipeline length, the peak value of the liquid mass flow rate decreased significantly, while that of the gaseous mass flow rate increased significantly. In addition, it also can be found that the moment when the liquid and the gaseous extinguishing agents started to flow out of the pipeline was delayed gradually with the increase in the pipeline length, and the filling process of the pipeline was elongated obviously.
In order to compare the differences of the release process between different pipeline lengths, the mass flow rates of the liquid and gaseous extinguishing agents, the mass flow rate of the compressed nitrogen and the pressure drop rate of the vessel at the pipeline lengths of 126 mm and 2000 mm were plotted, as shown in Figure 11c,d, respectively. It can be seen from these two figures that in Phase I, when the pipeline length was 126 mm , the duration of the initial pipeline filling was much short (the filling process lasted about 0.02 s ), and the moment when the extinguishing agent started to flow out of the pipeline was almost synchronous with the moment when the extinguishing bottle was opened; When the pipeline length was 2000   mm , the moment when the extinguishing agent started to flow out from the pipeline was about 0.04 s later than the moment when the extinguishing bottle was opened, and the initial pipeline filling process was obviously elongated (the filling process lasted about 0.10 s ), and during the filling process, the mass flow rate of the liquid extinguishing agent gradually increased, while that of the gas extinguishing agent increased sharply at first and then decrease rapidly, which indicated that an obvious gasification phase transition occurred at the front of the fire extinguishing agent in this process. In Phase II, the release duration at the pipeline length of 126 mm was significantly shorter than that at the pipeline length of 2000 mm (the former was about 0.22 s and the latter was about 0.37 s ). Moreover, in the Part 1 stage, the mass flow rate of the liquid extinguishing agent at the pipeline length of 126   mm was significantly larger than that at the pipeline length of 2000   mm (the average value of the former was about 6.76 kg / s , while that of the latter was about 2.99 kg / s ), while the mass flow rate of the gaseous extinguishing agent was just the opposite (the average value of the former was about 0.28 kg / s , while that of the latter was about 0.52 kg / s ), which showed that the gasification rate of the extinguishing agent during the pipe flow increased significantly with the increase in the pipeline length.
Figure 12a shows the curves of the liquid mass flow rate and the total mass flow rate of the extinguishing agent with time at the pipeline length of 2000 mm . It can be seen from the figure that the liquid mass flow rate was close to the total mass flow rate in the whole release process. The maximum difference between the two parameters was about 0.58 kg / s (about 18.2 % of the total mass flow rate at that moment), indicating that the release of the extinguishing agent was still dominated by the liquid extinguishing agent under this relatively long pipeline condition.
Figure 12b shows the variation of the maximum mass flow rates and the average mass flow rates in Phase II of the liquid and the total extinguishing agents with the pipeline length. It can be seen from the figure that all these mass flow rates decrease with the increase in the pipeline length. They could be fitted by quadratic polynomial functions, as shown in Equations (19)–(22), respectively. It can be concluded that the increase in the pipeline length significantly reduced the release rate of the extinguishing agent. This may be because the increase in the pipeline length not only increased the flow resistance along the pipeline but also increased the duration of the pipe flow, which led to the intensification of the vaporization of the extinguishing agent during the flow process.
m ˙ L m a x = 8.790 3.953 L + 0.635 L 2
m ˙ T m a x = 8.915 3.738 L + 0.606 L 2
m ˙ L a v g = 4.726 1.939 L + 0.275 L 2
m ˙ T a v g = 4.992 1.849 L + 0.266 L 2
where m ˙ L m a x and m ˙ T m a x represent the maximum mass flow rates of the liquid extinguishing agent and that of the total extinguishing agent ( kg / s ), respectively; m ˙ L a v g and m ˙ T a v g denote the average mass flow rates of the liquid extinguishing agent and that of the total extinguishing agent in Phase II ( kg / s ), respectively; L denotes the pipeline diameter ( m ).

3.2.3. Effects of Pipeline Length on the Gasification Ratio

Figure 13 shows the curves of the flow velocity and the total mass flow rate of the extinguishing agent at the pipeline outlet under the condition of pipeline length of 2000 mm . It can be seen from the figure that in Phase I, first of all, an obvious peak also occurred in the flow velocity curve at the beginning of the release. According to the analysis in Section 3.1.3, this peak should be caused by the rapid discharge of the original gas in the pipeline when the extinguishing agent filled into the pipeline. Secondly, there was a small peak that occurred in the flow velocity curve when the extinguishing agent started to release from the pipeline outlet, it should be due to the gasification of the flow front of the extinguishing agent which discharged rapidly. Then, the mass flow rate of the extinguishing agent increased gradually, and the flow velocity at the pipeline outlet decreased slowly, which indicated that the average nominal density of the extinguishing agent in the pipeline increased significantly in this stage. Therefore, it can also be concluded that this stage was the process of the pipeline filling by the liquid extinguishing agent.
In Phase II, both the mass flow rate and the flow velocity also showed the two-stage characteristics. In the Part 1 stage, since the liquid extinguishing agent in the vessel had not yet completely flowed out, the flow velocity at the pipeline outlet was relatively stable, and the mass flow rate of the extinguishing agent decreased gradually with time. This indicated that the average nominal density of the extinguishing agent in the pipeline decreased with time in this stage, which should be caused by the continuous gasification of the extinguishing agent during the pipe flow. In the Part 2 stage, since the liquid extinguishing agent in the vessel had already completely released, the mass flow rate of the liquid extinguishing agent decreased significantly, while the flow velocity at the pipeline outlet increased rapidly. This should be mainly the release process of the residual liquid extinguishing agents in the pipeline carried by the compressed nitrogen, it can be predicted that there was violent gasification of the extinguishing agent in this stage.
In Phase III, after the liquid extinguishing agent in the pipeline completely flowed out, the mass flow rate of the extinguishing agent and the flow velocity at the pipeline outlet decreased with time. This stage should be the residual nitrogen and the gaseous extinguishing agent released together.
Figure 14 shows the curve of the percentage of the gaseous mass to the total mass of the extinguishing agent released from the pipeline outlet with the pipeline length. It can be seen from the figure that the percentage increased linearly with the increase in the pipeline length, and the fitting result is shown in Equation (23). It can be concluded that, under the same conditions of the extinguishing bottle and the pipeline diameter, increasing the pipeline length will significantly increase the gasification ratio of the extinguishing agent during the release, which was not conducive to the rapid release of the extinguishing agent.
P e r g a s = 5.871 + 6.625 L
where P e r g a s represents the mass percentage of the vaporized extinguishing agent during the pipe flow ( % ); L denotes the pipeline length ( m ).

3.2.4. Summary

In this section, the effects of the pipeline length on the flow characteristics including release time, mass flow rate and gasification ratio of the extinguishing agent are discussed respectively. Results show that the pipeline length has a negative effect on the release rate of the Halon 1301 agent. With the increase in the pipeline length, the gasification ratio, the initial filling time of the pipeline, the liquid release duration and the total release duration of the extinguishing agent all increase linearly. On the contrary, both the maximum mass flow rate and the average mass flow rate of the extinguishing agent decrease significantly.

3.3. Effects of the Pipeline Roughness on the Flow Characteristics

The pipeline roughness ( ε ) is one of the key factors affecting the pipeline resistance, which often has a great influence on the flow characteristics of the medium in it. In order to study the influence of the pipeline roughness on the flow characteristics of the Halon 1301 agent, in the study of this section, the filling condition of the extinguishing bottle, the pipeline diameter and the pipeline length were kept unchanged, only changed the pipeline roughness for the comparison tests. Considering that the roughness value of the industrial metal pipelines under non-corrosive conditions is usually between 0.1 mm and 0.3 mm [5,28], the pipeline roughness of Pipe 1 and Pipe 2 shown in Figure 3 were both set as 0.08 mm , 0.16 mm and 0.32 mm , respectively. The diameters of Pipe 1 and Pipe 2 were both set as 15   mm , and their lengths were set as 220 mm and 427.7 mm , respectively. The initial filling pressure of the vessel was 4.83   MPa , and the filling amount of the extinguishing agent was 1.195 kg . At the environment temperature of 294.25 K , the volume percentages of the Halon 1301 agent in the gas phase and liquid phase were 47.21 % and 94.90 % , respectively, and the remaining proportions were occupied by the compressed nitrogen.

3.3.1. Effects of Pipeline Roughness on the Release Time

Figure 15a,b show the variation curves of the pressure and the pressure drop rate of the vessel with time under different pipeline roughnesses, respectively. It can be seen from these two figures that, with the increase in the pipeline roughness, the total release time and the pressure of the vessel in the intermediate release stage both increased slightly, and the moment when the liquid extinguishing agent completely released from the pipeline (as shown by the arrows in Figure 15b) was delayed slightly. This showed that the increase in the pipeline roughness had a negative impact on the flow rate of the liquid extinguishing agent, which may be due to the fact that the increased roughness of the pipeline increases the resistance of the liquid extinguishing agent flowing in the pipeline and reduces its flow velocity, and thus the release duration of the liquid extinguishing agent increases. In addition, it may be because the release rate of the extinguishing agent slowed down with the increase in the pipeline roughness, which reduced the pressure drop rate of the vessel, so the pressure of the vessel was relatively high during the intermediate release stage.
Figure 15c shows the variation curves of the release time of the liquid extinguishing agent ( t L 1301 ), the total release time of the extinguishing agent ( t T 1301 ) and the percentage of the liquid release time to the total release time with the pipeline roughness. It can be seen from the figure that t L 1301 and t T 1301 both increased slowly with the increase in the pipeline roughness ( t L 1301 and t T 1301 at the roughness of 0.32 mm were 1.09 times and 1.07 times of those at the roughness of 0.08 mm , respectively), and the fitting results by linear functions are shown in Equations (24) and (25), respectively. However, the percentage of the liquid release time to the total release time did not vary significantly with the pipeline roughness, which indicated that the pipeline roughness had little effect on the release time of the Halon 1301 agent within the scope of this study.
t L 1301 = 0.255 + 0.093 ε
t T 1301 = 0.449 + 0.126 ε
where t L 1301 and t T 1301 denote the liquid release time ( s ) and the total release time ( s ) of the extinguishing agent, respectively; ε denotes the pipeline roughness ( mm ).

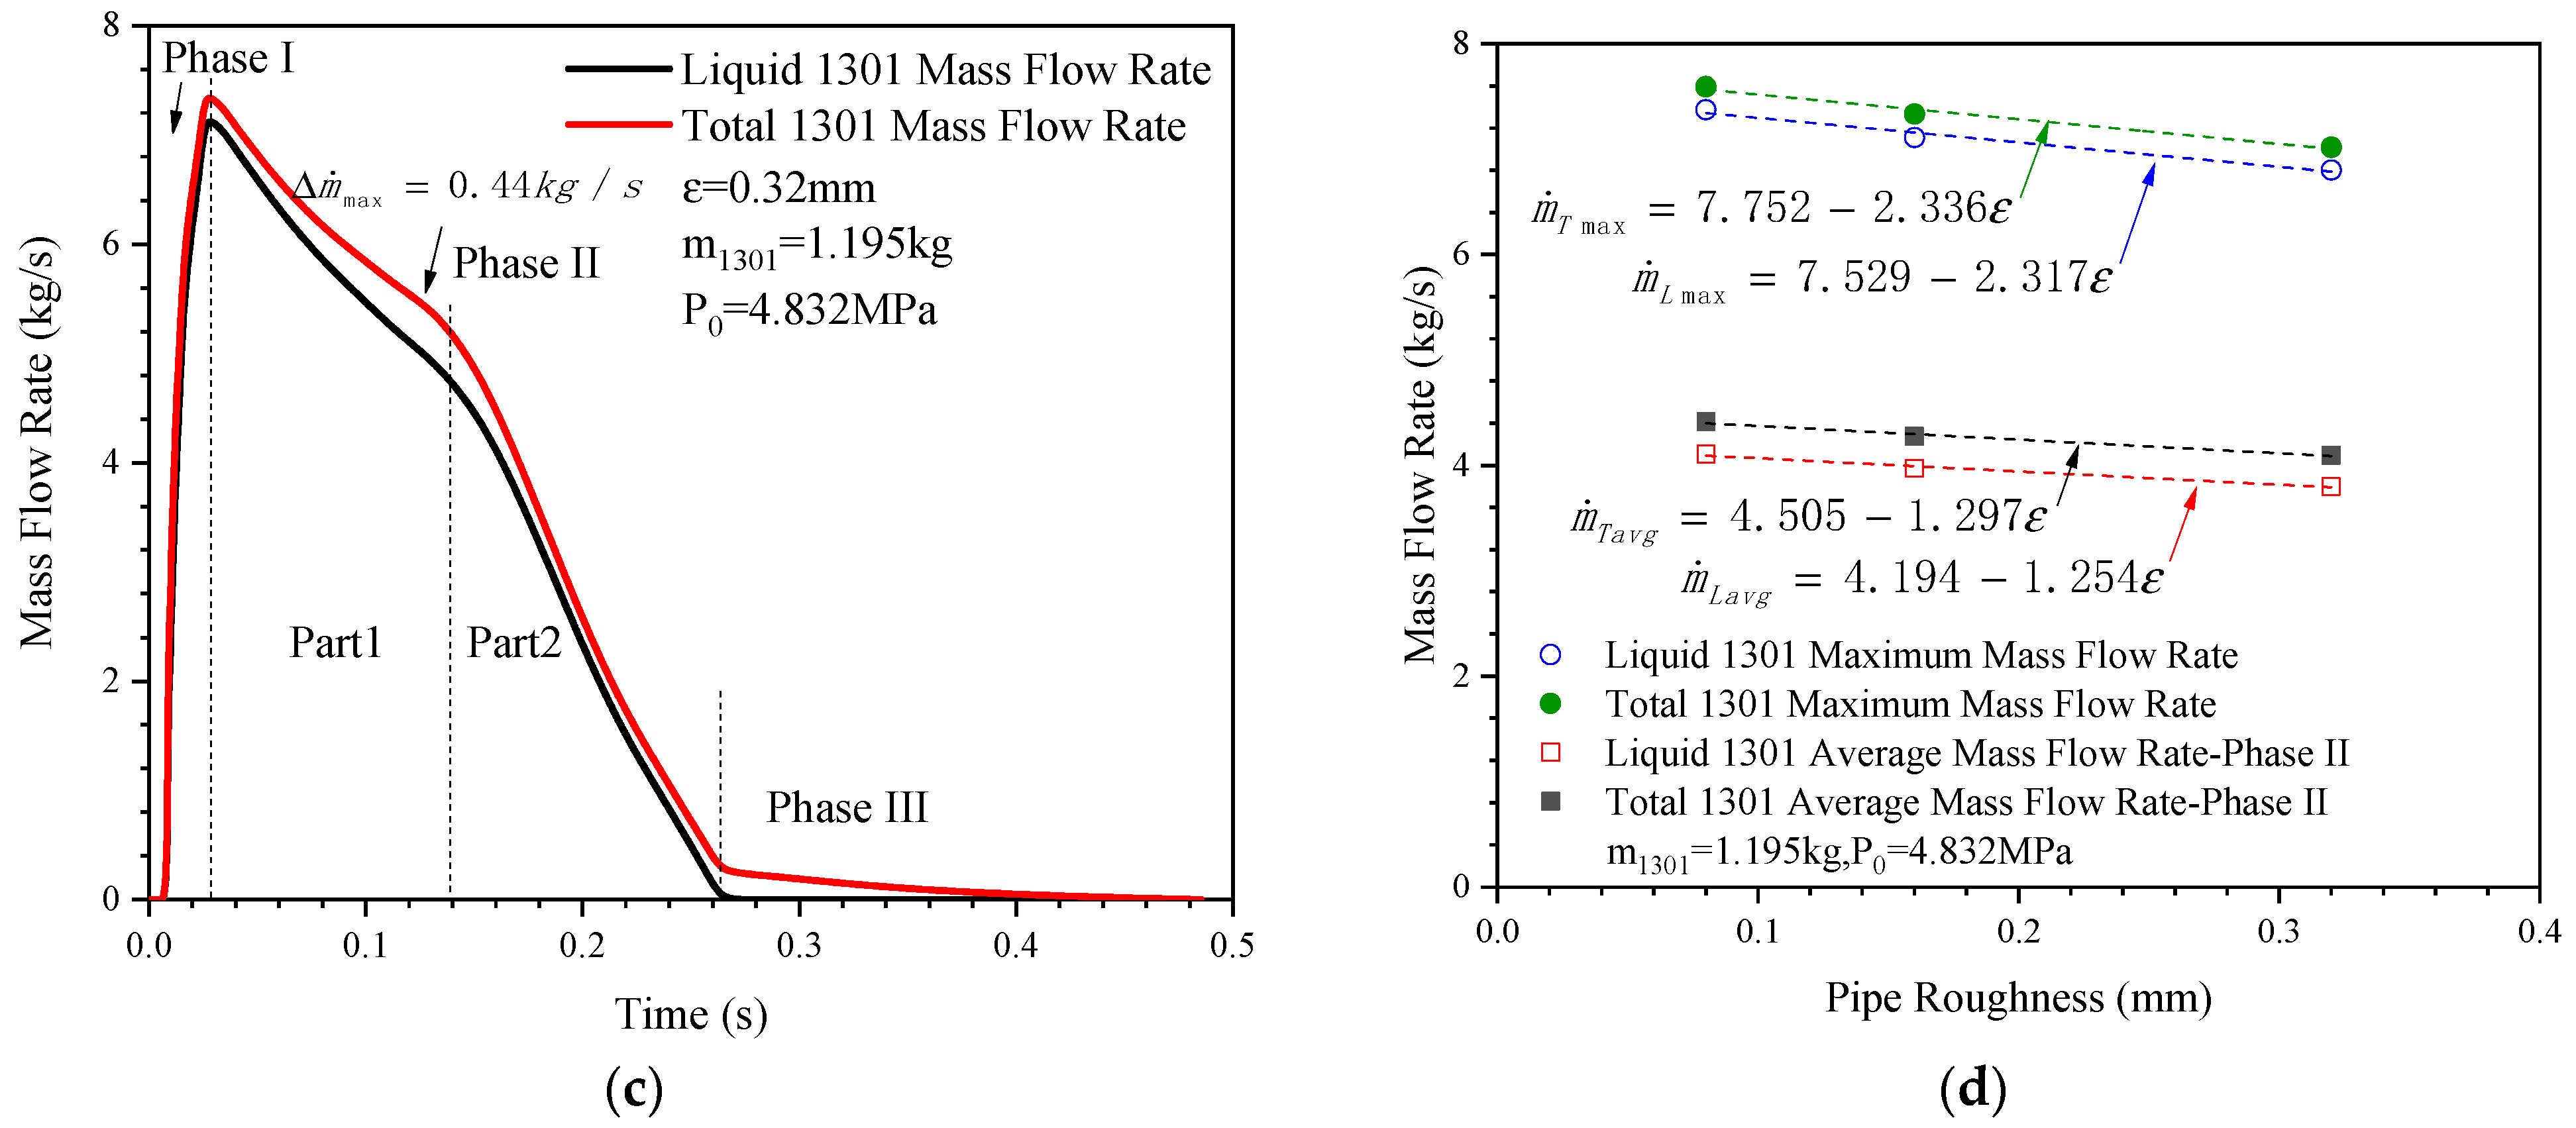
3.3.2. Effects of Pipeline Roughness on the Mass Flow Rate

Figure 16a,b show the variation curves of the liquid mass flow rate and gaseous mass flow rate of the extinguishing agent with time under different pipeline roughnesses, respectively. It can be seen from these two figures that, with the increase in the pipeline roughness, the peak value of the liquid mass flow rate decreased obviously, while the gaseous mass flow rate decreased slightly, and the end moments of the Part 1 stage and the Part 2 stage (as shown by arrows in Figure 16b) were delayed. This also indicated that the increase in the pipeline roughness mainly had a negative effect on the flow of the liquid extinguishing agent.
Figure 16c shows the curves of the liquid mass flow rate and the total mass flow rate of the extinguishing agent with time at the pipeline roughness of 0.32 mm . It can be seen from the figure that the liquid mass flow rate was close to the total mass flow rate in the whole process. In Phase II, the maximum difference between the two parameters was about 0.44 kg / s (about 8.7 % of the total mass flow rate at that moment), indicating that the release of the extinguishing agent was still dominated by the liquid extinguishing agent under this large pipeline roughness condition.
Figure 16d shows the curves of the maximum mass flow rates and the average mass flow rates in Phase II of the liquid and the total extinguishing agents with pipeline roughness. It can be seen from the figure that all these four parameters decreased slightly with the increase in the pipeline roughness. They could be fitted by linear functions, and the fitting results are shown in Equations (26)–(29), respectively. In summary, the increase in the pipeline roughness slightly reduced the release rate of the extinguishing agent, which may be due to the increase in the flow resistance of the liquid extinguishing agent caused by the increase in the pipeline roughness.
m ˙ L m a x = 7.529 2.317 ε
m ˙ T m a x = 7.752 2.336 ε
m ˙ L a v g = 4.194 1.254 ε
m ˙ T a v g = 4.505 1.297 ε
where m ˙ L m a x and m ˙ T m a x represent the maximum mass flow rates of the liquid extinguishing agent and that of the total extinguishing agent ( kg / s ), respectively; m ˙ L a v g and m ˙ T a v g denote the average mass flow rates of the liquid extinguishing agent and that of the total extinguishing agent in Phase II ( kg / s ), respectively; ε denotes the pipeline roughness ( mm ).

3.3.3. Effects of Pipeline Roughness on the Gasification Ratio

Figure 17 shows the variation of the percentage of the gaseous mass to the total mass of the extinguishing agent released from the pipeline outlet with the pipeline roughness. It can be seen from the figure that the percentage increased slightly with the increase in the pipeline roughness. It can be fitted by the linear function, and the fitting result is shown in Equation (30). It can be concluded that, under the same conditions of the extinguishing bottle and the pipeline diameter and pipeline length, the increase in the pipeline roughness will slightly increase the gasification ratio of the extinguishing agent during the release, which may be due to the increase in the heat absorption from the environment caused by the increase in the release time.
P e r g a s = 8.534 + 0.926 ε
where P e r g a s represents the mass percentage of the vaporized extinguishing agent during the pipe flow ( % ); and ε denotes the pipeline roughness ( mm ).

3.3.4. Summary

In this section, the effects of the pipeline roughness on the flow characteristics including release time, mass flow rate and gasification ratio of the extinguishing agent are discussed respectively. Results show that the influence of the pipeline roughness on the release characteristics of the Halon 1301 agent is relatively weak. The gasification ratio, the liquid release duration and the total release duration of the extinguishing agent all increase slightly with the increase in the pipeline roughness. On the contrary, the maximum mass flow rate and the average mass flow rate of the extinguishing agent both decrease slightly with the increase in the pipeline roughness.

4. Conclusions

In this work, a numerical simulation model of the gas–liquid two-phase transient flow of the Halon 1301 agent pressurized by nitrogen was established based on CFD simulations, which can carry out the numerical calculation of the release process of the extinguishing agent through the pipeline accurately. On this basis, the influences of the pipeline diameter, pipeline length and pipeline roughness on the release duration, mass flow rate and gasification ratio of the extinguishing agent were studied. The major results and conclusions are summarized as follows:
(1)
The pipeline diameter has a positive effect on the release and flow of the extinguishing agent Halon 1301. With the increase in the pipeline diameter, the liquid release time and the total release time of the extinguishing agent both decrease significantly, while the gasification ratio of the extinguishing agent decreases at first and then increases. The maximum mass flow rate and the average mass flow rate in the intermediate concentrated release stage both increase significantly with the increase in the pipeline diameter, while the per unit area mass flow rate of the extinguishing agent increases at first and then decreases with the increase in the pipeline diameter. This indicates that the increase in the pipeline diameter is conducive to the rapid release of the extinguishing agent.
(2)
The pipeline length has a negative effect on the release rate of the Halon 1301 agent. With the increase in the pipeline length, the gasification ratio, the initial filling time of the pipeline, the liquid release duration and the total release duration of the extinguishing agent all increase linearly. On the contrary, both the maximum mass flow rate and the average mass flow rate of the extinguishing agent decrease significantly. This indicates that the increase in the pipeline length obviously reduces the release rate of the extinguishing agent.
(3)
The influence of the pipeline roughness on the release characteristics of the Halon 1301 agent is relatively weak. The gasification ratio, the liquid release duration and the total release duration of the extinguishing agent all increase slightly with the increase in the pipeline roughness. On the contrary, the maximum mass flow rate and the average mass flow rate of the extinguishing agent both decrease slightly with the increase in the pipeline roughness. This indicates that an increase in the pipeline roughness reduces the release rate of the extinguishing agent to some extent.

Author Contributions

Conceptualization, Q.L.; methodology, Z.Z. and Q.L.; validation, Q.L. and R.C.; resources, Z.L. and Q.L.; data curation, Z.Z. and Q.L.; writing—original draft preparation, Q.L.; writing—review and editing, X.Z., H.G., Z.L. and R.C.; visualization, Q.L.; supervision, R.C. and R.P.; project administration, Q.L.; funding acquisition, R.C. and R.P. All authors have read and agreed to the published version of the manuscript.

Funding

This research was funded by the National Natural Science Foundation of China (No.51806106) and the Natural Science Foundation of Jiangsu Province, China (No. BK20170838).

Institutional Review Board Statement

Not applicable.

Informed Consent Statement

Not applicable.

Data Availability Statement

The data will be made available on request from the corresponding author.

Conflicts of Interest

The authors declare no conflict of interest. The funders had no role in the design of the study; in the collection, analyses, or interpretation of data; in the writing of the manuscript, or in the decision to publish the results.

Nomenclature

D the pipeline diameter ( m m )
d P m a x the maximum pressure drop rate of the vessel ( M P a / s )
L the length of the pipeline ( m )
m ˙ L a v g the average mass flow rate of the liquid extinguishing agent in Phase II ( k g / s )
m ˙ L m a x the maximum mass flow rate of the liquid extinguishing agent ( k g / s )
m ˙ T a v g the average mass flow rate of the total extinguishing agent in Phase II ( k g / s )
m ˙ T m a x the maximum mass flow rate of the total extinguishing agent ( k g / s )
m ¯ ˙ L a v g the average mass flow rate per unit area of the liquid extinguishing agent in Phase II ( k g / ( m m 2 · s ) )
m ¯ ˙ L m a x the maximum mass flow rate per unit area of the liquid extinguishing agent in Phase II ( k g / ( m m 2 · s ) )
m ¯ ˙ T a v g the average mass flow rate per unit area of the total extinguishing agent in Phase II ( k g / ( m m 2 · s ) )
m ¯ ˙ T m a x the maximum mass flow rate per unit area of the total extinguishing agent in Phase II ( k g / ( m m 2 · s ) )
Δ m ˙ m a x the maximum difference between the total mass flow rate and the liquid mass flow rate ( k g / s )
t L 1301 the release time of the liquid extinguishing agent ( s )
t F i l l i n g the time of the extinguishing agent filling pipeline ( s )
t T 1301 the total release time of the extinguishing agent ( s )
P e r g a s the mass percentage of the vaporized extinguishing agent during the pipe flow ( % )
P e r t L 1301 the percentage of the liquid release time to the total release time ( % )
ε the pipeline roughness ( m m )

References

  1. Hariram, S.S. Fire Protection on Airplanes. SAE Int. J. Aerosp. 2005, 1, 3429. [Google Scholar] [CrossRef]
  2. Ji, H.; Li, Y.; Su, H.; Cheng, W.; Wu, X. Experimental investigation on the cooling and inerting effects of liquid nitrogen injected into a confined space. Symmetry 2019, 11, 579. [Google Scholar] [CrossRef] [Green Version]
  3. Lu, P.; Zhao, Y.; Xu, Y. A two-stream CNN model with adaptive adjustment of receptive field dedicated to flame region detection. Symmetry 2021, 13, 397. [Google Scholar] [CrossRef]
  4. Wilk-Jakubowski, J.Ł. Analysis of flame suppression capabilities using low-frequency acoustic waves and frequency sweeping techniques. Symmetry 2021, 13, 1299. [Google Scholar] [CrossRef]
  5. Zhong, Q.; Chen, Q.; Wang, J.; Qu, H.; Ma, W.; Zhu, T.; Zhang, S. Chemical Engineering Principles, 4th ed.; National Defense Industry Press: Beijing, China, 2019; pp. 32–33. [Google Scholar]
  6. Lu, W.; Hu, H.; Qi, G. Effect of Pipe Diameter and Inlet Parameters on Liquid CO2 Flow in Transportation by Pipeline with Large Height Difference. Processes 2019, 7, 756. [Google Scholar] [CrossRef] [Green Version]
  7. Xiao, C.; Lu, Z.; Yan, L.; Wang, J.; Yao, S. Effects of Flow Velocity on Transient Behaviour of Liquid CO2 Decompression during Pipeline Transportation. Processes 2021, 9, 192. [Google Scholar] [CrossRef]
  8. Williamson, H.V. Halon 1301 flow in pipelines. Fire Technol. 1976, 12, 18–32. [Google Scholar] [CrossRef]
  9. Ma, X.M.; Zhao, L.M.; Li, Y.N.; Li, D.D.; Fu, J.J.; Han, Y.C.; Qin, J. Numerical simulation of distribution of discharged gas fire extinguishing agent in high velocity flow field. Adv. Mater. Res. 2013, 718–720, 1786–1791. [Google Scholar] [CrossRef]
  10. Niu, X.; Xie, Y.; Hasemi, Y. Analysis of fire spread and fire extinguishing agent distribution in nacelle of helicopter under no-ventilation condition. Procedia Eng. 2013, 62, 1073–1080. [Google Scholar] [CrossRef] [Green Version]
  11. Kurokawa, F.Y.; de Andrade, C.R.; Zaparoli, E.L. Modeling of aircraft fire suppression system by the lumped parameter approach. Aircr. Eng. Aerosp. Technol. 2016, 88, 535–539. [Google Scholar] [CrossRef]
  12. Dinesh, A.; Benson, C.M.; Holborn, P.G.; Sampath, S.; Xiong, Y. Performance evaluation of nitrogen for fire safety application in aircraft. Reliab. Eng. Syst. Saf. 2020, 202, 107044. [Google Scholar] [CrossRef]
  13. Kim, G.; Cha, J.-H.; Lee, H.-J. Numerical study on the effect of temperature in the retention time of an inert agent. Fire Saf. J. 2020, 115, 103004. [Google Scholar] [CrossRef]
  14. Payri, R.; Gimeno, J.; Martí-Aldaraví, P.; Carvallo, C. Parametrical study of the dispersion of an alternative fire suppression agent through a real-size extinguisher system nozzle under realistic aircraft cargo cabin conditions. Process Saf. Environ. Prot. 2020, 141, 110–122. [Google Scholar] [CrossRef]
  15. Elliott, D.G.; Garrison, P.W.; Klein, G.A.; Moran, K.M.; Zydowicz, M.P. Flow of Nitrogen-Pressurized Halon 1301 in Fire Extinguishing Systems; JPL Publication: Pasadena, CA, USA, 1984; p. 124.
  16. Tuzla, K.; Palmer, T.; Chen, J.; Sundaram, R.K.; Yeung, W.-S. Development of Computer Program for Fire Suppressant Fluid Flow; Institute of Thermo-Fluid Engineering & Science, Lehigh University: Bethlehem, PA, USA, 1998; p. 66. [Google Scholar]
  17. Kim, J.; Baek, B.; Lee, J. Numerical analysis of flow characteristics of fire extinguishing agents in aircraft fire extinguishing systems. J. Mech. Sci. Technol. 2009, 23, 1877–1884. [Google Scholar] [CrossRef]
  18. Bykov, N.V.; Shestakov, I.E. Simulation of piston acceleration in a single-stage combustion light gas gun. AIP Conf. Proc. 2021, 2318, 060002. [Google Scholar] [CrossRef]
  19. Korivi, V.; McCormick, S.; Hodges, S. Fire suppression modeling & simulation framework for ground vehicles. SAE Int. J. Transp. Saf. 2017, 5, 58–67. [Google Scholar]
  20. Moradikazerouni, A.; Vahab, M.; Shoele, K. A 0D/3D nodal-CFD method of cylindrical pressurized tanks. In Proceedings of the 73rd Annual Meeting of the APS Division of Fluid Dynamics, Chicago, IL, USA, 22–24 November 2020. [Google Scholar]
  21. Fluent Corporation. Fluent Help Documents; Fluent Corporation: Canonsburg, PA, USA, 2015. [Google Scholar]
  22. Karathanassis, I.K.; Koukouvinis, P.; Gavaises, M. Comparative evaluation of phase-change mechanisms for the prediction of flashing flows. Int. J. Multiph. Flow 2017, 95, 257–270. [Google Scholar] [CrossRef] [Green Version]
  23. De Schepper, S.C.K.; Heynderickx, G.J.; Marin, G.B. Modeling the evaporation of a hydrocarbon feedstock in the convection section of a steam cracker. Comput. Chem. Eng. 2009, 33, 122–132. [Google Scholar] [CrossRef]
  24. Fang, C.; David, M.; Rogacs, A.; Goodson, K. Volume of fluid simulation of boiling two-phase flow in a vapor-venting microchannel. Front. Heat Mass Transf. 2010, 1, 3002. [Google Scholar] [CrossRef]
  25. Wang, T.; Hu, Y.-J.; Zhang, P.; Pan, R.-M. Study on thermal decomposition properties and its decomposition mechanism of pentafluoroethane (HFC-125) fire extinguishing agent. J. Fluor. Chem. 2016, 190, 48–55. [Google Scholar] [CrossRef]
  26. Zhang, P.; Cao, L.; Pan, R.; Jiang, Z.; Qin, K.; Li, Q. A Study on the pyrolysis of CHF3. Procedia Eng. 2013, 62, 337–341. [Google Scholar] [CrossRef] [Green Version]
  27. Zhou, X.; Chen, W.; Chao, M.; Liao, G. The study of thermal decomposition of 2-bromo-3,3,3-trifluoropropene and its fire-extinguishing mechanism. J. Fluor. Chem. 2013, 153, 101–106. [Google Scholar] [CrossRef]
  28. Chen, F.; Yu, H.; Sun, Z.; Guo, Y. Determination of inner wall roughness of pipeline. Oil Gas Storage Transp. 2007, 25, 8–10. [Google Scholar]
Figure 1. The model of fire extinguishing system: (a) Physical model; (b) Diagram of grids.
Symmetry 13 01766 g001
Figure 2. Bottle pressure curves with different cell numbers.
Symmetry 13 01766 g002
Figure 3. Diagram of the experimental apparatus.
Symmetry 13 01766 g003
Figure 4. Comparison of numerical results of vessel pressure with experimental results.
Symmetry 13 01766 g004
Figure 5. The bottle pressure and release time under different pipe diameters: (a) Bottle pressures; (b) Bottle pressure drop rates; (c) Comparison of pressure and mass flow rate; (d) Release times and percentages of liquid release duration.
Symmetry 13 01766 g005
Figure 6. Mass flow rates under different pipeline diameters: (a) Liquid mass flow rates; (b) Vapor mass flow rates; (c) Mass flow rates and pressure drop rate under 25 mm ; (d) Mass flow rates and pressure drop rate under 10 mm .
Symmetry 13 01766 g006aSymmetry 13 01766 g006b
Figure 7. Comparison of mass flow rates of the extinguishing agent: (a) Variation of liquid and total mass flow rates; (b) Variation of the maximum and average mass flow rates with pipe diameter; (c) Variation of the unit area mass flow rates with pipe diameter.
Symmetry 13 01766 g007
Figure 8. Diagram of flow velocity and total mass flow rate.
Symmetry 13 01766 g008
Figure 9. Variation of gasification ratio of the extinguishing agent under different pipe diameters.
Symmetry 13 01766 g009
Figure 10. The bottle pressure and release time under different pipeline lengths: (a) Bottle pressures; (b) Bottle pressure drop rates; (c) Release times, pipeline filling times and percentages of liquid release duration.
Symmetry 13 01766 g010
Figure 11. Mass flow rates under different pipeline lengths: (a) Liquid mass flow rates; (b) Vapor mass flow rates; (c) Mass flow rates and pressure drop rate under 126 mm ; (d) Mass flow rates and pressure drop rate under 2000 mm .
Symmetry 13 01766 g011
Figure 12. Comparison of the mass flow rates: (a) Variation of liquid and total mass flow rates; (b) Variation of the maximum and average mass flow rates with pipeline length.
Symmetry 13 01766 g012
Figure 13. Comparison of mass flow rate with flow velocity.
Symmetry 13 01766 g013
Figure 14. Variation of gasification ratio of the extinguishing agent under different pipe lengths.
Symmetry 13 01766 g014
Figure 15. The bottle pressure and release time under different pipeline roughnesses: (a) Bottle pressures; (b) Bottle pressure drop rates; (c) Release times and percentages of liquid release duration.
Symmetry 13 01766 g015
Figure 16. Mass flow rates under different pipe roughnesses: (a) Liquid mass flow rates; (b) Vapor mass flow rates; (c) Liquid and total mass flow rates under pipe roughness of 0.32   mm ; (d) Variation of mass flow rates with pipe roughness.
Symmetry 13 01766 g016aSymmetry 13 01766 g016b
Figure 17. The variation of gasification ratio with pipeline roughness.
Symmetry 13 01766 g017
Publisher’s Note: MDPI stays neutral with regard to jurisdictional claims in published maps and institutional affiliations.

