Abstract
Monitoring manufacturing process variation remains challenging, especially within a rapid and automated manufacturing environment. Problematic and unstable processes may produce distinct time series patterns that could be associated with assignable causes for diagnosis purpose. Various machine learning classification techniques such as artificial neural network (ANN), classification and regression tree (CART), and fuzzy inference system have been proposed to enhance the capability of traditional Shewhart control chart for process monitoring and diagnosis. ANN classifiers are often opaque to the user with limited interpretability on the classification procedures. However, fuzzy inference system and CART are more transparent, and the internal steps are more comprehensible to users. There have been limited works comparing these two techniques in the control chart pattern recognition (CCPR) domain. As such, the aim of this paper is to demonstrate the development of fuzzy heuristics and CART technique for CCPR and compare their classification performance. The results show the heuristics Mamdani fuzzy classifier performed well in classification accuracy (95.76%) but slightly lower compared to CART classifier (98.58%). This study opens opportunities for deeper investigation and provides a useful revisit to promote more studies into explainable artificial intelligence (XAI).
1. Introduction
Statistical process control charts are commonly used to detect process variations in manufacturing processes [1]. Shewhart-based X-bar control chart introduced in 1920s remains as one of the most widely implemented statistical process control tool [2]. Time series plots from unstable processes would produce unnatural patterns such as trend up, trend down, sudden shift up and down, cyclic, stratification, and systematic patterns, as shown in Figure 1. Most of the time, normal patterns indicate a statistically in-control process. However, as time goes on, the manufacturing process may experience tool wear, operator fatigue, seasonal effects, failure of machine parts, fluctuation in power supply, and lose fixture, among others. For example, a sudden shift pattern could be attributed to failures in machined parts, and a cyclic pattern could be attributed to seasonal changes like fluctuation in temperature [3,4]. Identification and classification of these patterns complemented with process knowledge could be linked to a set of assignable causes for diagnosis purposes. As such, the ability to classify such pattern classes is invaluable for focusing the diagnosis efforts.
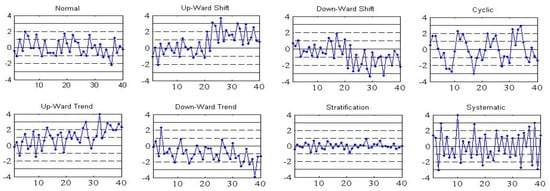
Figure 1.
Various types of control chart patterns.
Advances in computing and artificial intelligence (AI) have enabled these patterns to be automatically classified. Some of the popular soft computing methods used for control chart patterns recognition (CCPR) are artificial neural network (ANN), support vector machine (SVM), fuzzy inference system (FIS), decision tree and hybrid of these techniques [5,6,7,8]. ANN offers flexibility, learning capability, and is capable of handling noisy data. However, ANN is seen like a black box and provides limited internal comprehensibility to the user. It is difficult to interpret how a CCPR decision has been reached by the ANN-based classifier. Besides, it requires a relatively large amount of training data. Support Vector Machine, which uses the principle of structural risk minimization, is an attractive alternative for classification problems with a small sample size. However, SVM requires parameter optimization and needs to be linked with optimization tools. Also, it is challenging to select an appropriate kernel function in designing the SVM classifier [9]. Zhou et al. [10] proposed an integrated fuzzy SVM classifier for CCPR. They used a genetic algorithm to simultaneously optimize the input features subsets and parameters of the classifier. Sugumaran and Ramachandran [11] reported an application of a decision tree for feature selection and for generation of rule set for a fuzzy classifier for fault diagnosis of roller bearing. Recently Zan et al. [4,12] reported a potential application of convolution neural network (CNN) and information fusion for CCPR. However, CNN remain opaque especially among new researchers who need to understand the classification logic prior to exploring more complex and advanced techniques. Furthermore, there is growing demand for transparency in automated decision-making systems, and the trend is toward explainable and trustworthy AI especially for diagnostic purposes such as CCPR.
One of the comprehensible recognition approaches is fuzzy inference system (FIS). Zarandi et al. [7] investigated Mamdani FIS system with Western Electric [13] run rules, but their study did not include investigation to classify the control chart patterns. They used a run rules zone tests as the input membership function. Khajehzadeh and Asady [8] used the Sugeno FIS with subtractive clustering technique to classify control chart patterns. The second approach with interpretable steps is the classification by using a decision tree. Pham and Wani [14] used a decision tree as recognizer for identification of six basic types of control chart patterns. Gauri and Chakraborty [5,15] also proposed classification by a decision tree algorithm. Bag et al. [16] compared CART and quick unbiased efficient statistical tree (QUEST). They reported that the CART algorithm was more effective compared to the QUEST algorithm.
In development of CCPR, input data can be represented either as raw data or as minimal features set. However, it is not practical to use raw data directly for classification by either fuzzy classifiers or decision trees [14]. The most common approaches adopted by researchers are shape features, statistical features, or hybrids of both. Each type of feature set has its own merits and demerits considering different methods in their extraction and selection. Pham and Wani [14] used nine shape features for the first time to recognize six basic control chart patterns. Gauri and Chakraborty [15] used CART-based decision tree with seven shape features. Hassan et al. [17,18] proposed six statistical features set out of ten candidate features for CCPR using ANN recognizer. Al-Assif [19] used features based on wavelet denoise for ANN recognizer. Cheng et al. [20] proposed features based on correlation analysis and ANN as the recognizer. Khormali and Addeh [21] developed six new features based on type-2 fuzzy c-mean approach and support vector machine (SVM) as recognizer. Masood and Hassan [22] investigated feature-based ANN scheme for recognizing bivariate correlated patterns. Bag et al. [16] reported a study using CART to recognize different types of CCPs with shape features. Their results indicate that the performance of feature-based CCP recognition approach is promising. Hassan et al. [17] argued that significant improvement in classification performance of CCPR when using features compared to raw data is due to dimensionality reduction and compact classifier.
This study investigated two soft computing methods, namely fuzzy heuristics based on Mamdani fuzzy inference system, and Classification and Regression Tree (CART). Based on our review, there has been lack of study comparing these two methods particularly with statistical features as input representation for control chart pattern recognition. The purpose of this paper is to develop CCPR classifiers using the above two methods and compare their performance in classifying X-bar control chart patterns. These classification methods were chosen since they provide transparency and a comprehensible decision-making process, require relatively less training data, and potentially result in high recognition accuracy. Having comprehensible logic is desirable to create a trustworthy decision-making system. It also facilitates acceptance among practitioners especially when predicted patterns can be associated with diagnostic and preventive actions. The rest of the paper is organized as follows: Section 2 discusses the overall methodology, Section 3 covers the development of heuristic Mamdani fuzzy classifier, Section 4 explains the development of decision tree classifier, Section 5 presents the results and discussion, and finally, Section 6 concludes the paper.
2. Methodology
The methodology of the study involves sample patterns generation, statistical feature extraction, classifier design and development, and finally, performance evaluation.
2.1. Sample Patterns Generation
It is not economically possible to collect a sufficiently balanced amount of catastrophic unstable process data from real life situations. Thus, it is an acceptable practice for researchers in this area to use mathematical pattern generator to mimic real-life process deterioration [5, 17]. Furthermore, it is not possible to know exactly what type of patterns generated from the real process without thorough diagnosis of the real process. These data sets can be generated by standard patterns equations given in Table 1, along with the variability within the specified parameter ranges. A noise magnitude of 1/3σ was used in the pattern generators. These parameters were randomly varied between the specified ranges. We adopted a Swift [23] approach for sample data generation to provide various types of patterns as plotted on Shewhart X-bar chart. The notation μ represents the process mean for stable process, N represents standardized normal distribution and is the related parameters. In this study, each sampled data stream has 20 time series subgroup data with a sample size of five. It was assumed that all the sampled streams demonstrated fully developed patterns in the observation window before being recognized. Each data set has a total of 800 sample patterns, where each pattern type comprises 100 patterns.

Table 1.
Equations for control chart patterns samples generation [5,17].
2.2. Features Extraction
Statistical features extracted from raw data were used as input data representation to achieve dimensional reduction [9,24]. Ten statistical features were extracted from each of the sampled data streams. The candidate features were MEAN, standard deviation (SD), skewness, mean square value (MSV), cumulative sum (CUSUM), autocorrelation, range, MEDIAN, kurtosis and SLOPE. Some of the mathematical expressions of statistical features are summarized below [18].
- Skewness: The symmetry of shape distribution. The estimate of the skewness in data points from to is;
- Mean Square Value:
- CUSUM: It is the cumulative sum of values. The last statistical value of CUSUM is taken as the feature in this study. The general formula for upper and lower CUSUM statistics are:
- Autocorrelation: Exists when later data is dependent on previous data.
- Kurtosis: Measures the peakness of a distribution
The factor 3 is used for standard normal distribution to get k = 0.
- SLOPE: The first order line fitting. The slope m is used as a feature in this study.
The common ones are intentionally excluded from the above list. Each feature has different numerical values for each pattern, and they were normalized to be in the same range [−10, 10] to give appropriate scaling and visibility before being presented to the classifiers.
2.3. Classifier Design and Development
Two types of explainable classification method were used in this study, namely the fuzzy inference system (FIS) and classification and regression trees (CART). Fuzzy classifier is transparent to interpretation and analysis. The development of fuzzy classifier involves representation of data in fuzzy set format, selecting optimal fuzzy sets using similarity analysis, designing FIS and finally testing and performance evaluation. We implemented Mamdani FIS using the MATLAB fuzzy toolbox since this heuristic was more appropriate for our CCPR compared to the Sugeno FIS. The simplified fuzzy triangular membership function was used as input and fuzzy IF-THEN rules for inference engine. Since a crisp value of the output was required, the final value of fuzzy output was defuzzified using the smallest of maximum (SOM) method.
The second classification technique, CART performs patterns classification by recursively partitioning the data space into an appropriate class partition. The partitioning can be visualized graphically as a decision tree. The CART in this study was implemented through rpart (Recursive Partitioning and Regression Trees) library in R, an open-source programming environment [25]. Further discussion on the classifiers’ development is provided in Section 3 and Section 4, respectively.
2.4. Performance Evaluation
Six data sets were used for training and testing, where each data set consists of a total of 800 sample patterns. Overall, a total of 4800 data were used where 60% for training and 40% for testing the classifiers. The performance was evaluated in terms of classification accuracy and presented in terms of confusion matrix. The investigated classification heuristics were validated using published data set from Alcock [26].
3. Development of Heuristic Mamdani Fuzzy Classifier
The development of fuzzy classifier involves representation of data in fuzzy set format, selection of suitable fuzzy sets and then design of Mamdani fuzzy inference system (FIS). The general steps in the development of fuzzy classifier are shown in Figure 2.

Figure 2.
Generalized steps in the fuzzy classifier development.
To determine the fuzzy sets for each feature, we adopted the simplest method by determining the maximum, medium, mean and minimum values for each pattern in each input feature space. The ten initial statistical features were extracted from 600 samples for each type of patterns. The box plots were used to represent feature space for each pattern. An example of a box plot for feature MEAN is shown in Figure 3 where pattern types are shown on the horizontal axis. The box plots represent median points, 75 and 25 percentiles and maximum and minimum points in the feature space. The vertical axis shows the normalized values of the feature MEAN between [−10, 10]. Overlapping can be seen from feature spaces such as for Shift up and Trend up patterns and similarly for Shift down and Trend down patterns. The feature spaces for Normal, Cyclic and Systematic patterns are distributed around zero. This phenomenon occurs due to the nature of these patterns where the expected mean values for the observed points center to zero.
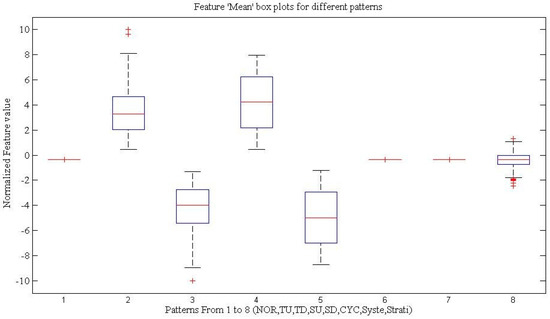
Figure 3.
Example of feature MEAN representation as box plot for each pattern.
The process of fuzzification has two steps: one is to assign fuzzy labels, and the second is to assign numerical meaning to each label. Figure 4 shows an example of membership function for feature MEAN as fuzzy input. Among the different types of membership functions, we used triangular membership functions as a preliminary analysis due to its simplicity. Three points: upper bound, lower bound and center points are required to completely define a fuzzy set. The three points were selected from the box plots for each of the features and the respective patterns as shown in Figure 3. Each fuzzy set starts at minimum and ends with maximum of feature space. The peak is the median of the feature space. Each fuzzy set represents a pattern class. As shown in Figure 4, the feature MEAN has a universe of input with crisp values divided into five fuzzy sets. These crisp inputs are converted to fuzzy variables with membership degrees at y-axis. For example, a MEAN value 6.0 on the x-axis belongs to the fuzzy linguistic variable SU with a membership degree 0.8.
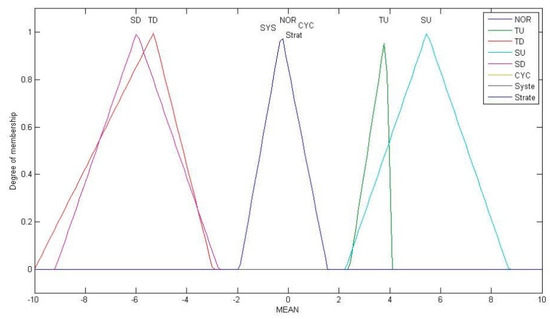
Figure 4.
An example of membership functions for feature MEAN with its respective indicative patterns.
Having overlapping fuzzy sets can cause difficulty in interpretation. As shown in Figure 4, fuzzy sets SU and TU, and SD and TD shared some of the crisp values. Likewise, the crisp values for patterns NOR, CYC, STRAT and SYS are concentrated at similar values on the x-axis. The fuzzy sets were then simplified using simplification rules given by Setnes et al. [27]. This involved deleting and merging of the sets. The fuzzy sets reduction was done based on a similarity measure (S) as in Equation (8).
If value of S = 1 then the two sets are identical, and if S = 0 the two sets are completely different. In this study we used a threshold S = 0.5. If S > 0.5, the two sets were merged. Similar analysis was conducted for all features and the final feature sets after simplification are shown in Figure 5. We empirically selected eight statistical features to be used in designing the Mamdani FIS, namely, features MEAN, standard deviation (SD), mean square value (MSV), CUSUM, autocorrelation, range, kurtosis, and SLOPE.
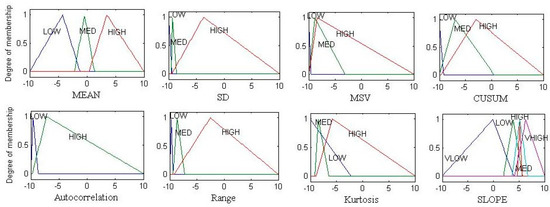
Figure 5.
Simplified fuzzy sets after applying simplification analysis.
We omitted feature MEDIAN simply because it has high similarity with feature MEAN. Feature skewness was also omitted since its fuzzy set covers the entire universe and all fuzzy sets overlap with each other. After fuzzy set simplification, each fuzzy set linguistic name was relabeled to VLOW, LOW, MED, HIGH, and VHIGH as shown in Figure 5. These relabeling are important for designing IF-THEN rules for fuzzy classifiers. Selected fuzzy sets were finally converted into trapezoidal shape as deemed more appropriate, specifically for feature MEAN.
The next step in fuzzy classifier design is to formulate the inference engine, the fuzzy IF-THEN Rules. The antecedent IF part is the summation of fuzzy sets, and the consequent part is the pattern class. Iterations and fine tuning of IF-THEN rules was performed to obtain good inference system for the recognition of eight types of control chart patterns. The smallest of maximum (SOM) defuzzification method was used for the output fuzzy sets. The SOM method selects the smallest output with the maximum membership function (crisp value). The fuzzy IF-THEN rules are summarized in Table 2 formulated as the best after undergoing several simulation iterations. The stratification pattern requires two rules to discriminate it from normal and cyclic patterns. The final graphical representation of fuzzy rules is shown in Figure 6 where inputs are the first eight columns, and the last column is the output.

Table 2.
Fuzzy heuristic IF-THEN rules.
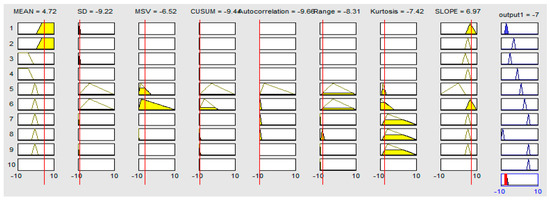
Figure 6.
Graphical representation of the IF-THEN rules in MATLAB fuzzy toolbox.
4. Development of Decision Tree Classifier
The decision tree (DT) in this study was generated by using rpart subroutine in R programming [25,28]. The rpart implemented many of the ideas found in the CART of Breiman et al. [29]. It performs binary recursive partitioning where the parent is split into two child branches. This process is repeated until the terminal leaf is reached. The algorithm automatically selects the ‘right-sized’ classification tree and input features that have good predictive accuracy. The default splitting criteria in rpart is based on Gini splitting rule since it usually performs the best. The stopping rule was set to prevent the model from over-fitting, where the complexity parameter was set to a default value 0.01. The data set was randomly divided into 60% training data and 40% testing data. This ensures the classifiers are sufficiently trained, and the testing results are not biased to small sample size. The proposed classification tree is shown in Figure 7 comprising seven nodes (oval shape) and eight leaves (square shape). The predicted pattern type is given at each leaf (terminal) as listed in Table 3. The significant features included in the decision-making are MEAN, standard deviation (SD), mean square value (MSV), and SLOPE. The insignificant features were excluded from the DT.
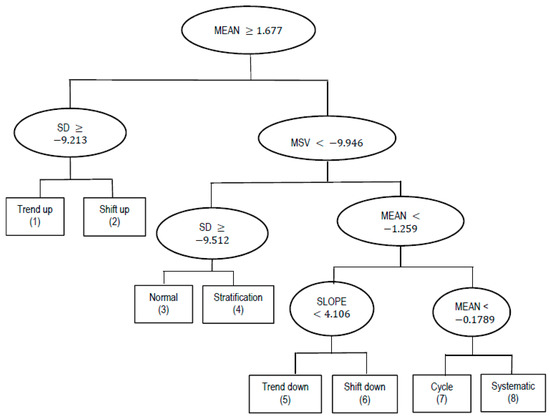
Figure 7.
Classification tree for control chart patterns based on partitions of statistical features.

Table 3.
Decision rules derived from the decision tree.
5. Results and Discussion
The performance of the fuzzy heuristics and the decision tree (DT) classifier was evaluated using six different data sets. Each data sets comprised 40 samples of each type of control chart patterns. Overall, a total of 1920 (6 sets × 40 sample × 8 types) unseen samples were used in testing the classifiers. The performance of the proposed methods in terms of recognition accuracy is summarized in Table 4. The results suggest that the overall recognition accuracy ( for the DT classifier (98.58%) is better compared to the fuzzy classifier (95.76%). The DT classifier also gave more consistent results (σ = 0.48) compared to the fuzzy classifier (σ = 1.09) despite using only four statistical features compared to the fuzzy classifier with eight features. The fuzzy classifier seems to have more difficulty in classifying trend up patterns (85.4%) and systematic patterns (86.0%) compared to the DT classifier. However, fuzzy classifier performed better in classifying normal patterns (100%).

Table 4.
Recognition accuracy of the two methods.
The confusion matrices for the fuzzy classifier and the DT classifier are shown in Table 5 and Table 6, respectively. These tables show the correct recognition rate in diagonal positions and the misclassification rate at off-diagonal positions. Table 5 reveals that normal pattern is the most likely to be confused for true patterns of trend up (2.4%), cyclic (1.6%) and systematic (7.8%). The results also indicate that systematic patterns are sometimes confused with cyclic patterns (6.2%). Both shift patterns (up and down) were perfectly classified by the fuzzy classifier. This confirms that shift patterns are among the easiest to be differentiated. Trend up pattern tends to be confused with shift up patterns (12.2%) and trend down patterns tends to be confused with shift down patterns (3.7%).

Table 5.
Confusion matrix for the fuzzy classifier.

Table 6.
Confusion matrix for the decision tree (DT) classifier.
Table 6 shows that the DT classifier performed well for shift down, cyclic, systematic and stratification patterns with 100% classification accuracy. The DT classifier has a small tendency for normal patterns (stable process) to be confused with systematic patterns (3.9%). Showing a similar trend to the fuzzy classifier, trend down patterns tends to be confused with shift down patterns (3.5%). Shift up patterns tends to be confused with trend up patterns (4%). Overall, as noted earlier, the DT classifier performed relatively better than the fuzzy classifier.
From the above, we observed that both the heuristic fuzzy classifier and the DT classifier provide useful information in deriving the final decision. In case of heuristic fuzzy classifier, the IF-THEN rules are simple, interpretable, and capable of classifying eight types of patterns. The main drawback of heuristic fuzzy classifier is that the formation of input fuzzy set and simplification of fuzzy sets require manual tuning. The use of three points for each fuzzy set i.e., maximum, minimum and median significantly reduced the data requirements in the development step. The fuzzy classifiers by nature do not require large training data. Meanwhile, the DT method provides a simple graphical view and understandable decision-making processes. The drawback of DT is that it requires more training data sets; otherwise, the recognition results tend to be poor.
The performance of the above classification methods was validated by using a published data set from Alcock [26]. The recognition accuracies of 94.16% and 97.9% were obtained for the heuristic fuzzy classifier and the DT classifier, respectively. The validation results confirmed the consistency of recognition accuracy of the proposed classifiers. The proposed DT classifier performed relatively better compared to Gauri and Chakraborty [15], who reported an overall 95.46% recognition accuracy when implemented with their seven shape features. Our proposed classifier scored 98.58% recognition accuracy with only four statistical features as input data. We were unable to make direct comparison for the proposed fuzzy classifier due to lack of comparable published works. The readers need to be cautious in generalizing the above findings as more comparison with other similar works are recommended whenever possible.
6. Conclusions
As manufacturing industries are moving toward intelligent systems, we notice widespread adoption of AI-based systems with limited transparency in decision-making processes. In process monitoring and diagnosis, it is important to have transparency in key decisions to avoid misjudgment that could lead to catastrophic failures. This paper demonstrates the development of heuristics fuzzy inference system and DT techniques for control chart pattern recognition. The logical rules for decision-making are outlined as explainable in IF-THEN decision rules. The overall recognition accuracy of the DT classifier is found to be better and more consistent (μ = 98.58%, σ = 0.48) compared to the heuristics Mamdani fuzzy classifier (μ = 95.76%, = 1.09). The DT classifier only requires four statistical features, while the heuristics Mamdani FIS requires eight statistical features for classifying the same eight types of control chart patterns. Both methods provide explainable classification steps rather than a black box, and this could be more attractive and convincing for decision makers. The efficiency of the fuzzy classifier could be further improved by implementing automatic formation of input fuzzy sets. Investigation of adaptive neuro-fuzzy inference systems (ANFIS) could also boost its efficiency and learning ability. This study may serve as a starting point for investigation of more advanced DT families such as random forest. It opens opportunities for deeper investigation and provides a useful revisit into explainable artificial intelligence.
Author Contributions
Conceptualization, M.Z. and A.H.; methodology, M.Z. and A.H.; software, M.Z.; validation, M.Z.; formal analysis, M.Z. and A.H.; investigation, M.Z. and A.H.; resources, M.Z. and A.H.; data curation, M.Z.; writing—original draft preparation, M.Z.; writing—review and editing, A.H.; visualization, M.Z.; supervision, A.H.; project administration, A.H.; funding acquisition, A.H. All authors have read and agreed to the published version of the manuscript.
Funding
This research was funded by Ministry of Higher Education Malaysia and Research Management Center, Universiti Teknologi Malaysia through FRGS-UTM Grant No: Q.J130000.2551.21H58.
Institutional Review Board Statement
Not applicable.
Informed Consent Statement
Not applicable.
Data Availability Statement
Not applicable.
Conflicts of Interest
The authors declare no conflict of interest.
References
- Irianto, D.; Juliani, A. A Two Control Limits Double Sampling Control Chart by Optimizing Producer and Customer Risks. J. Eng. Technol. Sci. 2010, 42, 165–178. [Google Scholar] [CrossRef][Green Version]
- Montgomery, D.C. Introduction to Statistical Quality Control, 7th ed.; John Wiley & Sons Pte.: Singapore, 2013. [Google Scholar]
- Zaman, M.; Hassan, A. Improved Statistical Features-based Control Chart Patterns Recognition Using ANFIS with Fuzzy Clustering. Neural Comput. Appl. 2018, 31, 5935–5949. [Google Scholar] [CrossRef]
- Zan, T.; Liu, Z.; Su, Z.; Wang, M.; Gao, X.S.; Chen, D. Statistical Process Control with Intelligence Based on the Deep Learning Model. Appl. Sci. 2019, 10, 308. [Google Scholar] [CrossRef]
- Gauri, S.K.; Chakraborty, S. Feature-based Recognition of Control Chart Patterns. Comput. Ind. Eng. 2006, 51, 726–742. [Google Scholar] [CrossRef]
- Ebrahimzadeh, A.; Addeh, J.; Ranaee, V. Recognition of Control Chart Patterns Using an Intelligent Technique. Appl. Soft Comput. 2013, 13, 2970–2980. [Google Scholar] [CrossRef]
- Zarandi, M.H.F.; Alaeddini, A.; Turksen, B. A Hybrid Fuzzy Adaptive Sampling–run Rules for Shewhart control charts. Inf. Sci. 2008, 178, 1152–1170. [Google Scholar] [CrossRef]
- Khajehzadeh, A.; Asady, M. Recognition of Control Chart Patterns Using Adaptive Neuro-fuzzy Inference system and Efficient Features. Int. J. Sci. Eng. Res. 2015, 6, 771–779. [Google Scholar]
- Xanthopoulos, P.; Razzaghi, T. A Weighted Support Vector Machine Method for Control Chart Pattern Recognition. Comput. Ind. Eng. 2014, 70, 134–149. [Google Scholar] [CrossRef]
- Zhou, X.; Jiang, P.; Wang, X. Recognition of Control Chart Patterns using Fuzzy SVM with a Hybrid Kernel Function. J. Intell. Manuf. 2018, 29, 51–67. [Google Scholar] [CrossRef]
- Sugumaran, V.; Ramachandran, K.I. Automatic Rule Learning using Decision Tree for Fuzzy Classifier Fault Diagnosis of Roller Bearing. Mech. Syst. Signal Process. 2007, 21, 2237–2247. [Google Scholar] [CrossRef]
- Zan, T.; Su, Z.; Liu, Z.; Chen, D.; Wang, M.; Gao, X.S. Pattern Recognition of Different Window Size Control Charts Based on Convolutional Neural Network and Information Fusion. Symmetry 2020, 12, 1472. [Google Scholar] [CrossRef]
- Western Electric Company. Statistical Quality Control Handbook; The Mack Printing Company: Pennsylvania, PA, USA, 1956. [Google Scholar]
- Pham, D.T.; Wani, M. Feature-based Control Chart Pattern Recognition. Int. J. Prod. Res. 1997, 35, 1875–1890. [Google Scholar] [CrossRef]
- Gauri, S.K.; Chakraborty, S. Recognition of Control Chart Patterns Using Improved Selection of Features. Comput. Ind. Eng. 2009, 56, 1577–1588. [Google Scholar] [CrossRef]
- Bag, M.; Gauri, S.K.; Chakraborty, S. Feature-based Decision Rules for Control Charts Pattern Recognition: A Comparison Between CART and QUEST Algorithm. Int. J. Ind. Eng. Comput. 2012, 3, 199–210. [Google Scholar] [CrossRef]
- Hassan, A.; Baksh, M.S.N.; Shaharoun, A.M.; Jamaluddin, H. Improved SPC Chart Pattern Recognition Using Statistical Features. Int. J. Prod. Res. 2003, 41, 1587–1603. [Google Scholar] [CrossRef]
- Hassan, A.; Baksh, M.S.N.; Shaharoun, A.M.; Jamaluddin, H. Feature Selection for SPC Chart Pattern Recognition using Fractional Factorial Experimental Design. In Intelligent Production Machines and System: 2nd I* IPROMS Virtual International Conference; Pham, D.T., Eldukhri, E.E., Soroka, A.J., Eds.; Elsevier: Amsterdam, The Netherlands, 2011; pp. 442–447. [Google Scholar]
- Al-Assaf, Y. Recognition of Control Chart Patterns using Multi-resolution Wavelets Analysis and Neural Networks. Comput. Ind. Eng. 2004, 47, 17–29. [Google Scholar] [CrossRef]
- Cheng, C.-S.; Huang, K.-K.; Chen, P.-W. Recognition of Control Chart Patterns Using a Neural Network-based Pattern Recognizer with Features Extracted from Correlation Analysis. Pattern Anal. Appl. 2012, 18, 75–86. [Google Scholar] [CrossRef]
- Khormali, A.; Addeh, J. A Novel Approach for Recognition of Control Chart Patterns: Type-2 fuzzy clustering optimized support vector machine. ISA Trans. 2016, 63, 256–264. [Google Scholar] [CrossRef]
- Masood, I.; Hassan, A. Pattern Recognition for Bivariate Process Mean Shifts using Feature-based Artificial Neural Network. Int. J. Adv. Manuf. Technol. 2013, 66, 1201–1218. [Google Scholar] [CrossRef]
- Swift, J.A. Development of a Knowledge-Based Expert System for Control Chart Pattern Recognition and Analysis; Oklahoma State University: Stillwater, OK, USA, 1987. [Google Scholar]
- Bennasar, M.; Hicks, Y.; Setchi, R. Feature Selection Using Joint Mutual Information Maximization. Expert Syst. Appl. 2015, 42, 8520–8532. [Google Scholar] [CrossRef]
- R-4.0.3 for Windows. Available online: https://cran.r-project.org/bin/windows/base/ (accessed on 19 June 2019).
- Alcock. Available online: http://archive.ics.uci.edu/ml/databases/syntheticcontrol/syntheticcontrol.data.html (accessed on 20 June 2019).
- Setnes, M.; Babuska, R.; Kaymak, U.; van Nauta Lemke, H.R. Similarity Measures in Fuzzy Rule Base Simplification. IEEE Trans. Syst. Man Cybern. Part B 1998, 28, 376–386. [CrossRef] [PubMed]
- De Sá, J.P.M. Applied Statistics using SPSS, Statistica, MATLAB and R; Springer Company: New York, NY, USA, 2007; pp. 205–211. [Google Scholar]
- Breiman, L.; Friedman, J.H.; Olshen, R.A.; Stone, C.J. Classification and Regression Trees; Wadsworth and Brooks: Monterey, CA, USA, 1984. [Google Scholar]
Publisher’s Note: MDPI stays neutral with regard to jurisdictional claims in published maps and institutional affiliations. |
© 2021 by the authors. Licensee MDPI, Basel, Switzerland. This article is an open access article distributed under the terms and conditions of the Creative Commons Attribution (CC BY) license (http://creativecommons.org/licenses/by/4.0/).