1. Introduction
Neuromuscular function and motion evaluation is important in different (non)clinical human movement-related areas [
1,
2]. Traditionally, it has been assessed using standardized isometric or isokinetic protocols used to quantify maximal force and rate of force development (RFD) [
3]. However, it has been shown that rapid force generation during voluntary contractions better relates to sport-specific performance and functional daily tasks than maximal force does [
4]. In the past few years, RFD scaling factor (RFD-SF) was introduced as a tool to quantify the ability for rapid force generation.
To our knowledge, there is only one study that explored potential interlimb asymmetries in knee RFD-SF with a small number of subjects [
5] while RFD-SF of ankle joint has not yet been evaluated to date. Interlimb asymmetries are known as a risk factor for lower limb injuries [
6]. In the past few years, strength deficits and contralateral differences were assessed through maximal force or torque [
7], RFD [
8,
9], and isokinetic performance variables [
10]. These measures are more representative for movements which require maximal force production. The advantage of RFD-SF protocol is rapid force generation assessment during different force ranges that are important during sports and daily activities. Assessment of explosive force production across the span of intensities (and not only during maximal intensity such as in RFD) could provide meaningful information. Lower limb strength and power cut-off threshold for interlimb asymmetry identification ranges from 10 to 15% [
11,
12,
13], while all studies support that the upper limit which has been considered as a risk factor is 15% [
10]. Therefore, information about identifying interlimb asymmetry with RFD-SF on a greater number of subjects and different joints (ankle, knee) could provide new insights for future research and clinical practice. Although RFD-SF was reported as a reliable method for a number of muscle groups [
14,
15,
16], results related to the generalizability (associations between muscle groups) of this measure are limited only to the index finger, elbow, and knee [
14]. No similar study exists for muscle groups in lower extremities.
In our study, we will use the term rate of torque development scaling factor (RTD-SF) as the torque values were recorded. RFD-SF and RTD-SF measures are independent of the units (N or Nm), so they represent comparable measures. Based on the reviewed literature and lack of evidence, the first aim of our study was to assess interlimb asymmetries with RTD-SF between dominant and non-dominant leg for PF and KE. We hypothesized that RTD-SF is sensitive to identify subjects with asymmetries (>15% interlimb difference) in PF and KE. The second aim was to determine associations in RTD-SF between different lower limb joints. We hypothesized that there will be moderate to strong positive correlations between plantar flexors (PF) and knee extensors (KE) RTD-SF.
2. Materials and Methods
2.1. Subjects
Forty young healthy athletes (6 female, 34 male, 14.8 ± 1.2 years, 175.9 ± 8.4 cm, 63.5 ± 10.1 kg, BMI: 20.4 ± 2.2 kg/m2, left dominant: 25, right dominant: 15) from volleyball (10), tennis (5), basketball (10), soccer (10) and track and field (5) participated in the study. To determine side-dominance, we asked subjects which foot they use as a push-off leg to perform a unilateral jump. Subjects with lower limb injuries in the past 6 months, back pain, neurological disorders, or recent general disease were excluded from the study. Information about testing procedures and written informed consent were provided to subjects and their parents/guardians prior to the experiment. Slovenian Medical Ethics Committee approved the experiment (approval no. 0120-99/2018/5) according to the Declaration of Helsinki.
2.2. Study Design
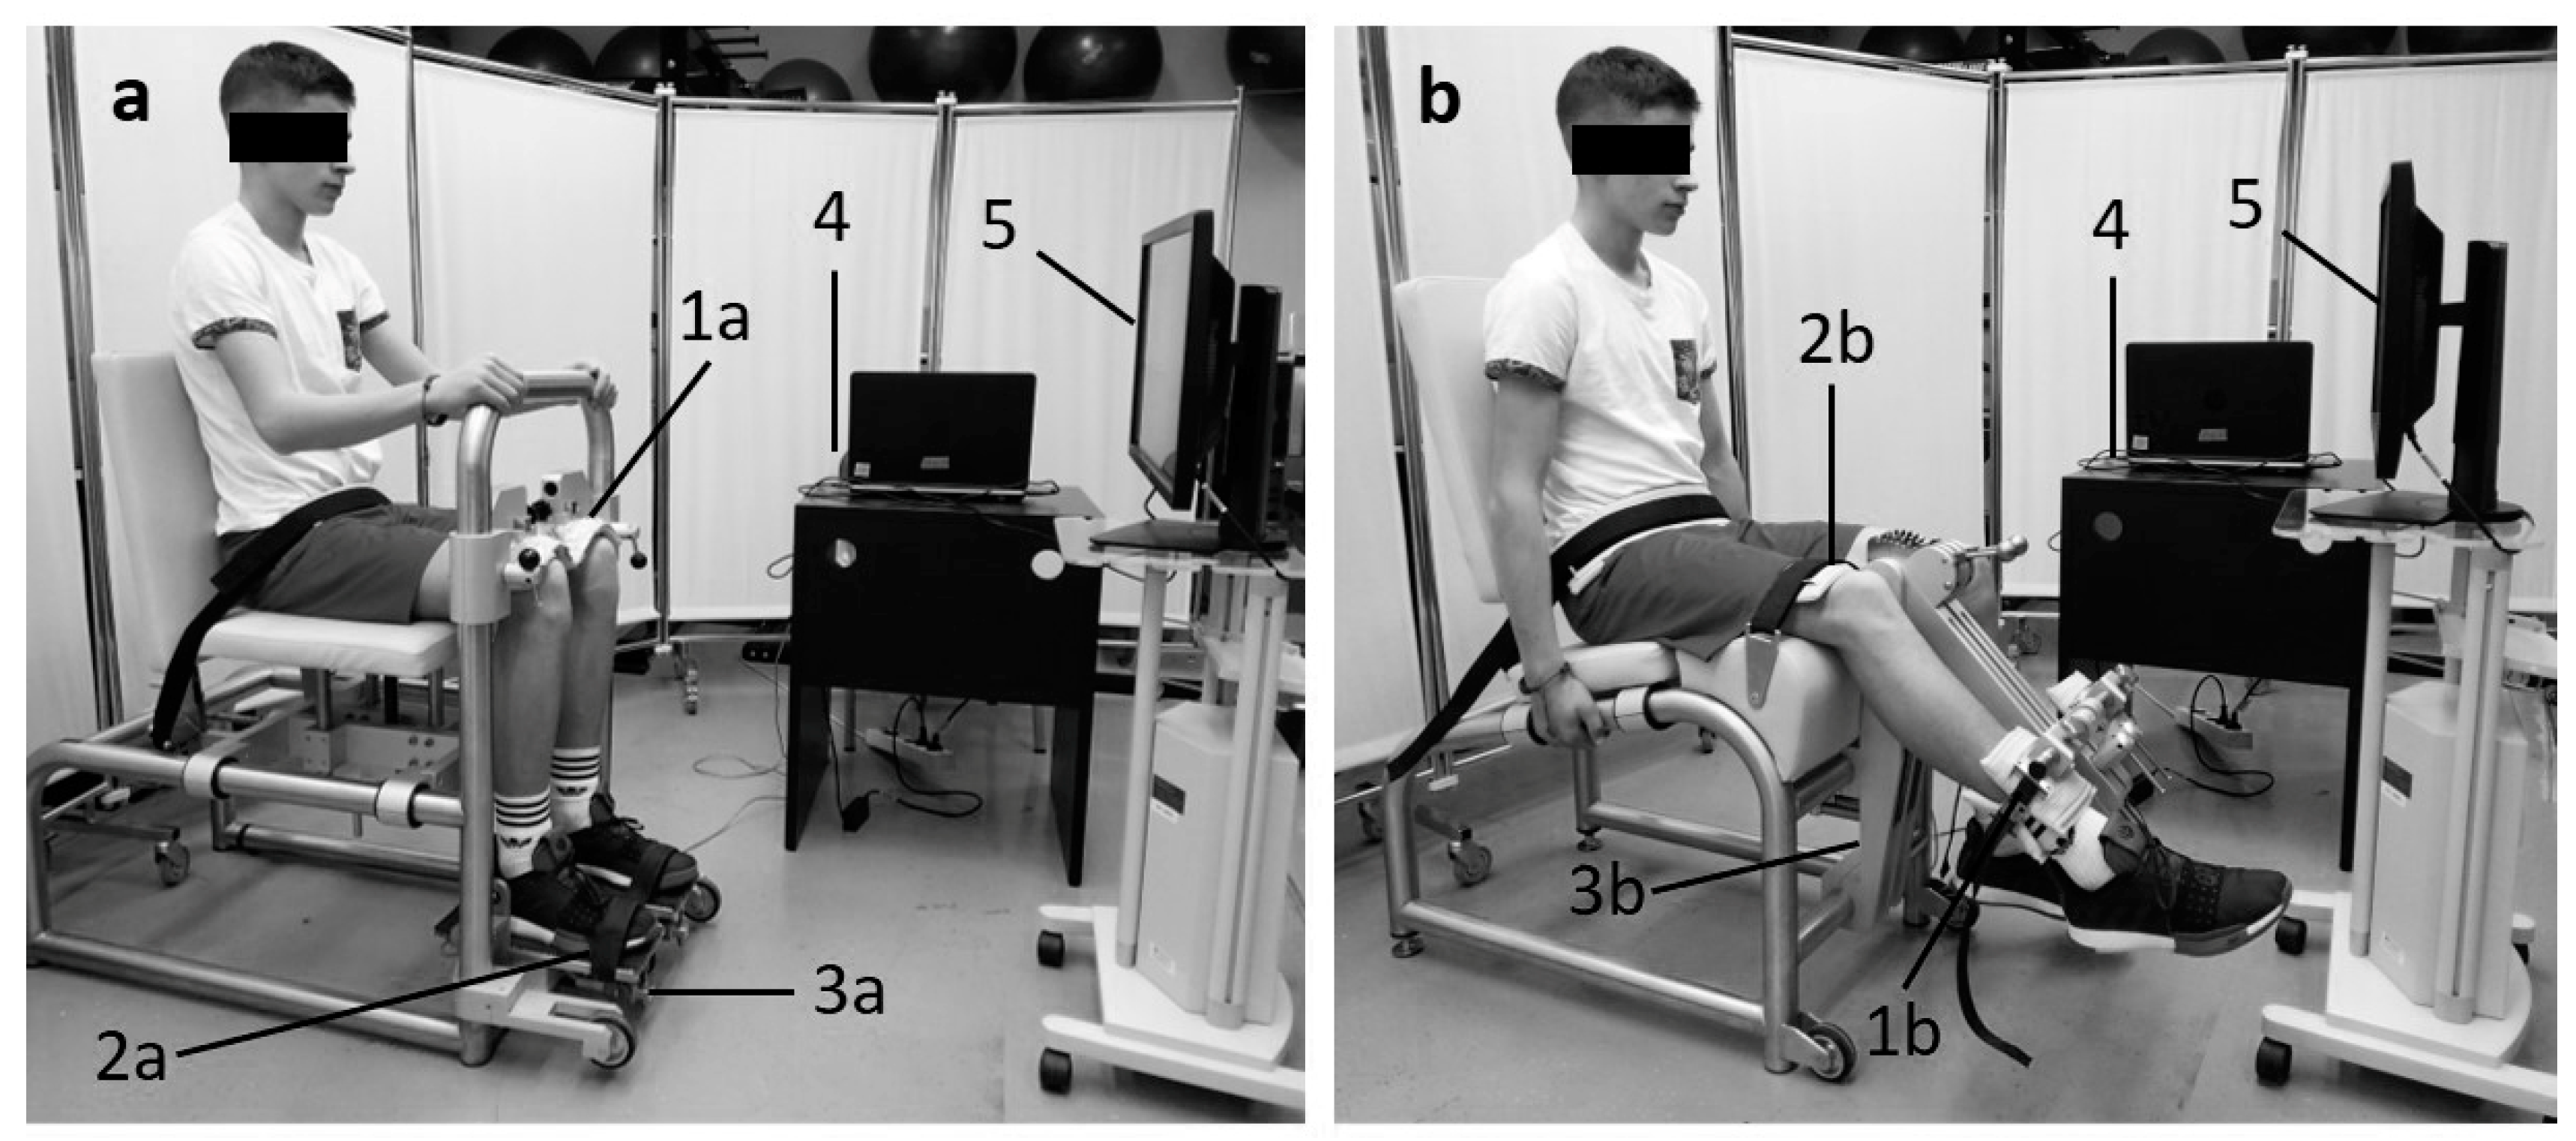
The study was designed to: (1) assess differences in RTD-SF between the dominant and non-dominant legs for PF and KE and (2) evaluate associations in RTD-SF between PF and KE on the dominant leg. After a standardized 10-min warm up (light running (5 min), dynamic stretching (4 min) and activation exercises (1 min)) each subject performed rapid isometric contractions (random order) for each condition: (unilateral PF: dominant and non-dominant, unilateral KE: dominant and non-dominant) with 3 min of rest between each condition. The subject performed maximally rapid torque pulses to 20, 40, 60 and 80% of pre-measured maximal isometric torque. For each torque level, they performed approximately 20–25 rapid isometric contractions. There was 60 s of rest between different intensities and 3 min between each condition. The target torque was displayed on a computer screen (horizontal line on the graph) which was set at the eye level of the subject (
Figure 1). Subjects performed selected submaximal intensities in a random order. The number of pulses and measurement protocol were conducted as previously described by Bellumori et al. [
14].
2.3. Testing Procedures
Ankle RTD-SF measurements were obtained using isometric ankle dynamometer (S2P, Science to Practice, ltd., Ljubljana, Slovenia) (
Figure 1a). The dynamometer was adjusted to the subject. Ankles, knees and hips were at 90° in the sagittal plane. Mechanically independent pedals were used to fix both feet. The lateral malleolus of the ankles was aligned with the axis of each pedal. Heel lifting was prevented with mechanical brakes over the knees. Tightly fastened rigid straps at the level of the metatarsophalangeal joints were placed over the dorsum of each foot. Knee RTD-SF measurements were obtained using isometric knee dynamometer (S2P, Science to Practice, Ltd., Ljubljana, Slovenia) [
17] (
Figure 1b). The hips angle was set to 90° flexion, while the knee angle was set to 60° flexion (full knee extension = 0°). The knee axis was aligned with the axis of the dynamometer‘s lever arm, while the shank was supported 2 fingers proximal of lateral malleolus. Hip fixation was ensured with a strap over the pelvis.
2.4. Data Acquisition and Analysis
Force transducers (1-Z6FC3/200kg, Hottinger-Baldwin Messtechnik GmbH, Darmstadt, Germany) were used to sample the signal at 1000 Hz by a custom-made LabView 2015 routine (National Instruments Corp., Austin, TX, USA). The raw data were filtered with a low-pass filtering with a 5-Hz cut-off frequency. For the data analyses, we used another adjusted custom-made LabView 2015 routine. For each subject we calculated RTD-SF (slope of the regression line from subset of submaximal pulses) and r2 (linearity of the regression line). The relationship between the peak torque and corresponding peak RTD was used to obtain regression parameters.
2.5. Statistical Analysis
Descriptive data of the dependent variables are presented as means and standard deviations. The Shapiro–Wilk test was used to assess data normality. Fisher’s z-transformation was used to transform r
2 to obtain normal distribution. Differences in RTD-SF between dominant and nondominant leg for PF and KE were evaluated with paired sample
t-test. Interlimb asymmetry was calculated with equation:
Pearson correlation coefficients were used to determine the relationship of dependent variables between muscle groups (PF, KE). Correlation was interpreted as defined by Hopkins et al. [
18], (0–0.19 trivial; 0.10–0.29 small; 0.30–0.49 moderate; 0.50–0.69 large; 0.70–0.89 very large; 0.90–0.99 nearly perfect; 1 perfect). Significance level was set at
p < 0.05 (two-tailed). Statistical analyses were performed using the SPSS (IBM SPSS v26.0 Chicago, IL, USA) software package.
3. Results
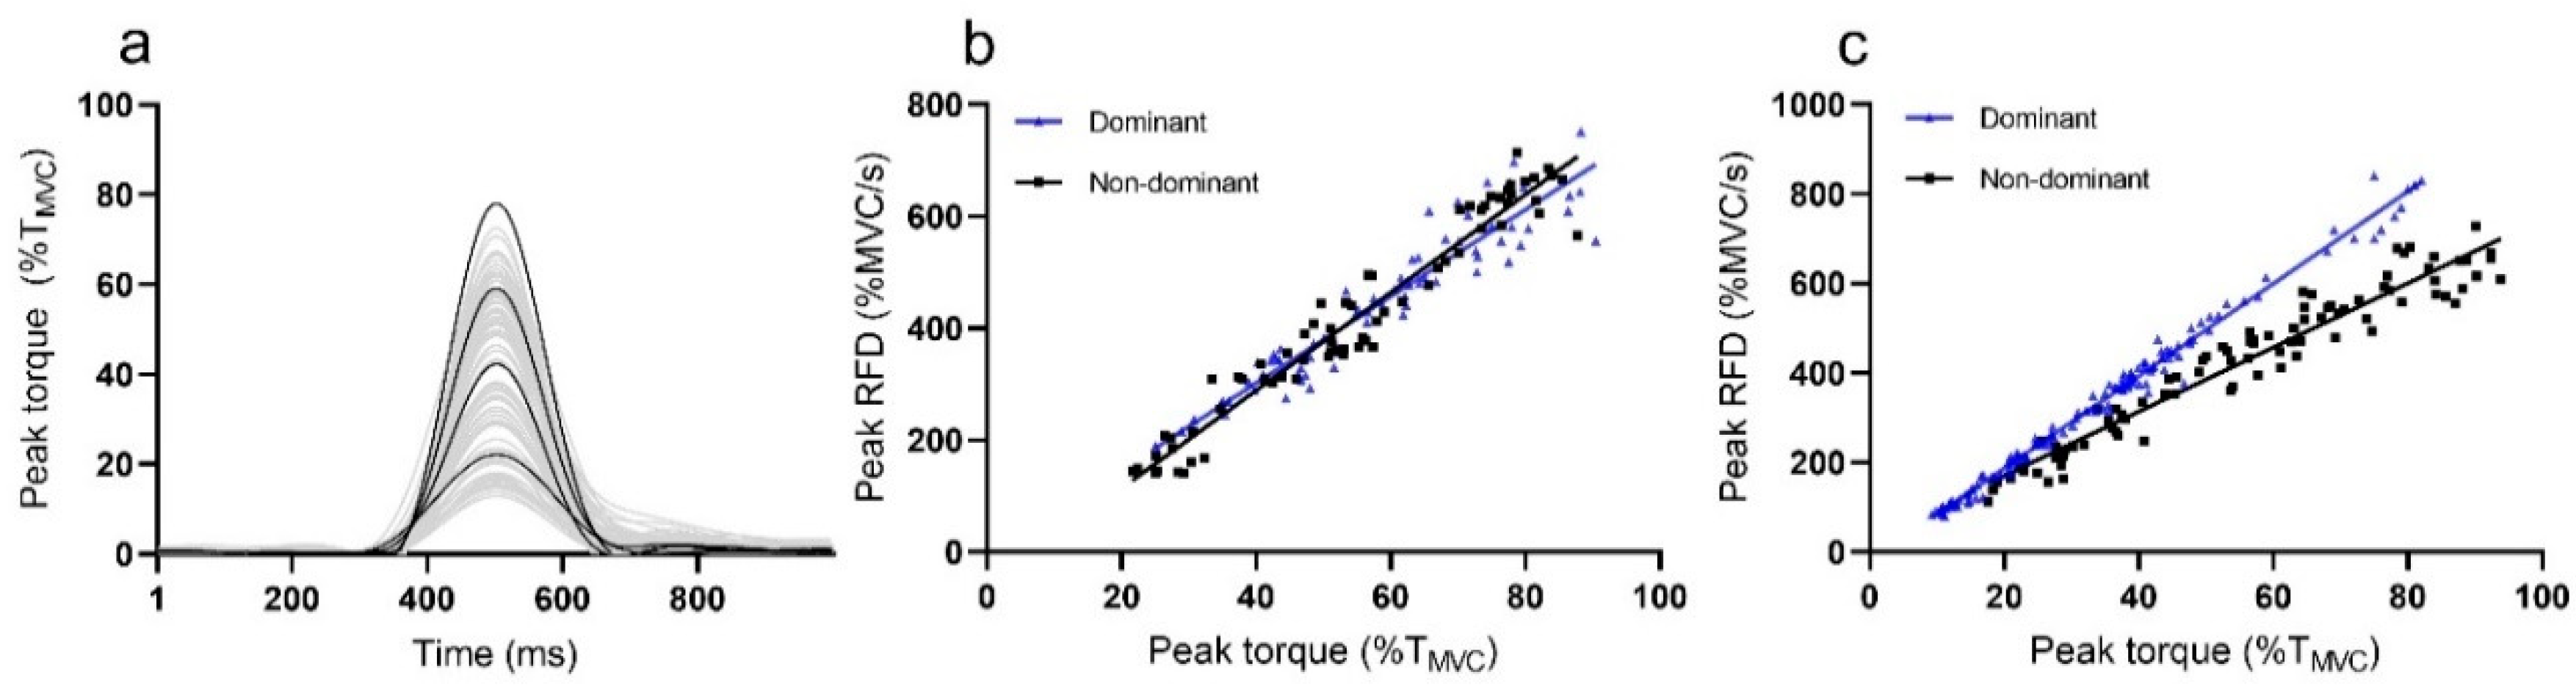
Sample recordings of rapid pulses during RTD-SF measurement from representative subject are presented in
Figure 2a, while differences between plots of dominant and non-dominant leg are presented in
Figure 2b (PF) and 2c (KE).
The average RTD-SF for the PF dominant leg was 5.9 ± 1.1/s, while the average RTD-SF for the dominant KE was 7.9 ± 1.4/s. A strong linear relationship was calculated for dominant leg of PF (r2 = 0.90 ± 0.06) and KE (r2 = 0.89 ± 0.1).
In PF, no interlimb differences between dominant (5.9 ± 1.1/s, r2 = 0.90 ± 0.06) and non-dominant (5.85 ± 1.0/s, r2 = 0.91 ± 0.06) were calculated for RTD-SF (p = 0.69) and r2 (p = 0.68). For the KE, there was also no significant differences between the dominant (7.9 ± 1.4/s, r2 = 0.89 ± 0.1) and non-dominant leg (7.9 ± 1.2/s, r2 = 0.92 ± 0.1) for RTD-SF (p = 0.995) and r2 (p = 0.140).
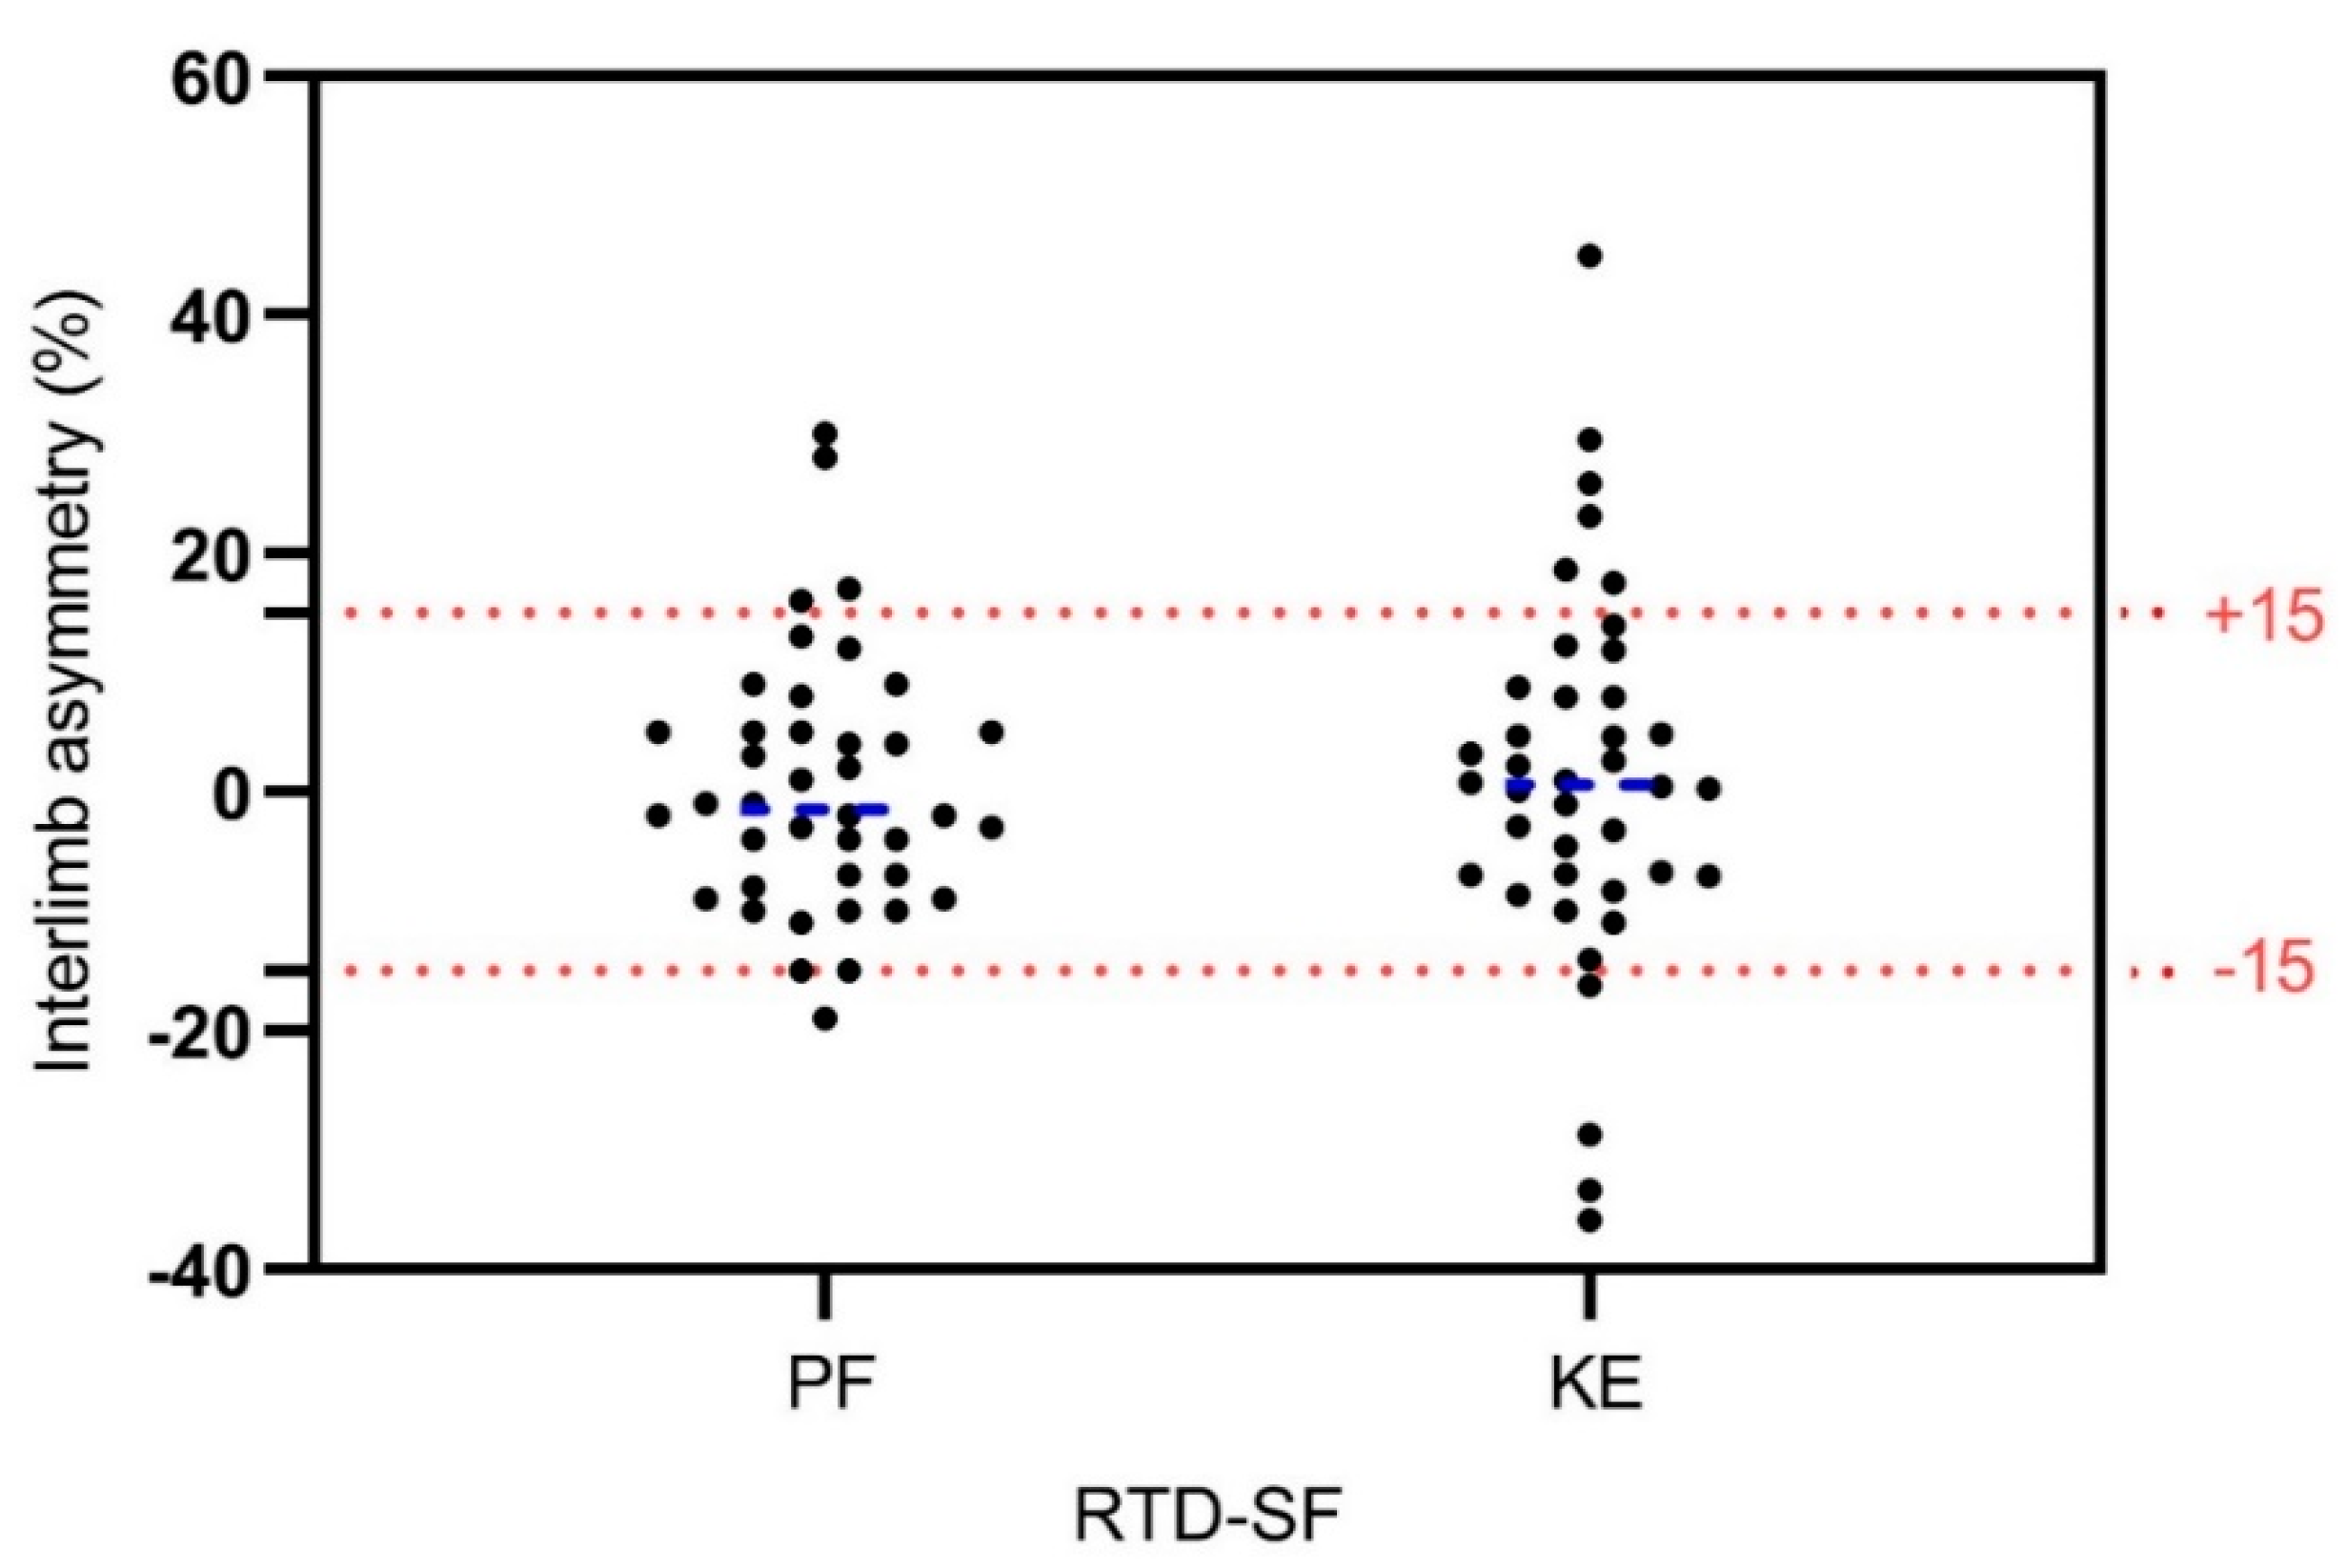
Identification of asymmetries (interlimb asymmetries >15%) using RTD-SF revealed 10% of asymmetric subjects in PF and 15% of asymmetric subjects in KE (
Figure 3).
Significant positive moderate correlations between PF and KE were obtained for RTD-SF (r = 0.401, p = 0.013), while there was no correlation for r2 (r = 0.099, p = 0.544).
4. Discussion
The main findings of our study revealed: (1) presence of PF interlimb asymmetries in 10% of subjects and KE interlimb asymmetries in 15% of subjects using RTD-SF as the differentiation criteria (>15% interlimb difference); (2) moderate positive relationship in RTD-SF between PF and KE of dominant leg.
With our study, we wanted to verify if the leg dominance needs to be considered when measuring the RTD-SF of lower limbs in healthy population. There were no significant differences between the dominant and non-dominant legs for PF and KE in RTD-SF and r
2. Due to homogenous RTD-SF, we can conclude that explosive isometric torque production calculated as the slope of the regression line (RTD-SF) between the peak values of torque pulses and each corresponding peak RTD (different submaximal level) is similar between dominant and non-dominant in both muscle groups. Moreover, r
2 values that are obtained from a previously mentioned relationship show the stability of the scaling of RTD with the extent of the produced torque. Our high r
2 values in both legs and muscle groups indicate that the time to reach peak torque does not variate, regardless of torque amplitude [
19]. Potential differences in RTD-SF ability between legs have been investigated in only one study [
5] for knee joint. They revealed 17.7% (knee flexors) and 17.4% (KE) of asymmetric young football players which is consistent with our results. To date, there are no studies about RTD-SF/RFD-SF measurements in ankle joint, while our results revealed smaller number of asymmetric subjects in PF (10%) compared to KE (15%). Taking into account these results, we can partly accept our first hypothesis. Namely, the observed asymmetry in rapid isometric contractions deserves more attention, as most of the sport specific activities (jumping, shooting, change of direction, etc.) put high demands on rapid force/power production and control. RTD-SF could be useful method for identifying interlimb asymmetries as it was revealed that identifies more subjects with KE asymmetry (17.4%) compared to RTD (8.5%), maximal force (9.9%) and isokinetic (6%) [
5]. As we already mentioned, RTD-SF protocol assesses neuromuscular ability to produce explosive joint torques over a wide range of submaximal intensities (not only maximal intensity). Such assessment of explosive torque production might better predict interlimb asymmetries or different aspect of it.
The RTD-SF and r
2 values for KE are very similar to previous studies [
14,
15] which confirms that RTD-SF can yield comparable results if similar protocol is used. We confirmed our second hypothesis as we revealed generally moderate positive relationship for RTD-SF between PF and KE of the dominant leg (r = 0.401,
p < 0.05). To date, two studies revealed moderate correlation in RFD-SF in the upper extremity between index finger and elbow extensors for young (r = 0.6) and older adults (r = 0.77) [
14,
20]. Higher correlations between muscles in upper extremity can be explained with a higher rate of innervation in the upper extremity [
21], while positive associations between PF and KE can be explained due to their relationship during most functional multi-joint movements and their function in muscle synergies [
22]. We assume that RTD-SF correlation between PF and KE may be even greater because gastrocnemius contribution to ankle plantar flexion, as the predominantly fast twitch muscle is limited in a flexed knee position [
23]. Therefore, RTD-SF performance in this position depends, to a greater extent, on the predominantly slow twitch soleus muscle [
24].
One of the limitations of our study was the homogeneous sample (young athletes), while stronger correlations may be seen for heterogeneous samples with respect to functional abilities and greater joint-to-joint correlations. In addition, the presence of athletes from different sports may influence interlimb differences, as some sports are more side dominant than others. This question can open further opportunities in which the influence of sport side dominance on RTD-SF ability should be questioned. Moreover, a similar study should be conducted on the healthy adult population, as young athletes are still in development phase.
5. Conclusions
Similar interlimb RTD-SF of PF and KE revealed that leg dominance does not influence RTD-SF performance, while it may be useful tool for interlimb asymmetry identification. Moreover, this was the first study that confirmed associations in RTD-SF ability between muscle groups in lower extremities, which supports the assertion about RTD-SF/RFD-SF as a general neuromuscular quality known as a quickness.
Author Contributions
Conceptualization, N.Š. and D.S.; methodology, N.Š. and D.S.; software, N.Š. and D.S.; validation, N.Š. and D.S.; formal analysis, N.Š. and D.S.; investigation, N.Š. and D.S.; resources, N.Š., O.M.K., D.M.M.; data curation, N.Š. and D.S.; writing—original draft preparation, D.S. and N.Š.; writing—review and editing, N.Š., O.M.K., D.M.M.; visualization, N.Š., D.S., O.M.K., D.M.M.; supervision, N.Š.; project administration, N.Š.; funding acquisition, N.Š., O.M.K. and D.M.M. All authors have read and agreed to the published version of the manuscript.
Funding
The research was funded by the Slovenian Research Agency in the framework of (1) project L5-1845: Body asymmetries as a risk factor in musculoskeletal injury development: studying etiological mechanisms and designing corrective interventions for primary and tertiary preventive care and (2) bilateral project between Slovenia and Serbia ARRS-BI-RS/18-19-010 and the research program fund P5-0147 Kinesiology of monostructural, polystructural and conventional sports.
Acknowledgments
Authors would like to thank Matic Ogrizek (University of Primorska) for his help at data acquisition and subjects’s recruitment.
Conflicts of Interest
The authors declare no conflict of interest.
References
- Cafolla, D. A 3D visual tracking method for rehabilitation path planning. In New Trends in Medical and Service Robotics; Mechanisms and Machine Science: Frosinone, Italy, 2019; pp. 264–272. [Google Scholar]
- Cafolla, D.; Chen, I.; Ceccarelli, M. An experimental characterization of human torso motion. Front. Mech. Eng. 2015, 10, 311–325. [Google Scholar] [CrossRef]
- Wilson, G.J.; Murphy, A.J. The use of isometric tests of muscular function in athletic assessment. Sport. Med. 1996, 22, 19–37. [Google Scholar] [CrossRef] [PubMed]
- Maffiuletti, N.A.; Bizzini, M.; Widler, K.; Munzinger, U. Asymmetry in quadriceps rate of force development as a functional outcome measure in TKA. Clin. Orthop. Relat. Res. 2010, 468, 191–198. [Google Scholar] [CrossRef] [PubMed]
- Boccia, G.; Brustio, P.R.; Buttacchio, G.; Calabrese, M.; Bruzzone, M.; Casale, R.; Rainoldi, A. Interlimb asymmetries identified using the rate of torque development in ballistic contraction targeting submaximal torques. Front. Physiol. 2018, 9, 1701. [Google Scholar] [CrossRef] [PubMed]
- Murphy, D.F. Risk factors for lower extremity injury: A review of the literature. Br. J. Sports Med. 2003, 37, 13–29. [Google Scholar] [CrossRef]
- Casartelli, N.C.; Item-Glatthorn, J.F.; Friesenbichler, B.; Bizzini, M.; Salzmann, G.M.; Maffiuleti, N.A. Quadriceps neuromuscular impairments after arthroscopic knee surgery: Comparison between procedures. J. Clin. Med. 2019, 8, 1881. [Google Scholar] [CrossRef]
- Mirkov, D.M.; Knezevic, O.M.; Maffiuletti, N.A.; Kadija, M.; Nedeljkovic, A.; Jaric, S. Contralateral limb deficit after ACL-reconstruction: An analysis of early and late phase of rate of force development. J. Sports Sci. 2017, 35, 435–440. [Google Scholar] [CrossRef]
- Knezevic, O.M.; Mirkov, D.M.; Kadija, M.; Nedeljkovic, A.; Jaric, S. Asymmetries in explosive strength following anterior cruciate ligament reconstruction. Knee 2014, 21, 1039–1045. [Google Scholar] [CrossRef]
- Green, B.; Bourne, M.N.; Pizzari, T. Isokinetic strength assessment offers limited predictive validity for detecting risk of future hamstring strain in sport: A systematic review and meta-analysis. Br. J. Sports Med. 2018, 52, 329–336. [Google Scholar] [CrossRef]
- Kannus, P. Isokinetic evaluation of muscular performance. Int. J. Sports Med. 1994, 15, S11–S18. [Google Scholar] [CrossRef]
- Impellizzeri, F.M.; Rampinini, E.; Maffiuletti, N.; Marcora, S.M. A vertical jump force test for assessing bilateral strength asymmetry in athletes. Med. Sci. Sports Exerc. 2007, 39, 2044–2050. [Google Scholar] [CrossRef] [PubMed]
- Jones, P.; Bampouras, T. A comparison of isokinetic and functional methods of assessing bilateral strength imbalance. J. Strenght Cond. Res. 2010, 24, 1553–1558. [Google Scholar] [CrossRef] [PubMed]
- Bellumori, M.; Jaric, S.; Knight, C.A. The rate of force development scaling factor (RFD-SF): Protocol, reliability, and muscle comparisons. Exp. Brain. Res. 2011, 212, 359–369. [Google Scholar] [CrossRef]
- Djordjevic, D.; Uygur, M. Methodological considerations in the calculation of the rate of force development scaling factor. Physiol. Meas. 2017, 39, 015001. [Google Scholar] [CrossRef] [PubMed]
- Casartelli, N.C.; Lepers, R.; Maffiuletti, N.A. Assessment of the rate of force development scaling factor for the hip muscles. Muscle Nerve 2014, 50, 932–938. [Google Scholar] [CrossRef]
- Sarabon, N.; Rosker, J.; Fruhmann, H.; Burggraf, S.; Loefler, S.; Kern, H. Reliability of maximal voluntary contraction related parameters measured by a novel portable isometric knee dynamometer. Phys. Medizin. Rehabil. Kurortmed. 2013, 23, 22–27. [Google Scholar] [CrossRef]
- Hopkins, W.G.; Marshall, S.W.; Batterham, A.M.; Hanin, J. Progressive statistics for studies in sports medicine and exercise science. Med. Sci. Sport. Exerc. 2009, 41, 3–13. [Google Scholar] [CrossRef] [PubMed]
- Freund, H.-J.; Büdingen, H.J. The relationship between speed and amplitude of the fastes voluntary contracitons of human arm muscles. Exp. Brain Res. 1978, 31, 1–12. [Google Scholar] [CrossRef]
- Bellumori, M.; Jaric, S.; Knight, C.A. Age-related decline in the rate of force development scaling factor. Mot. Control 2013, 17, 370–381. [Google Scholar] [CrossRef]
- Lawrence, D.; Kuypers, H. The functional organization of the motor system in the monkey. II. The effects of lesions of the descending brain-stem pathways. Brain 1968, 91, 15–36. [Google Scholar] [CrossRef]
- Suzuki, T.; Kinugasa, R.; Fukashiro, S. Activation of plantar flexor muscles is constrained by multiple muscle synergies rather than joint torques. PLoS ONE 2017, 12, e0187587. [Google Scholar] [CrossRef] [PubMed]
- Landin, D.; Thompson, M.; Reid, M. Knee and ankle joint angles influence the plantarflexion torque of the gastrocnemius. J. Clin. Med. Res. 2015, 7, 602–606. [Google Scholar] [CrossRef] [PubMed]
- Edgerton, V.; Smith, J.; Simpson, D. Muscle fibre type populations of human leg muscles. Histochem. J. 1975, 7, 259–266. [Google Scholar] [CrossRef] [PubMed]
© 2020 by the authors. Licensee MDPI, Basel, Switzerland. This article is an open access article distributed under the terms and conditions of the Creative Commons Attribution (CC BY) license (http://creativecommons.org/licenses/by/4.0/).


