Article

Mathematical Modeling of Autoimmune Diseases

Faculty of Mathematics and Computer Science, University of Warmia and Mazury, Słoneczna 54, 10-710 Olsztyn, Poland
Symmetry 2020, 12(9), 1457; https://doi.org/10.3390/sym12091457
Submission received: 1 August 2020 / Revised: 30 August 2020 / Accepted: 2 September 2020 / Published: 4 September 2020

Abstract

:
The human organism is a very complex system. To be in good health, its components must function properly. One of the most important systems of an organism is the immune system. It protects the body from the harmful effects of various external and internal agents. Sometimes, however, the immune system starts attacking its own healthy cells, tissues and organs. Then autoimmune diseases arise. They are widespread in recent decades. There is evidence that often autoimmune responses occur due to viral infections. In this paper, a new mathematical model of a general autoimmune disease is proposed. It describes the interactions between viral particles and host cells. The model is formulated by using integro-differential equations of Boltzmann type. This approach is typical for the nonequilibrium statistical mechanics. A preliminary qualitative and quantitative analysis of the model is presented.

1. Introduction

Mathematical modeling has been actively used in recent decades in various fields of science and technology, in particular in the field of modeling complex systems, which include living beings [1]. Real experiments cannot always be performed on them due to the complexity of the organisms, the necessary technique is not always available, often such experiments are lengthy, expensive and difficult due to ethical considerations.
The mathematical model can describe some characteristic properties of the phenomenon under consideration and predict its possible scenarios for the course without necessarily conducting real experiments.
Mathematical modeling has been successfully used to study various diseases. Autoimmune diseases have become widespread in recent years. They occur when the immune system, due to disruption of the proper mechanisms of its functioning, attacks and destroys its own healthy cells, tissues and organs. Autoimmune diseases include more than 80 specific diseases of various organs [2].
The purpose of this article is to present a new mathematical model of general autoimmune disease. The model is used to analyze numerically the role of autoreactive immune cells for the occurrence and development of autoimmune diseases. Several different possible scenarios are presented. Their analysis and understanding can be useful for development of better treatment strategies.
The model is formulated within the framework of the kinetic theory of active particles. In this framework the interacting individuals (e.g., cells) are characterized not only by mechanical variables but also by a variable that expresses their functional properties, for example the ability to perform their biological function. Such a variable is called functional state or activation state and the interacting entities are called active particles, see [3,4,5,6,7,8,9] for more details, applications and bibliography.
The content of the article is as follows. In Section 2 a description of the mathematical model is given. In Section 3 results of numerical experiments are presented. Some concluding remarks are given in Section 4.

2. Description of the Mathematical Model of a General Autoimmune Disease

Among the factors leading to autoimmune diseases are environmental [10], genetic [11], sensitivity to gluten [12,13,14] etc.
In addition, there is evidence that viral infections can lead to autoimmune diseases due to antigenic mimicry [15,16,17,18]. This is the reason to include in the mathematical model the population of viral particles. In addition we consider the populations of target cells (healthy cells), damaged cells and effector immune cells. Among the effector immune cells participating in the processes of autoimmune diseases are autoreactive cytotoxic T lymphocytes (CTL), B cells and macrophages [19,20].
Each population is denoted by subscript as follows:
  • Target cells are denoted by the subscript 1.
  • Damaged cells are denoted by the subscript 2.
  • Effector immune cells are denoted by the subscript 3. For brevity, hereafter they are mentioned as immune cells.
  • Viral particles are denoted by the subscript 4.
The three cell populations denoted by subscripts 1, 2 and 3 are assumed to be non-homogeneous with respect to their main activity which is represented by variable u [ 0 , 1 ] .
In our model the activity of the target cells represents their susceptibility to be damaged by immune cells. For a given target cell its activation state corresponds to the probability that this target cell will be damaged after its interaction with an effector immune cell.
The activity of the damaged cells represents their ability to stimulate the production of higher number of immune cells. For a given damaged cell its activation state is supposed to be the normalized quantity of specific self-antigens released after the immune attack against this cell in the process of its damage. The released self-antigens can stimulate the production of specific effector immune cells [21]. The value u = 1 corresponds to the maximal possible release of self-antigens, while the value u = 0 corresponds to the absence of released self-antigens.
The activation state of the immune cells represents their aggressiveness against target cells (healthy cells). It is supposed to be the probability for a target cell presenting specific proteins to be damaged after its interaction with the given immune cell.
The states of these three cell populations are described, at time t, by their probability densities
f i ( t , u ) , i = 1 , 2 , 3 .
The state of the viral population is described, at time t, by their concentration n 4 ( t ) . The concentrations of the remaining populations is calculated by the relation:
n i ( t ) = 0 1 f i ( t , u ) d u i = 1 , 2 , 3 .
The present model is a generalization of the kinetic models of autoimmune diseases proposed recently in [22,23]. The model proposed in [23] describes only the populations of target cells, damaged cells and immune cells. The model proposed in [22] consider the populations of target cells and damaged cells as homogeneous with respect to their activation states.
The evolution equations for the probability densities of the cell populations and the concentration of the viral population include the respective gain, loss and conservative terms describing the main interactions between them.
The evolution equation for the density of the target cells in our model is the following:
f 1 t ( t , u ) = S 1 ( t ) + f 1 ( t , u ) ( p 11 p 11 T M a x f 1 ( t , u ) ) d 11 f 1 ( t , u ) d 13 u f 1 ( t , u ) 0 1 v f 3 ( t , v ) d v .
Here the corresponding terms have the following meaning. The non-negative function S 1 ( t ) characterizes the inlet of healthy cells by sources within the organism, e.g., thymus. The logistic-like term describes the proliferation of the target cells with maximal rate determined by p 11 and parameter T M a x characterizing the limitation of their proliferation. The natural death of the healthy cells is characterized by parameter d 11 . In our model we assume that the rate of damaging of the healthy cells by the immune cells is proportional to the states of activities of the healthy cells and of the immune cells with corresponding parameter d 13 .
The evolution equation for the density of the damaged cells in our model is the following:
f 2 t ( t , u ) = d 13 0 1 v f 1 ( t , v ) d v 0 1 v f 3 ( t , v ) d v d 22 f 2 ( t , u ) ,
We see that (after integration from 0 to 1 with respect to the activation state) the first (gain) term here is in fact anti-symmetrical to the corresponding loss term with the same parameter d 13 from the first Equation (2) because the damaged cells move from the first population to the second one.
The evolution equation of the density of the immune cells in our model is the following:
f 3 t ( t , u ) = ( 1 u ) p 32 0 1 v f 2 ( t , v ) d v + p 34 n 4 ( t ) d 33 f 3 ( t , u ) + c 3 2 0 u ( u v ) f 3 ( t , v ) d v ( 1 u ) 2 f 3 ( t , u )
In this equation we assume that the production of the immune cells is stimulated by damaged cells and viral particles (described by the corresponding gain terms). We suppose that the newly produced immune cells are with low activation state and this explains the factor 1 u . The last term corresponding to the parameter c 3 describes the possibility of raising the activity of the immune cells. It is conservative term, i.e., after integration with respect to the activity of immune cells their concentration does not change due to this term.
Change of the activity of effector immune cells can be achieved for example by helper T cells (Th), which are able to activate effector immune cells, or by regulatory T cells (Treg), which are able to decrease the activity of effector immune cells [19,24,25].
The evolution equation for the concentration of the viral particles in our model is the following:
d d t n 4 ( t ) = p 4 n 4 ( t ) d 44 n 4 ( t ) d 43 n 3 ( t ) n 4 ( t ) .
Here we consider the linear production of viral particles and their possible destruction by immune cells.
The model (2)–(5) should be supplemented by non-negative initial conditions. The parameters of the model are supposed to be non-negative.
To formulate the theorem of existence, uniqueness and non-negativity of the solution to the model we introduce the following spaces:
X = { f = ( f 1 , f 2 , f 3 , n 4 ) : | n 4 | < , f i L 1 ( 0 , 1 ) , i = 1 , 2 , 3 } ,
X + = { f = ( f 1 , f 2 , f 3 , n 4 ) X : n 4 0 , f i 0 , a . e . , i = 1 , 2 , 3 } .
The following theorem can be easily proved:
Theorem 1.
Let S 1 C 0 ( [ 0 , ) ; R + 1 ) . For each T > 0 the model (2)–(5) with non-negative initial datum has a unique solution, which belongs to X + , t [ 0 , T ] .

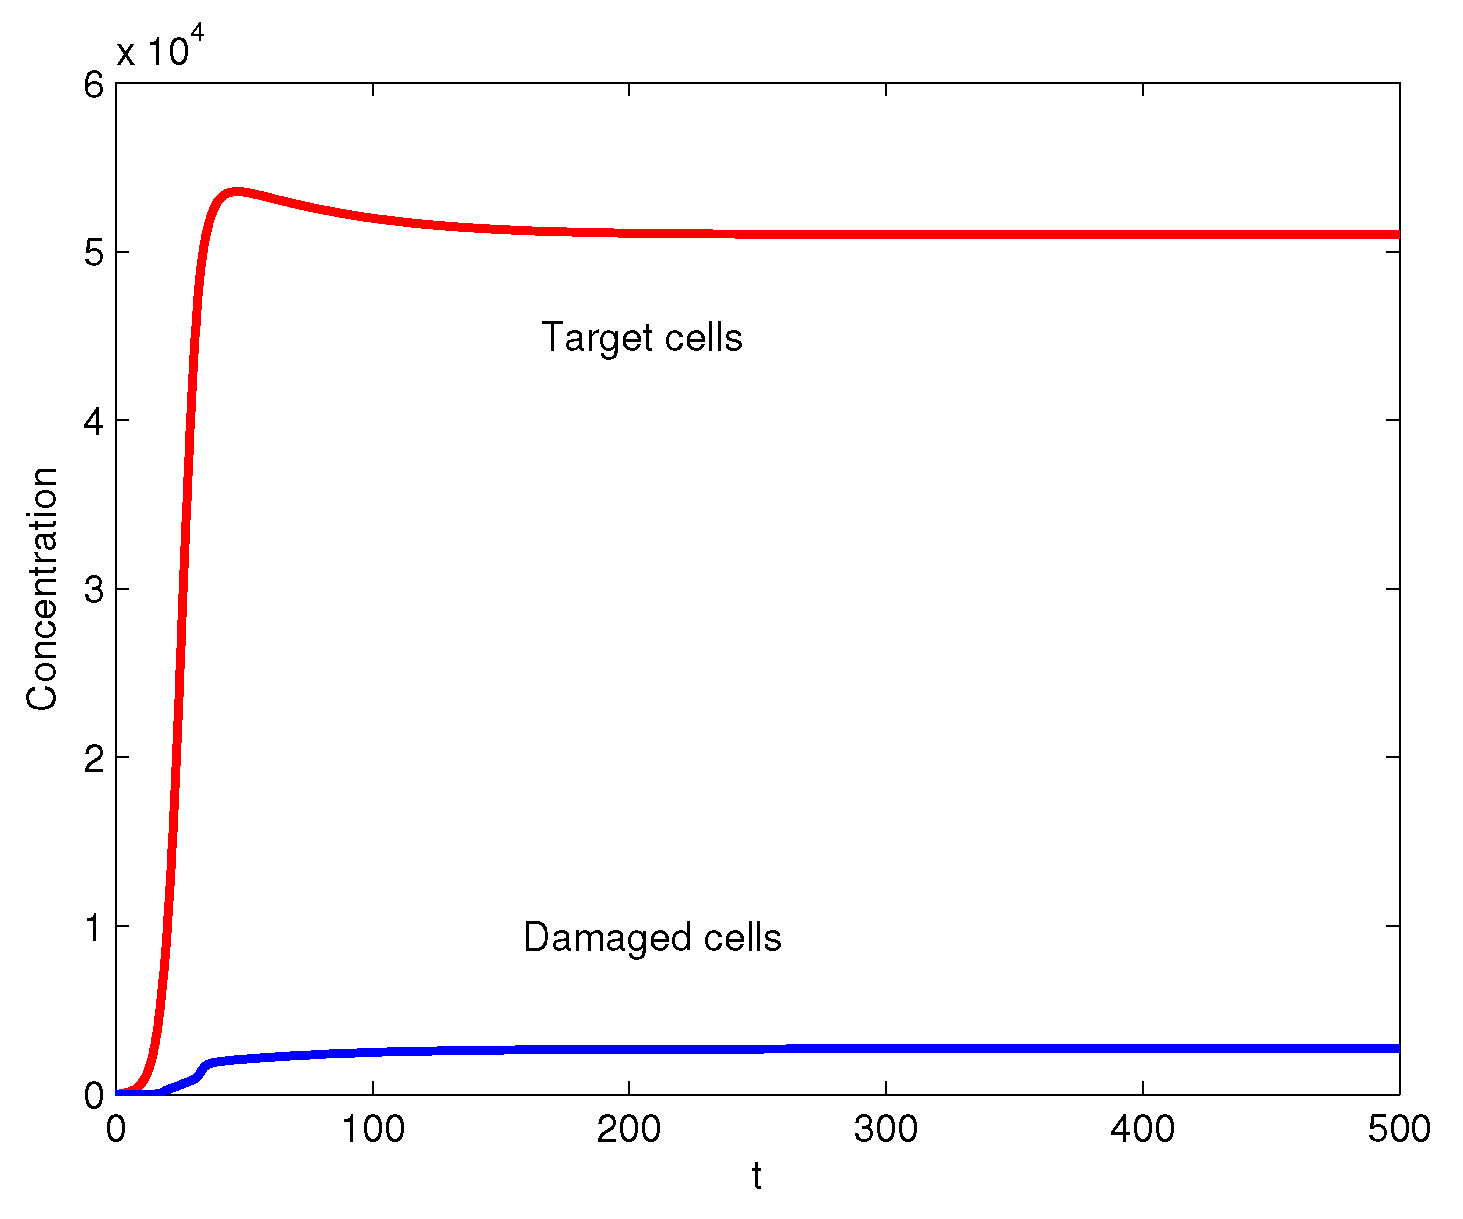
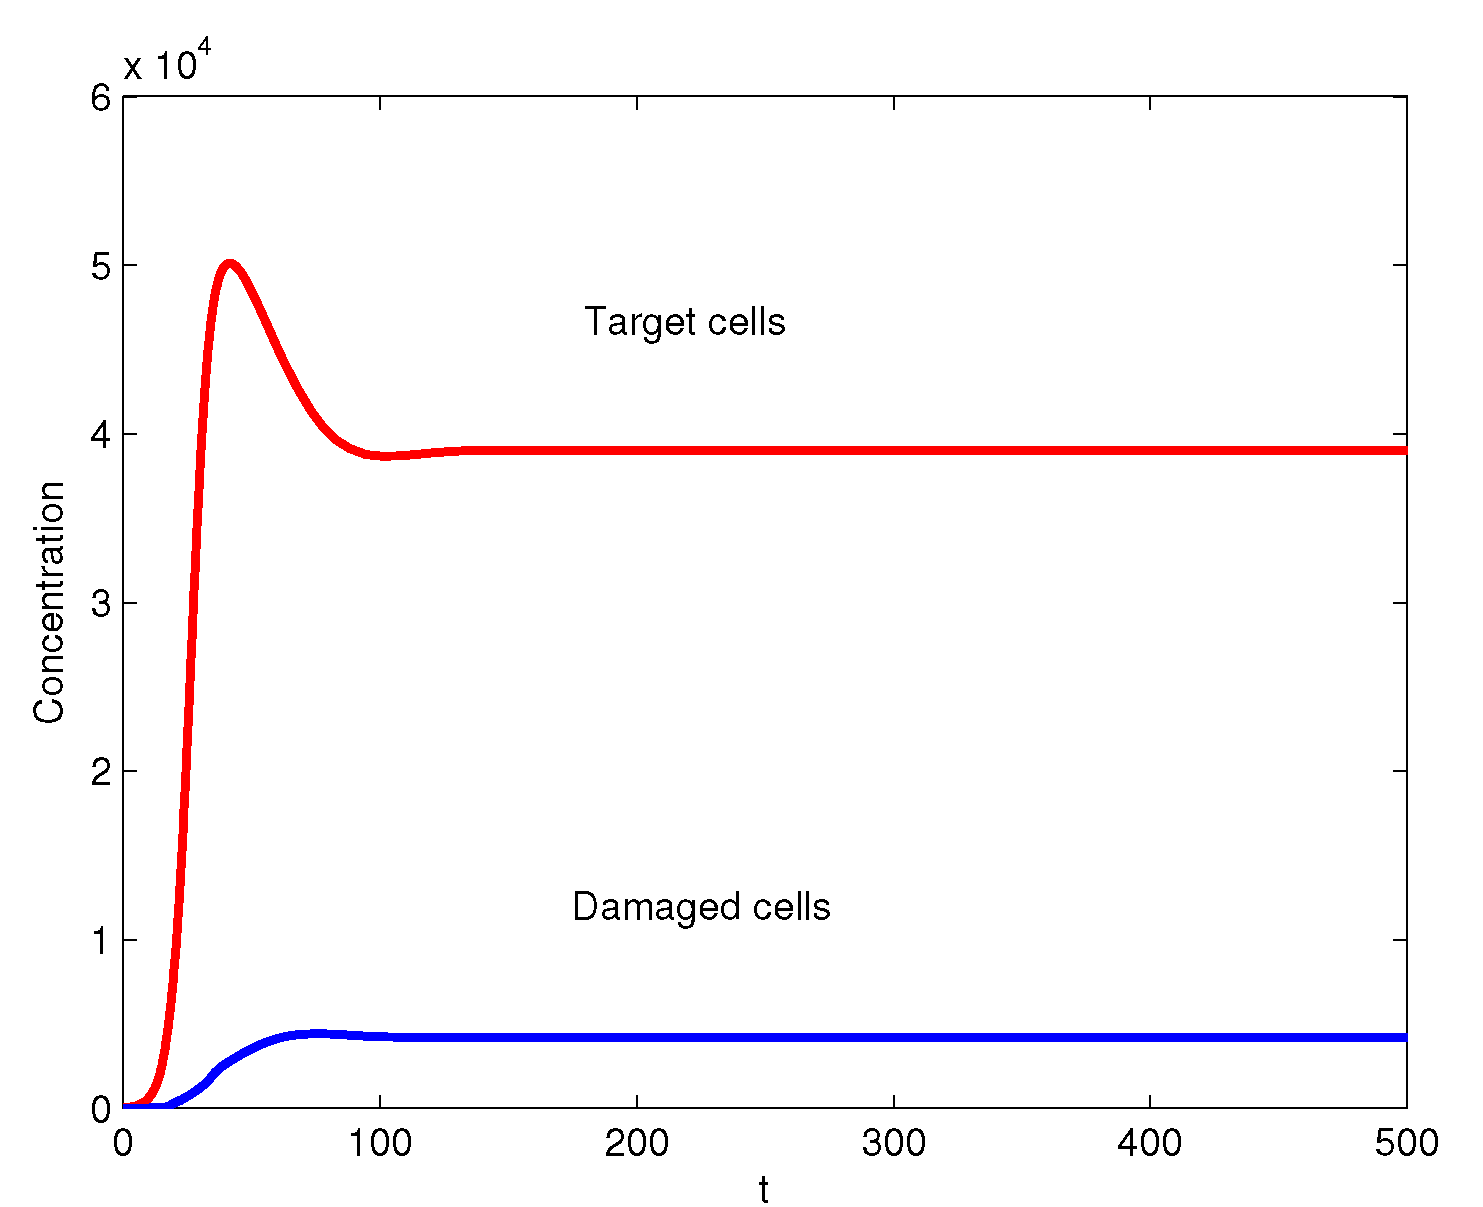
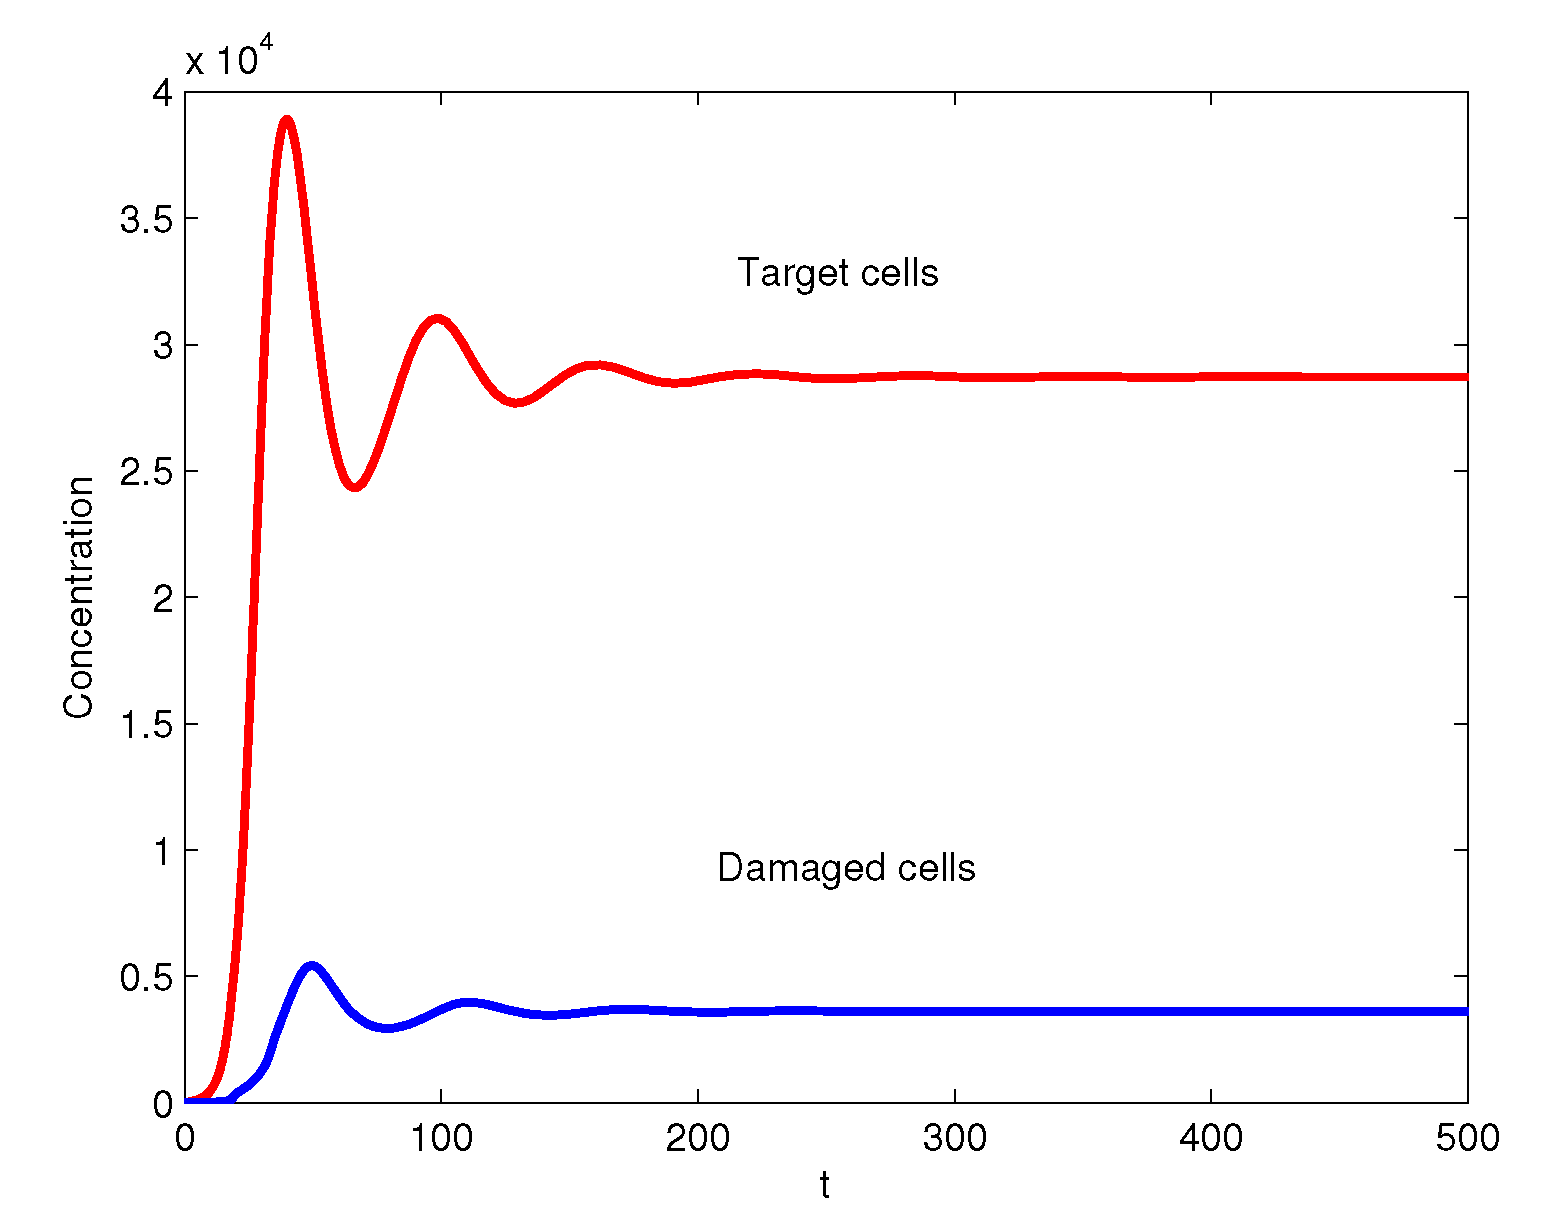
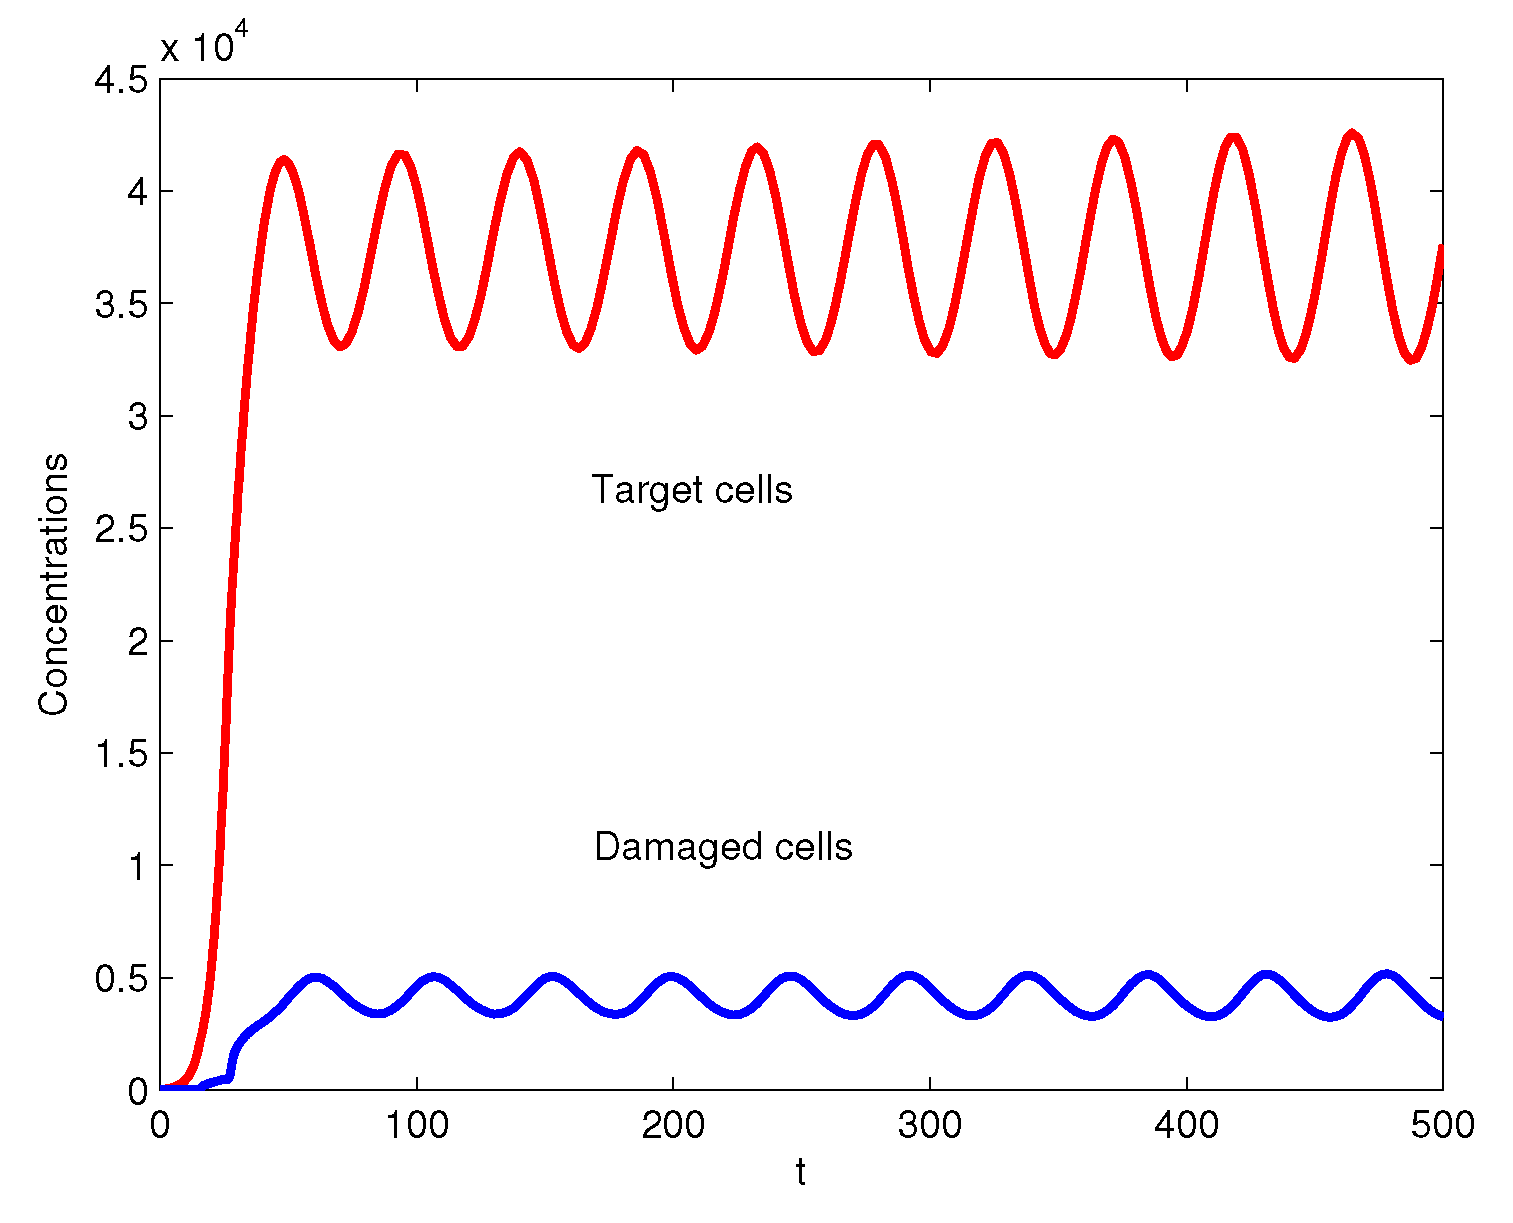
3. Numerical Simulations

To obtain the approximate solution to the modeled problem corresponding to (2)–(5) we performed a suitable discretization of Equations (2)–(4) with respect to the states of activity of the cell populations by uniform meshes. The participating integrals were calculated by using the composite Simpson’s rule.
Thus, we obtained a system of ordinary differential equations which was solved for various parameter sets by using the solver ode15s from the MATLAB ODE suite [26].
We assumed that initially there is a certain number of healthy cells, damaged cells, small number of immune cells with equally distributed states of activity and small number of viruses:
f 1 ( 0 , u ) = 10 , f 2 ( 0 , u ) = 0.05 , u [ 0 , 1 ] ,
f 3 ( 0 , u ) = 0.1 , u [ 0 , 1 ] , n 4 ( 0 ) = 0.1
The parameters were set as follows:
T M a x = 10 5 , S 1 ( t ) = 10 , t 0 ,
d 11 = 0.2 , d 13 = 0.1 , d 22 = 0.8 , d 33 = 0.1 , d 43 = 4.0 , d 43 = 4.0 ,
p 11 = 0.5 , p 32 = 0.0004 , p 4 = 10.0 ,
and various values of parameter c 3 .
The aim of the simulations has been to analyze the role of the parameter c 3 which characterizes the possible raising of the autoimmune activity of the immune cells.
The concentrations of target cells and damaged cells for c 3 = 0.0 are shown on Figure 1. This case illustrates a case when the immune system functions properly and does not cause any damage to the healthy cells. In this case, an autoimmune disease does not occur.
On Figure 2 we see the concentrations of target cells and damaged cells for c 3 = 0.1 . Here we see that the immune system causes small damage to the healthy cells but later an equilibrium occurs, and we can consider this case as absence of autoimmune disease or a chronic autoimmune disease with mild symptoms.
The concentrations of target cells and damaged cells for c 3 = 10.0 are shown on Figure 3.
In this case, we observe autoimmune destruction of certain amount of followed by their partial reestablishment. Further the autoimmune destruction continues followed again by reestablishment of the target cells and after several oscillations the interacting system tends to equilibrium state. Depending on the values of the damaged cells it can represent more or less severe autoimmune disease.
On Figure 4 we see the concentrations of target cells and damaged cells for c 3 = 23.0 . Here we see periodic oscillations of the concentrations of healthy and damaged cells. Such relapses and remissions are typical for some autoimmune diseases such as multiple sclerosis [15] and lupus erythematosus [16].
In conclusion, we see that the increasing of the autoimmune activity of the immune system leads to destruction of target cells and possible instability of the organism which tries to provide reestablishment of the target cells but this is not always possible.

4. Conclusions

The paper represents a new mathematical model describing the interactions between several populations participating in autoimmune diseases. The numerical simulations illustrate several typical courses of interactions when the immune system functions improperly and destroys healthy cells due to viral influence. My future research plans include investigation of the role of other parameters of the model and its development which will allow the application of the model to clinical data. In particular, I plan to include explicitly populations of Th cells and Treg cells. The helper T cells are shown to be able to increase the activity of effector immune cells. On the contrary, there is evidence that regulatory T cells can decrease the activity of effector immune cells [19]. As numerical results presented in Section 3 show, the activity of effector immune cells can be very important factor for development of autoimmune diseases. Therefore, taking into account these additional cell populations can give more precise results and better understanding of the autoimmune processes. Thus, new ideas for treatment of patients can be obtained and developed.

Funding

This research received no external funding.

Conflicts of Interest

The author declares no conflict of interest.

References

  1. Bianca, C.; Bellomo, N. Towards a Mathematical Theory of Multiscale Complex Biological Systems; World Scientific: Singapore, 2011. [Google Scholar]
  2. Janeway, C.; Travers, P.; Walport, M.; Shlomchik, M. Immunobiology: The Immune System in Health and Disease; Garland: New York, NY, USA, 2006. [Google Scholar]
  3. Bellomo, N.; Brezzi, F. Challenges in active particles methods: Theory and applications. Math. Model. Methods Appl. Sci. 2018, 28, 1627–1633. [Google Scholar] [CrossRef]
  4. Bellomo, N.; Brezzi, F. Towards a multiscale vision of active particles. Math. Model. Methods Appl. Sci. 2019, 29, 581–588. [Google Scholar] [CrossRef]
  5. Bianca, C. Thermostatted kinetic equations as models for complex systems in physics and life sciences. Phys. Life Rev. 2012, 9, 359–399. [Google Scholar] [CrossRef]
  6. Bianca, C. Modeling complex systems by functional subsystems representation and thermostatted-KTAP methods. Appl. Math. Inf. Sci. 2012, 6, 495–499. [Google Scholar]
  7. Bianca, C.; Mogno, C. A thermostatted kinetic theory model for event-driven pedestrian dynamics. Eur. Phys. J. Plus 2018, 133, 213. [Google Scholar] [CrossRef]
  8. Degond, P.; Pareschi, L.; Russo, G. (Eds.) Modeling and Computational Methods for Kinetic Equations; Springer Science + Bussiness Media: New York, NY, USA, 2004; pp. 219–258. [Google Scholar]
  9. Elaiw, A.; Al-Turki, Y.; Alghamdi, M. A critical analysis of behavioural crowd dynamics—From a modelling strategy to kinetic theory methods. Symmetry 2019, 11, 851. [Google Scholar] [CrossRef] [Green Version]
  10. Vojdani, A. A potential link between environmental triggers and autoimmunity. Autoimmune Dis. 2013, 2013, 437231. [Google Scholar] [CrossRef] [Green Version]
  11. Ceccarelli, F.; Agmon-Levin, N.; Perricone, C. Genetic factors of autoimmune diseases 2017. J. Immunol. Res. 2017, 2017, 1–2. [Google Scholar] [CrossRef] [PubMed] [Green Version]
  12. Campbell, A.W. Autoimmunity and the Gut. Autoimmune Dis. 2014, 2014, 152428. [Google Scholar] [CrossRef] [PubMed]
  13. Lebwohl, B.; Ludvigsson, J.F.; Green, P.H.R. Celiac disease and non-celiac gluten sensitivity. Autoimmune Dis. 2015, 351, 4347. [Google Scholar] [CrossRef] [PubMed]
  14. Syage, J.; Kelly, C.; Dickason, M.; Ramirez, A.C.; Leon, F.; Dominguez, R.; Sealey-Voyksner, J. Determination of gluten consumption in celiac disease patients on agluten-free diet. Am. J. Clin. Nutr. 2018, 107, 201–207. [Google Scholar] [CrossRef] [PubMed]
  15. Davies, T.F. Infection and autoimmune thyroid disease. J. Clin. Endocrinol. Metab. 2008, 93, 674–676. [Google Scholar] [CrossRef] [PubMed] [Green Version]
  16. Kivity, S.; Agmon-Levin, N.; Blank, M.; Shoenfeld, Y. Infections and autoimmunity: Friends or foes? Trends Immunol. 2009, 30, 409–414. [Google Scholar] [CrossRef]
  17. Lidar, M.; Lipschitz, N.; Agmon-Levin, N.; Langevitz, P.; Barzilai, O.; Ram, M.; Porat-Katz, B.S.; Bizzaro, N.; Damoiseaux, J.; Tervaert, J.W.C.; et al. Infectious serologies and autoantibodies in hepatitis C and autoimmune disease-associated mixed cryoglobulinemia. Clin. Rev. Allergy Immunol. 2012, 42, 238–246. [Google Scholar] [CrossRef] [PubMed]
  18. Martinelli, M.; Agmon-Levin, N.; Amital, H.; Shoenfeld, Y. Infections and autoimmune diseases: An interplay of pathogenic and protective links. In Infection and Autoimmunity; Shoenfeld, Y., Agmon-Levin, N., Rose, N., Eds.; Academic Press: San Diego, CA, USA, 2015; pp. 13–23. [Google Scholar]
  19. Corthay, A. How do Regulatory T Cells Work? Scand. J. Immunol. 2009, 70, 326–336. [Google Scholar] [CrossRef] [PubMed]
  20. von Herrath, M.G.; Oldstone, M.B.A. Virus-induced autoimmune disease. Cur. Opt. Immunol. 1996, 8, 878–885. [Google Scholar] [CrossRef]
  21. Fujinami, R.S. Viruses and autoimmune disease-two sides of the same coin? TRENDS Microbiol. 2001, 9, 377–381. [Google Scholar] [CrossRef]
  22. Kolev, M. Mathematical Analysis of an Autoimmune Diseases Model: Kinetic Approach. Mathematics 2019, 7, 1024. [Google Scholar] [CrossRef] [Green Version]
  23. Nikolova, I. On stochastic models in biology and medicine. Asian-Eur. J. Math. 2020, 13, 2050168. [Google Scholar] [CrossRef]
  24. Sojka, D.K.; Huang, Y.H.; Fowell, D.J. Mechanisms of regulatory T-cell suppression—A diverse arsenal for a moving target. Immunology 2008, 124, 13–22. [Google Scholar] [CrossRef]
  25. Tang, Q.; Bluestone, J.A. The Foxp3+ regulatory T cell: A jack of all trades, master of regulation. Nat. Immun. 2008, 9, 239–244. [Google Scholar] [CrossRef] [PubMed] [Green Version]
  26. Shampine, L.F.; Reichelt, M.W. The Matlab ODE suite. SIAM J. Sci. Comput. 1997, 18, 1–22. [Google Scholar] [CrossRef] [Green Version]
Figure 1. Concentrations of target cells and damaged cells for c 3 = 0.0 .
Symmetry 12 01457 g001
Figure 2. Concentrations of target cells and damaged cells for c 3 = 0.1 .
Symmetry 12 01457 g002
Figure 3. Concentrations of target cells and damaged cells for c 3 = 10.0 .
Symmetry 12 01457 g003
Figure 4. Concentrations of target cells and damaged cells for c 3 = 23.0 .
Symmetry 12 01457 g004

