Article

Analysis of Chaotic Response of Frenkel-Kontorova-Tomlinson Model

by
Joaquín Solano Ramírez
1,*,†,
Francisco Balibrea Gallego
2,†,
José Andrés Moreno Nicolás
3,† and
Fulgencio Marín García
1,†
1
Faculty of Industrial Engineering, Department of Automation, Electrical Engineering and Electronic Technology, Politechnic University of Cartagena, 30202 Cartagena, Spain
2
Faculty of Mathematics, Department of Mathematics, University of Murcia, 30100 Murcia, Spain
3
Faculty of Industrial Engineering, Department of Mechanical Engineering, Materials and Manufacturing, Politechnic University of Cartagena, 30202 Cartagena, Spain
*
Author to whom correspondence should be addressed.
These authors contributed equally to this work.
Symmetry 2020, 12(9), 1413; https://doi.org/10.3390/sym12091413
Submission received: 24 June 2020 / Revised: 15 August 2020 / Accepted: 18 August 2020 / Published: 25 August 2020
(This article belongs to the Special Issue Advances in Nonlinear, Discrete, Continuous and Hamiltonian Systems)

Abstract

:
The Frenkel-Kontorova-Tomlinson (FKT) model represents mechanical systems in which the atomic smooth surfaces of two bodies slide against each other. The model is very sensitive to changes of the system parameters, and ranges from simple stable harmonic to chaotic solutions. The design of the model between two bodies for the dynamic problem, following the network method rules, is explained with precision and run on standard electrical circuit simulation software. It provides the phase diagrams of atom displacement for each atom and the total friction force by the summation of all the atom displacements. This article is focused on studying the effect of the selected time step on the result and in the lack of sensitivity of Lyapunov exponents to assess chaotic behaviour.

1. Introduction

The physical phenomenon of friction between sliding bodies is a relevant topic in mechanical engineering [1,2]. In the case of dry friction and atomic smooth surfaces, different and complex mechanisms have been considered in the literature. In dynamic friction, the aim is to know the friction force, which is strongly dependent on the relative sliding body velocity.
Historically, the first attempt to apply Coulomb’s laws at atomic level is attributed to Tomlinson [3] considering the atoms of one surface as uncoupled oscillators. The coupling between atoms was later considered by the Frenkel-Kontorova model [4,5].
The combination of the former models provides the widely used Frenkel-Kontorova-Tomlinson (FKT, hereinafter) [6,7] model. With regard to dynamic friction, the solutions ranging from periodic solutions or limit cycles to chaotic orbits or bound non-periodic solutions.
A short summary of the used of FKT models could start with the FKT version proposed by Elmer and Weiss (1995) [6,7], which was improved by Gyalog and Thomas (1997), who developed a 2-D version of this model in order to represent the motion of an atomic force microscope tip over a surface [8]. Later, Elmer (1997) used a sticking-dependent static friction force and a velocity-dependent kinetic friction force [9]. Hölscher and Zwörner (1998) claimed this kind of models in the analysis of this type of microscopes [10]. Gnecco et al. (2000) analysed the friction in these devices for NaCl (100) [11]. Sang et al. (2001) corrected the obtained relation in the former study at not very low velocities, proposing new expression for the relation between the scanning velocity and the friction force [10,12]. Elmer (2001) insisted on the fact that an FKT model is less expensive for simulation [13]. Müser and Robbins (2001) studied the overdamped regime in a Tomlinson model [10,14]. Miura and Kamiya (2002) [15], Prioli et al. (2003) and Fusco and Fasolino (2005) [10] extended these researches with 2-D Tomlinson models [11]. Alhama et al. (2011) analysed the influence of the main parameters, which define the system, with this model [12], and Wang et al. used the Prandtl-Tomlinson model [15].
The aim of the present work was to analyse the effect of the time step in the solutions accuracy and to check the capacity of the Lyapunov exponents [16,17] to assess the chaotic behaviour of the system. The network method is used as a numerical tool because its efficiency has been demonstrated in numerous science and engineering problems [18,19].
The design of the network model implies the following steps: the choice of the equivalence between electrical and mechanical variables and the implementation of boundary and initial conditions by suitable electric components. The software for circuit simulation Ngspice requires a relatively short computing time, thanks to the continuous adjusting of the internal time step required for the convergence.
In contrast with the numerical methods previously used for the solution of the FKT system, the network procedure does not require assumptions on the linearisation of the potential interaction function and the kind of functions (e.g., Hull function) assumed as a solution to the problem.

2. The Governing Equations

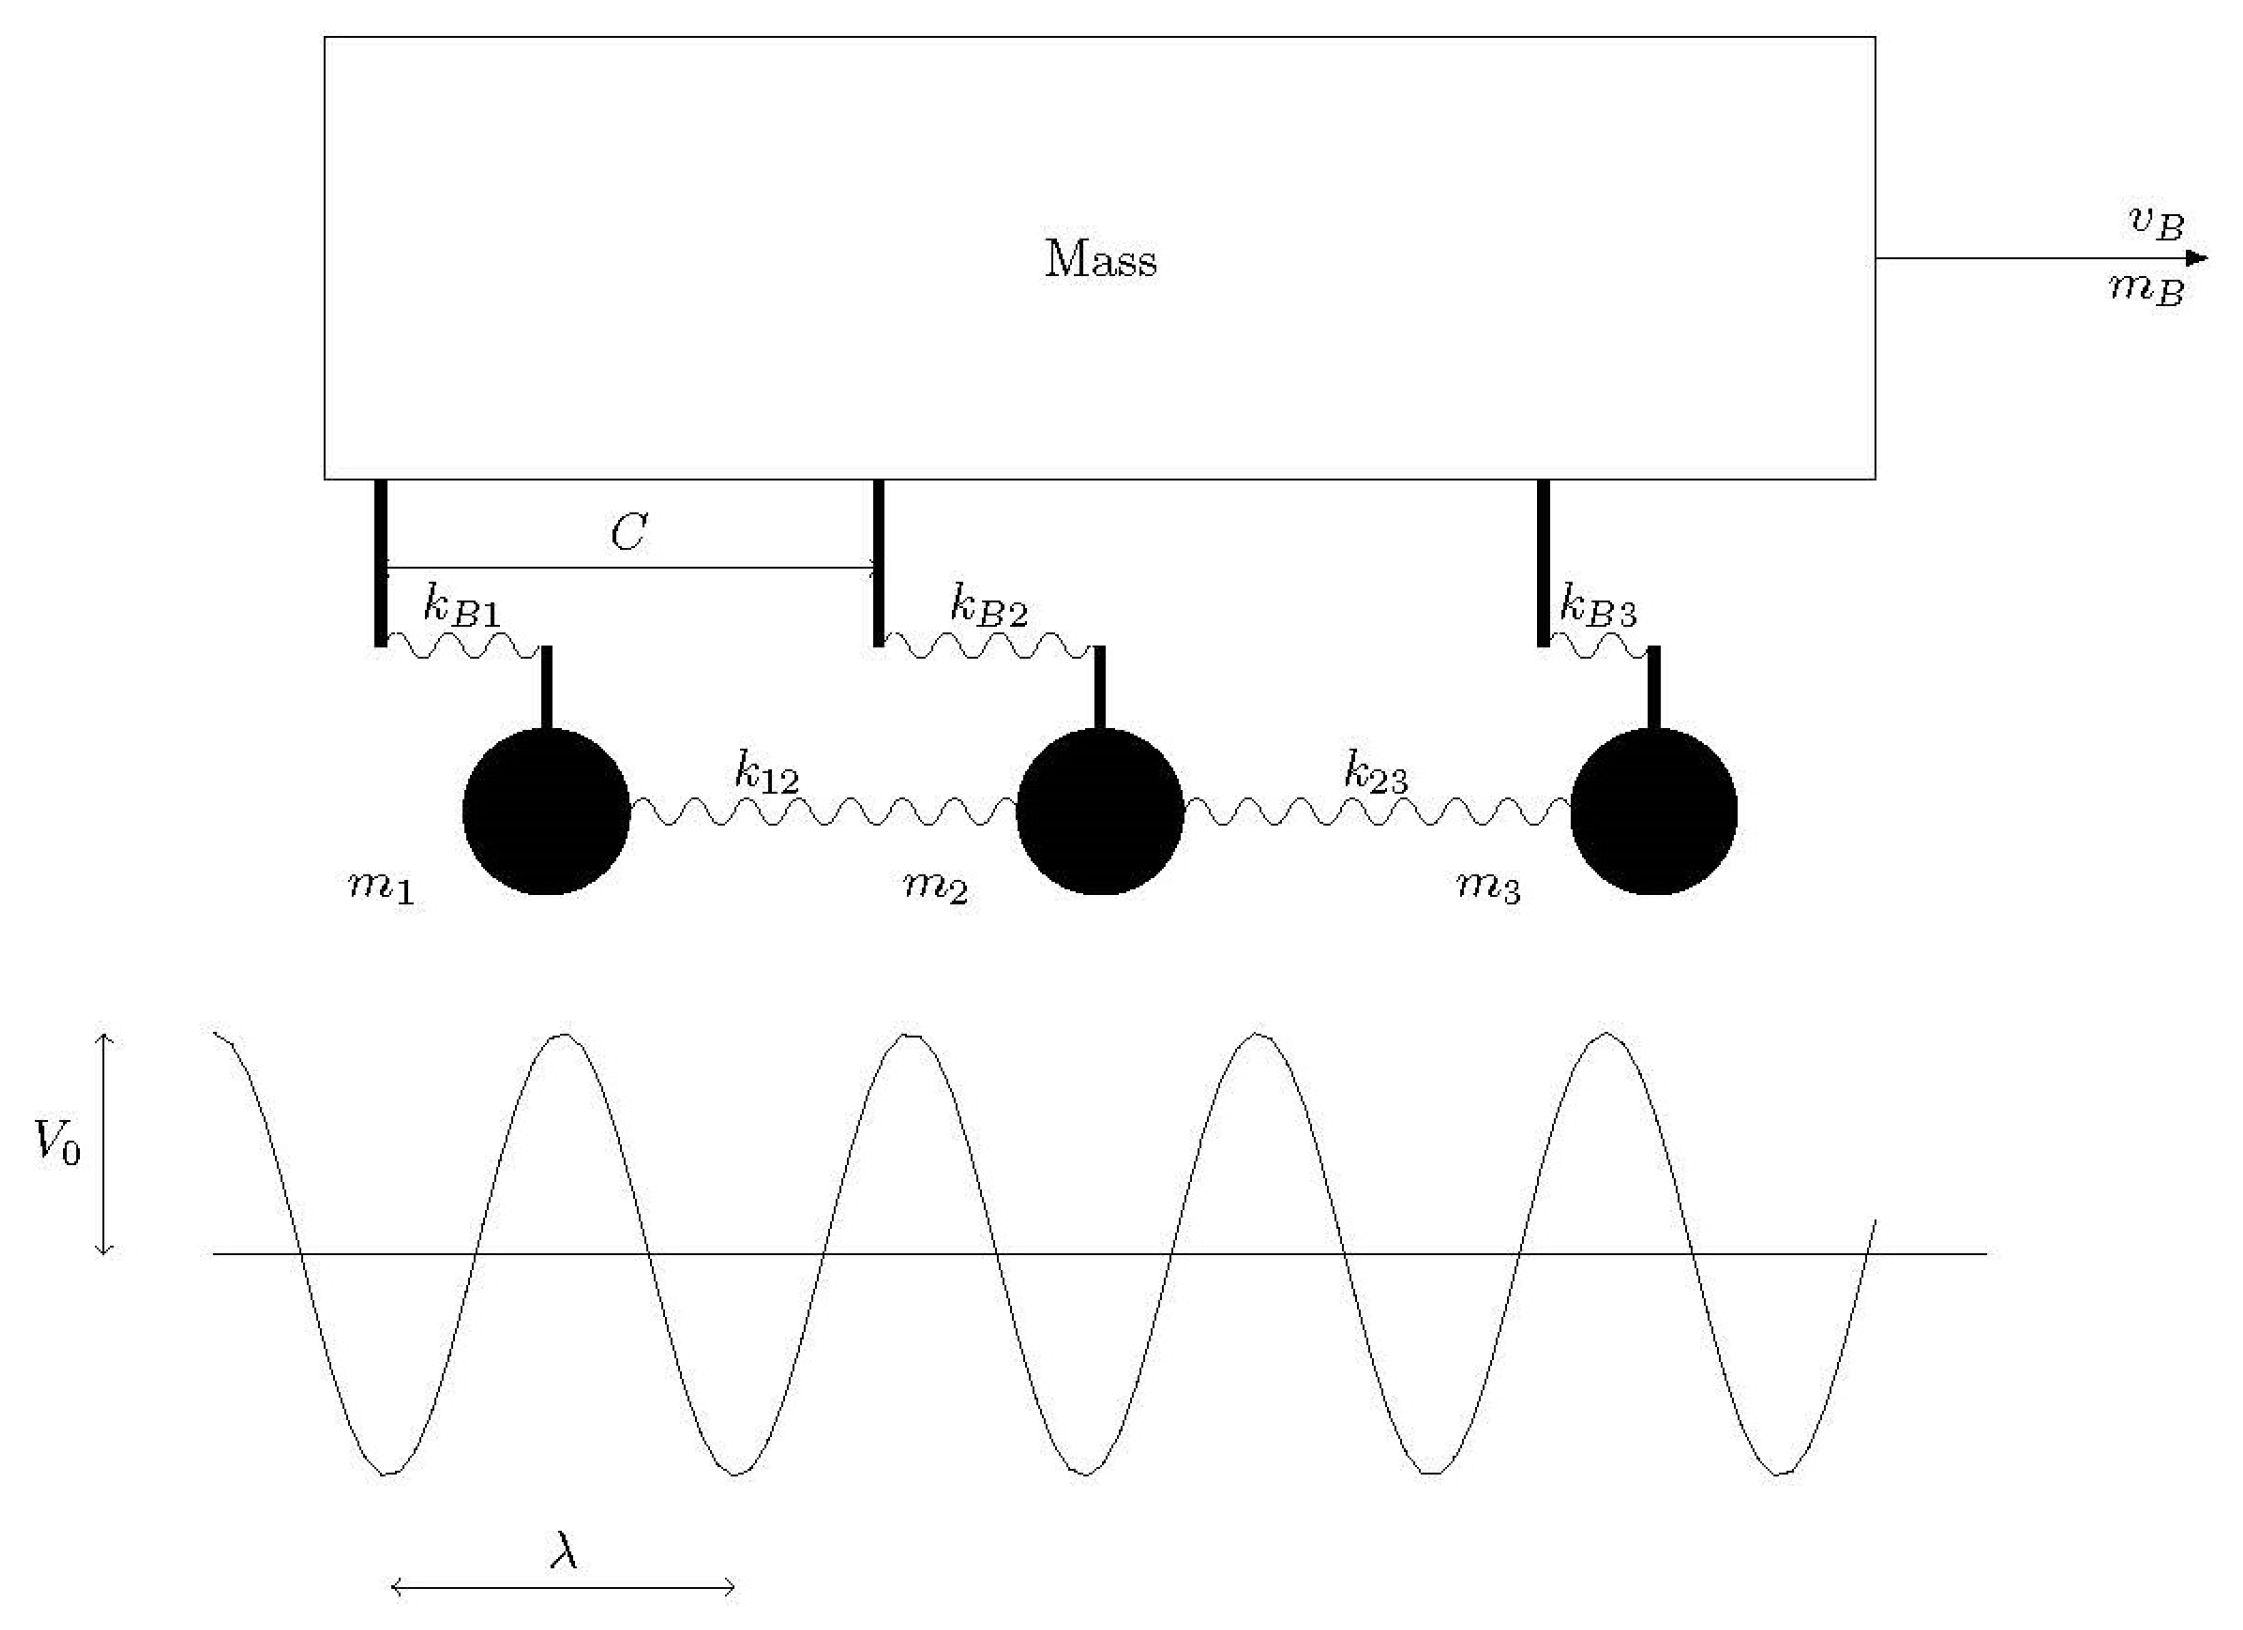
The physical scheme of the FKT model, Figure 1, assumes two rigid sliding bodies. The interaction between the atoms of the surface layer of the upper sliding body and the neighbouring atoms and those in the bulk are represented by springs. The hypotheses currently assumed in the FKT model are summarised in the literature [11]. One of these considers that the interaction potential between the atoms of a fixed surface and the atoms of the surface, which has a relative displacement from the other one, can be modelled as a harmonic function.
Considering an atom of the moving surface, the following equation can be written from the balance of the forces in this element [15]
d 2 ξ j d t + β + γ m · d ξ j d t + 2 κ 1 + κ 2 m · ξ j V v B , ξ j , t m + γ m · v B κ 1 m · ξ j 1 + ξ j + 1 = 0 ,
where ξ i is the displacement of the particle i from its equilibrium position, m is the mass of the particle, κ 1 and κ 2 is the stiffness between neighbouring atoms on the moving surface and substrate in the moving surface, respectively, v B is the body velocity, c is the ratio between the atoms number on each surface, β is the viscous damping associated with the moving surface, γ is the viscous damping associated with the still surface, and V v B , ξ j , t is the potential function.
As mentioned above, the potential function is represented by:
V v B , ξ j , t = b · sin 2 π v B · t + c · j + ξ j ,
where b is the amplitude of potential function.
Each equation system in the FKT model is similar to the equation of an oscillatory system, which is described by
m · d 2 u d t 2 + f u , d u d t , c , k = 0 ,
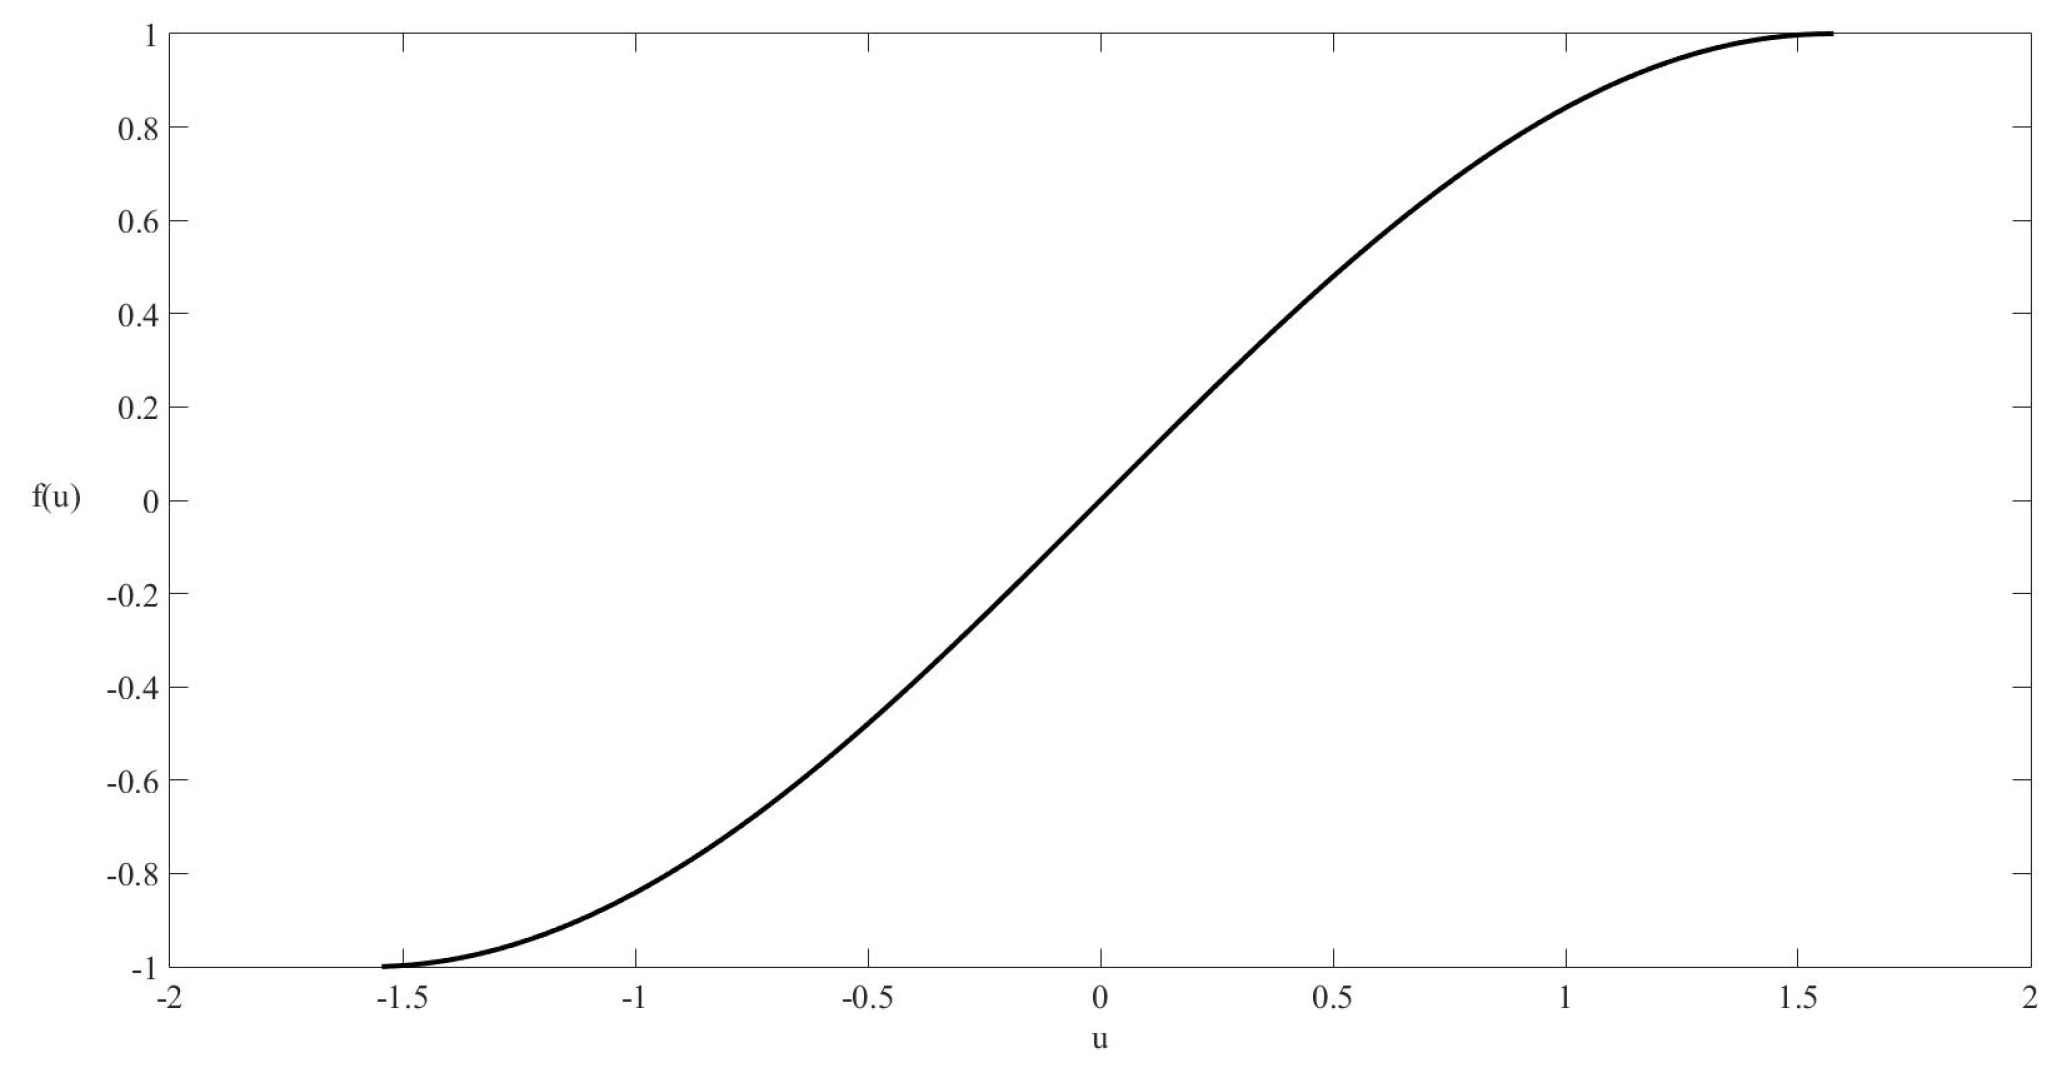
where k represents the stiffness of the spring elements, c is the damping coefficient, m represents the mass, and u represents displacement variable. The function f can be a trigonometric function or represent the non-linear load-displacement curve of a spring, Figure 2.
Let us assume that we have a system without energy dissipation and that the restoring force can be approximated by
f u = k · u 1 6 μ · k · u 3 .
Thus,
d 2 u d t 2 + ω 0 2 · u 1 6 μ · ω 0 2 · u 3 = 0 ,
where ω 0 2 = k / m and μ represents dissipation factor. Equation (5) is called Duffing’s equation [12,15,20,21,22].
Another variant of this equation is:
d 2 u d t 2 + a 4 d u d t + a 2 · x + a 1 · x 3 + a 3 cos ω · t = 0 ,
where a 1 , a 2 , a 3 , and a 4 represent coefficients, and ω is the angular frequency in the harmonic function. Therefore, Equation (6) will also be analysed in this work to compare the effects of the procedures that will be applied in the FKT model equations system.

3. The Convergence Criterion and the Lyapunov Exponent

As mentioned, we apply a software to the system of equations. Kirchhoff’s laws for the circuit are applying at time steps selected in order to obtain a stable convergence and that numerical approximations of integrations are sufficiently accurate [13].
When the algorithm has reached convergence for any iteration k, we have
| v n k + 1 v n k | R E L T O L · V n m a x + V N T O L ,
where v n is the voltage in the node n, and
V n m a x = M A X | v n k + 1 | , | v n k | .
These two parameters, RELTOL and VNTOL, which are the relative tolerance and absolute convergence, respectively, are related with the time step.
The ITL4 sets an upper limit on the number of iterations allowed to obtain a convergent solution at a timepoint.
The algorithm employed in this paper for determining Lyapunov exponents was proposed by Wolf et al. [14]. The algorithms allow the estimation of non-negative Lyapunov exponents from an time series. In this reference, the method is tested on model systems with known Lyapunov spectra and applied to data for the Belousov-Zhabotinskii reaction and Couette-Taylor flow [14].
The open-source free-software called Ngspice, which is used in this work, provides code models to support numerical simulation through a fast event-driven algorithm. This software is used for the simulation of large and complex circuits. In this work, we take advantage of its performance. Moreover, several tests were developed with equivalent MATLAB functions with acceptable results in case of simpler models, only with three atoms.

4. Simulation and Results

The model used in this work is based on the formal equivalence between the finite difference equations of the mathematical and network models.
Once the equivalence between electric and mechanical variables has been chosen, linear terms of the PDE are easily implemented by linear electrical devices, such as resistors, capacitors, and coils, while non-linear and coupled terms are implemented using auxiliary circuits or controlled current and voltage sources. The last are a special kind of source whose output can be defined—by software—as a function of the dependent or independent variables defined in any node or any component of the model. In addition, boundary and initial conditions—linear or not—are also immediately implemented by suitable electric components.
Once the network model has been designed, it is run with no need for other mathematical manipulations since the simulation code does this. The well-tried and powerful software for circuit simulation Ngspice, requires relatively short computing time thanks to the continuous adjusting of the internal time step required for the convergence. Solution simultaneously provides all the variables of interest: relative displacement and velocity of each atom as a function of time, phase diagrams, etc.
The Duffing equation will be solved for the following parameters: a 1 equal to 1 , a 2 equal to 1, a 3 equal to 0.7 , a 4 equal to 0.7, and ω equal to 1.4. The initial values are zero for the displacement and the velocity. For the calculation, the ITL4 has been set to 4000 iterations and DTMIN, the minimum internal time step, is set up in order to reduce the calculation time.
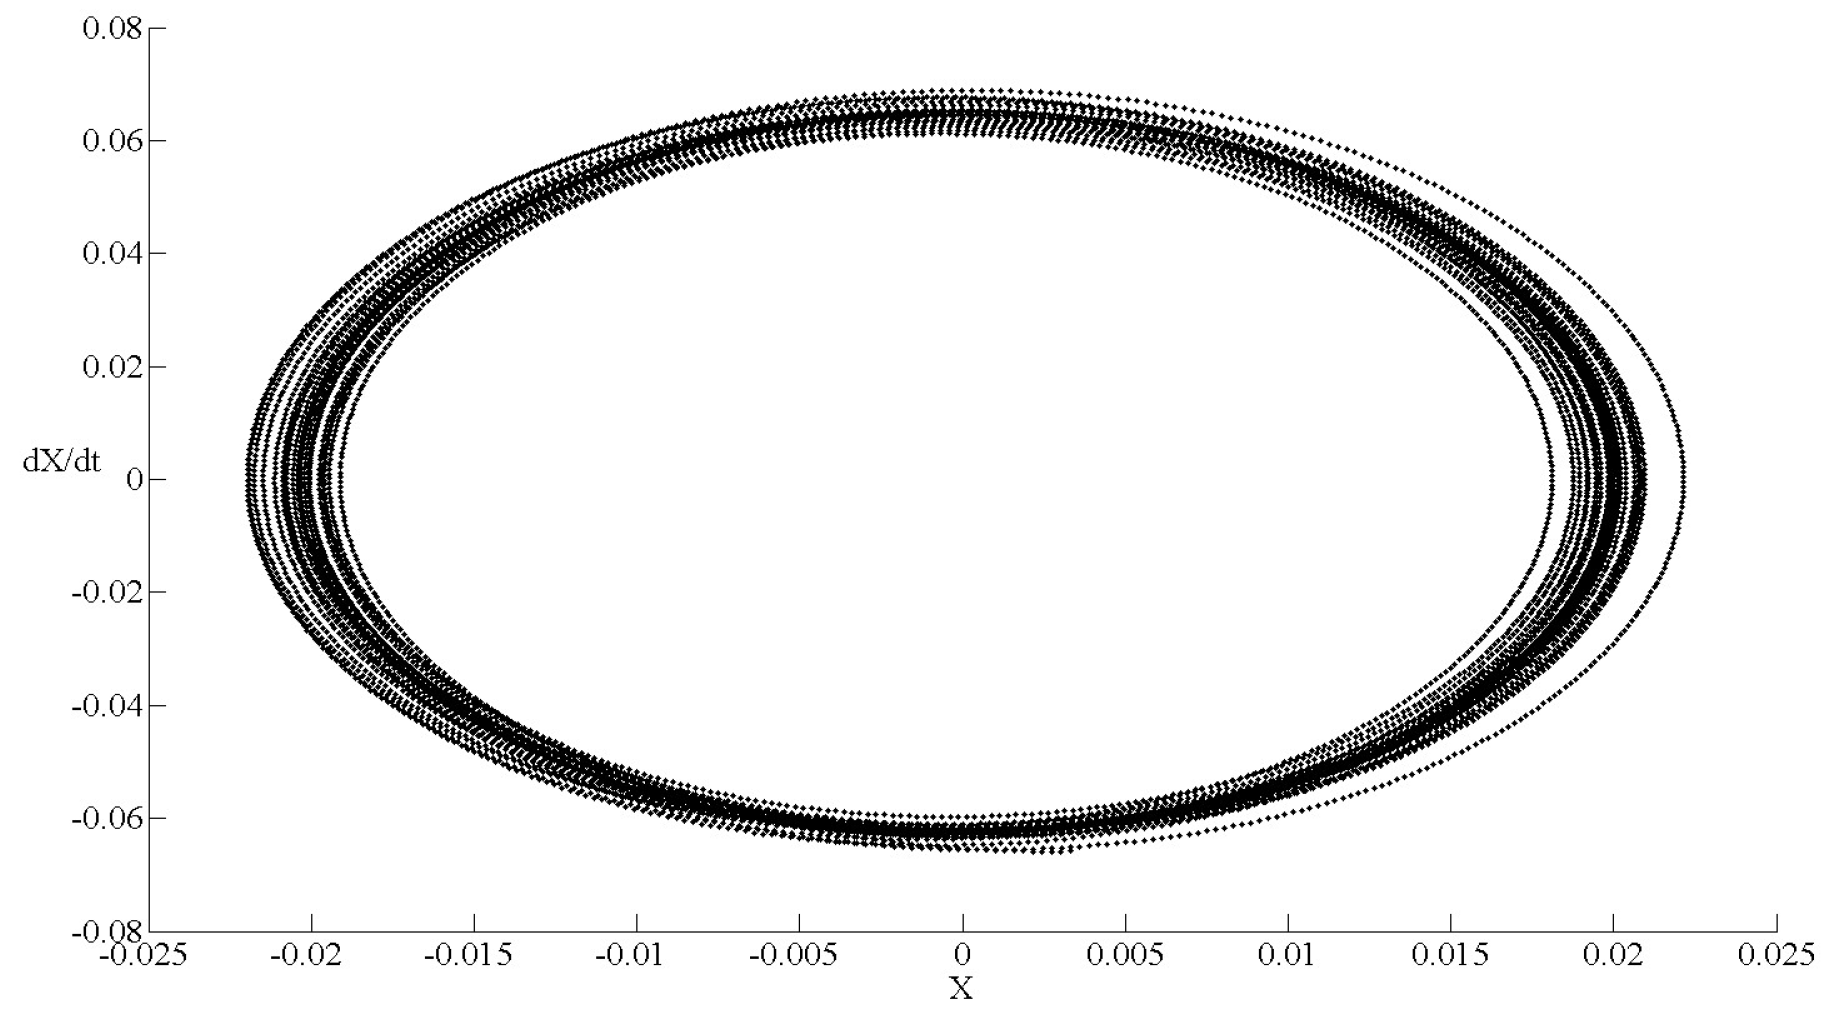
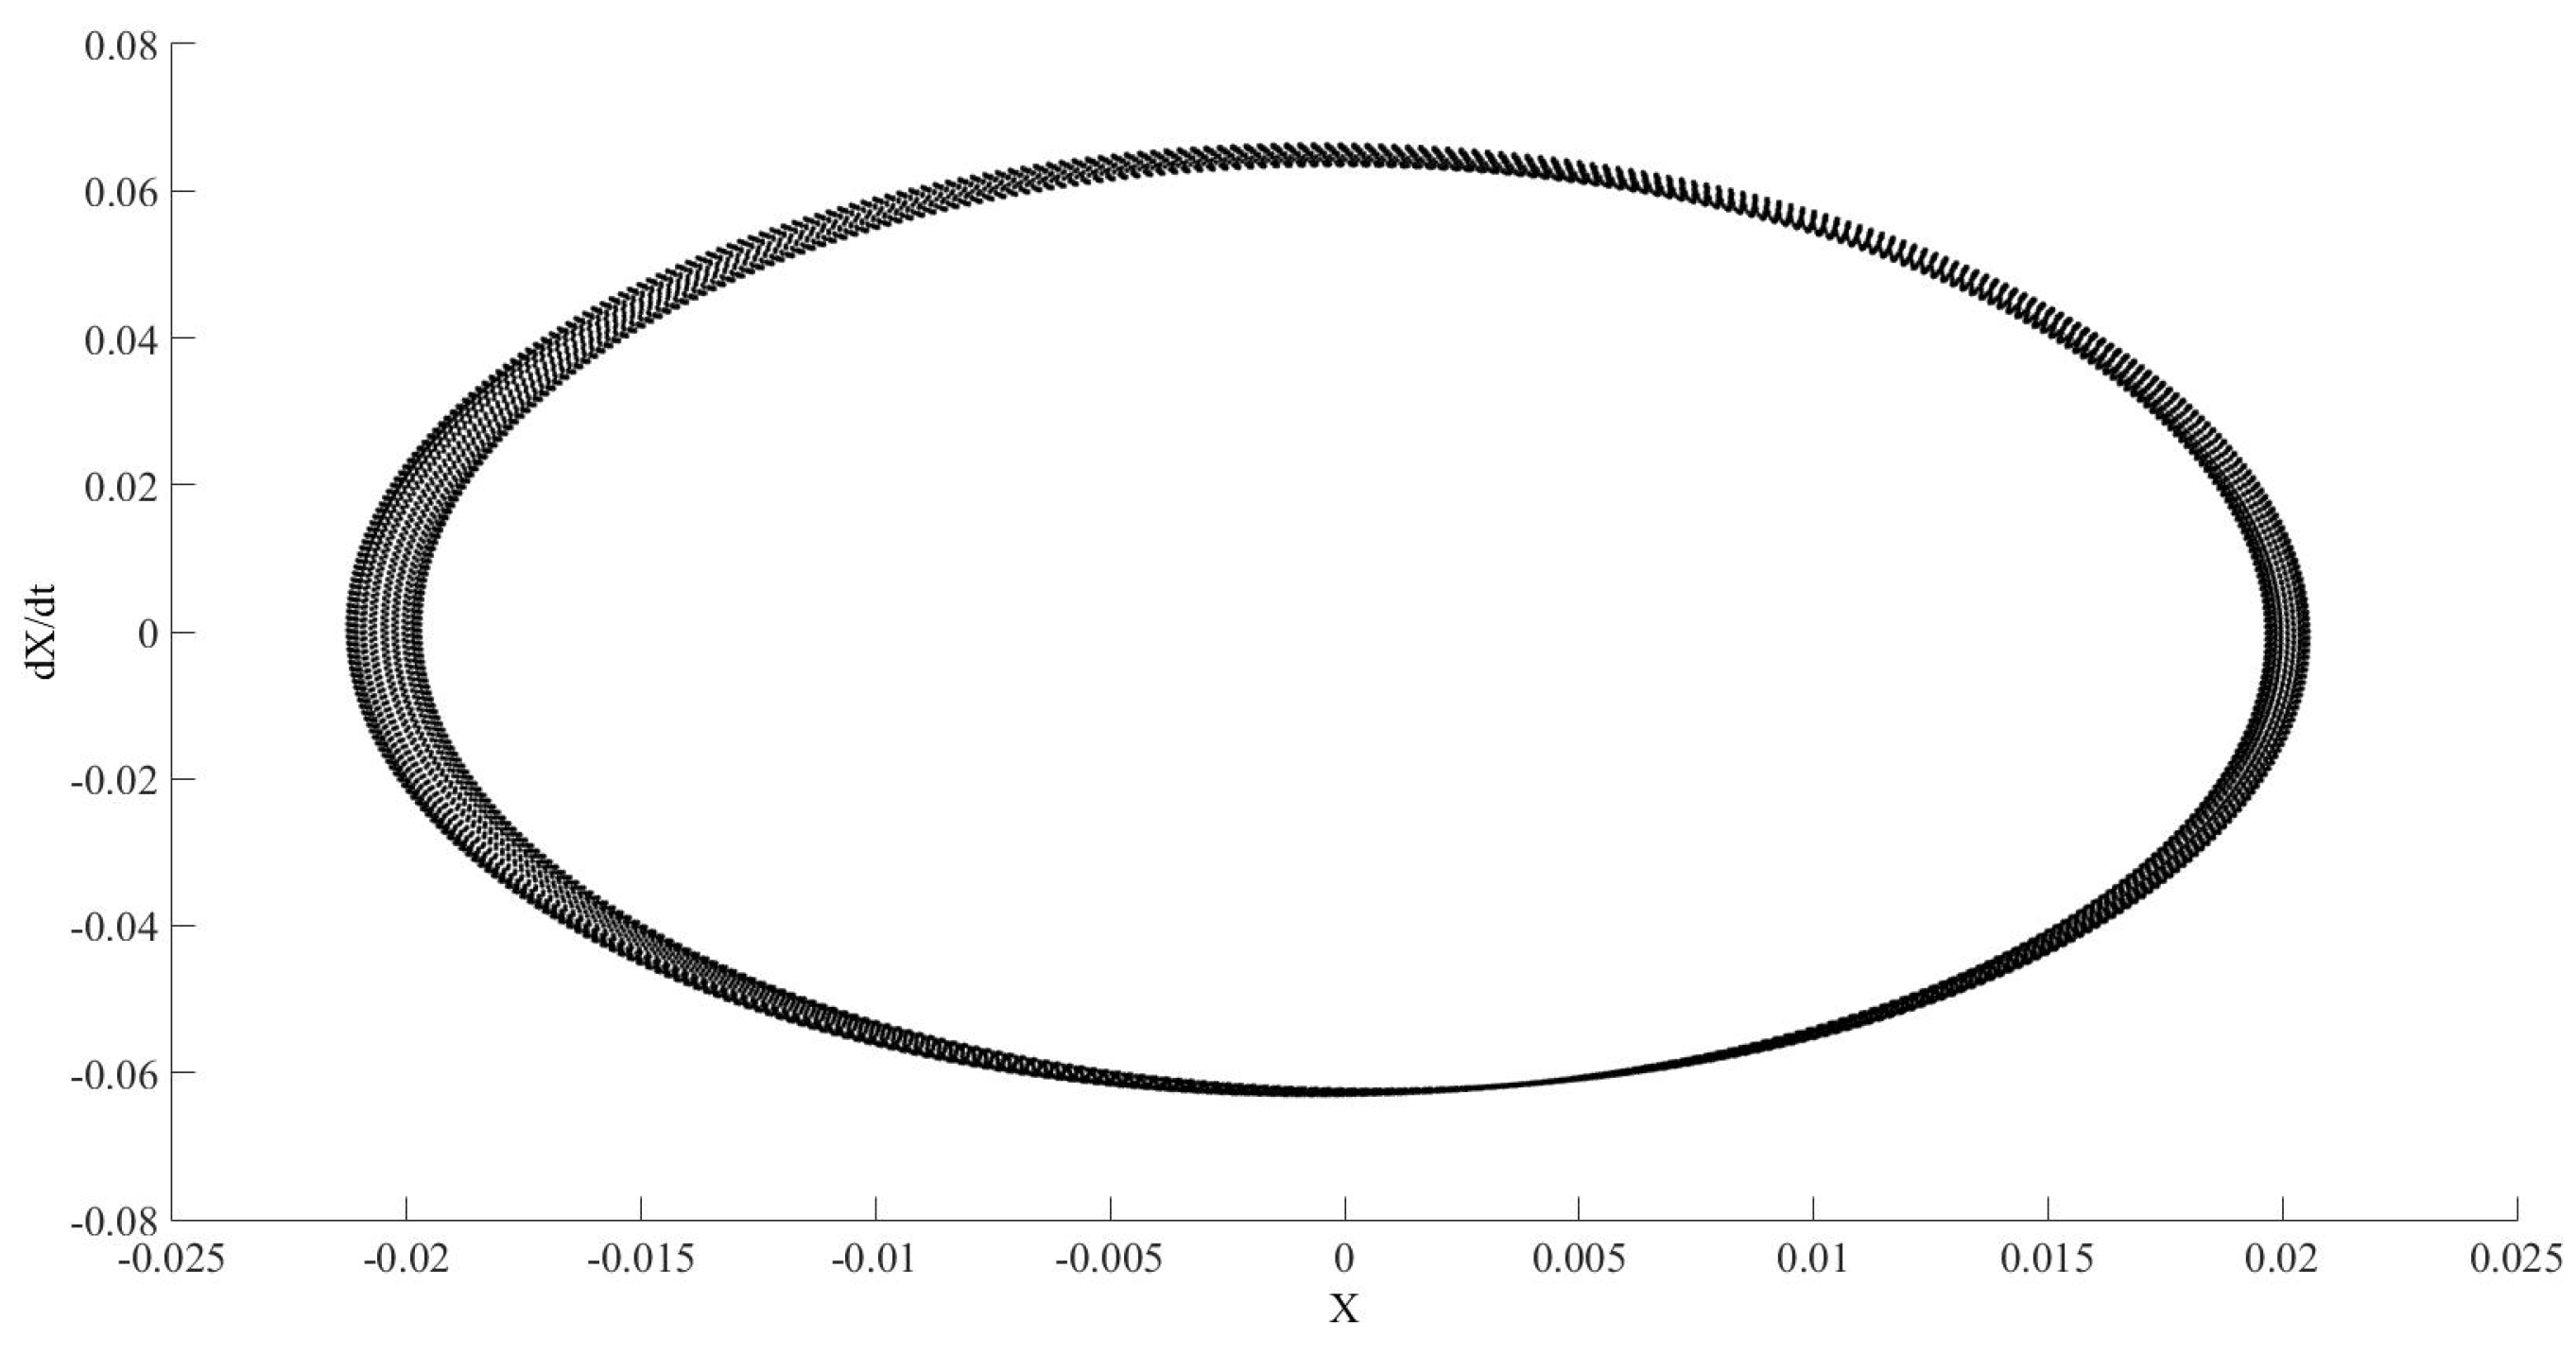
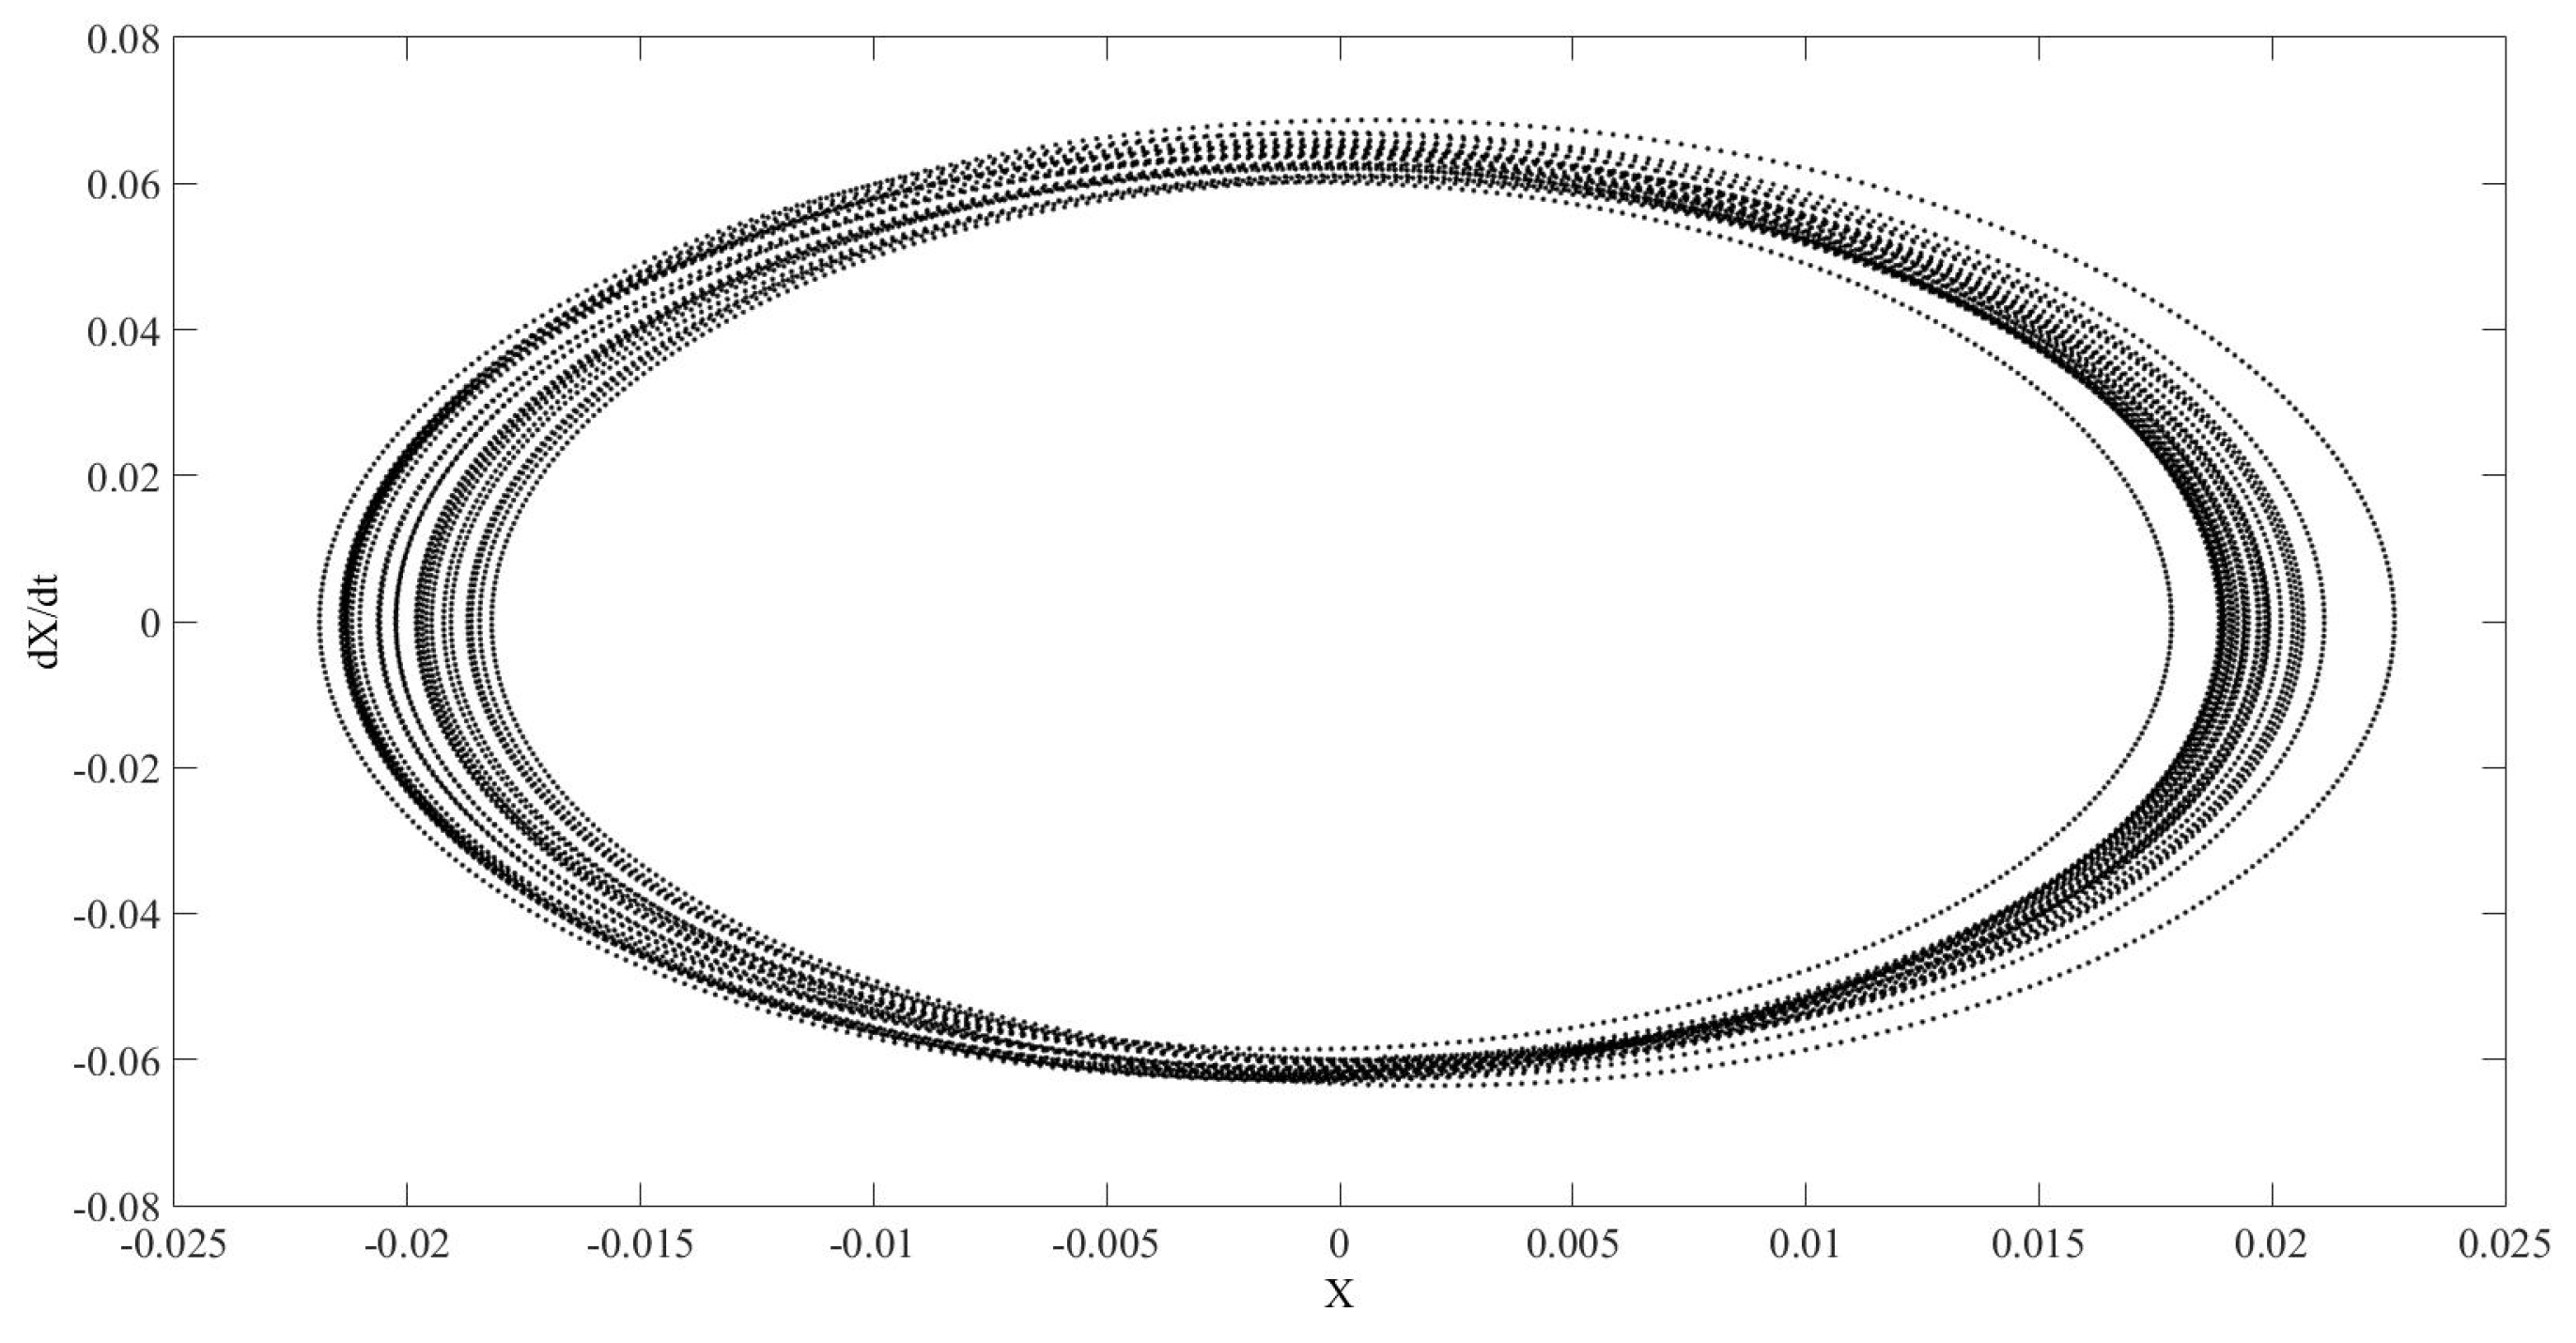
We solved the equation numerically for different convergence tolerances. Figure 3 shows the phase diagram for RELTOL and VNTOL equal to 10 10 . The simulated time is 1000 s. Figure 4 represents only the interval between 900 and 1000 s, while Figure 5 represents only the interval between 0 and 100 s. Figure 6 shows the Lyapunov exponents of this system, which are negative and therefore prove the system stability. Nevertheless, it is necessary to take care of, since it is not immediate that in physical phenomena described by differential or difference equations, the existence of a trajectory with a positive Lyapunov exponent implies the system is instable and by opposite a trajectory with negative Lyapunov exponent is stable. As Balibrea and Caballero showed [23], the positivity or negativity are held uniformly in subsets of the phase space. In such cases positivity implies instability and negativity implies stability. A detailed analysis of Lyapunov exponents is applied to some examples in certain articles [23,24].
At this moment, we seek to analyse the effect of the convergence tolerance in the solution in the first seconds. Thus, Figure 7 represents the solution for RELTOL and VNTOL equal to 10 15 . There are differences between Figure 5 and Figure 7 even when using these small values for tolerances. It is also possible to find differences in the case of a courser convergence tolerance as in Figure 8, with RELTOL and VNTOL equal to 10 6 . Finally, with RELTOL and VNTOL equal to 10 20 , Figure 9, we have found the same solution as in Figure 7. Since the number of calculated points is very high with this convergence tolerance, only a selection of a few points corresponding to each second is recorded separately in order to obtain the last figure; and the calculation then starts again from zero to obtain the following second recorded.
After the previous analysis, the FKT model, a more complex case, will be solved for the following parameters: v B equal to 0.5, c equal to 144/233, b / m equal to 0.1, κ 1 / m equal to 1, κ 2 / m equal to 1.5, γ / m is equal to zero, and β / m is equal to 0.1.
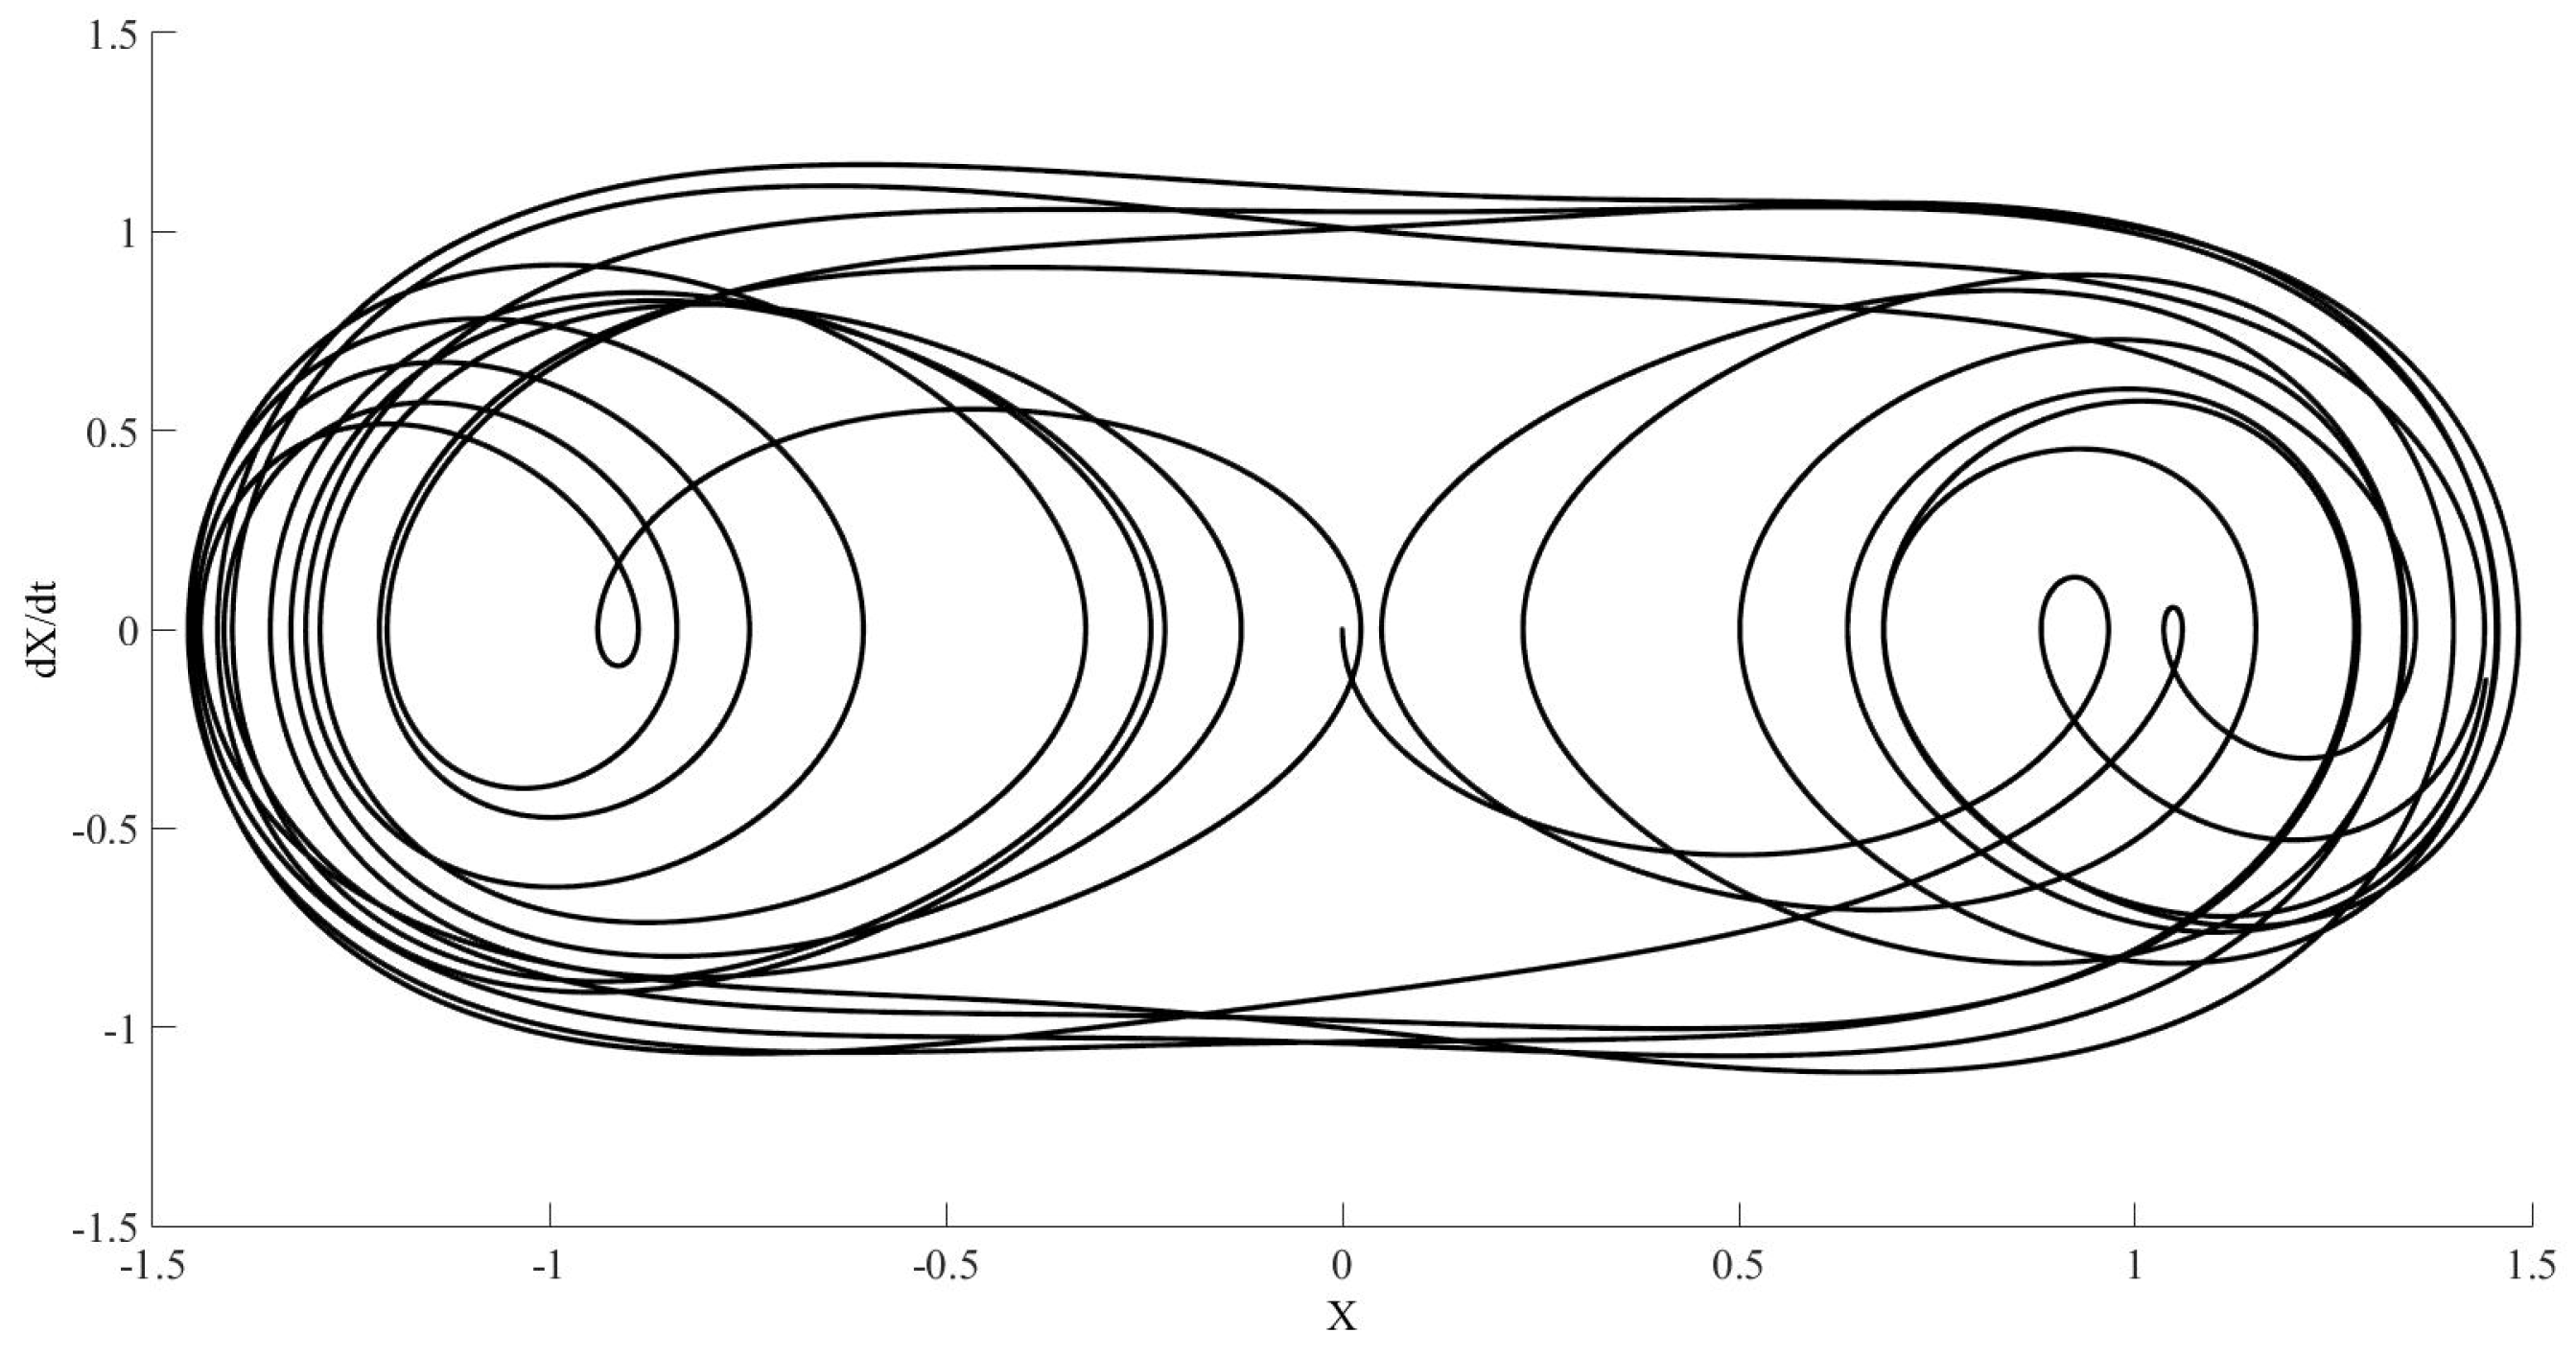
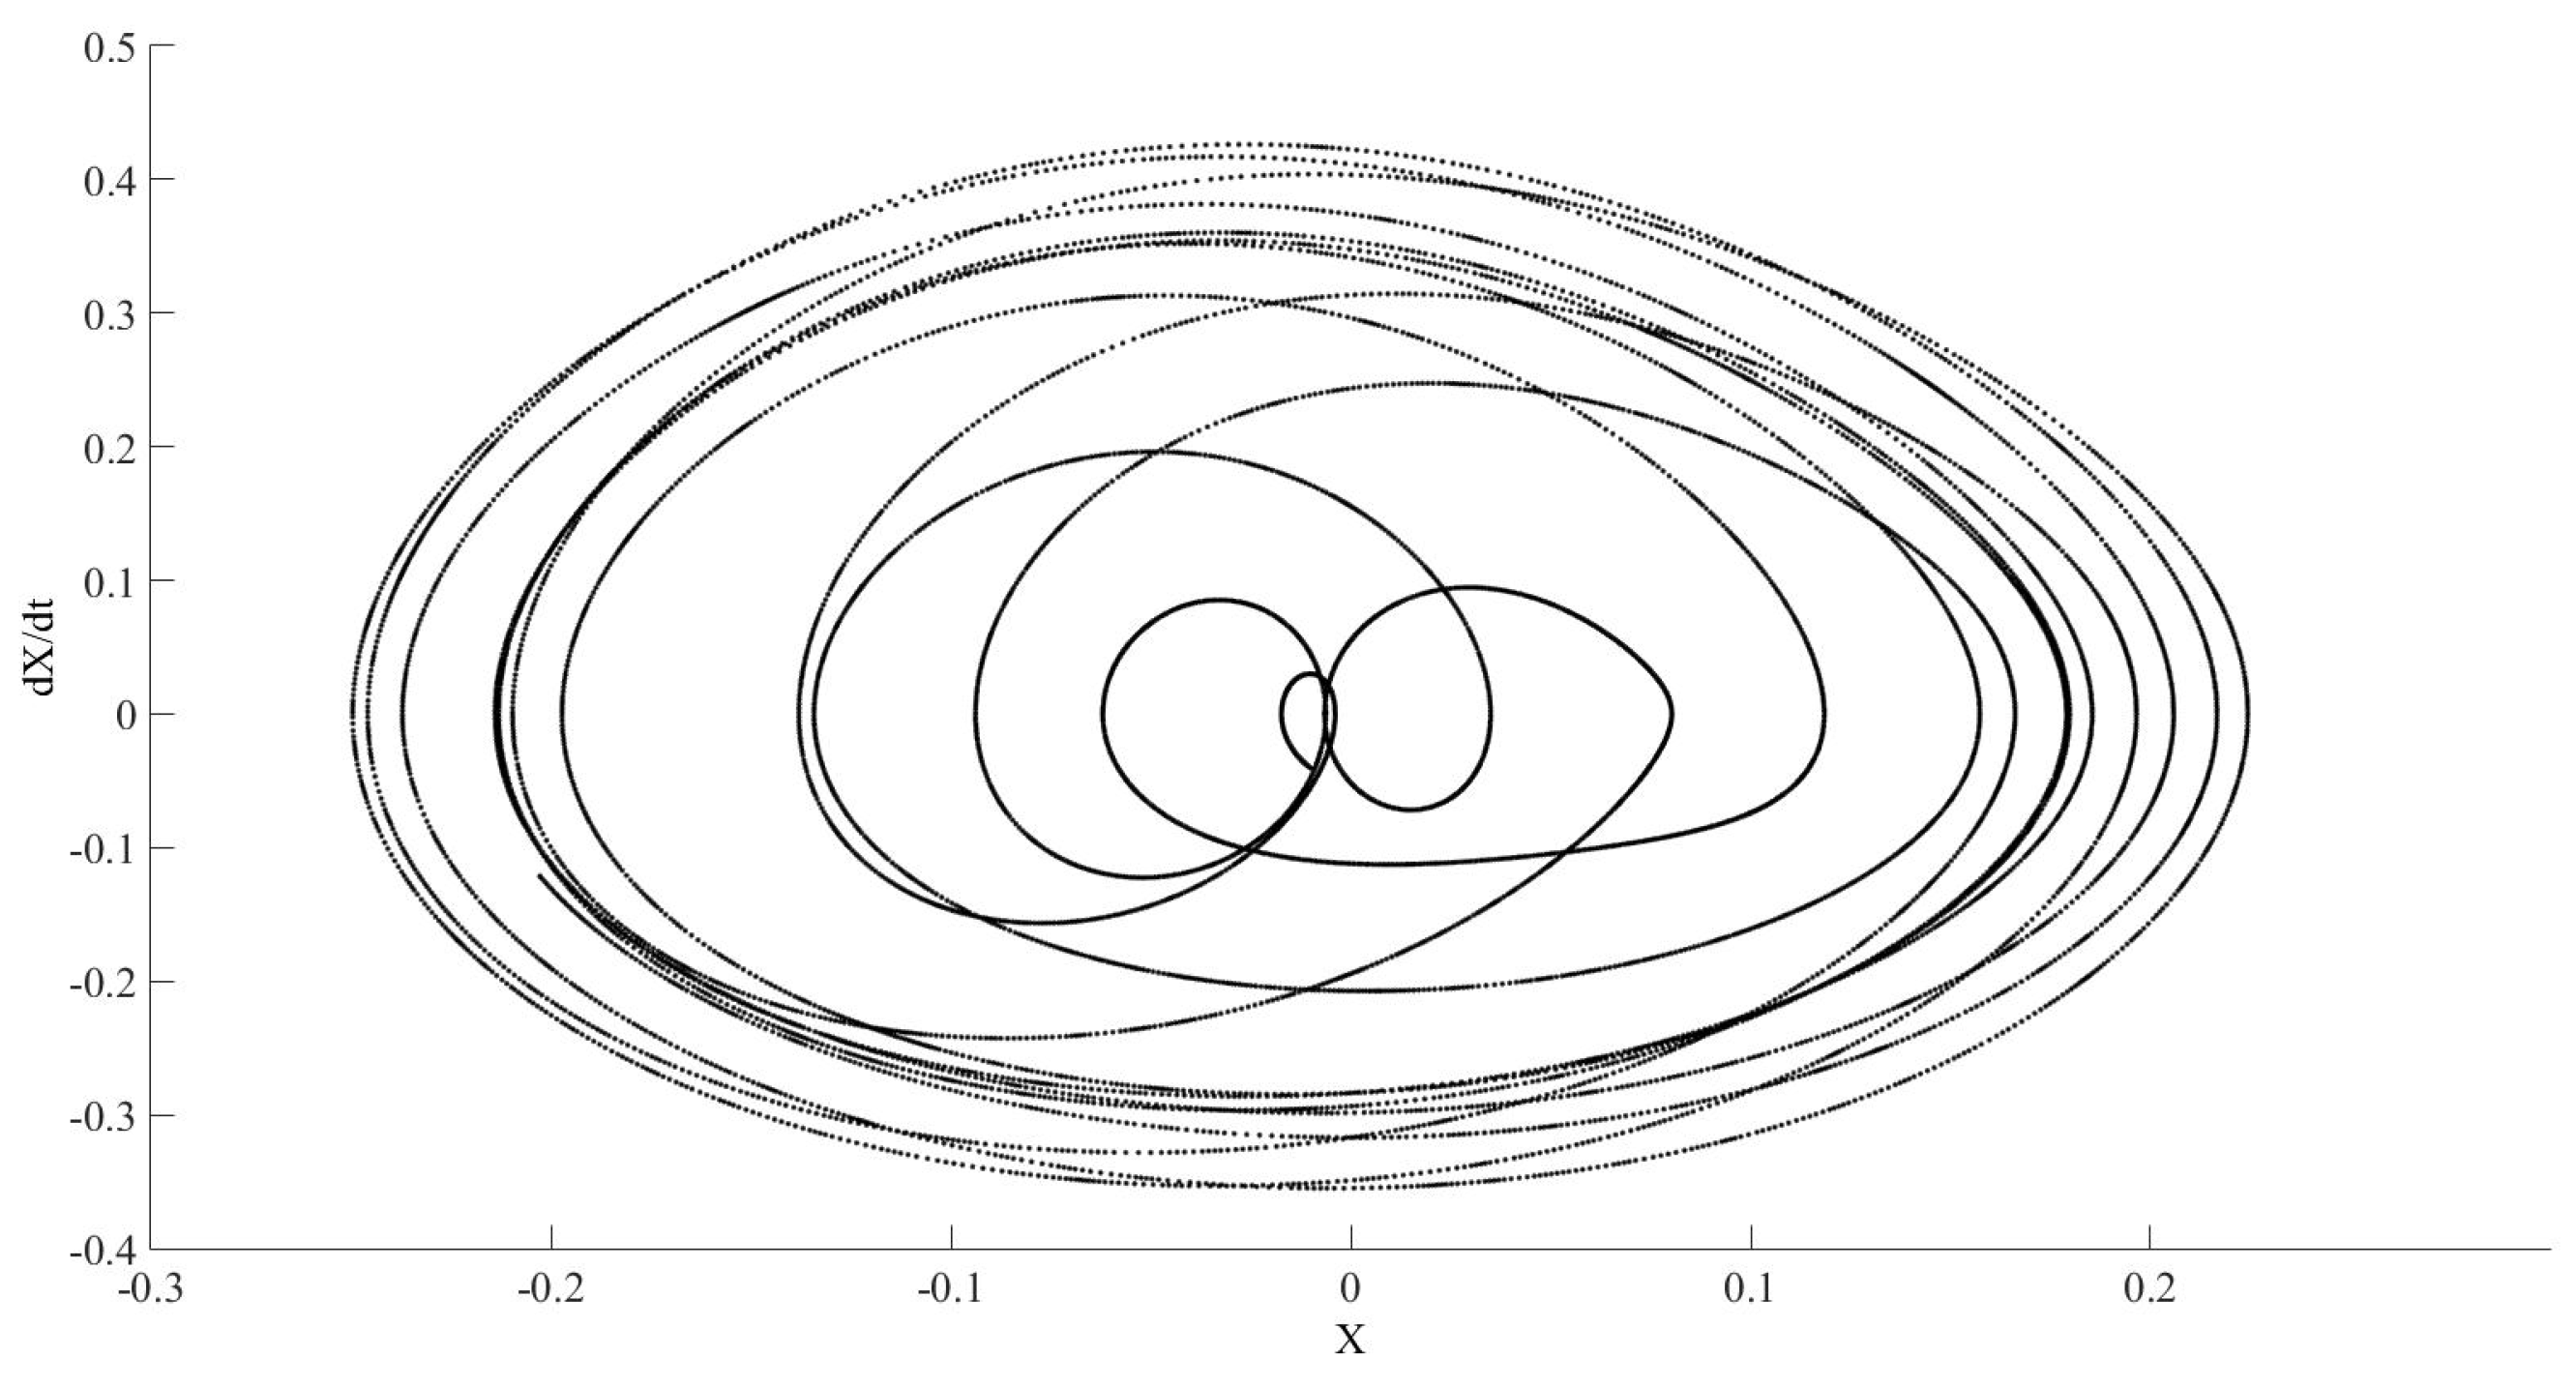
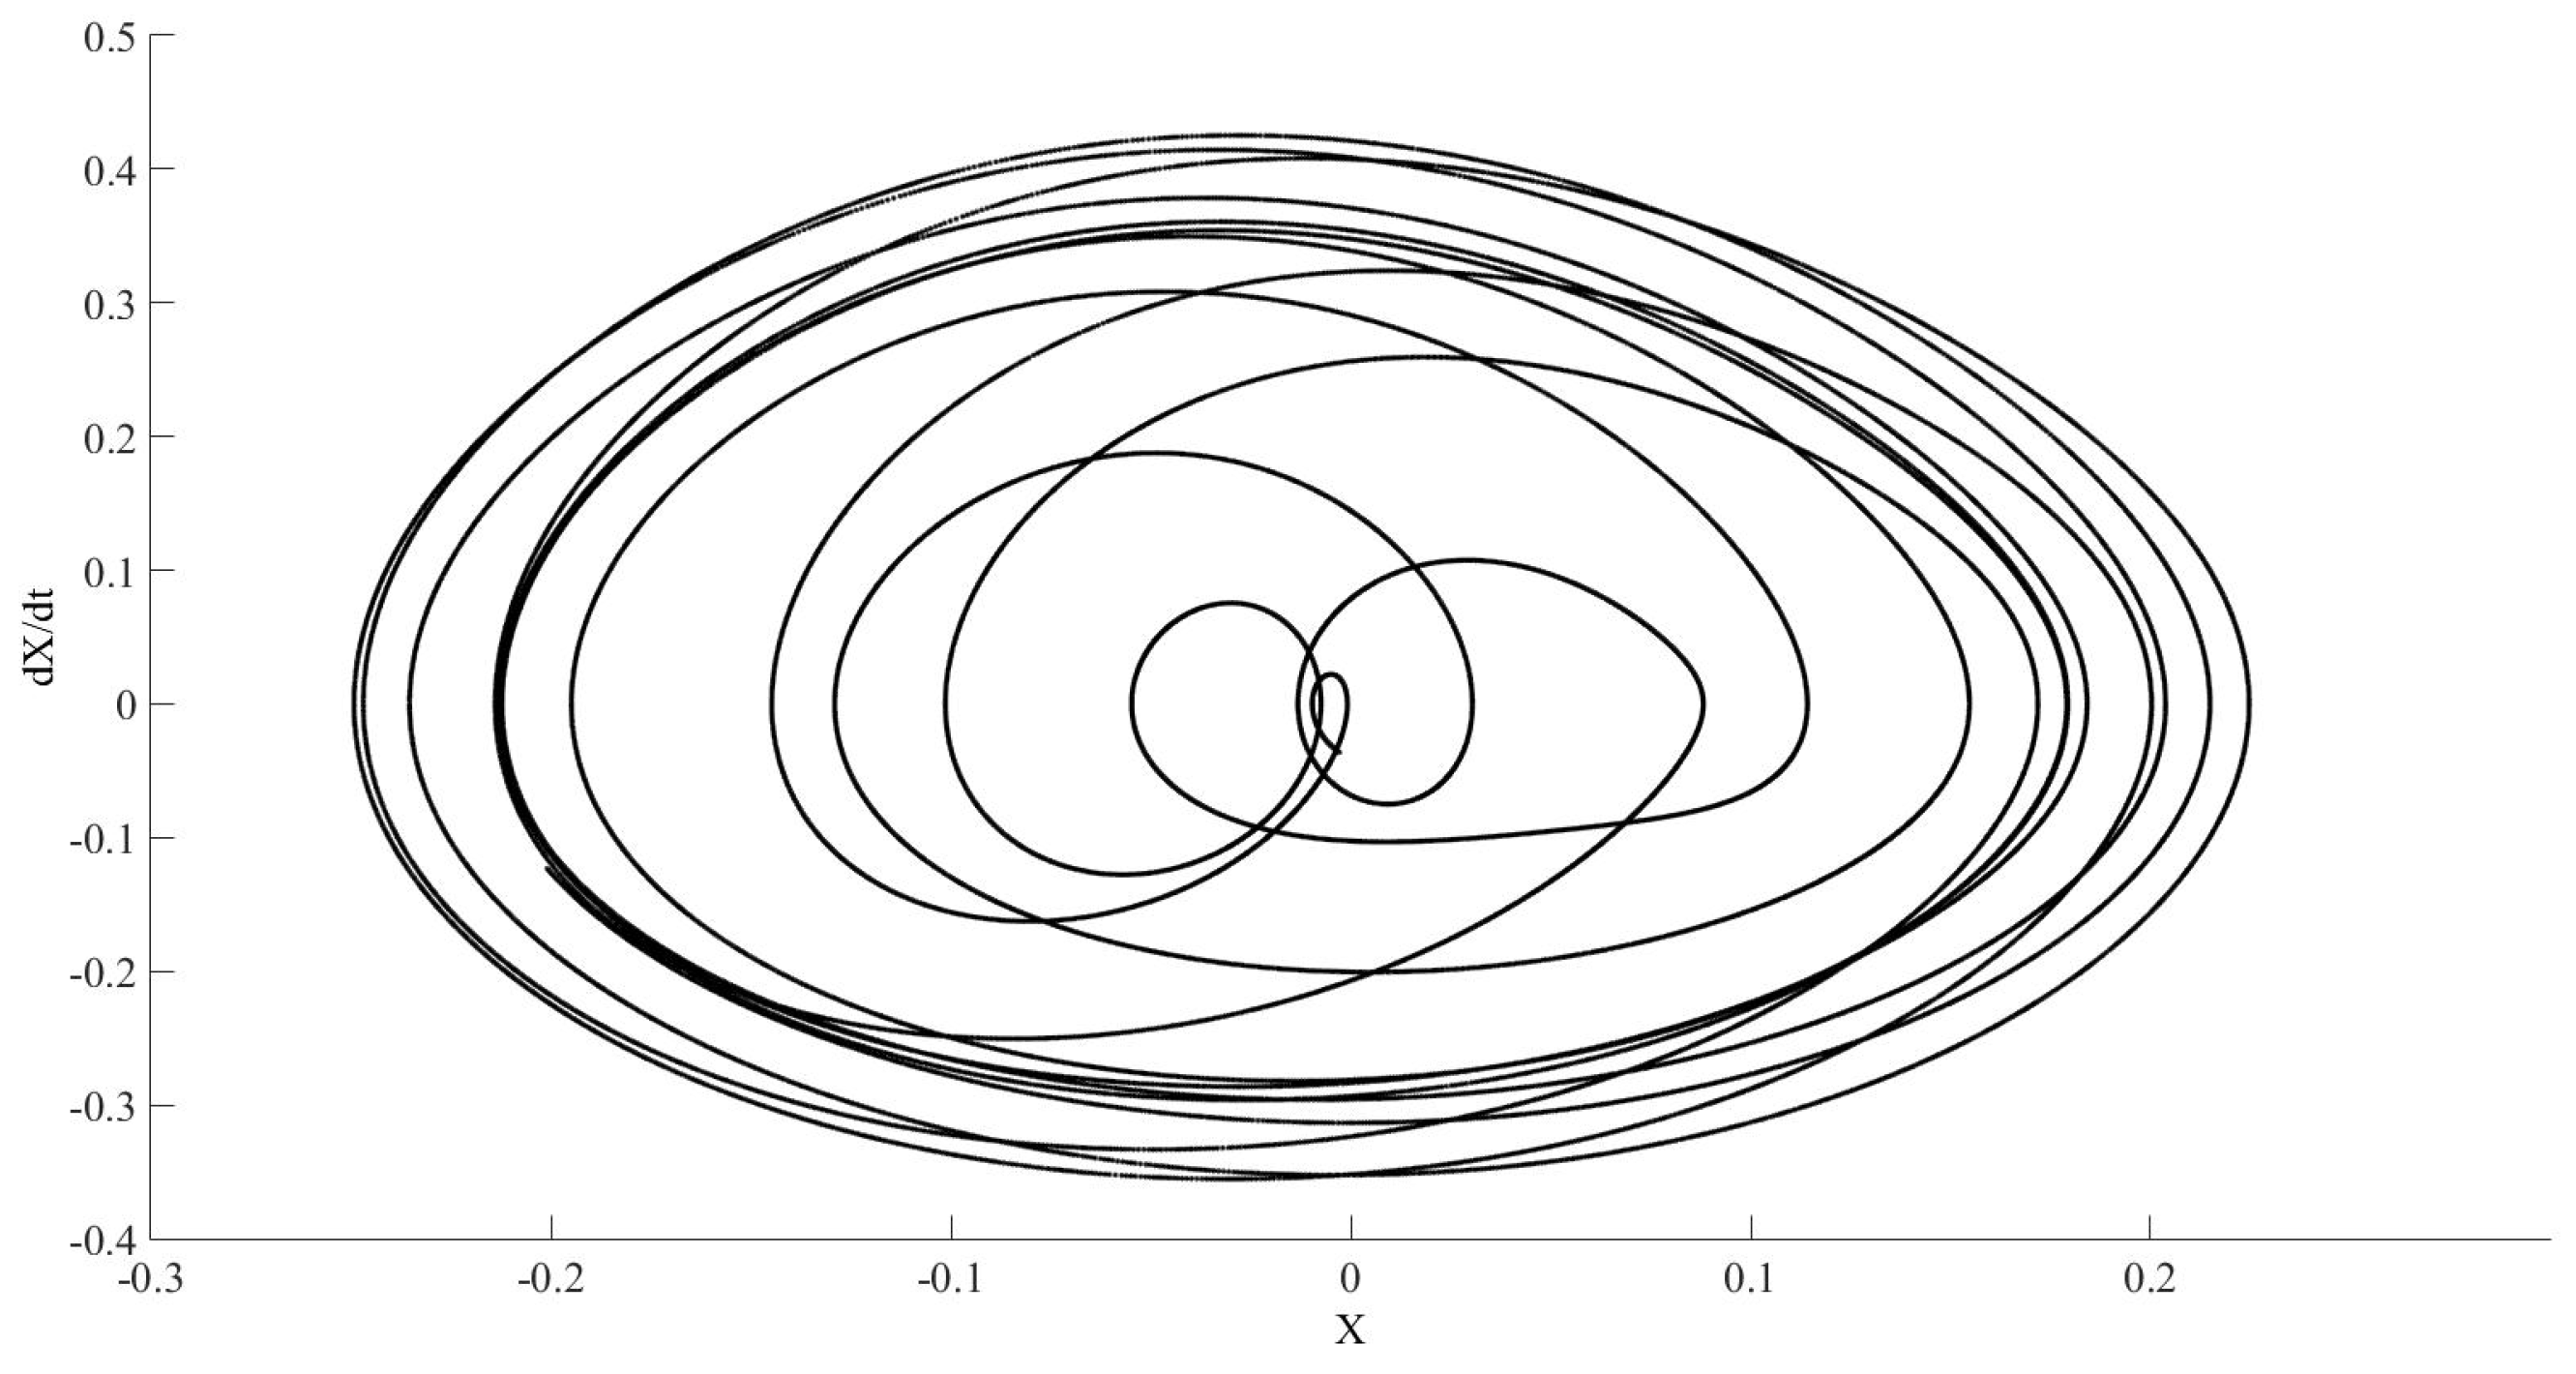
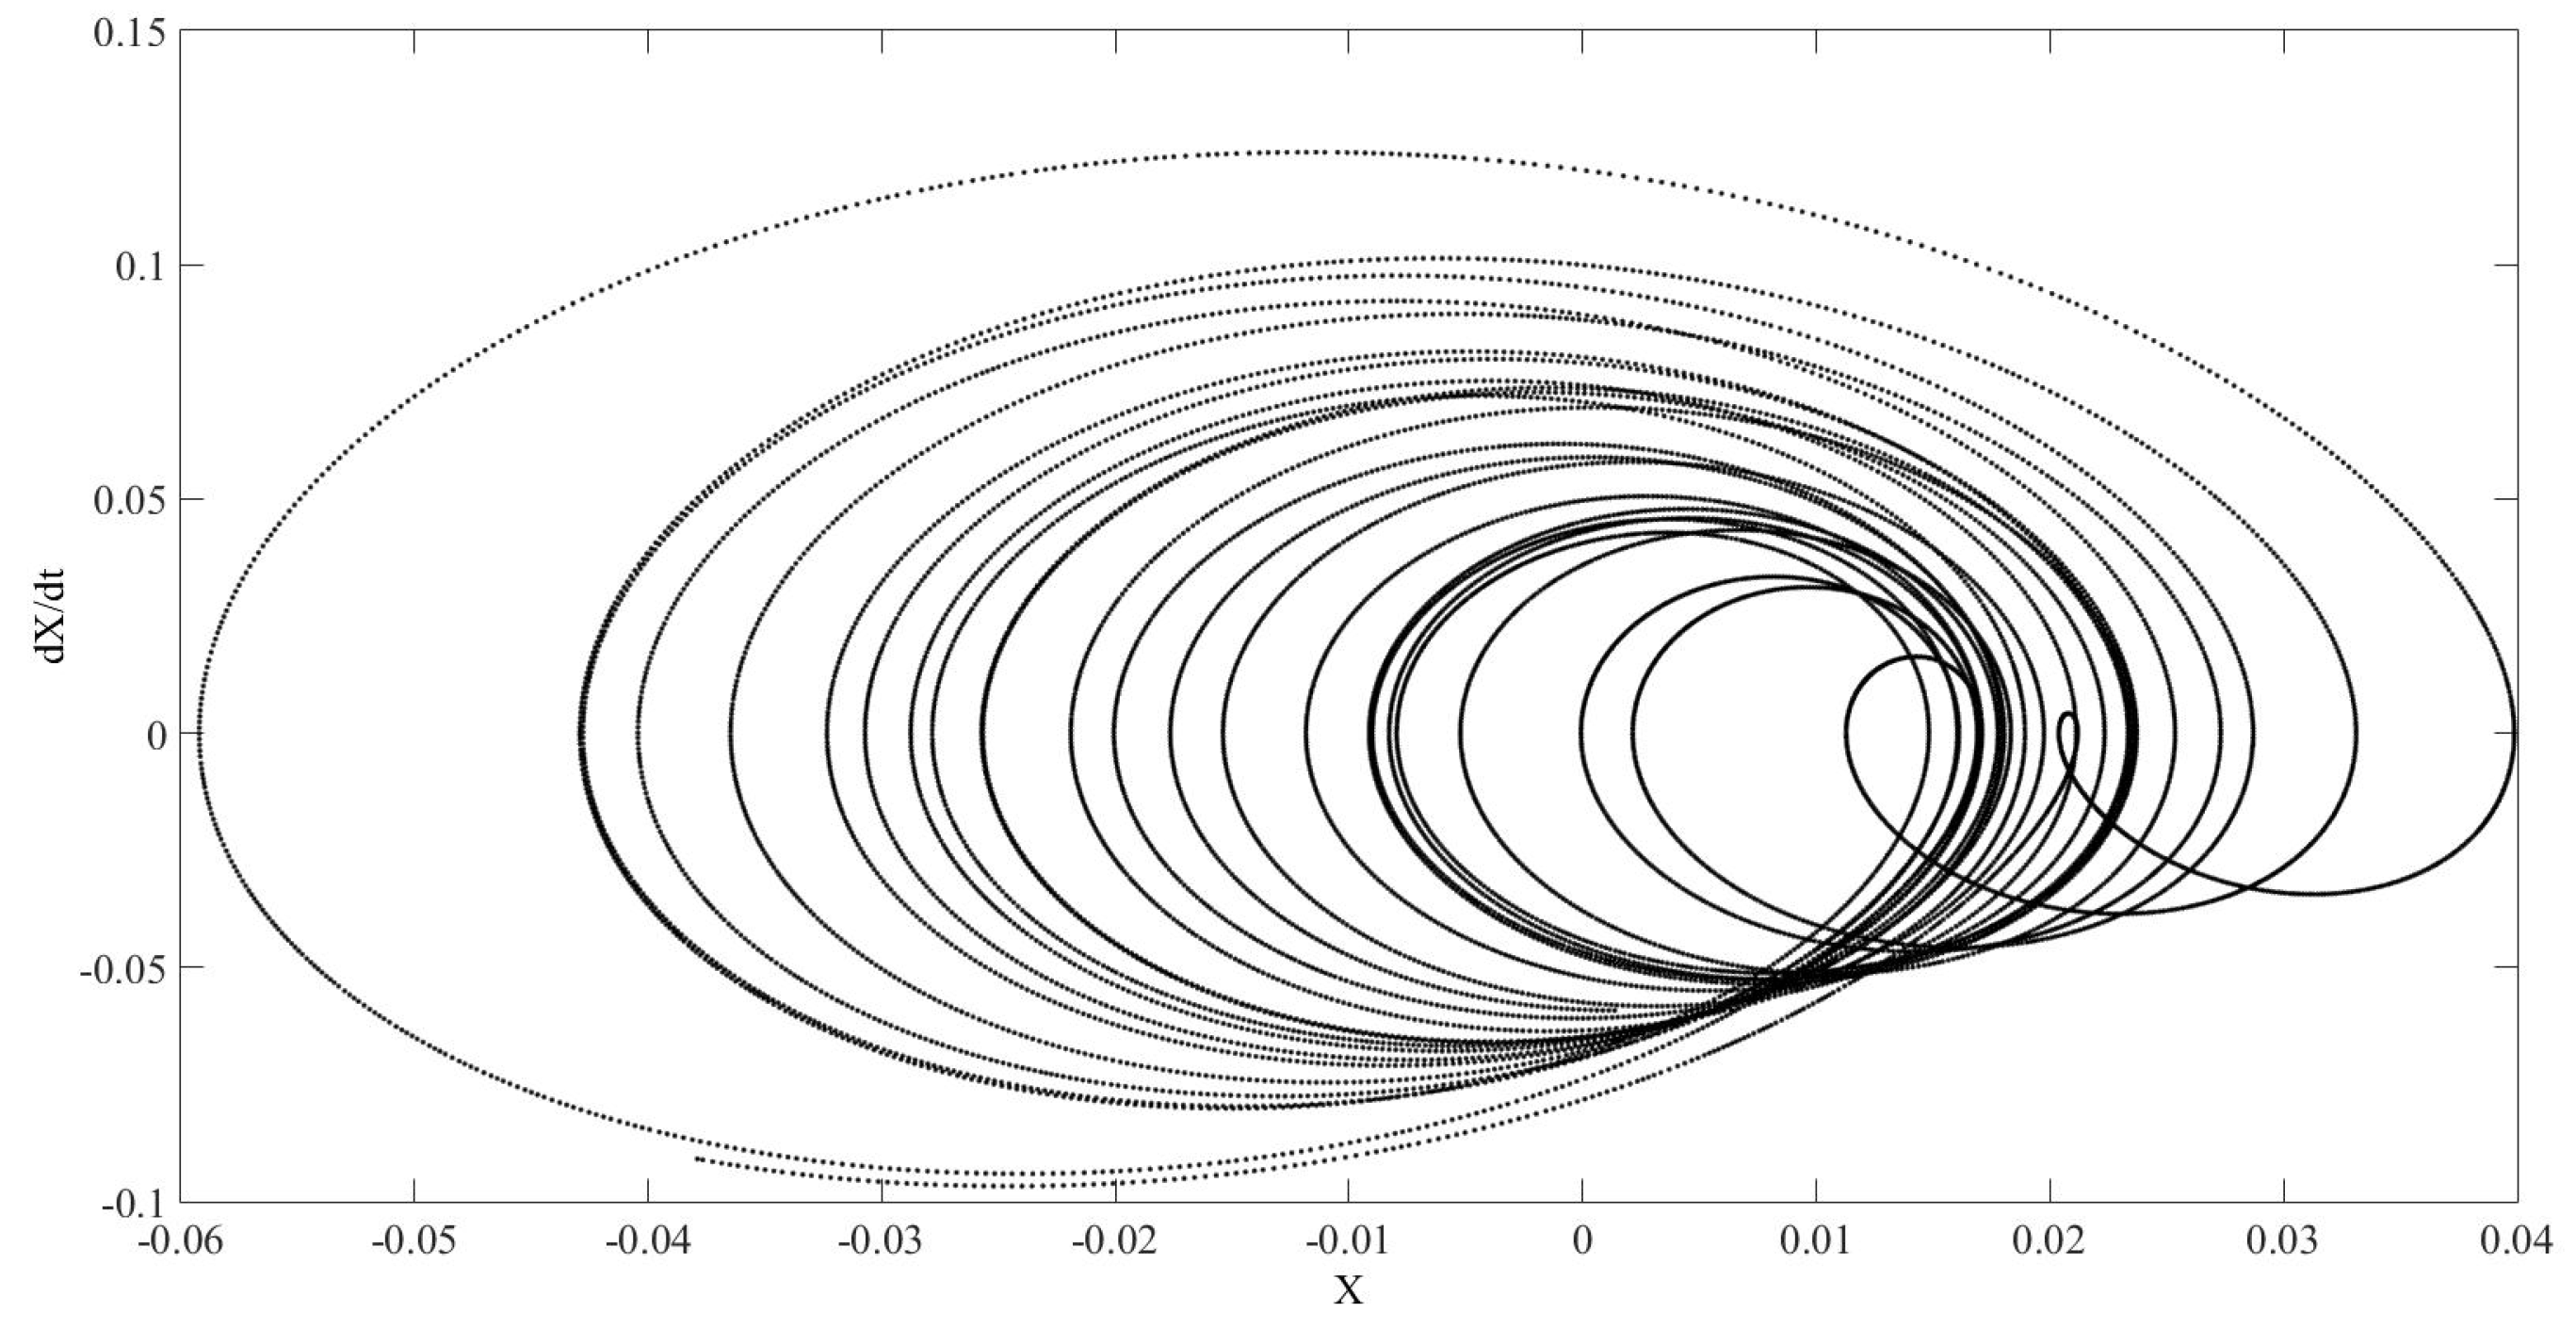
We solved the model numerically for different convergence tolerances. Figure 10 shows the phase diagram for RELTOL and VNTOL equal to 10 6 . The represented time is range from 1450 to 1500 s. Figure 11, Figure 12 and Figure 13 show the effect of reducing the value of these tolerances. Figure 14 and Figure 15 show the results for the same tolerances as Figure 13 in different time intervals.
Figure 16 and Figure 17 show the differences between the phase diagrams using the tolerances of the Figure 10 and Figure 13, even during the first moments.
An additional calculation, represented in Figure 18, has been developed using different characterisation parameters for the element of the network. Thus, the initial estimation for zero and infinite resistance, 1 e 8 and 1 e + 8 , respectively, has been change to 1 e 20 and 1 e + 20 . The differences between Figure 10 and Figure 18 shows the difficulty to obtain the real behaviour of this system.
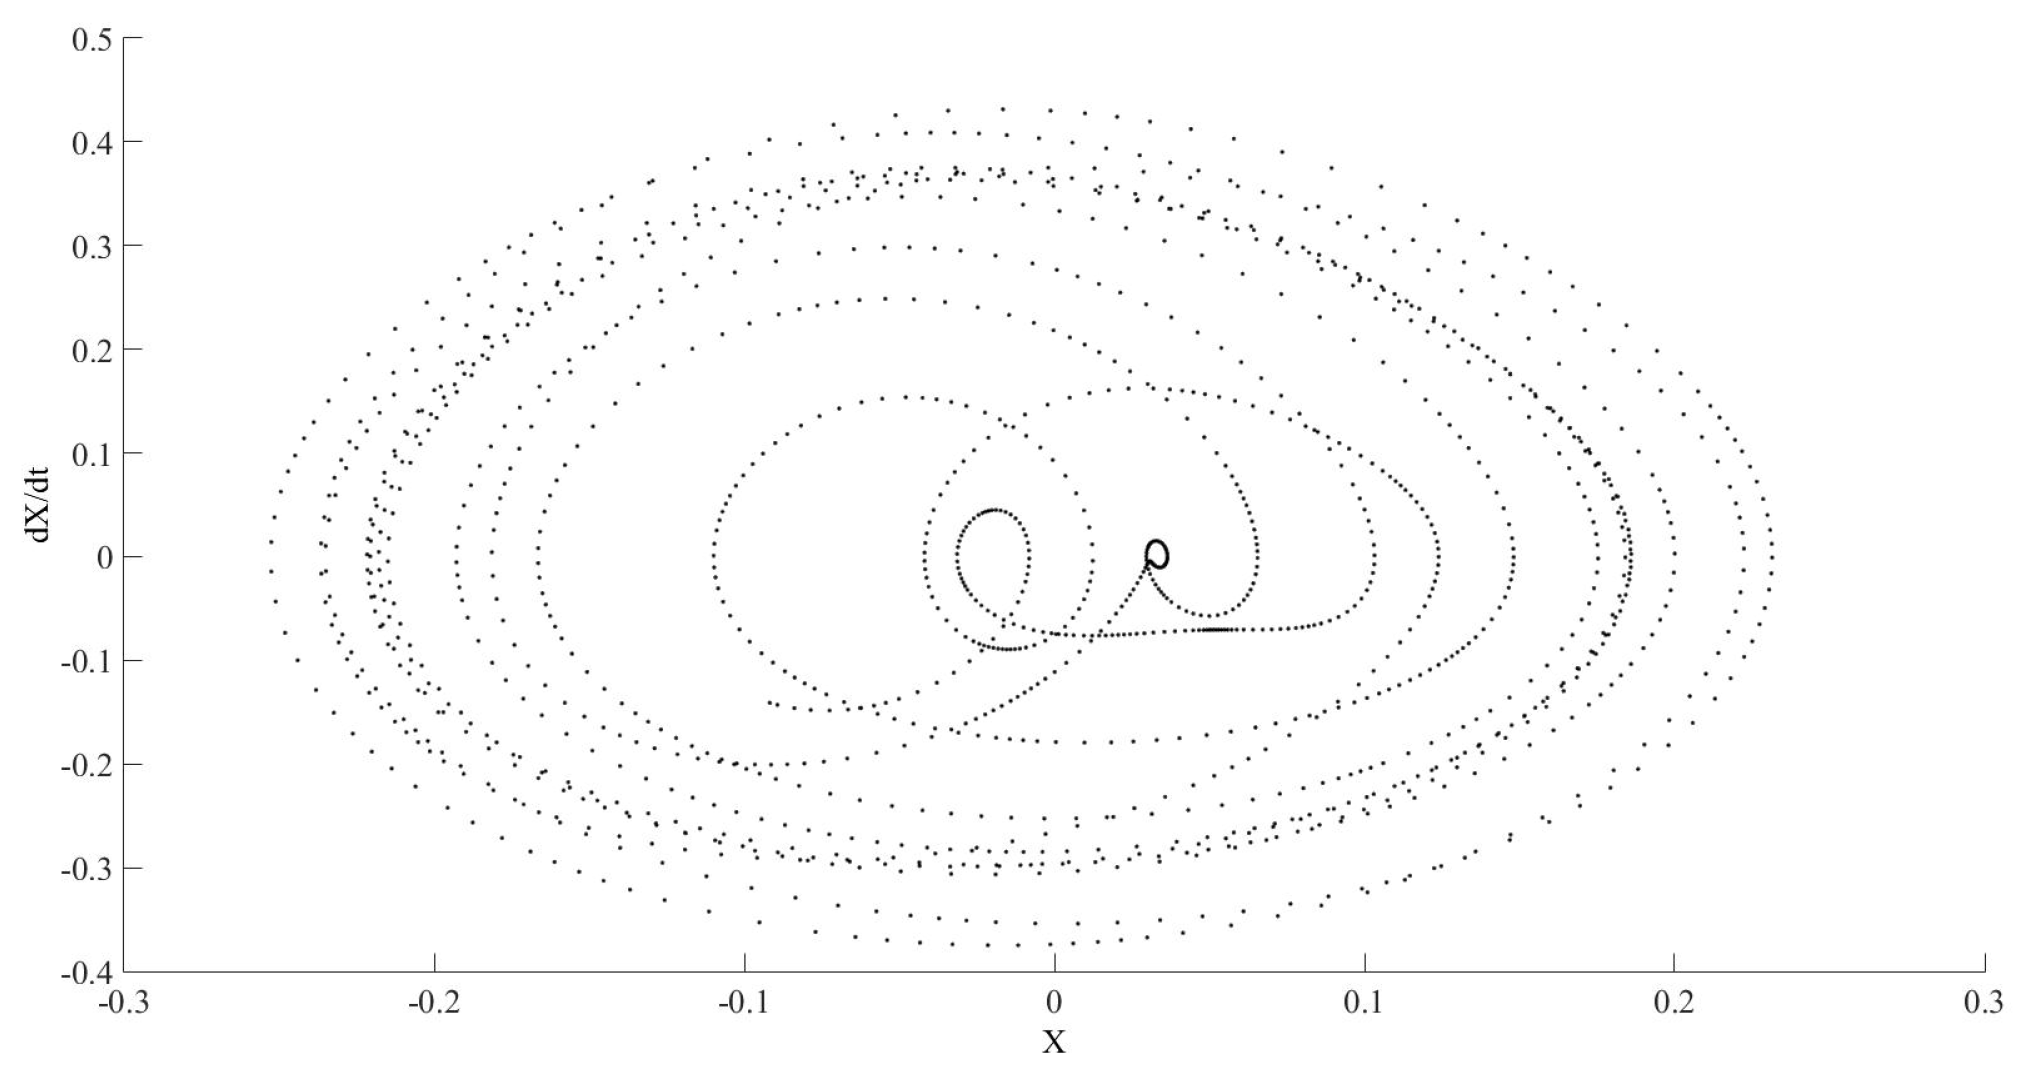
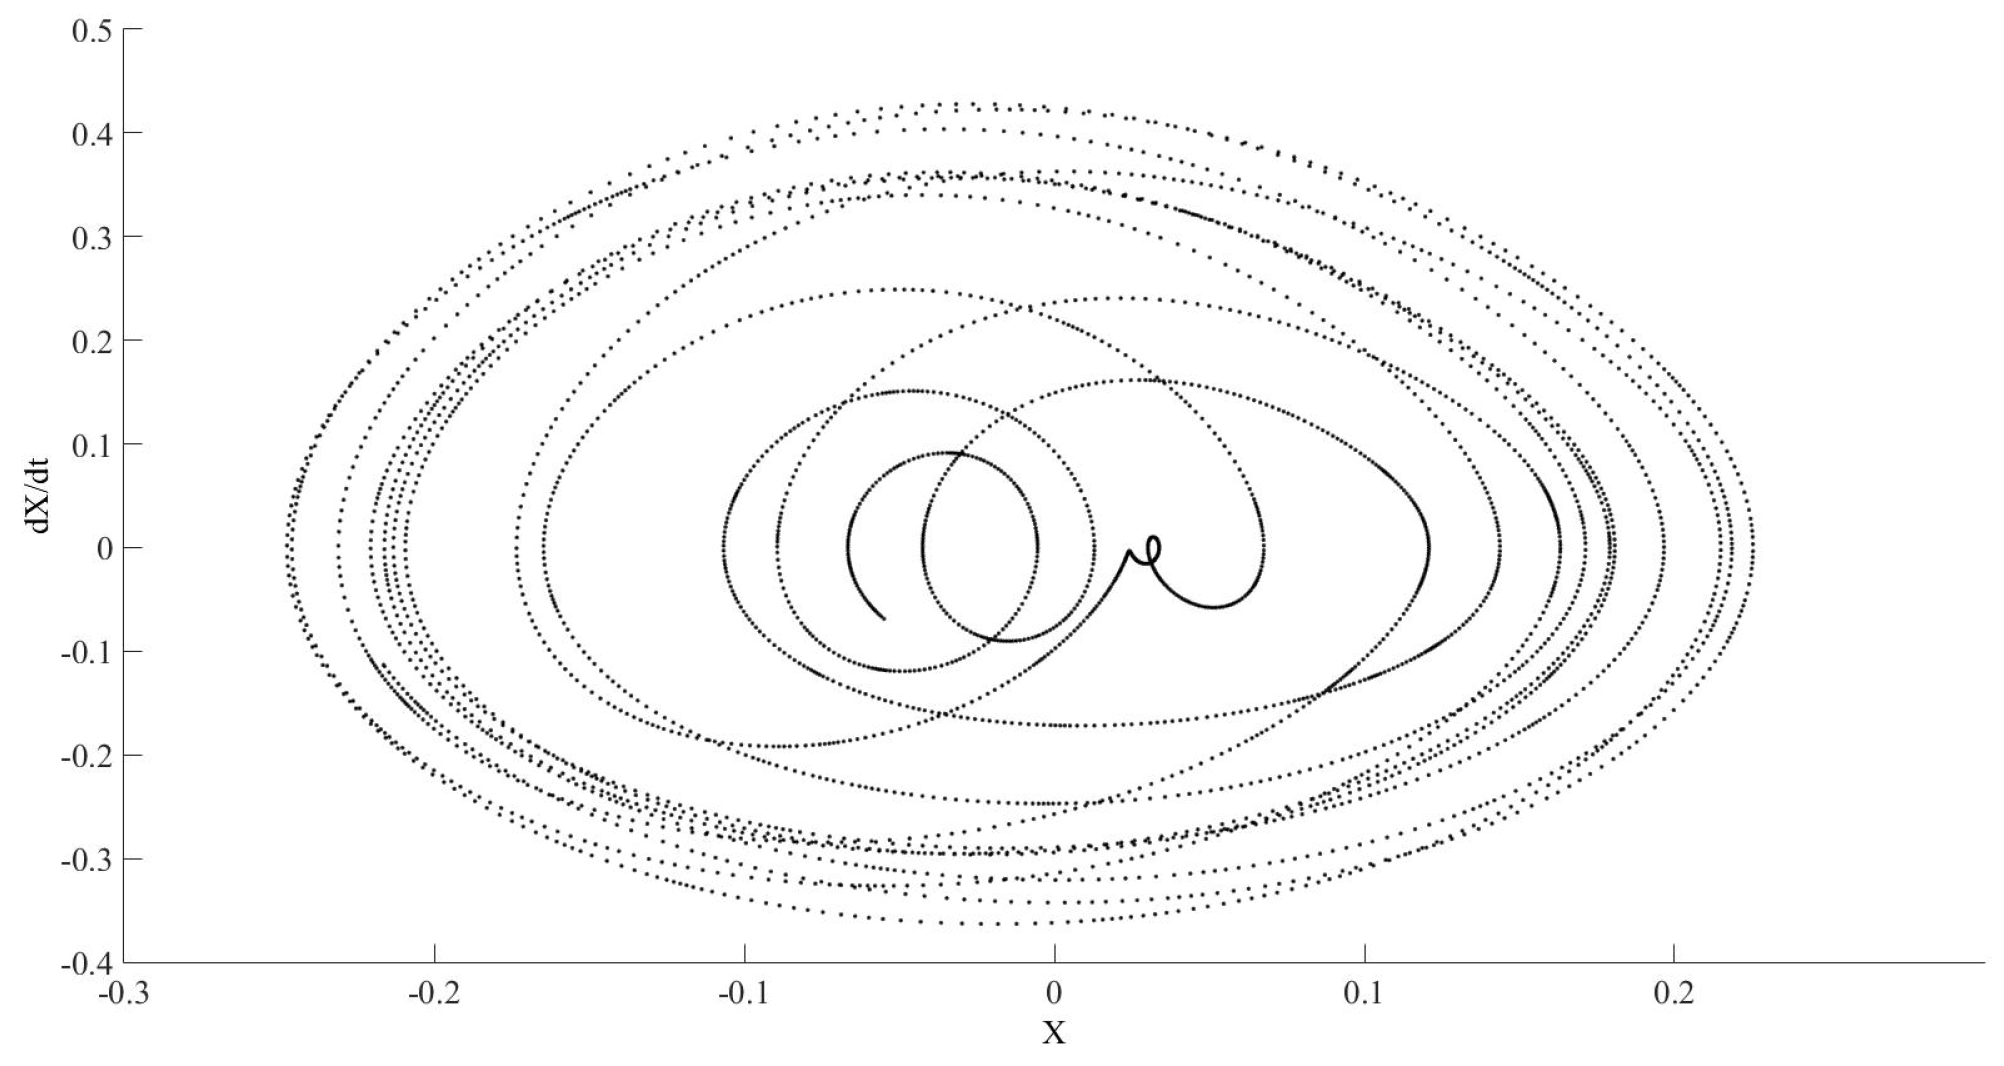
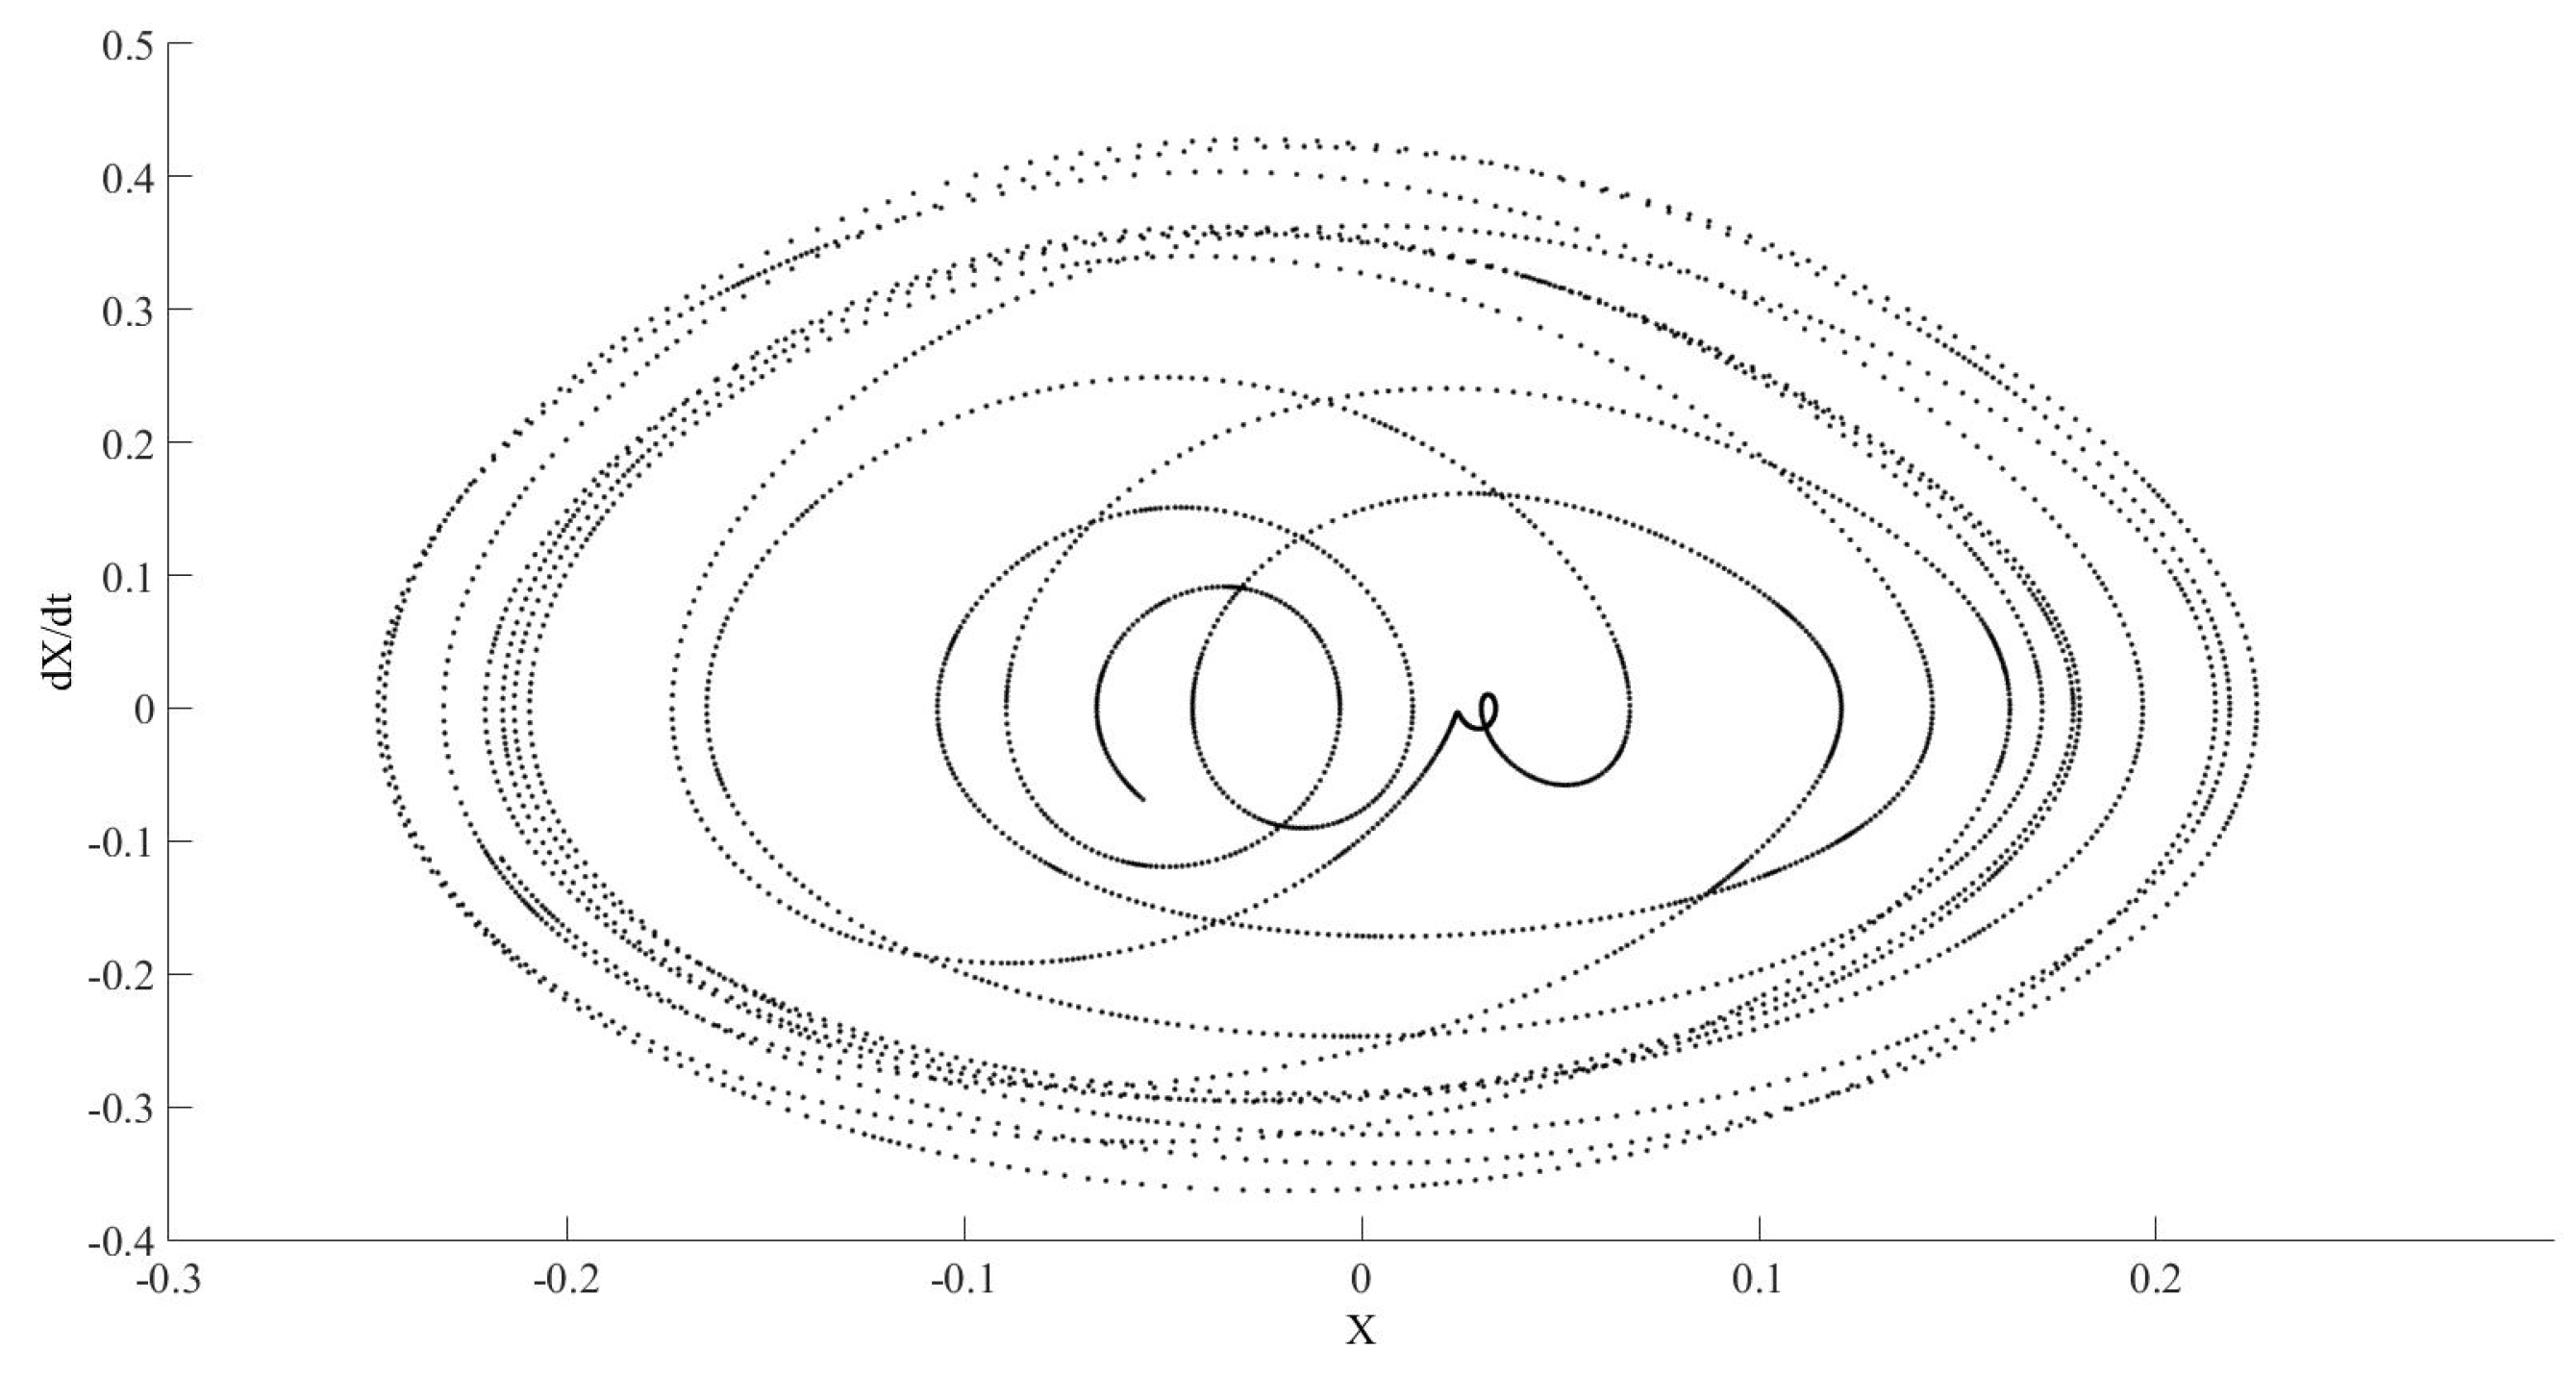
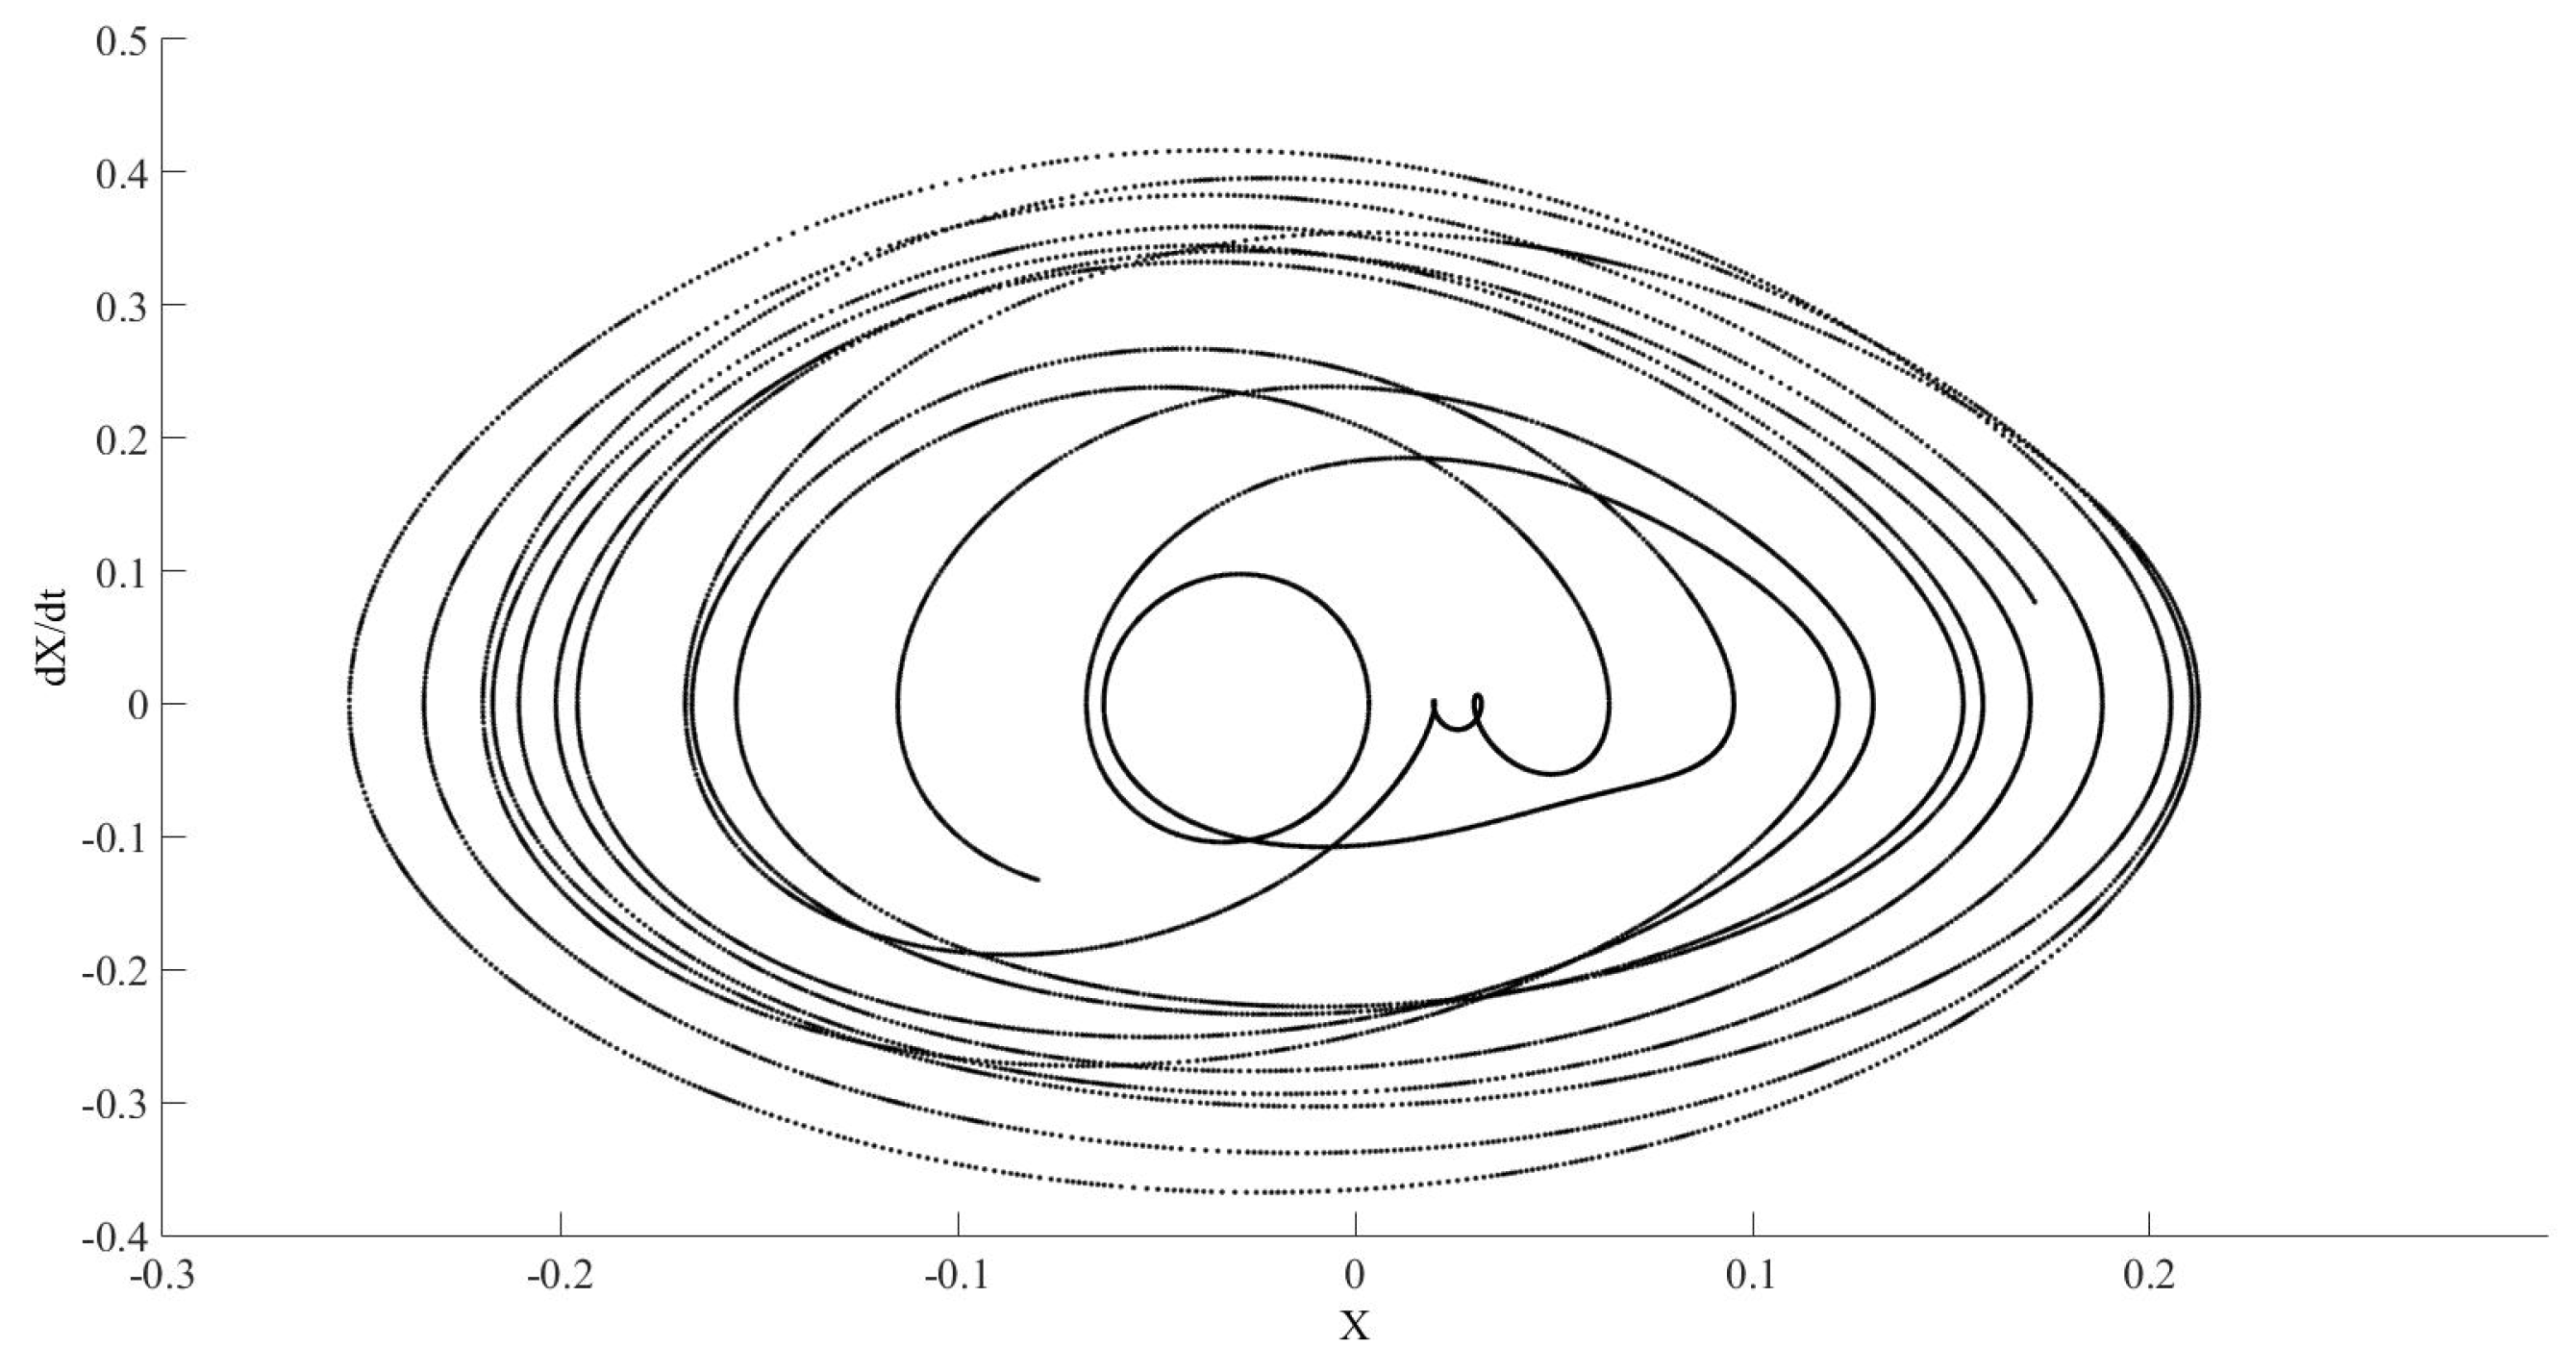
At this moment we seek to distinguish the transition between limit cycles and chaos by changing the value of k 2 to 1.4. Figure 19, Figure 20, Figure 21, Figure 22, Figure 23 and Figure 24 show the effect of the convergence tolerance.
Figure 25, Figure 26 and Figure 27 show the system evolution during different time ranges.
It is very difficult for the hardware available to obtain the Lyapunov exponent for this equations system during at least 300 s. We try to study the phenomenon with a reduced model with 21 equations. In this case, the variable c is 13/21. Figure 28 and Figure 29 show the effect of κ 2 .
Figure 29 and Figure 30 represent the effect of the tolerance. Thus, Figure 29, with a lower tolerance than Figure 30, is the most accurate. The phase diagram shows that the system has no determined trajectory.
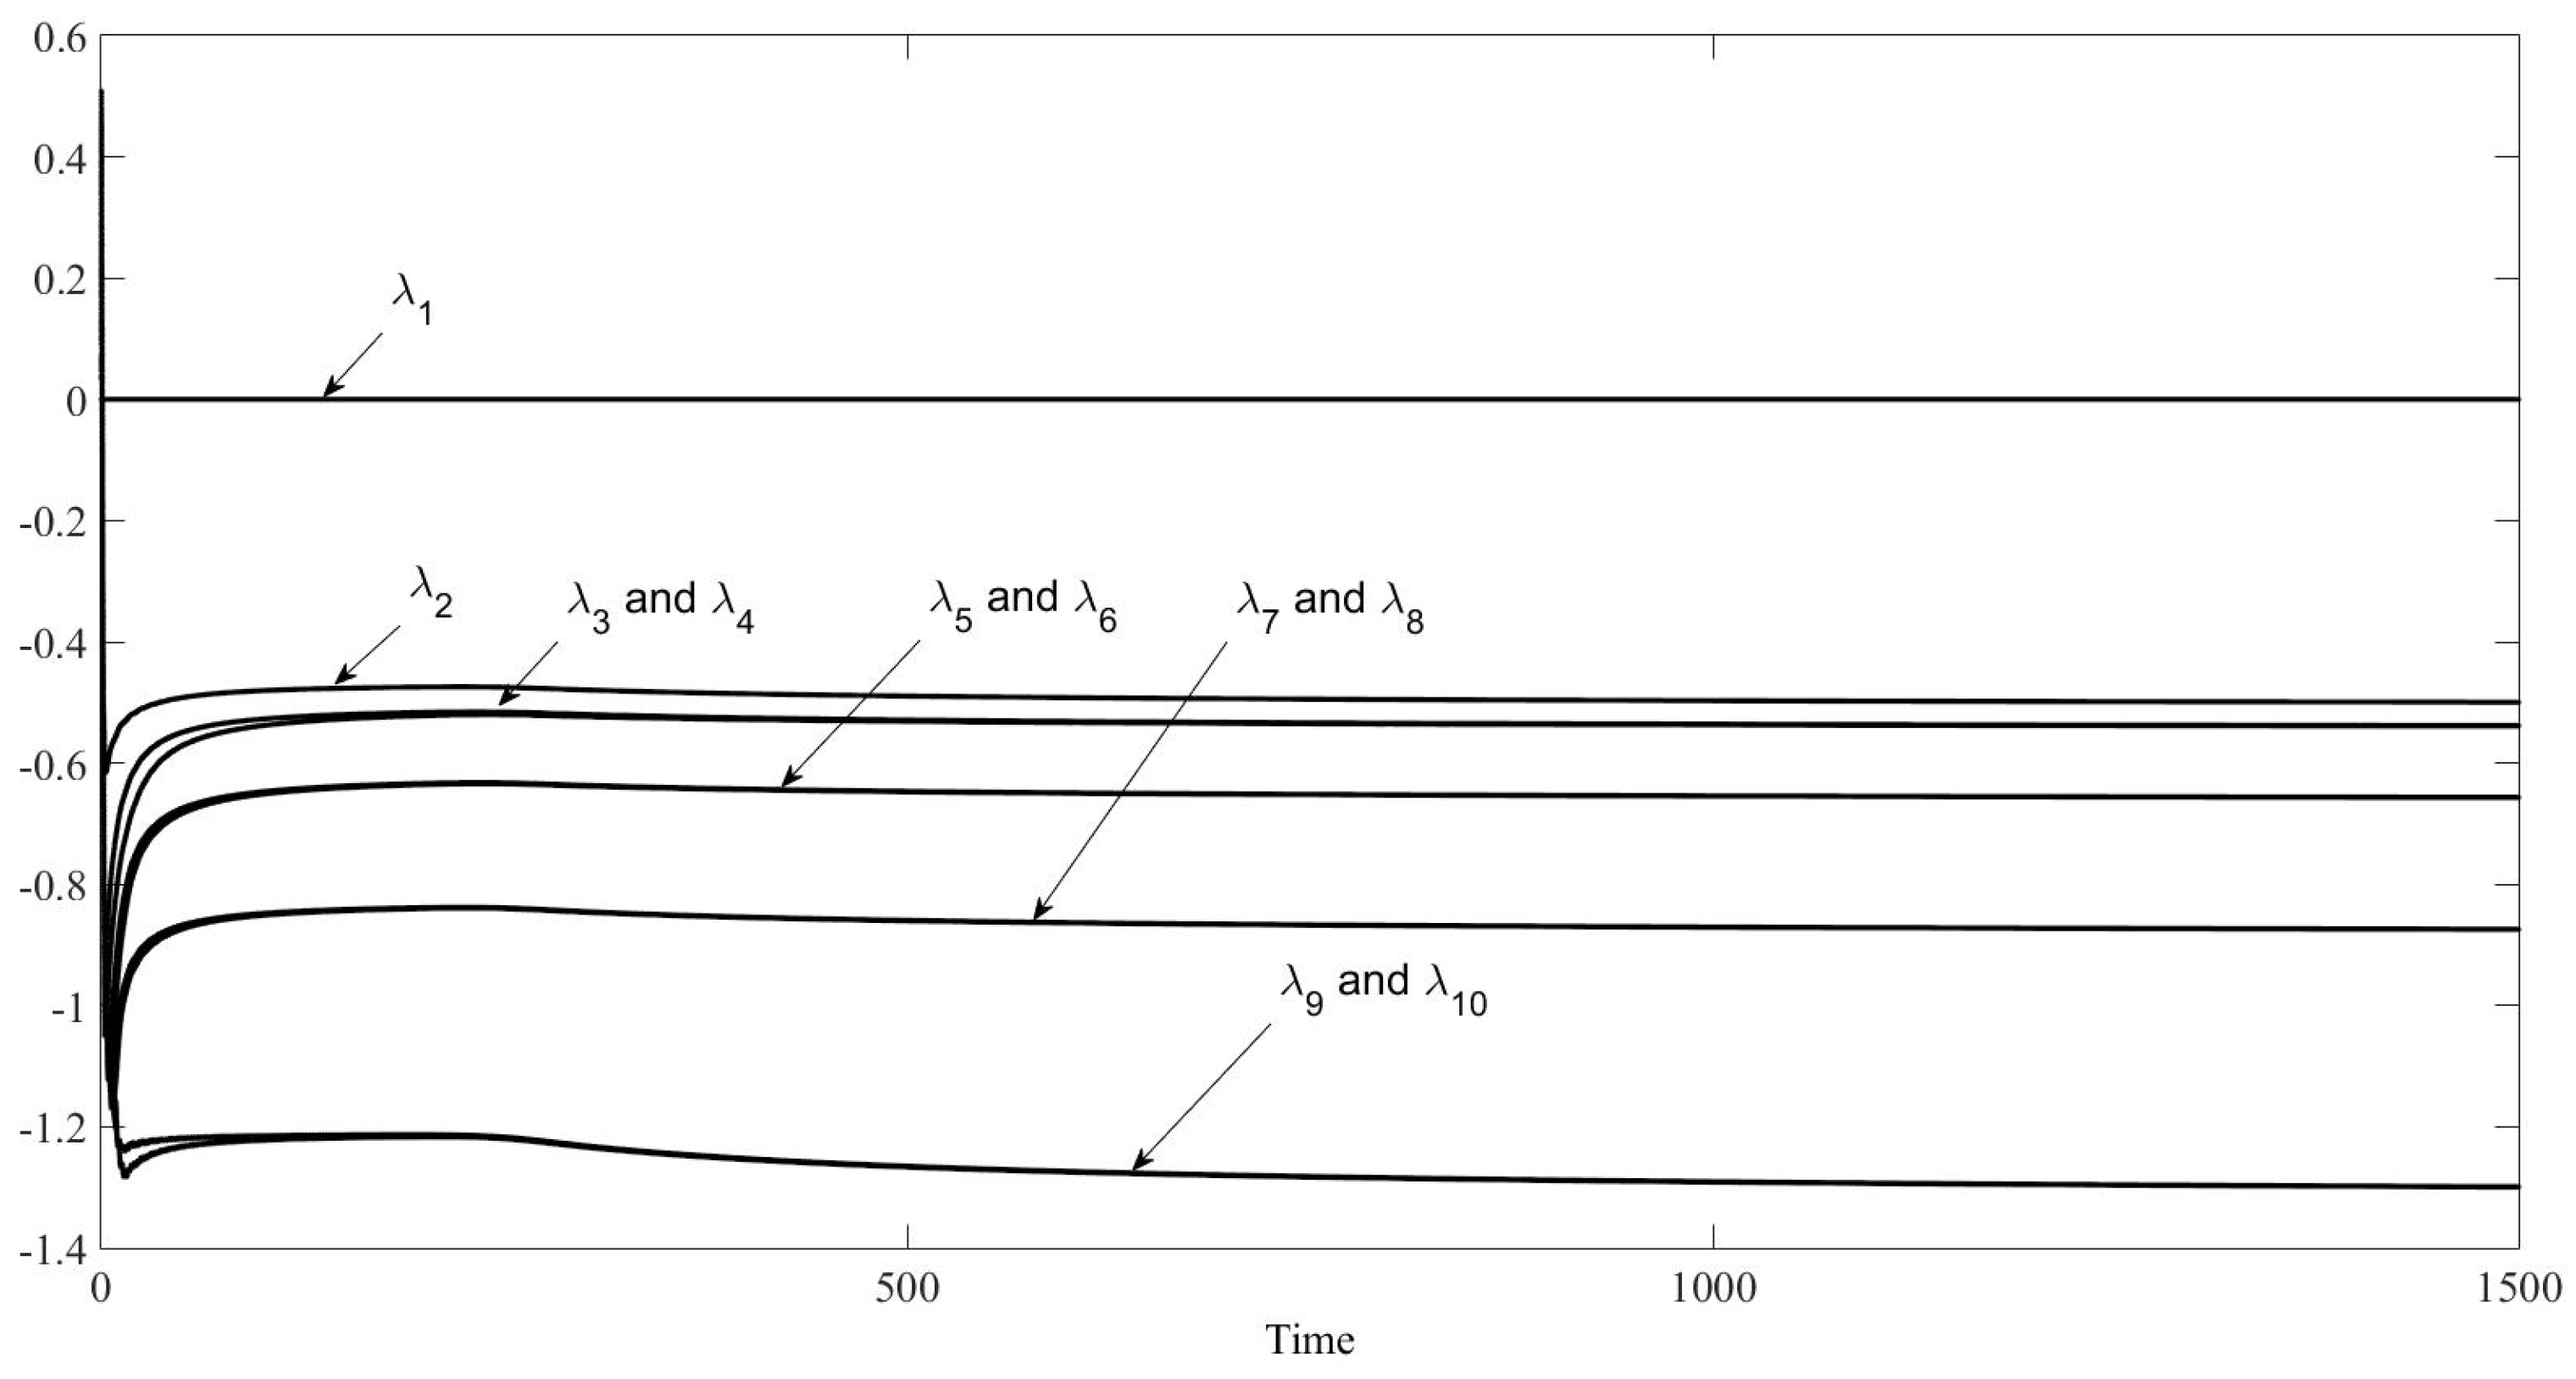
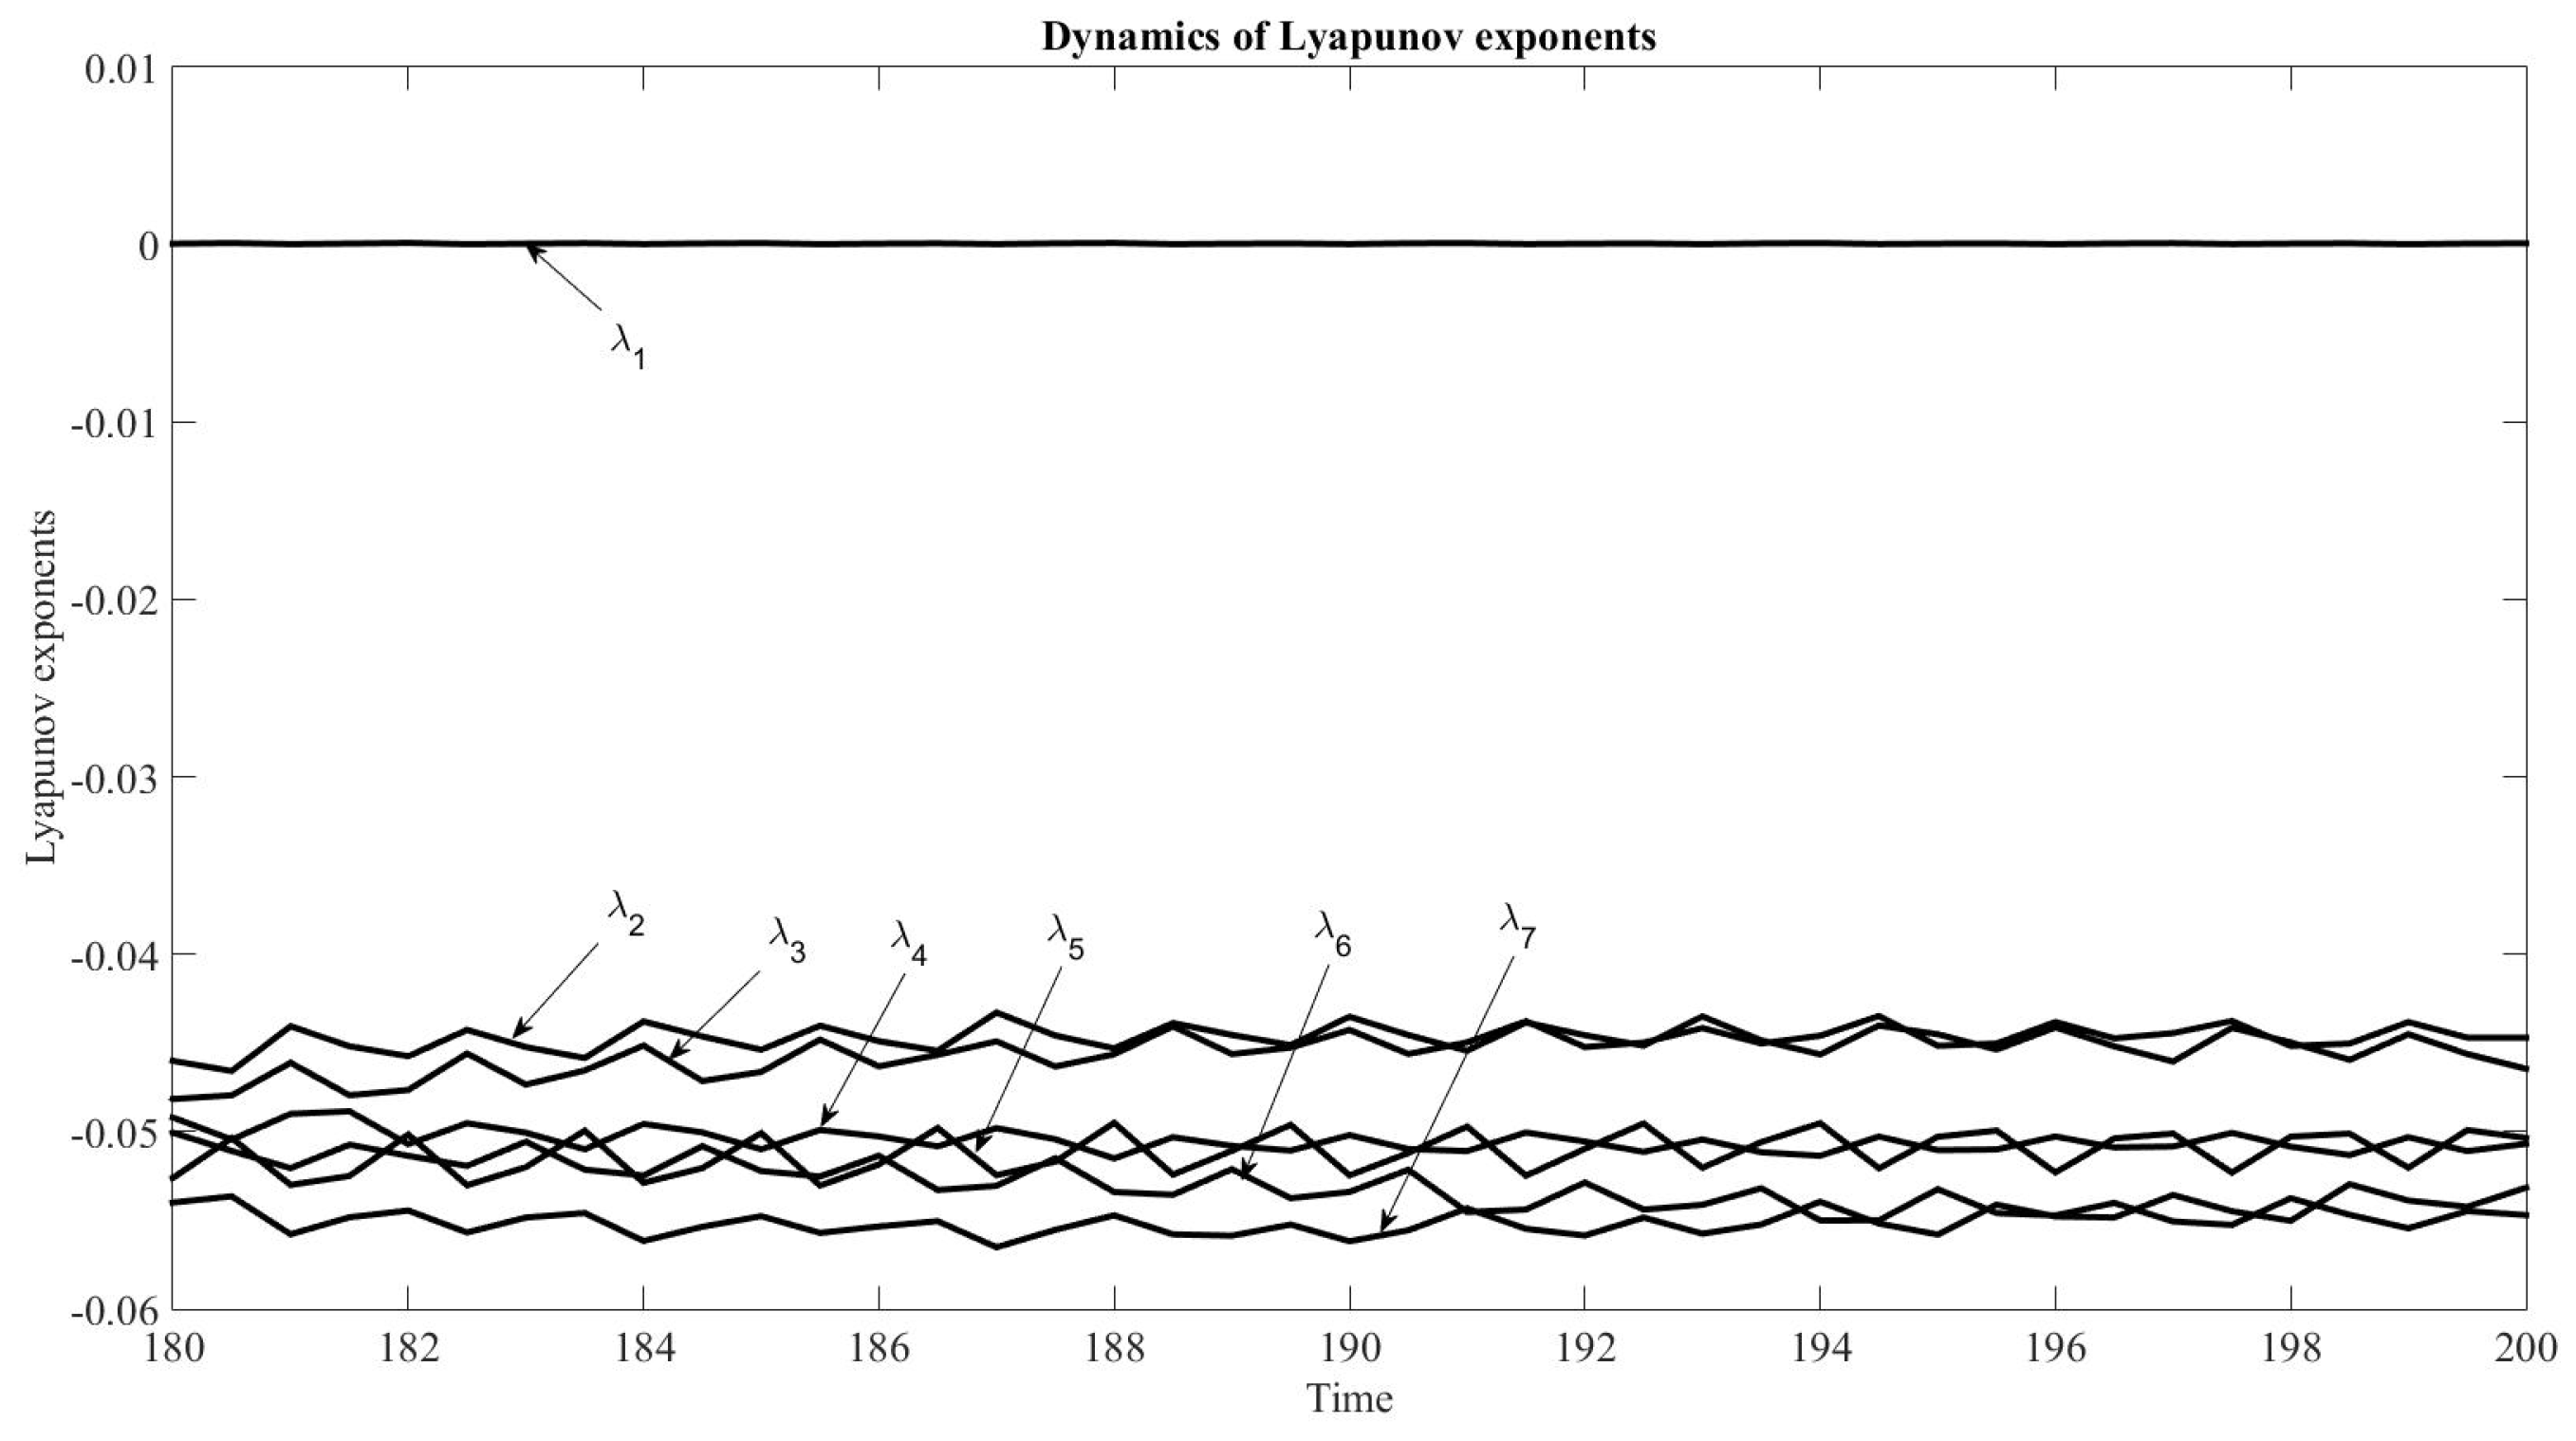
It is possible to calculate the Lyapunov exponent for this equations system, Figure 31. There is no positive exponent; however, the system is chaotic.
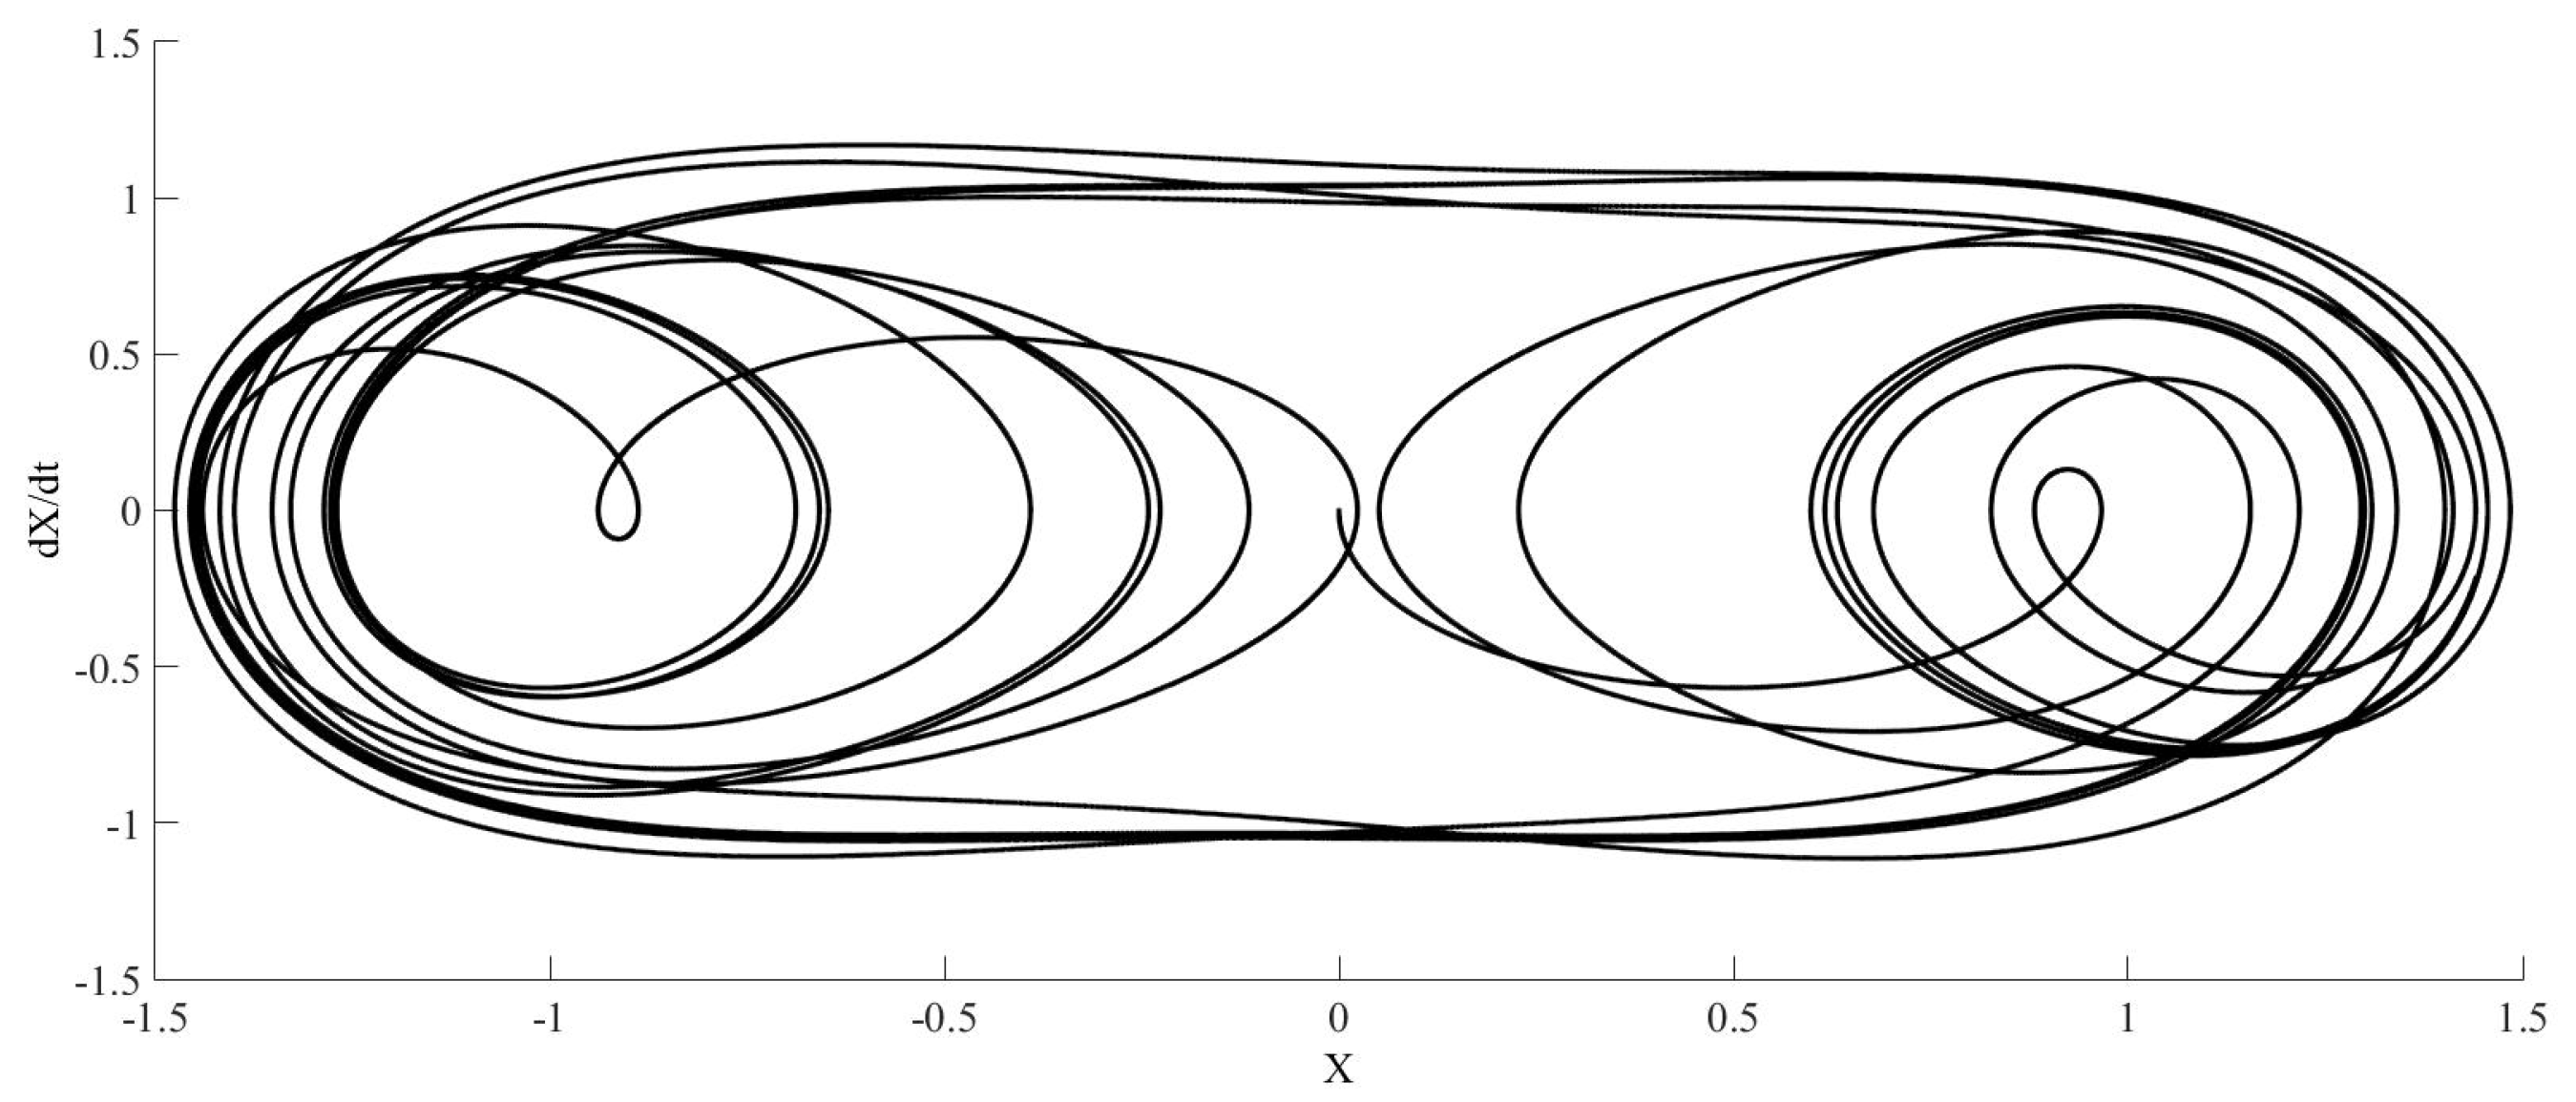
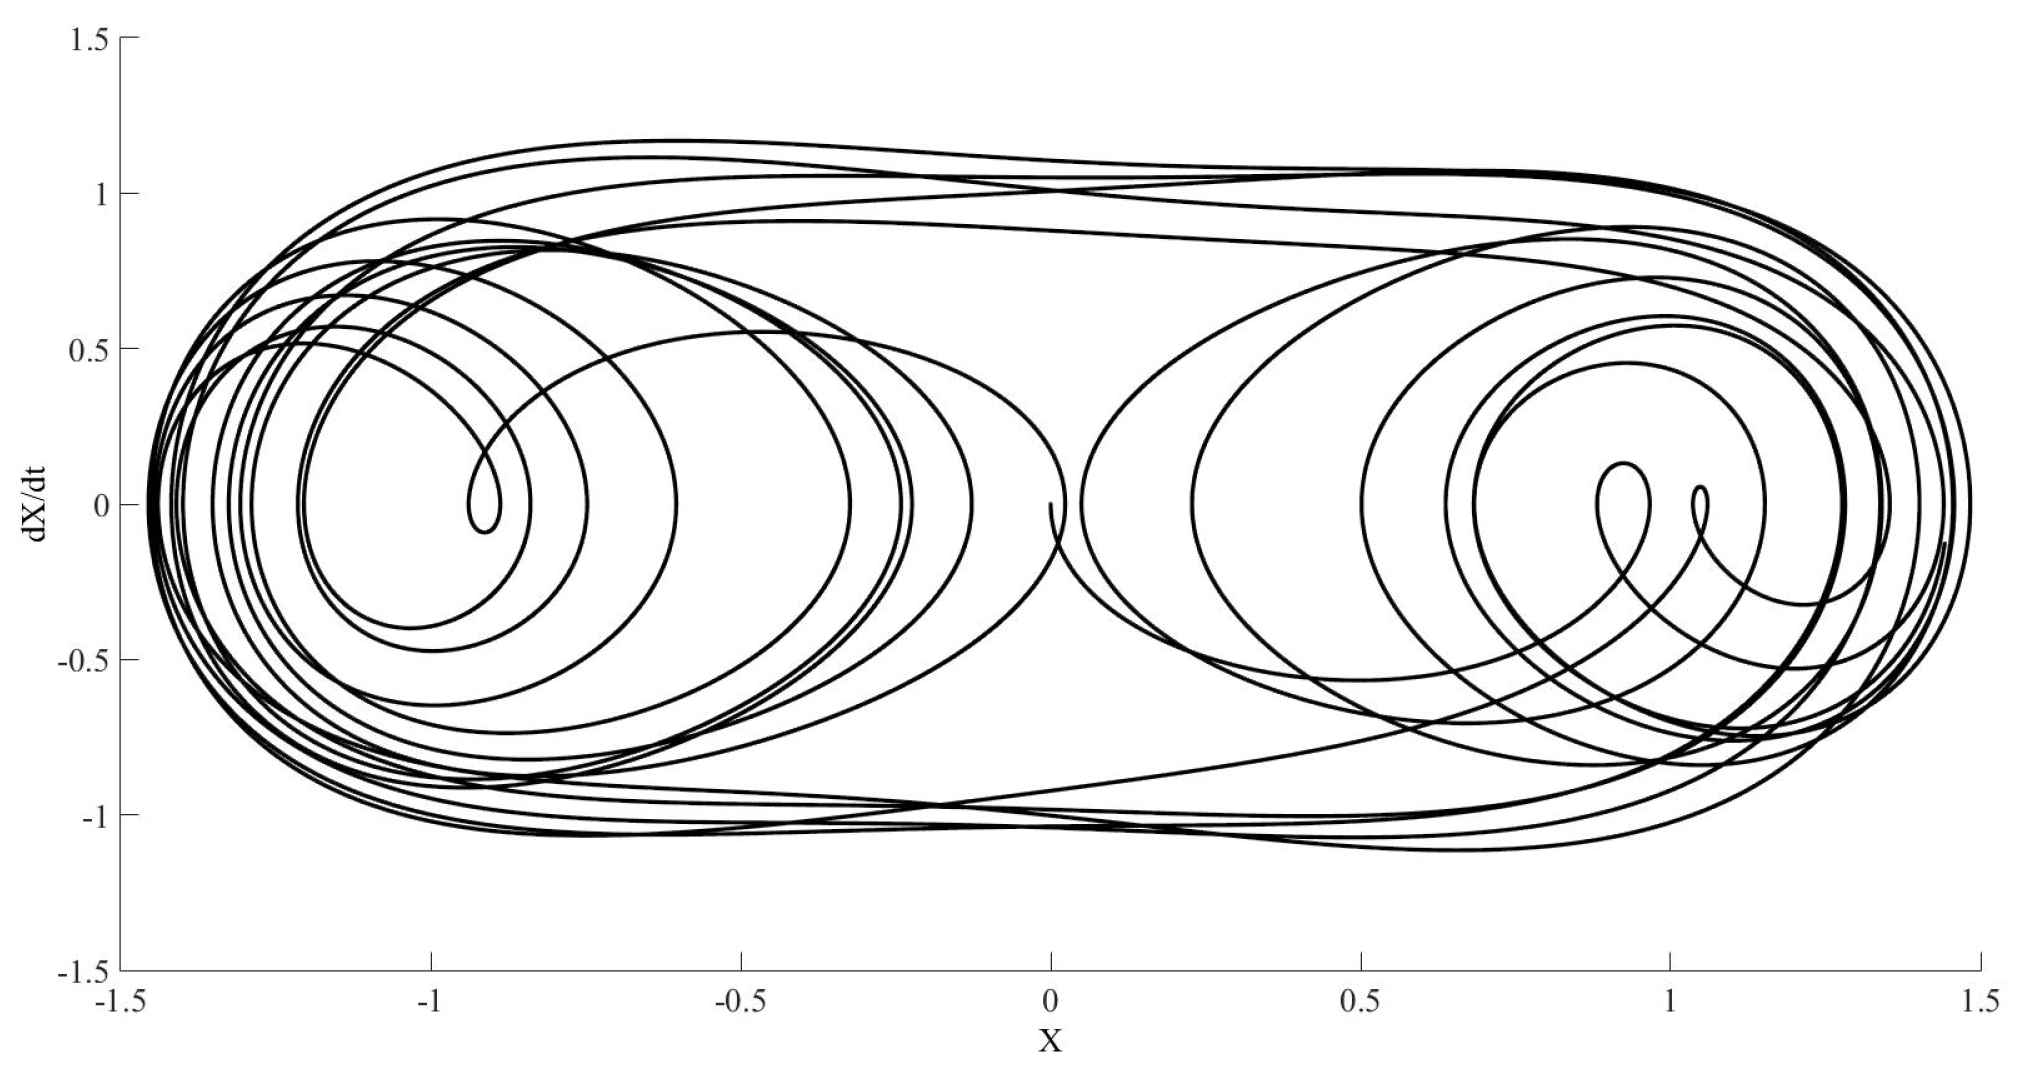
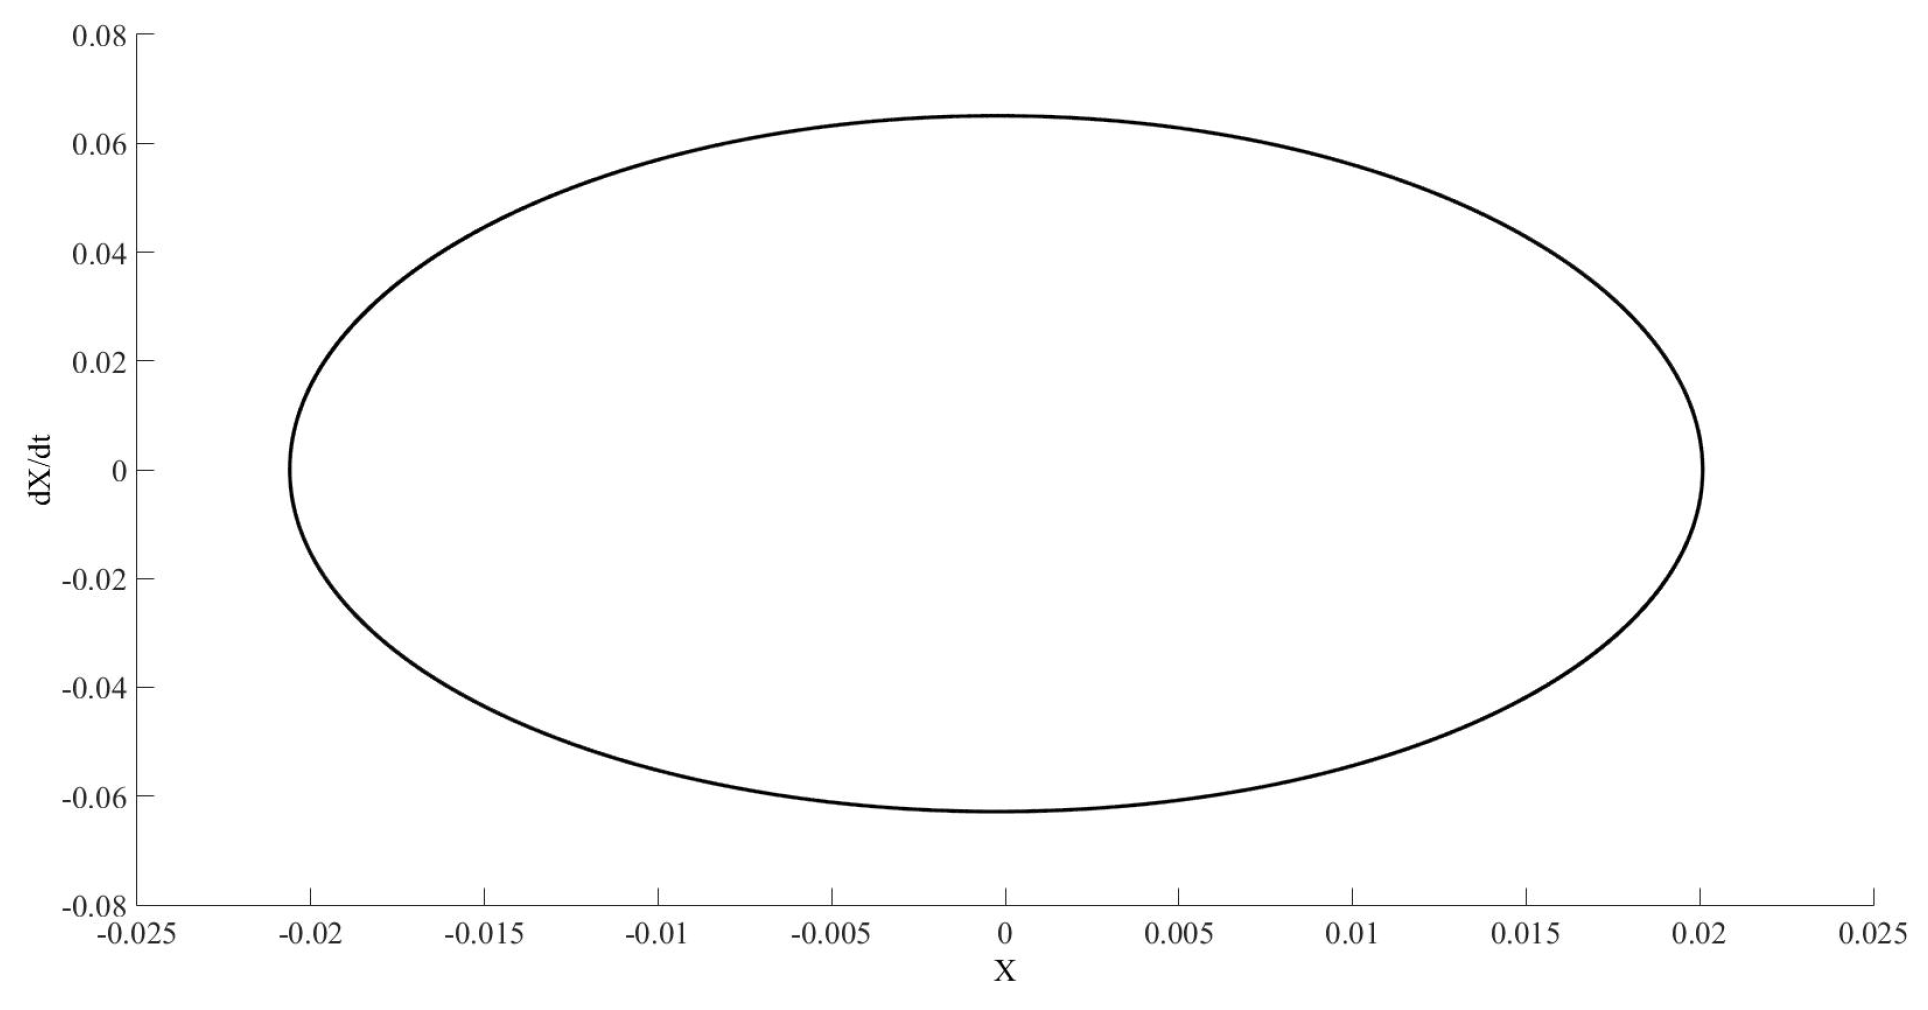
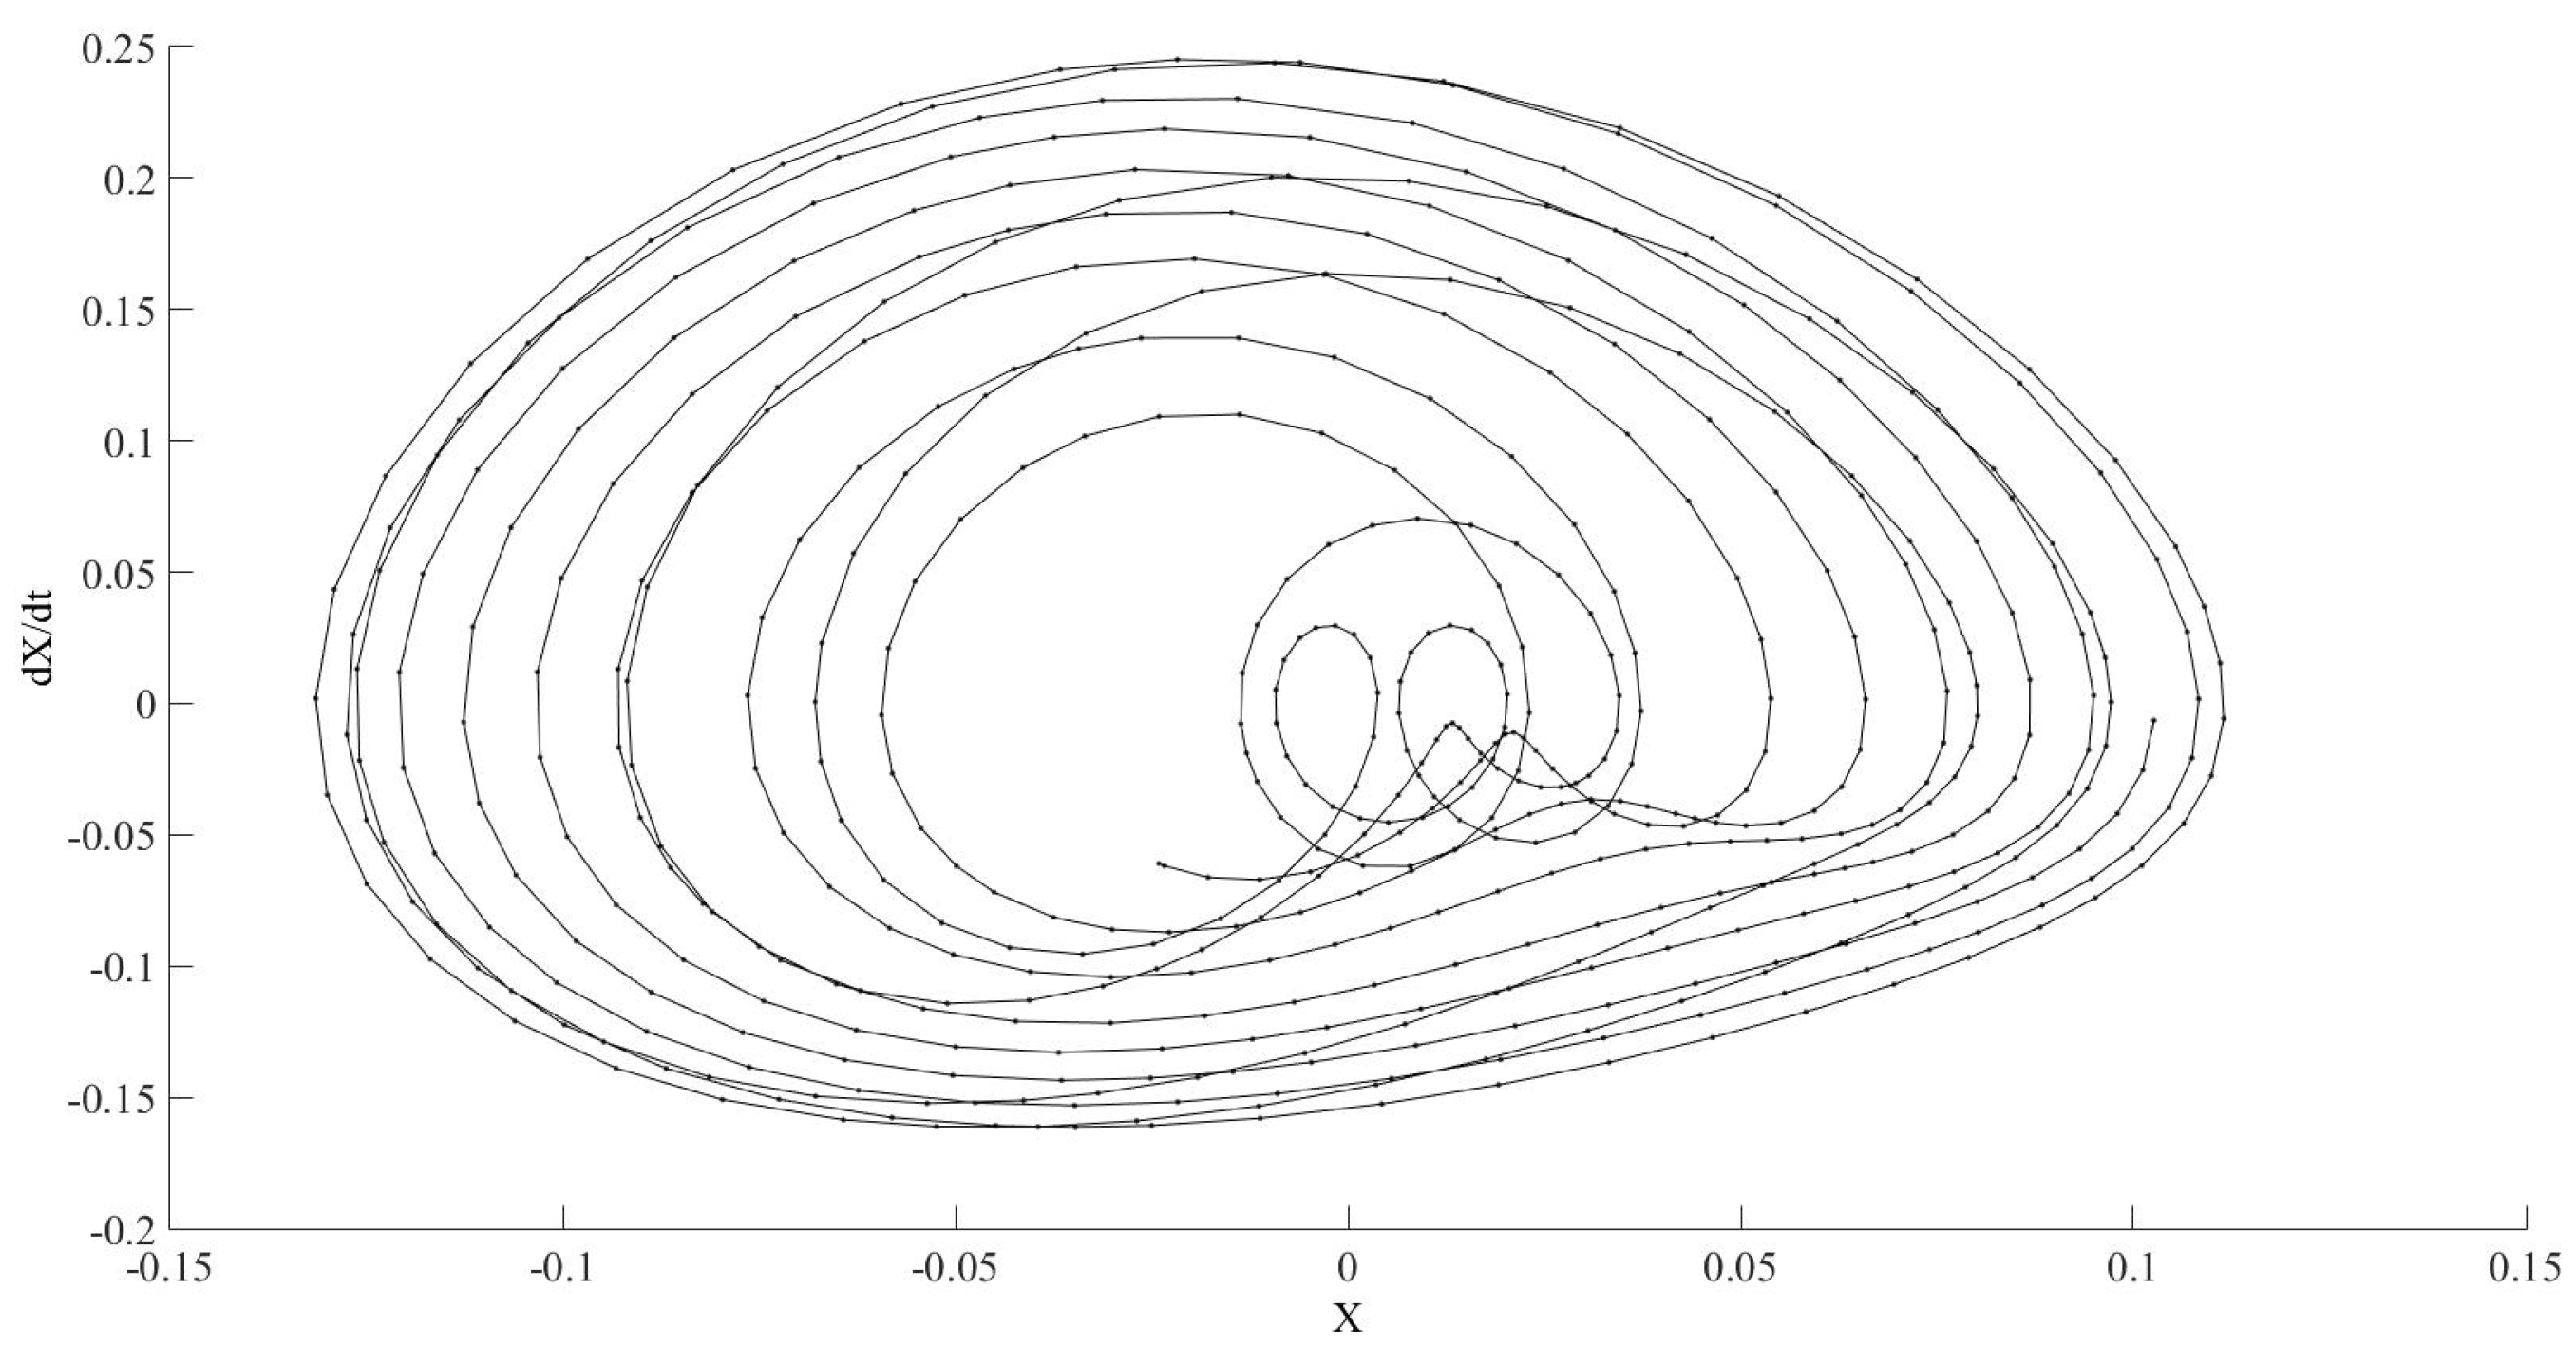
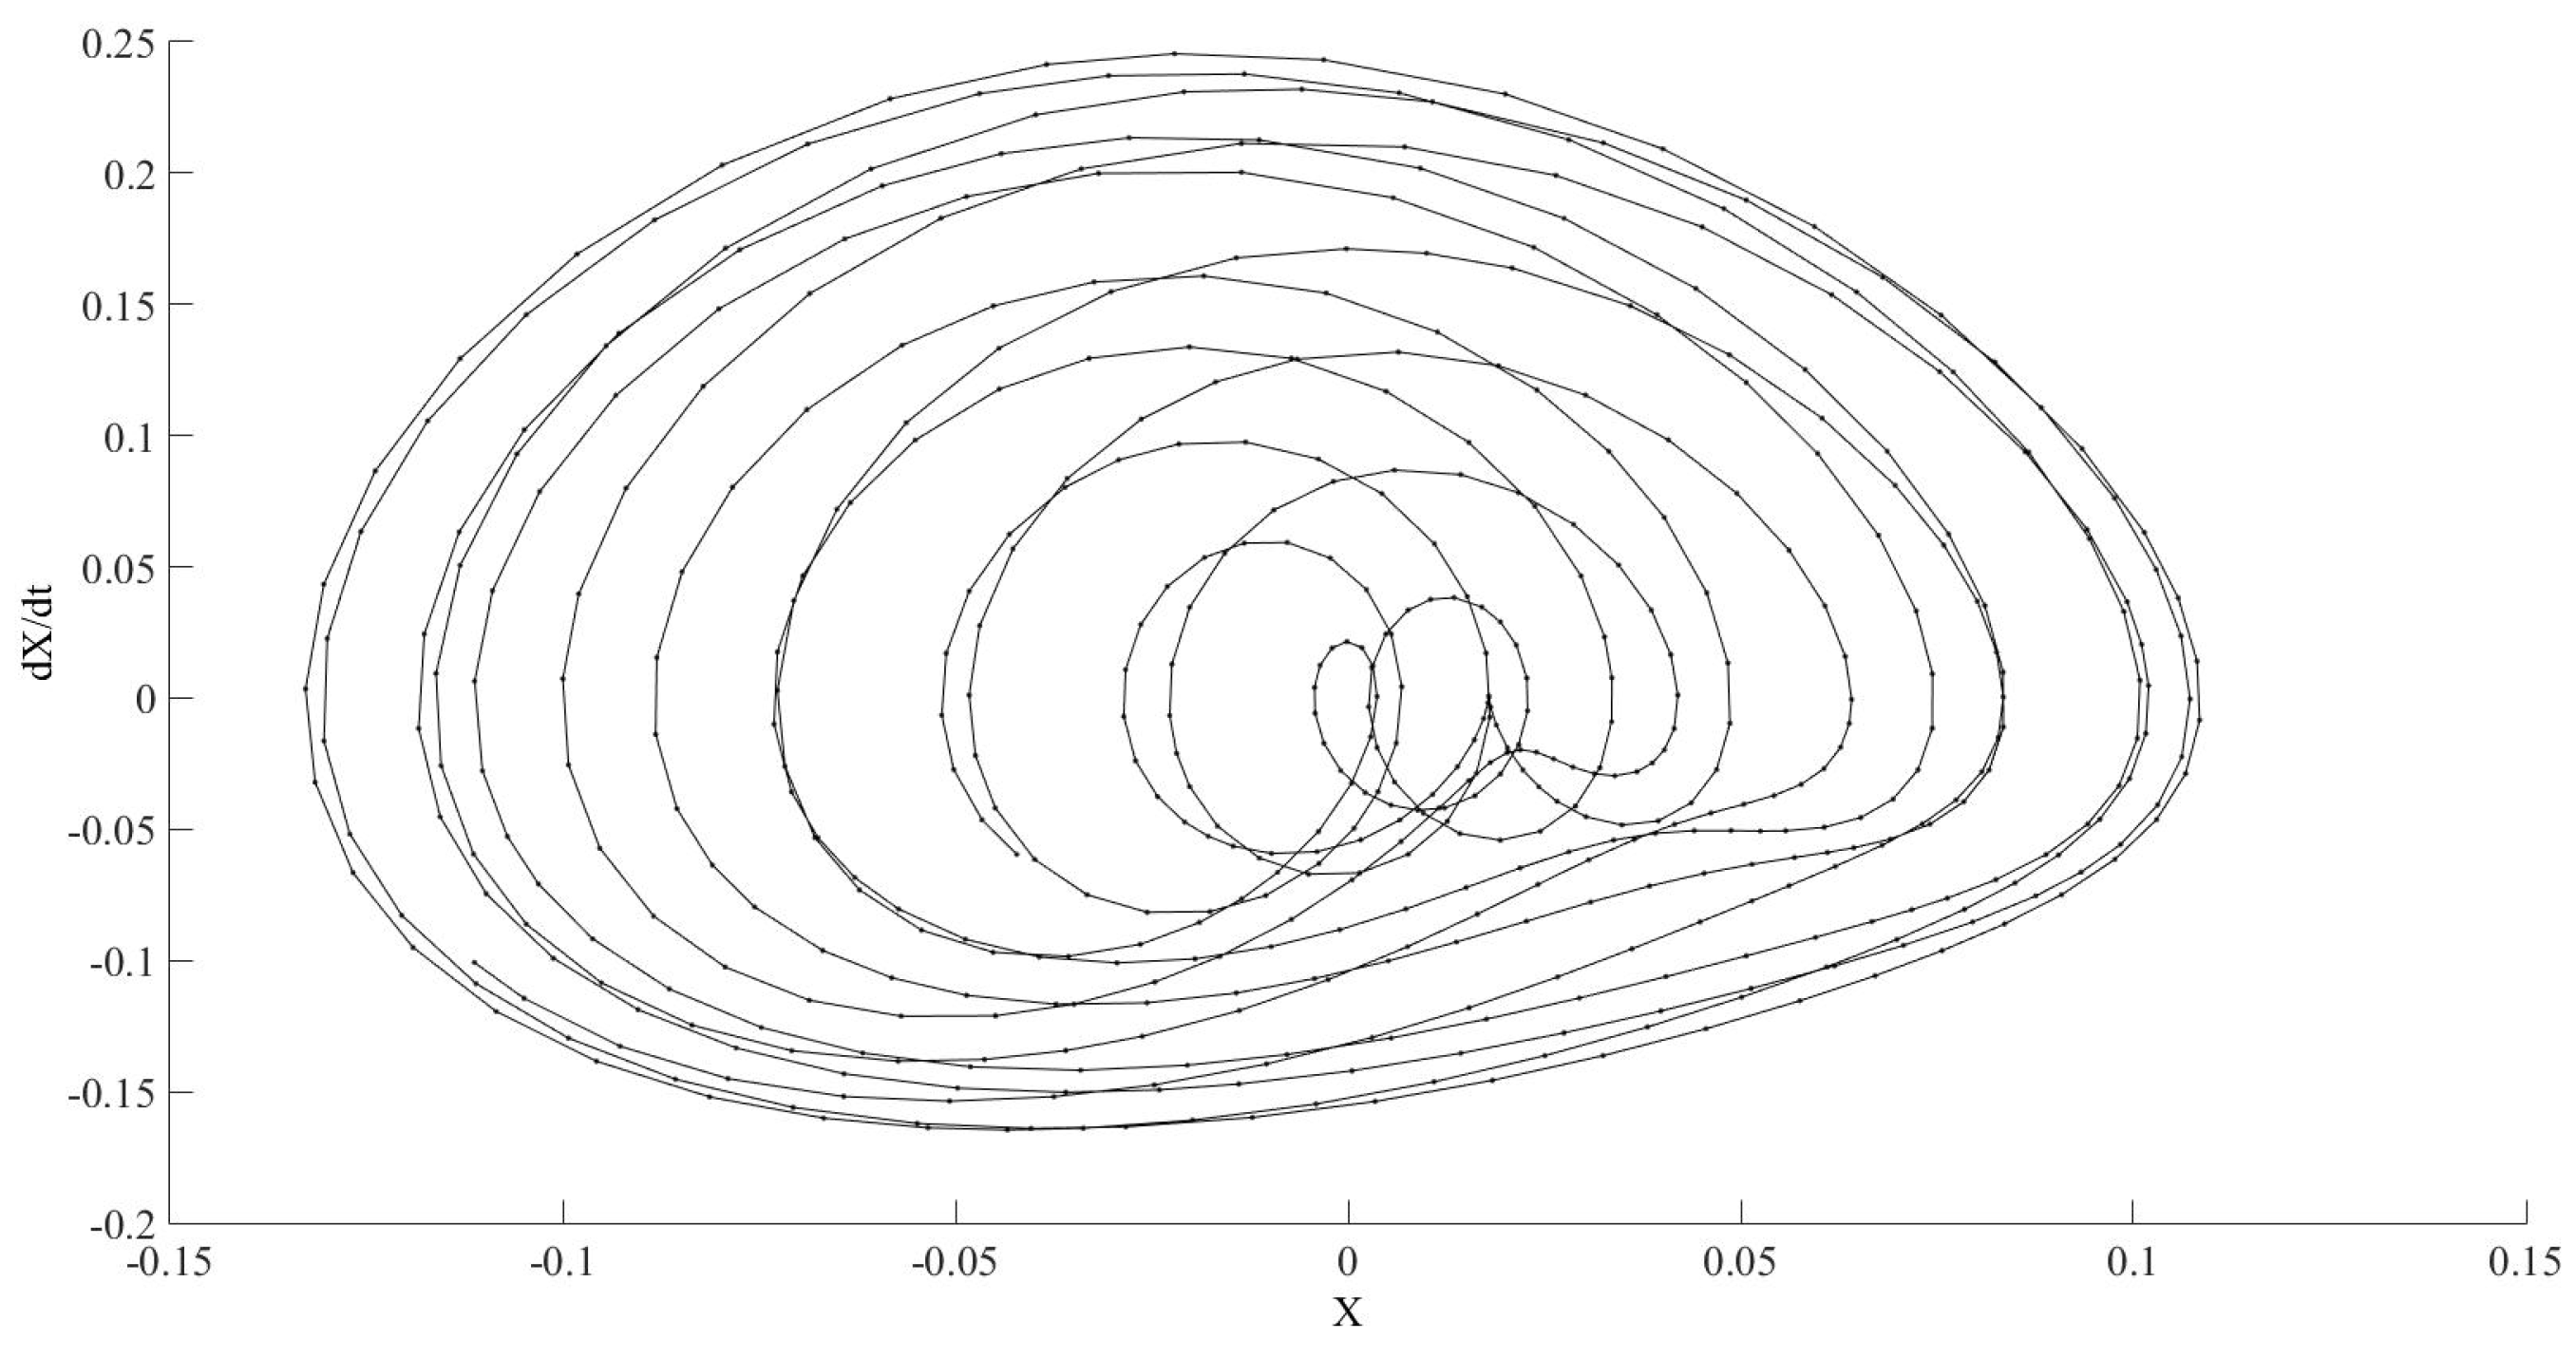
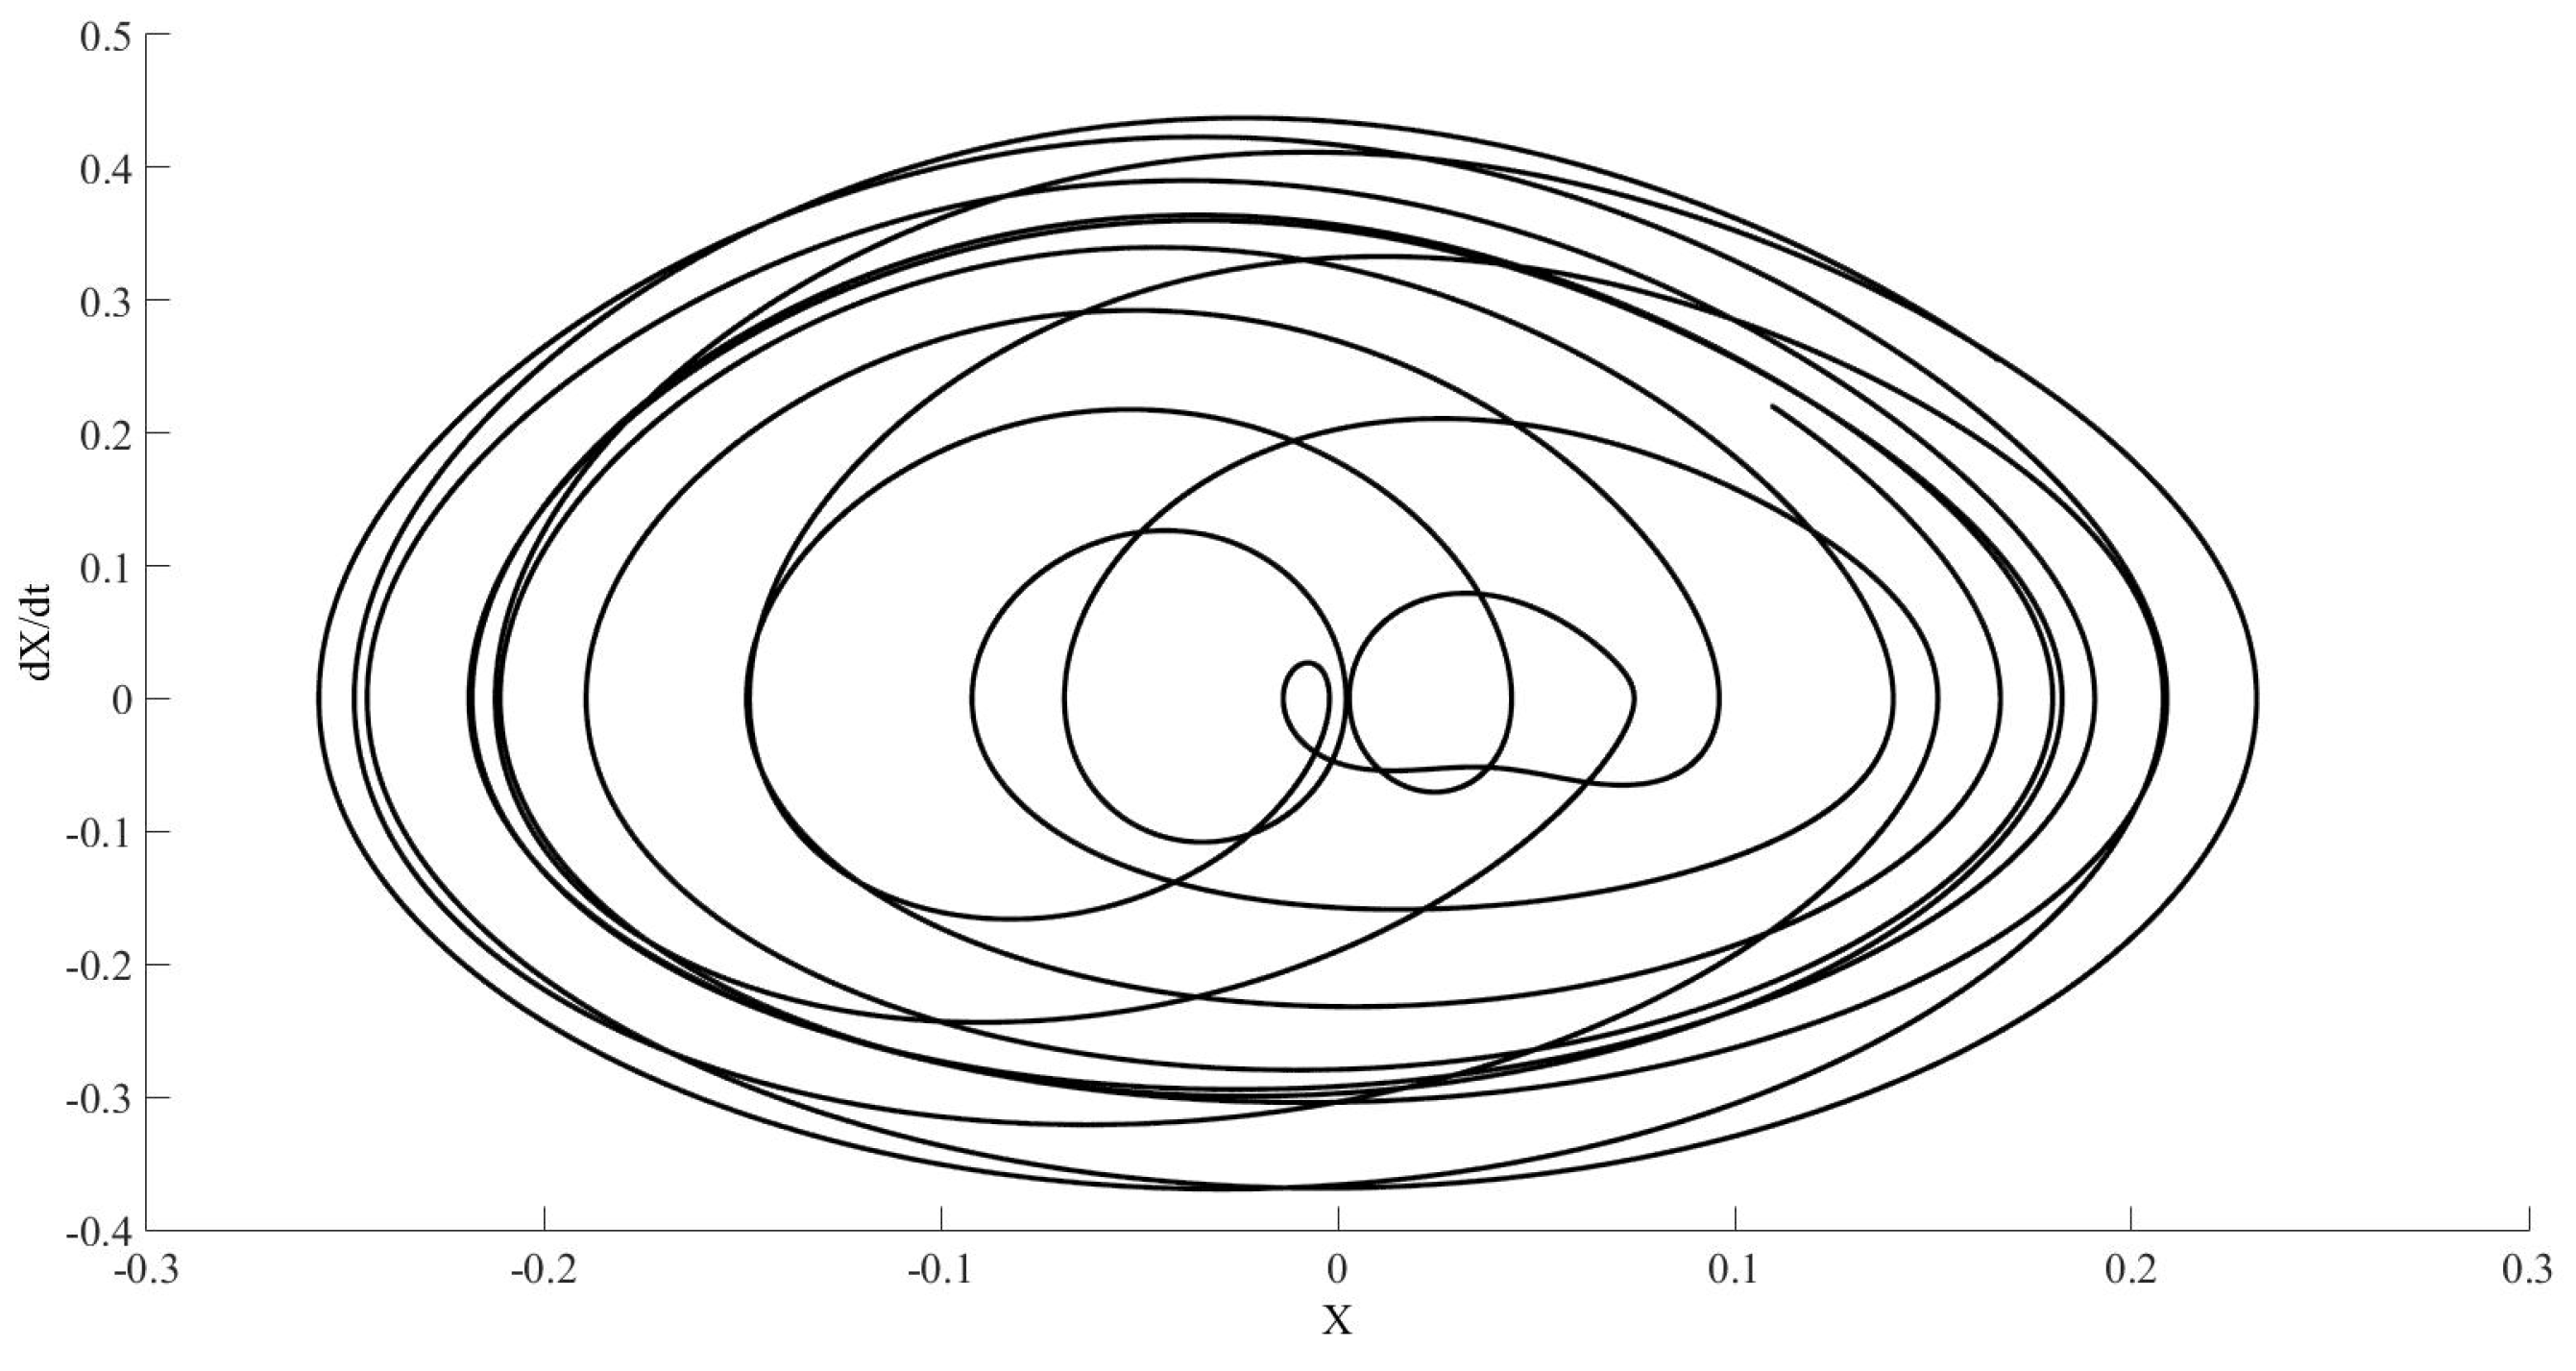
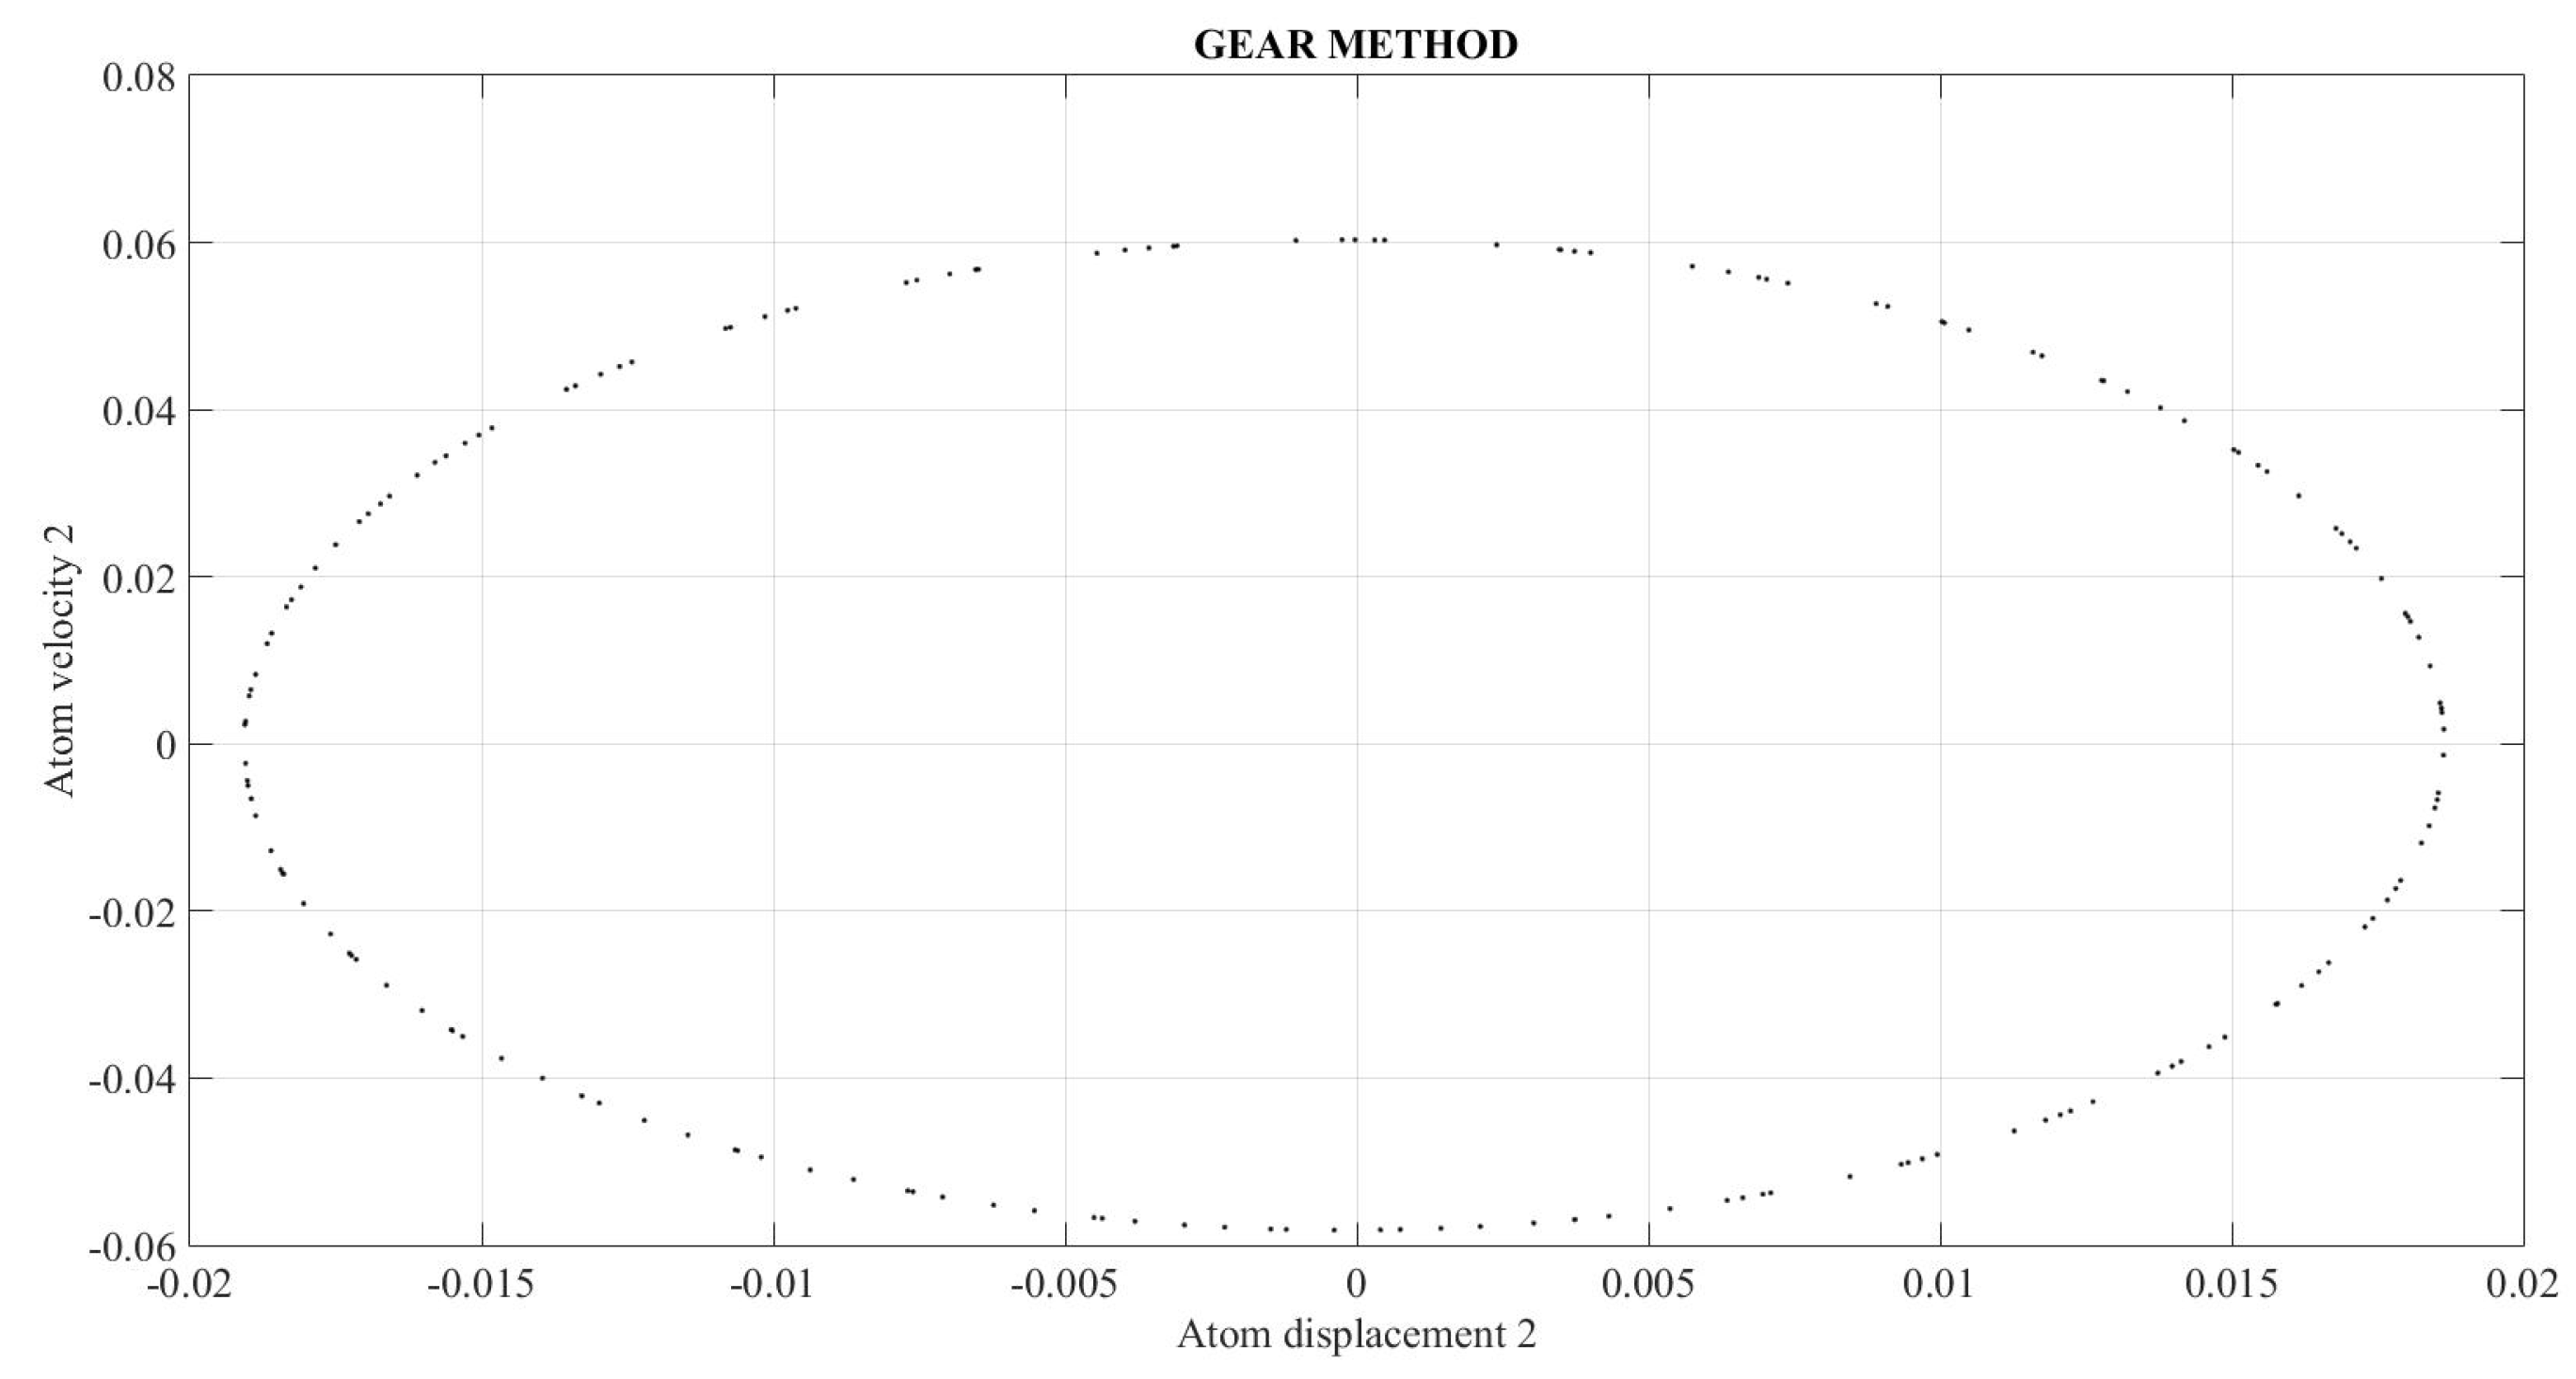
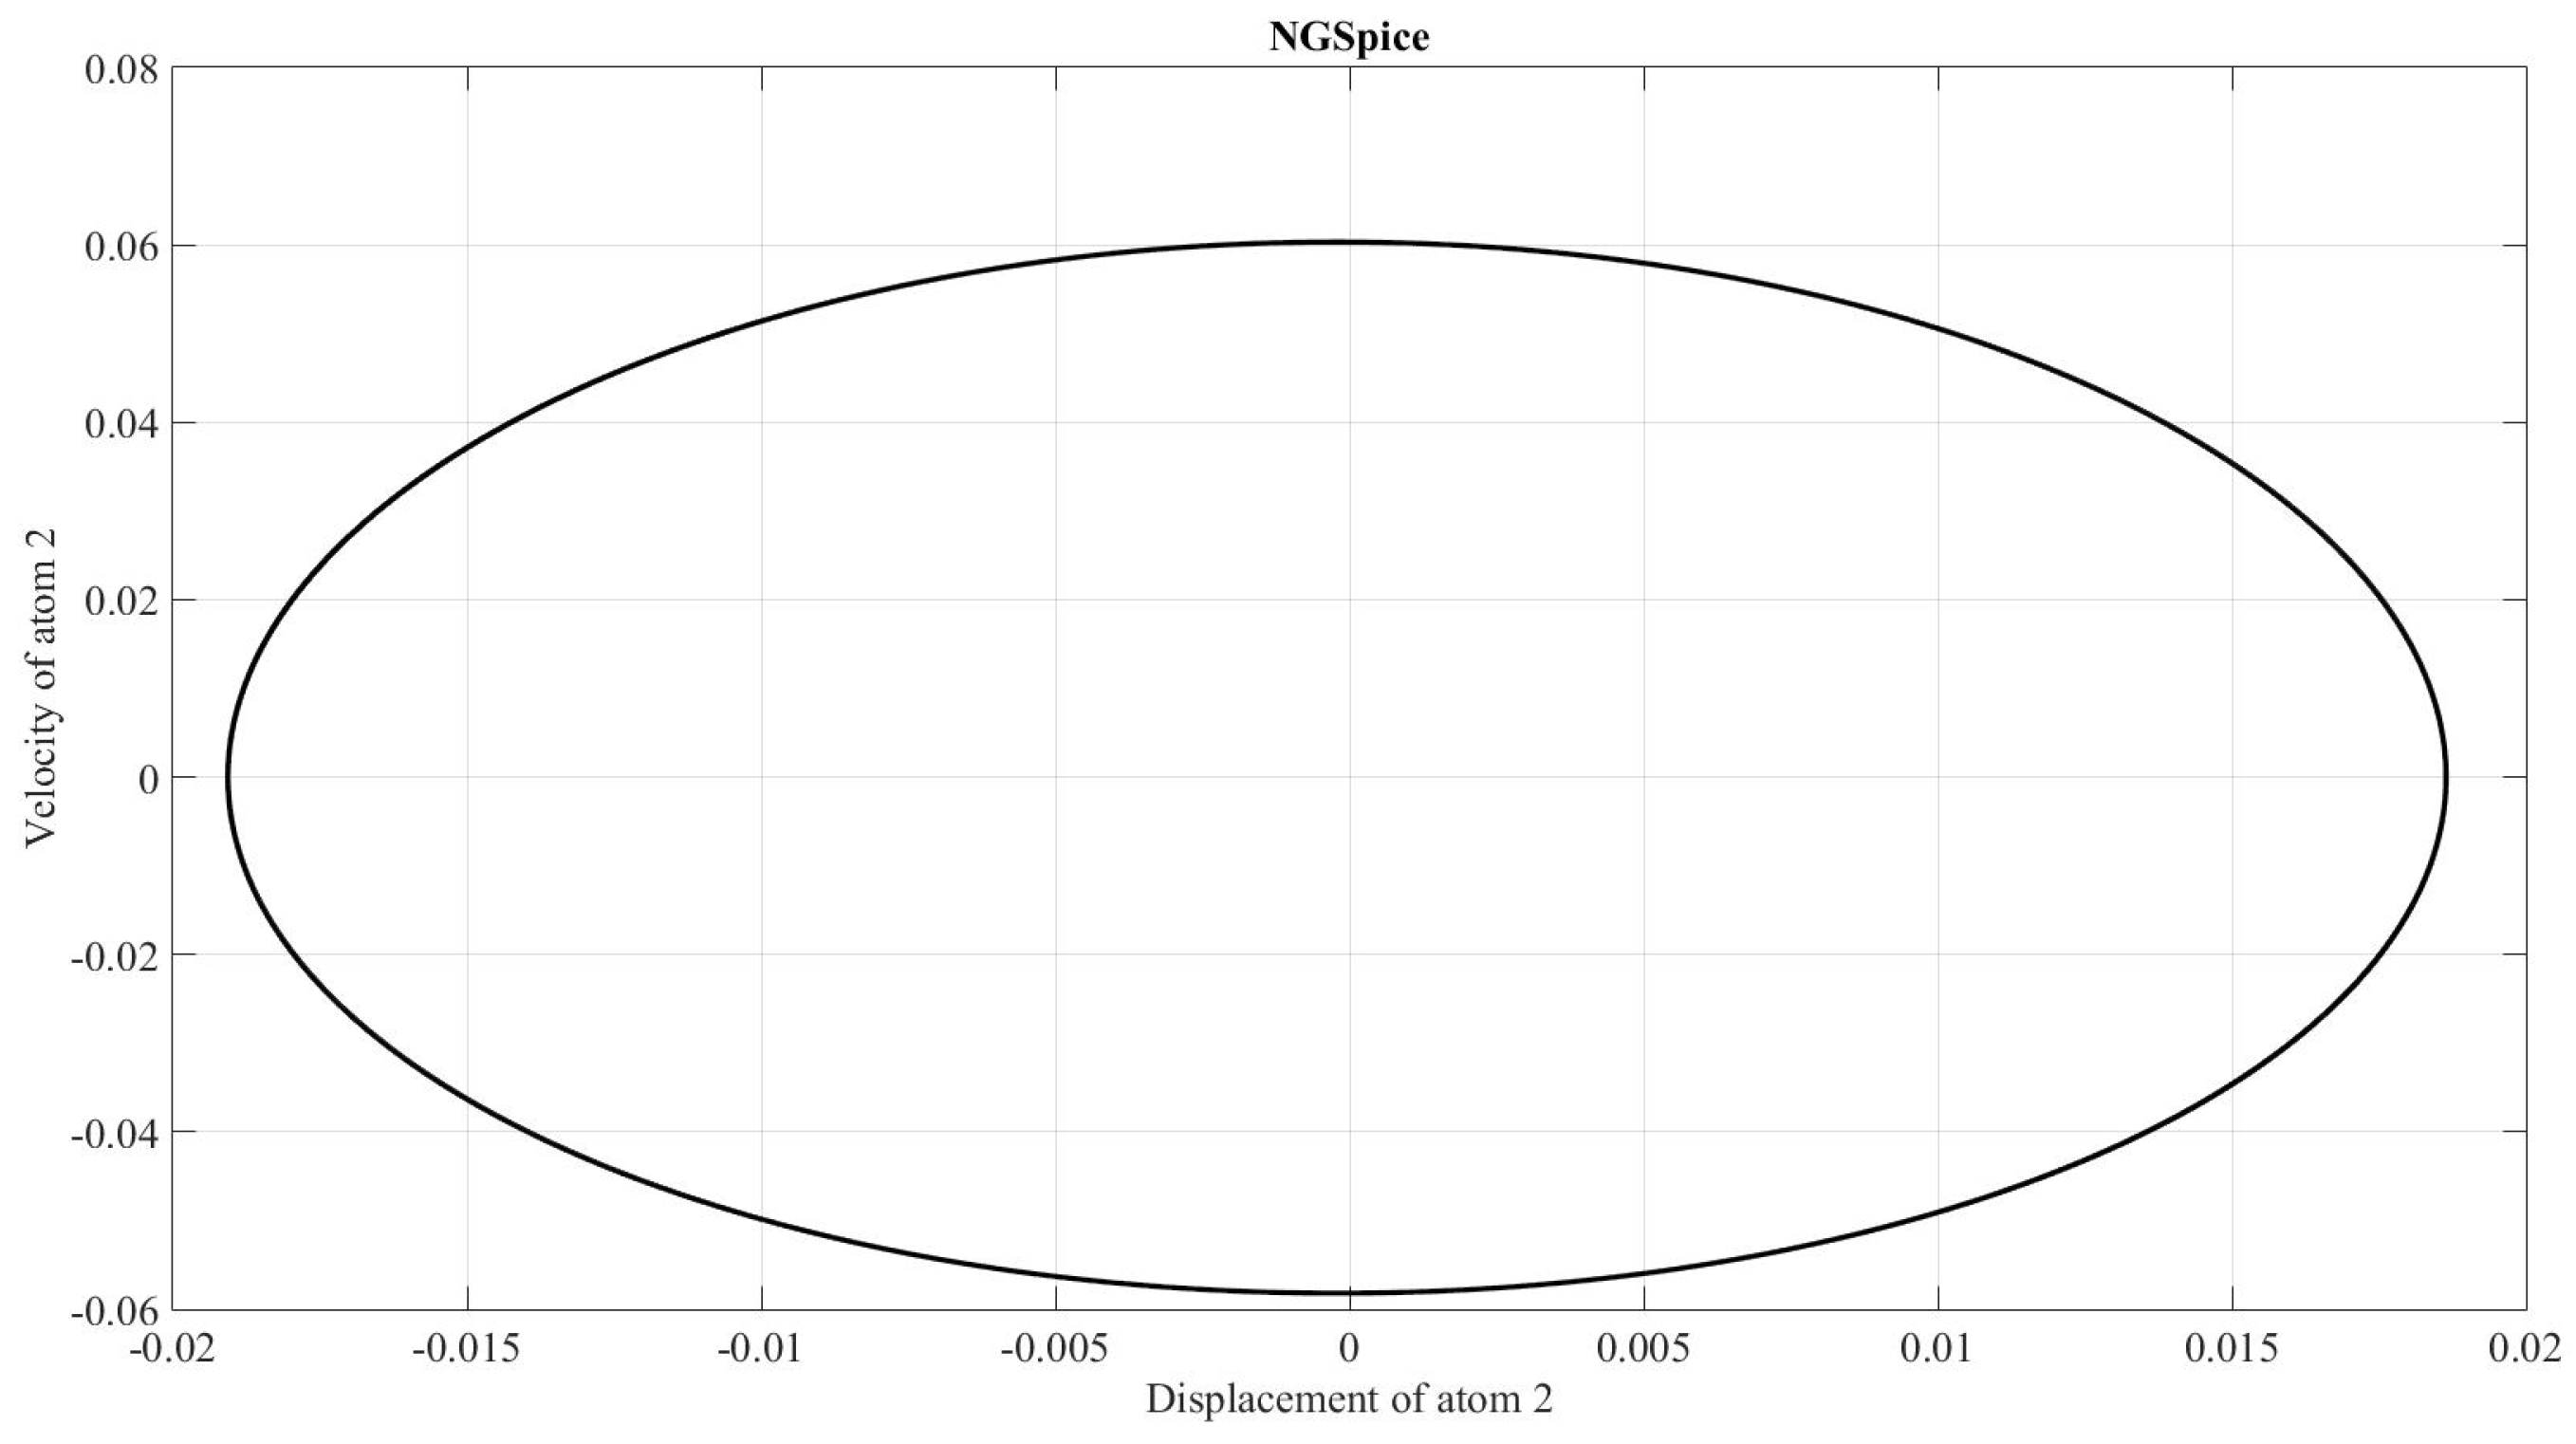
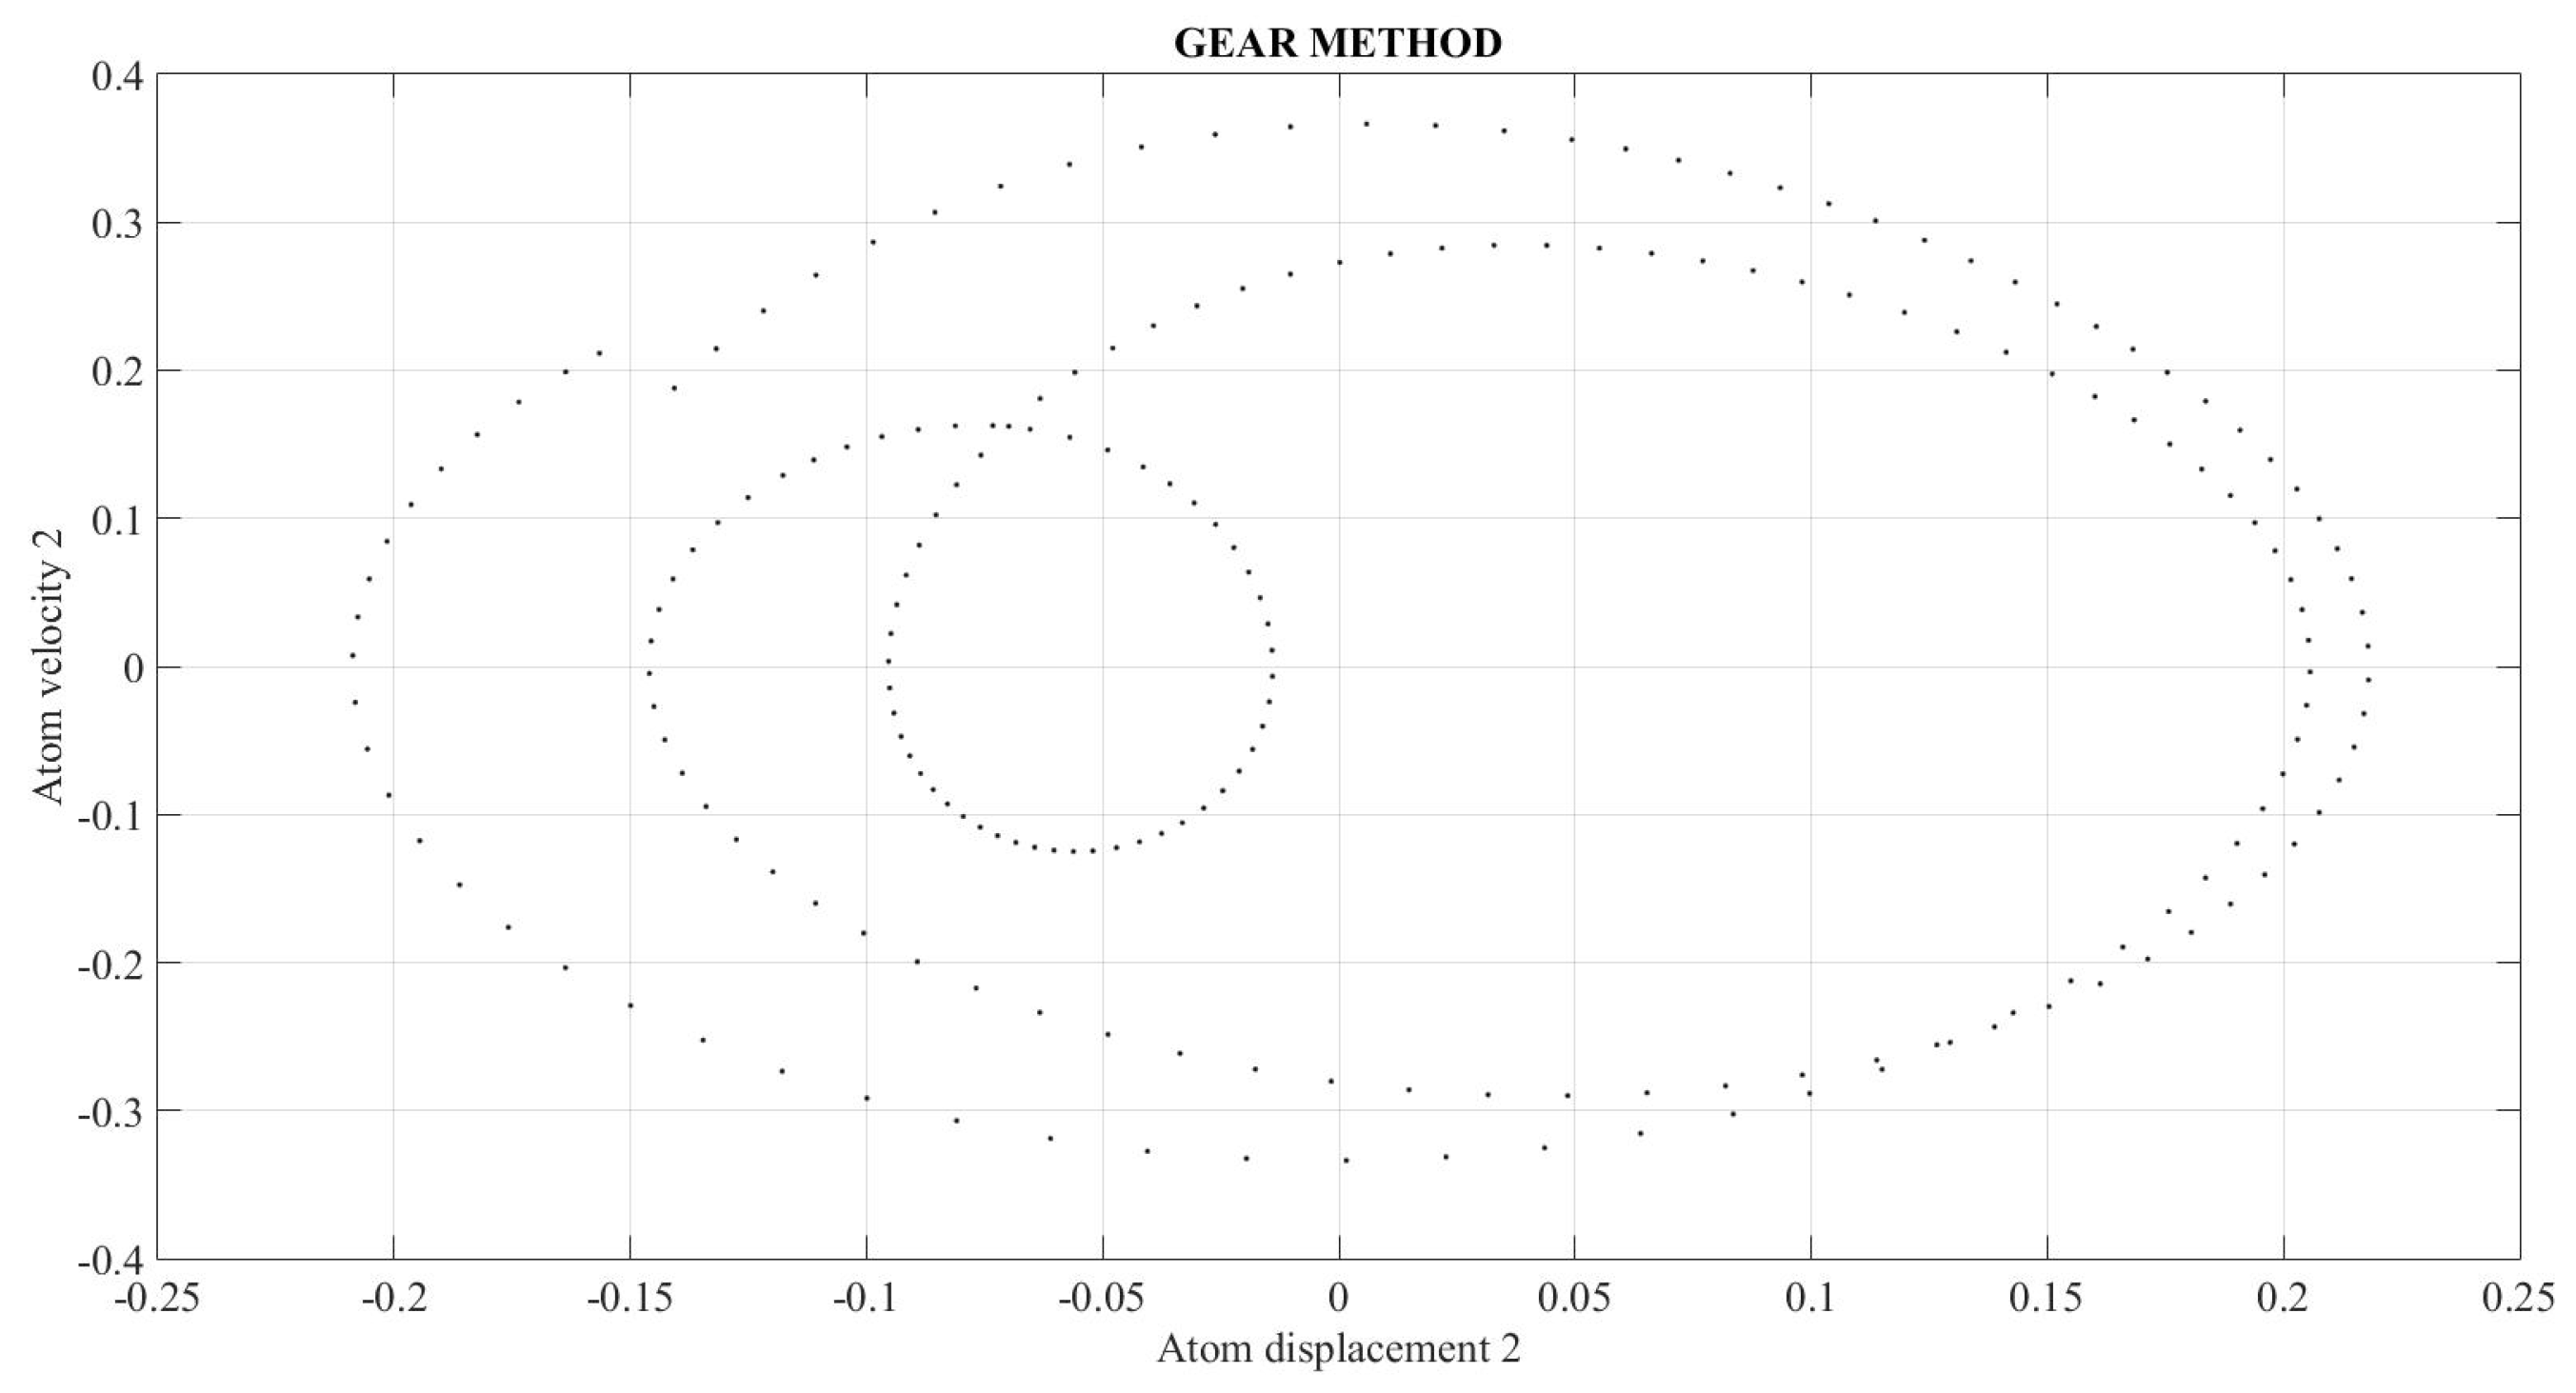
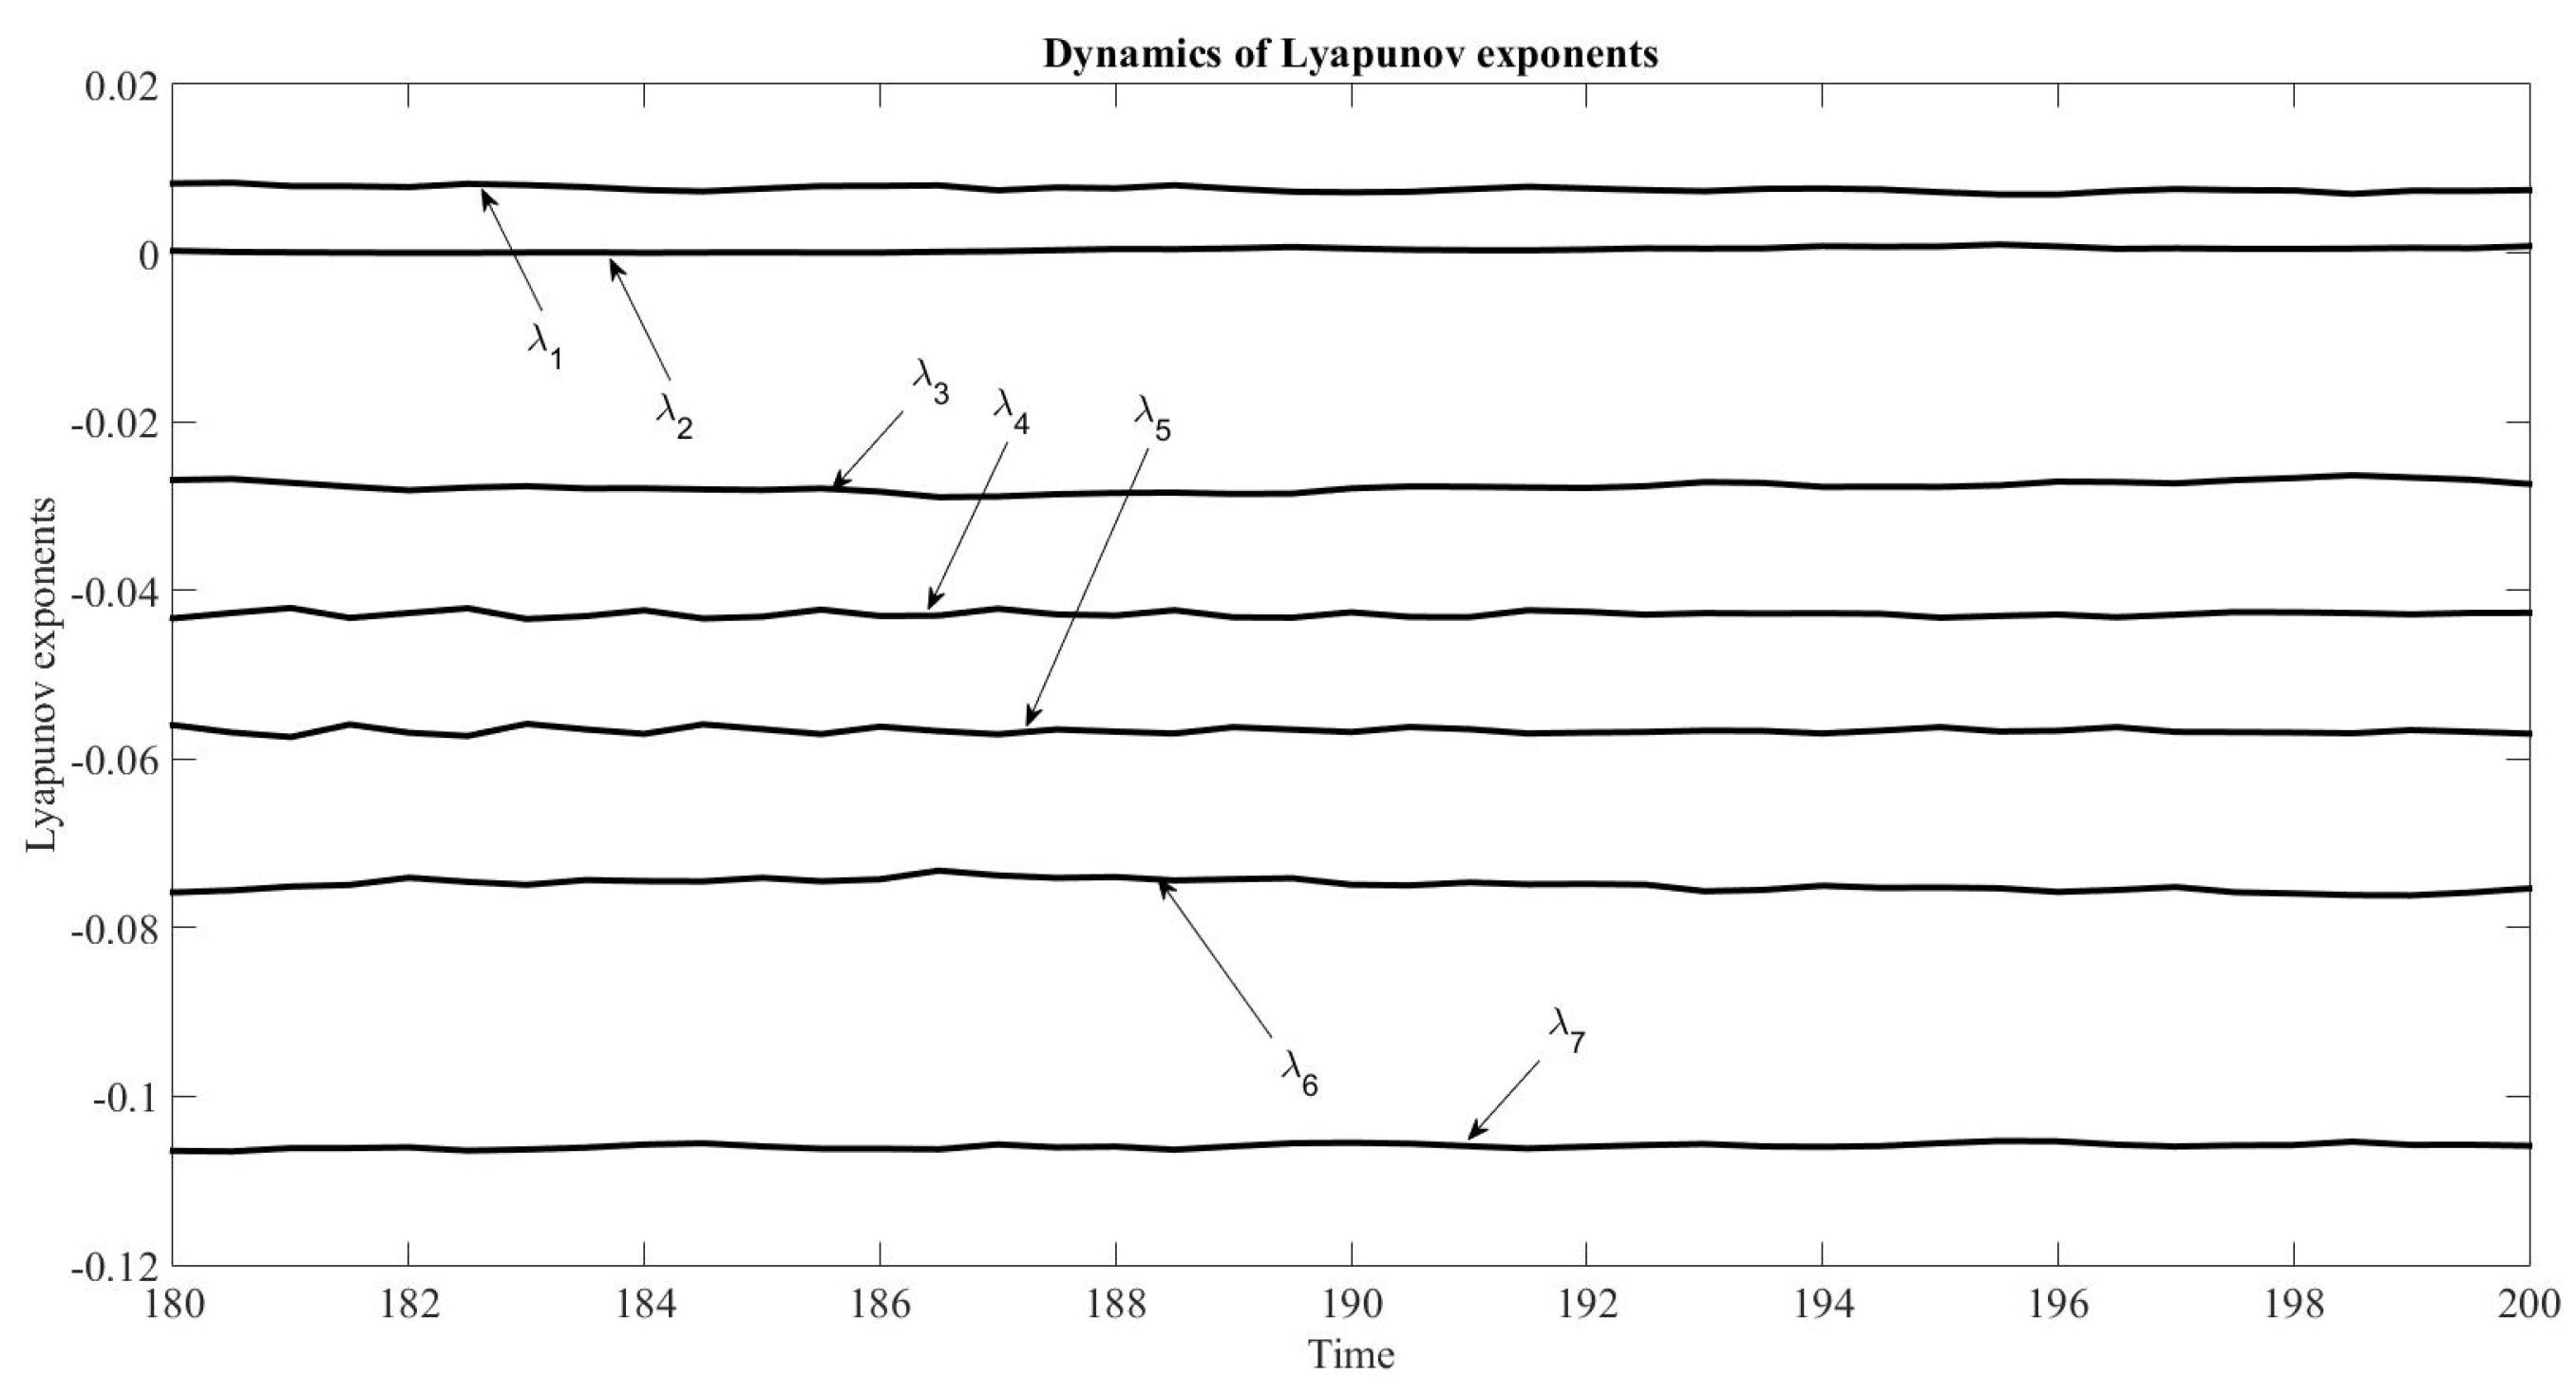
In addition to the former calculations, a comparison is made between the results using Gear Method with MATLAB and Network Simulation methods with ngspice for FKT problem with only 3 atoms, Figure 32, Figure 33, Figure 34, Figure 35, Figure 36 and Figure 37. Figure 32 and Figure 33 represent the phase diagrams with the parameter κ 2 equal to 1.6 using MATLAB and ngspice, respectively. For this parameter, the system behaviour is periodical, as both programs show. Furthermore, the results in both programs are the same. Figure 34 and Figure 35 represent the phase diagrams with the parameter κ 2 equal to 1.4 using MATLAB and ngspice, respectively. For this parameter, the system behaviour is chaotic, as both programs show. Furthermore, the results in both programs are similar but not equal. The Lyapunov exponents for the two values of parameter κ 2 are verified in the results shown in Figure 36 and Figure 37.
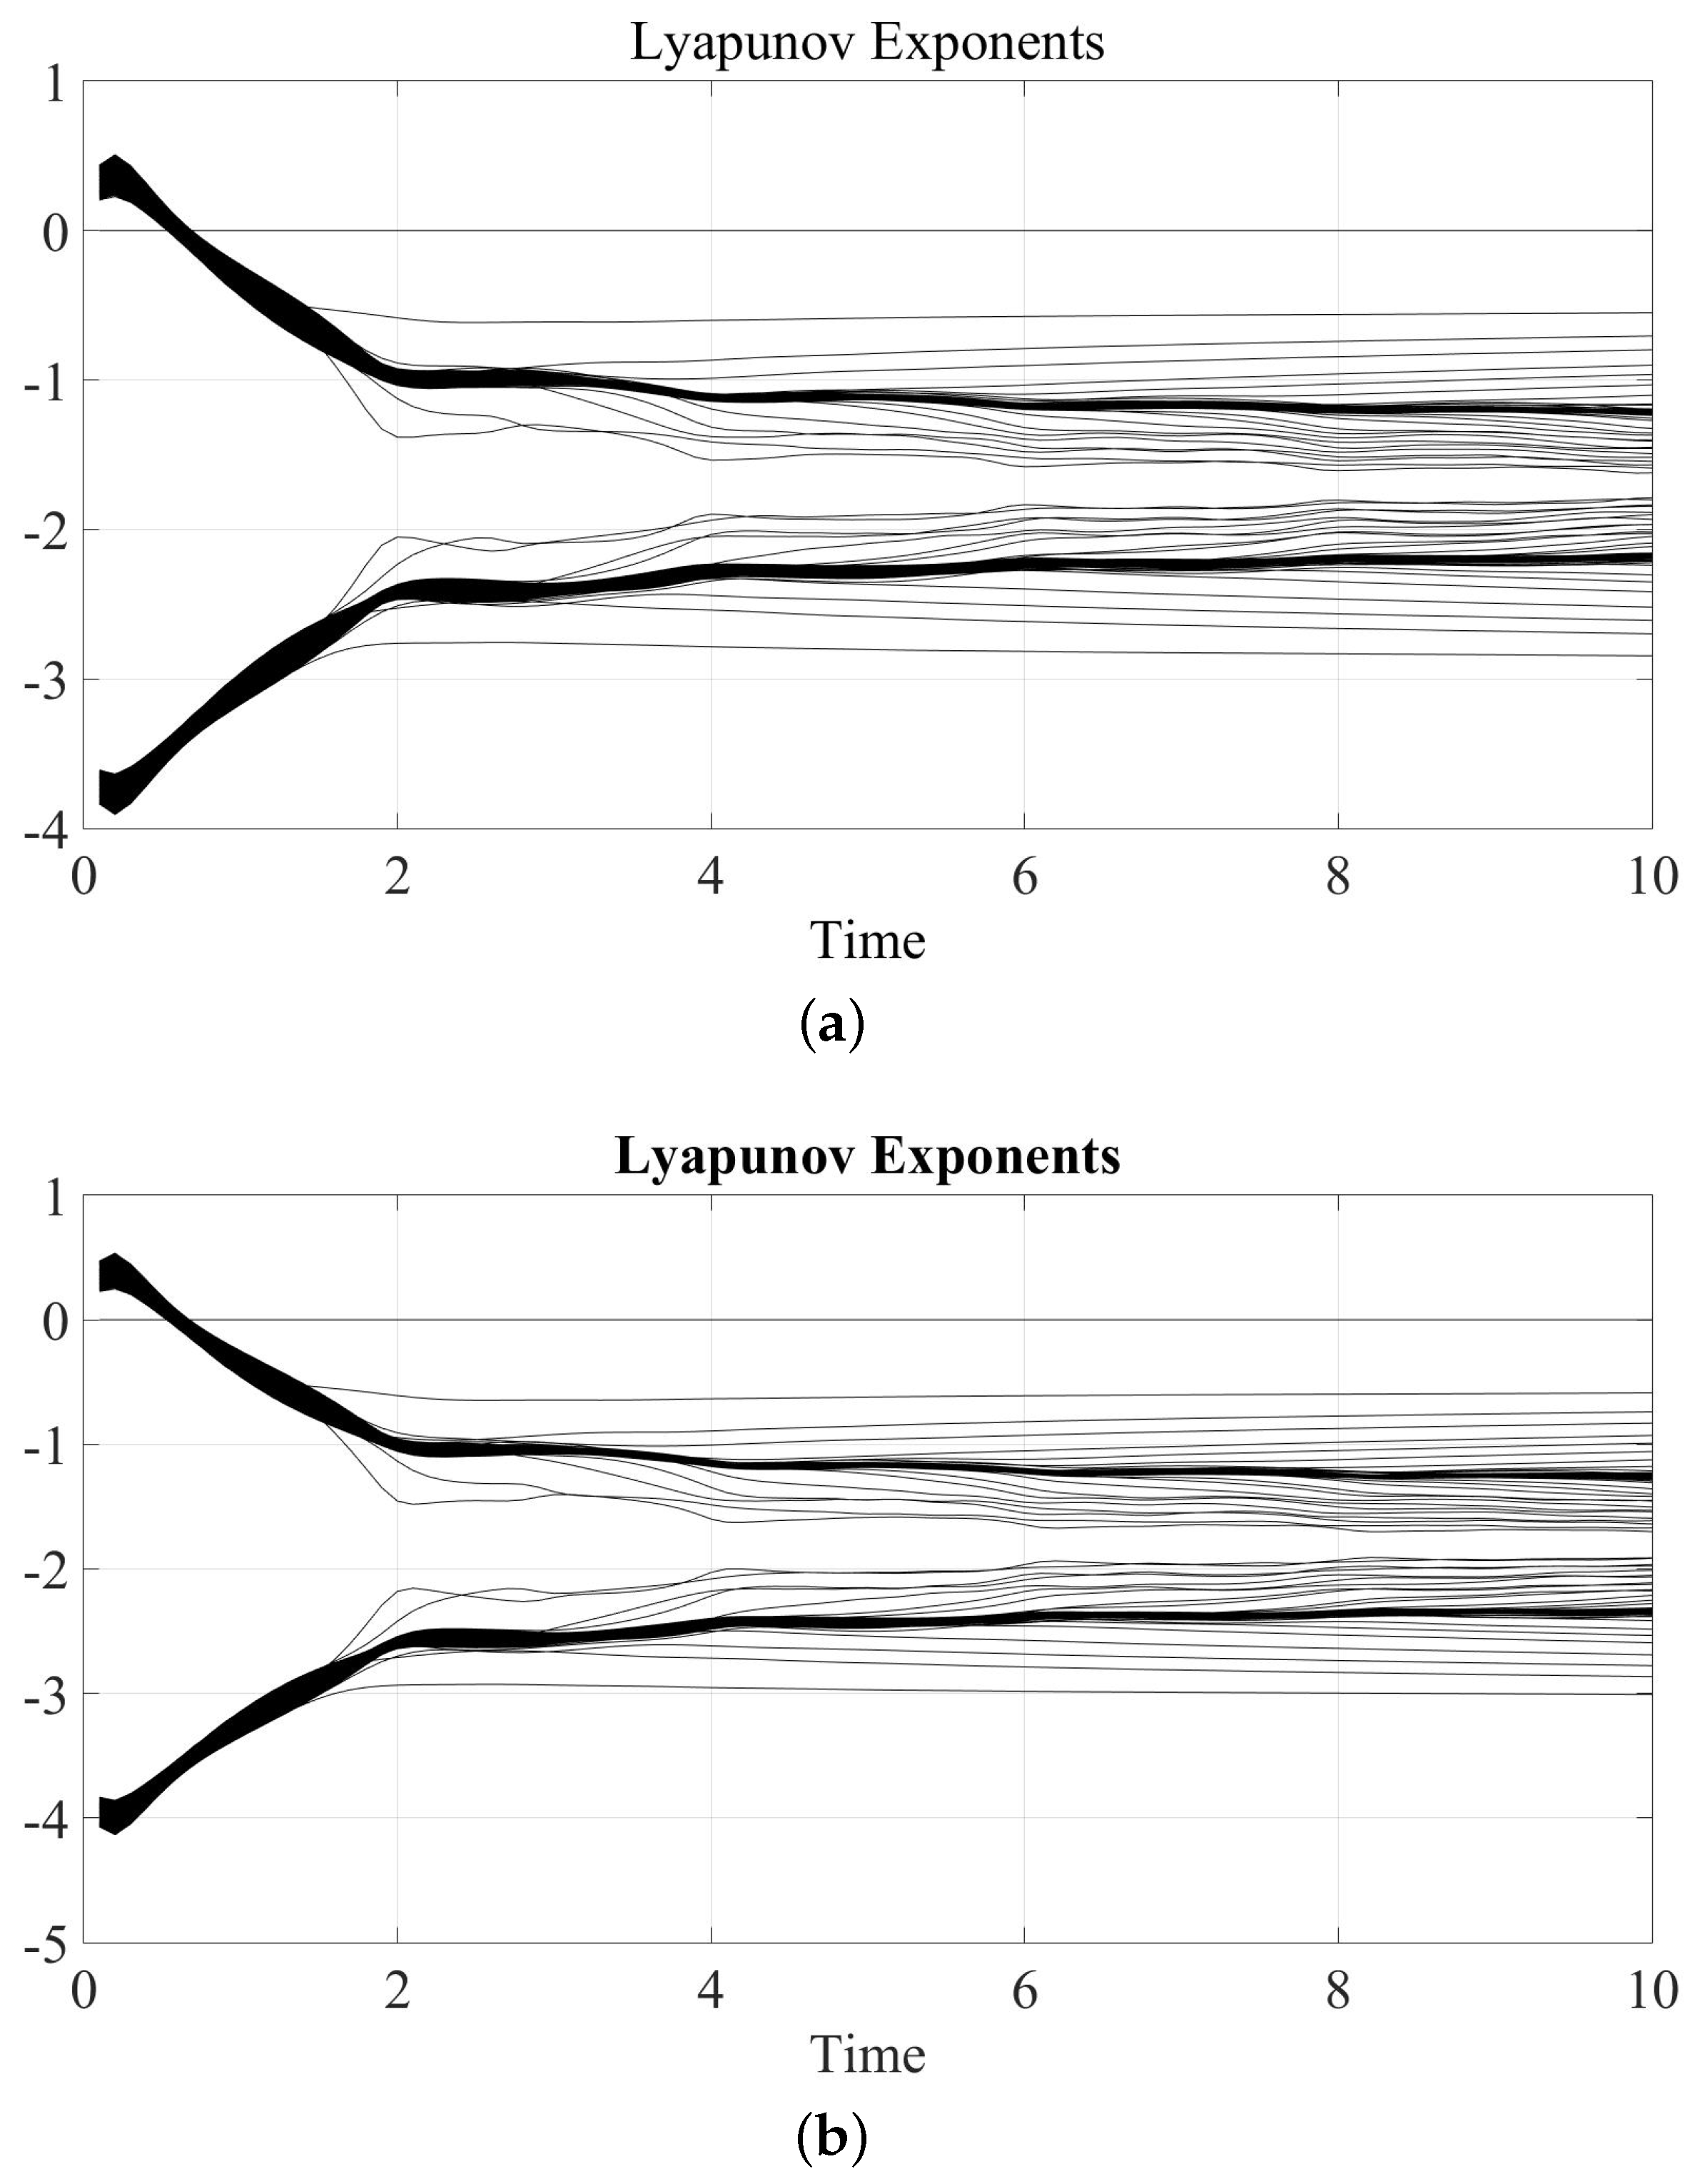
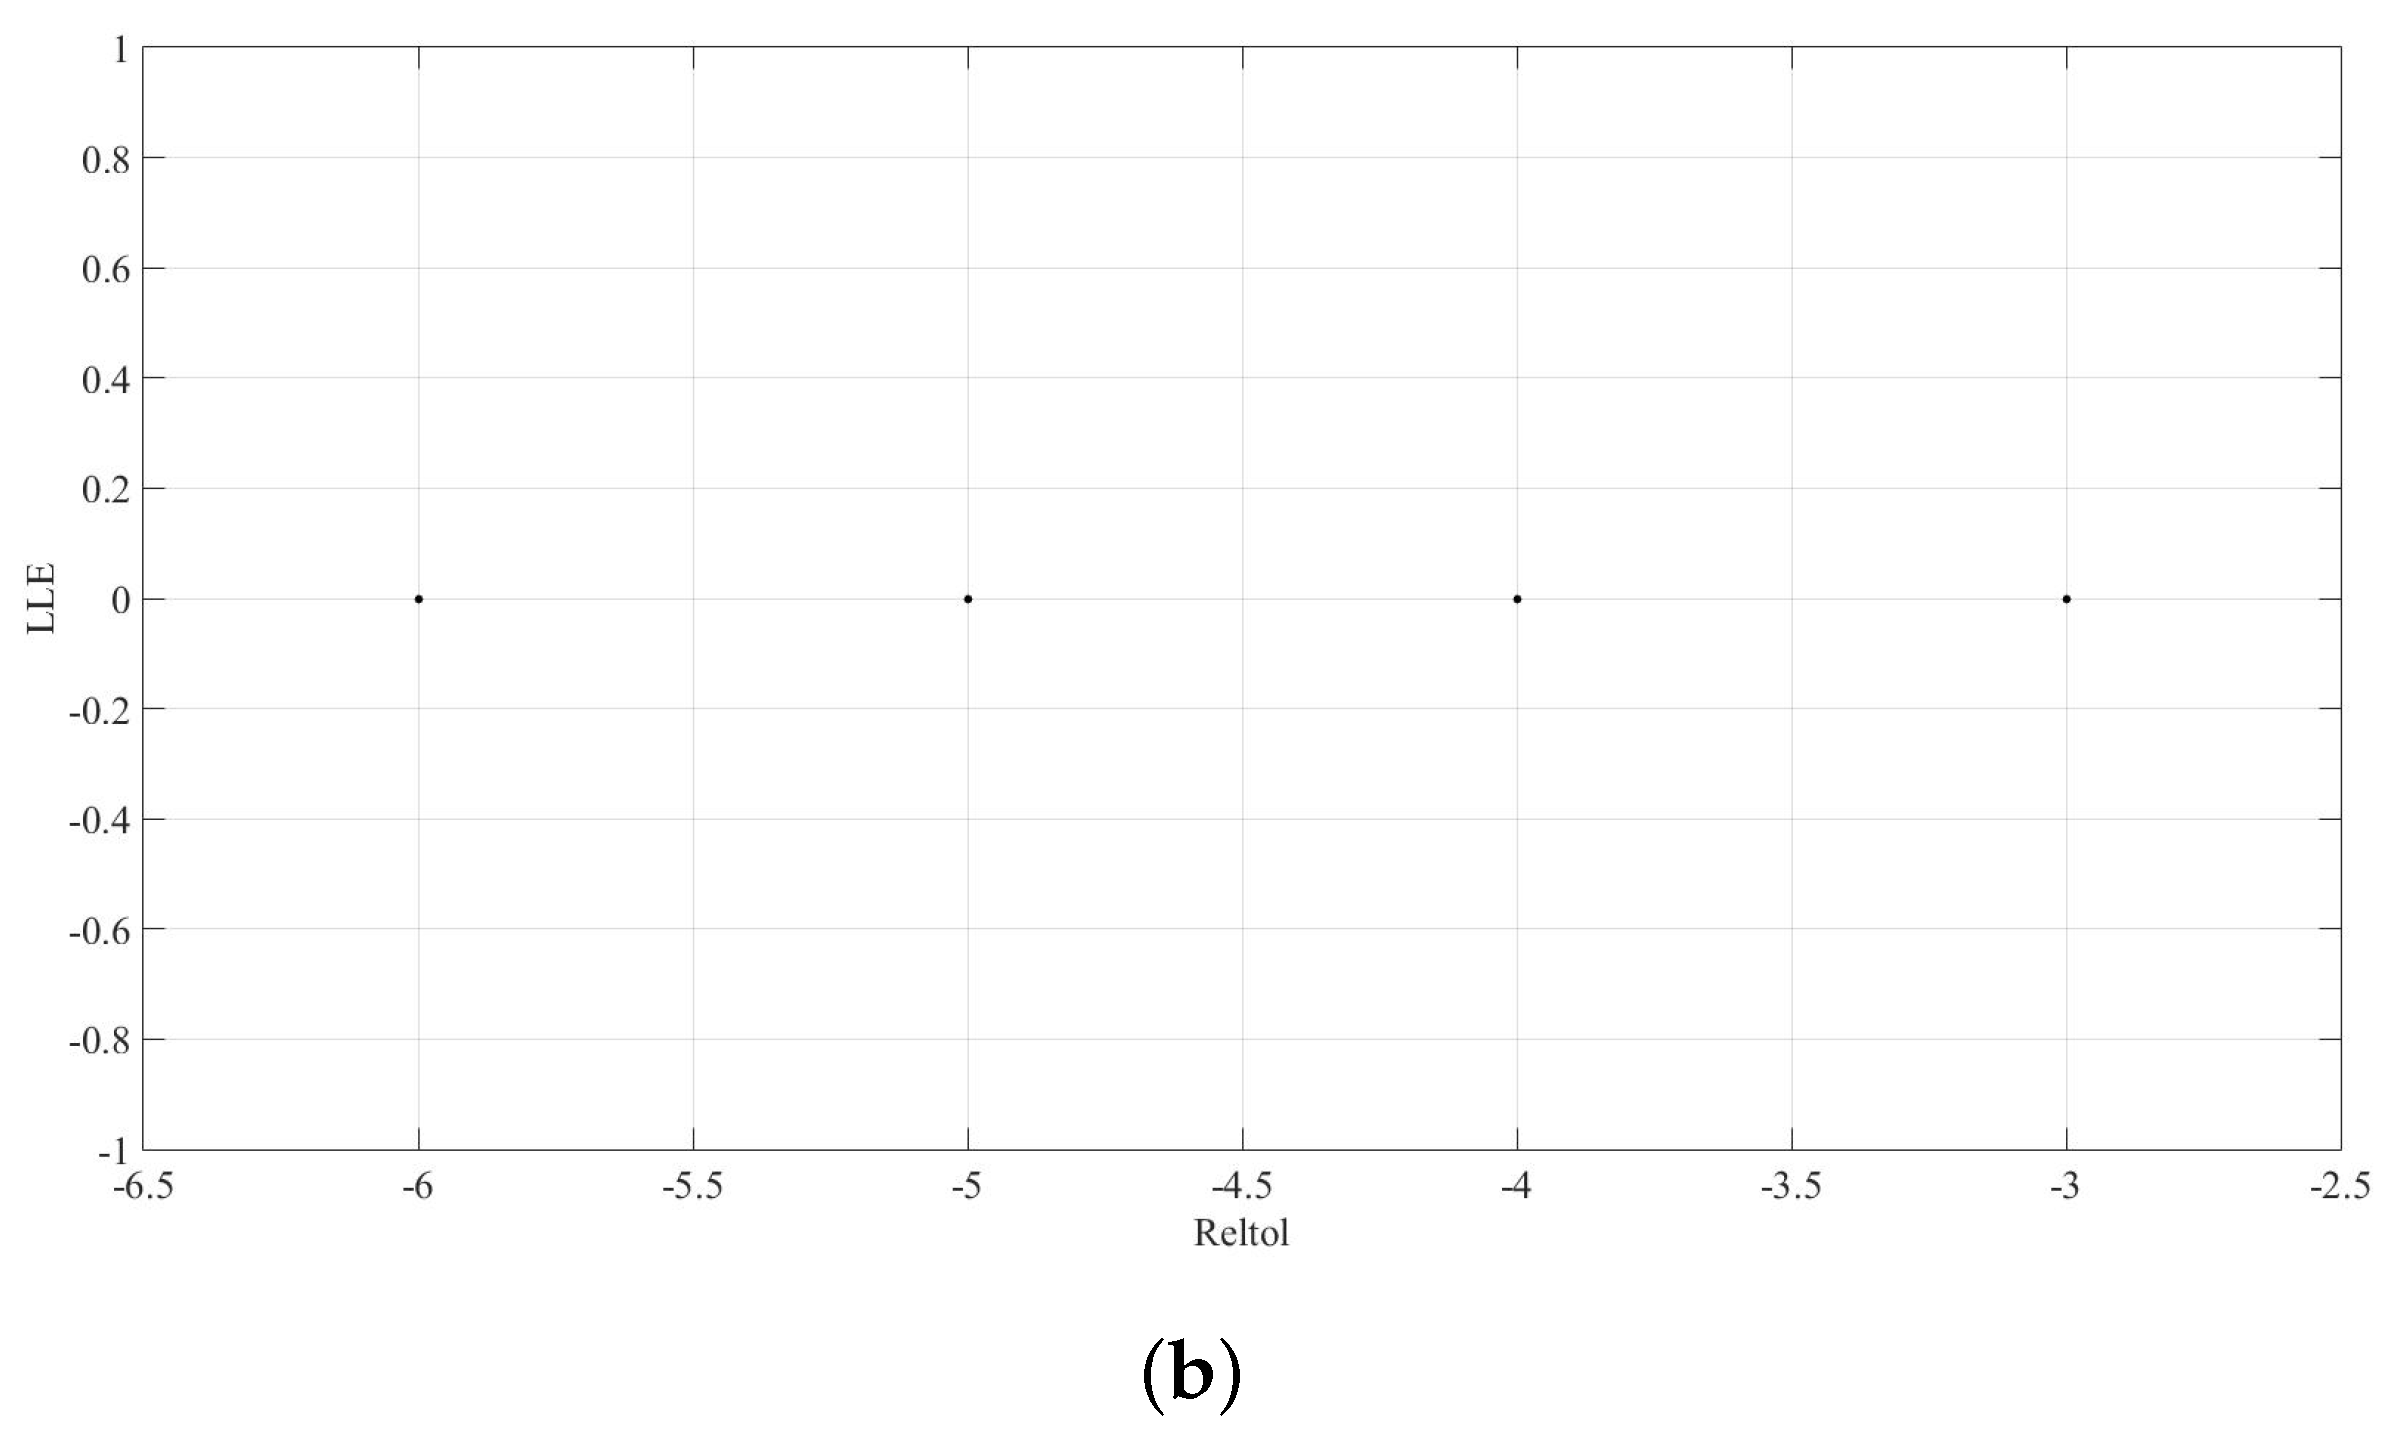
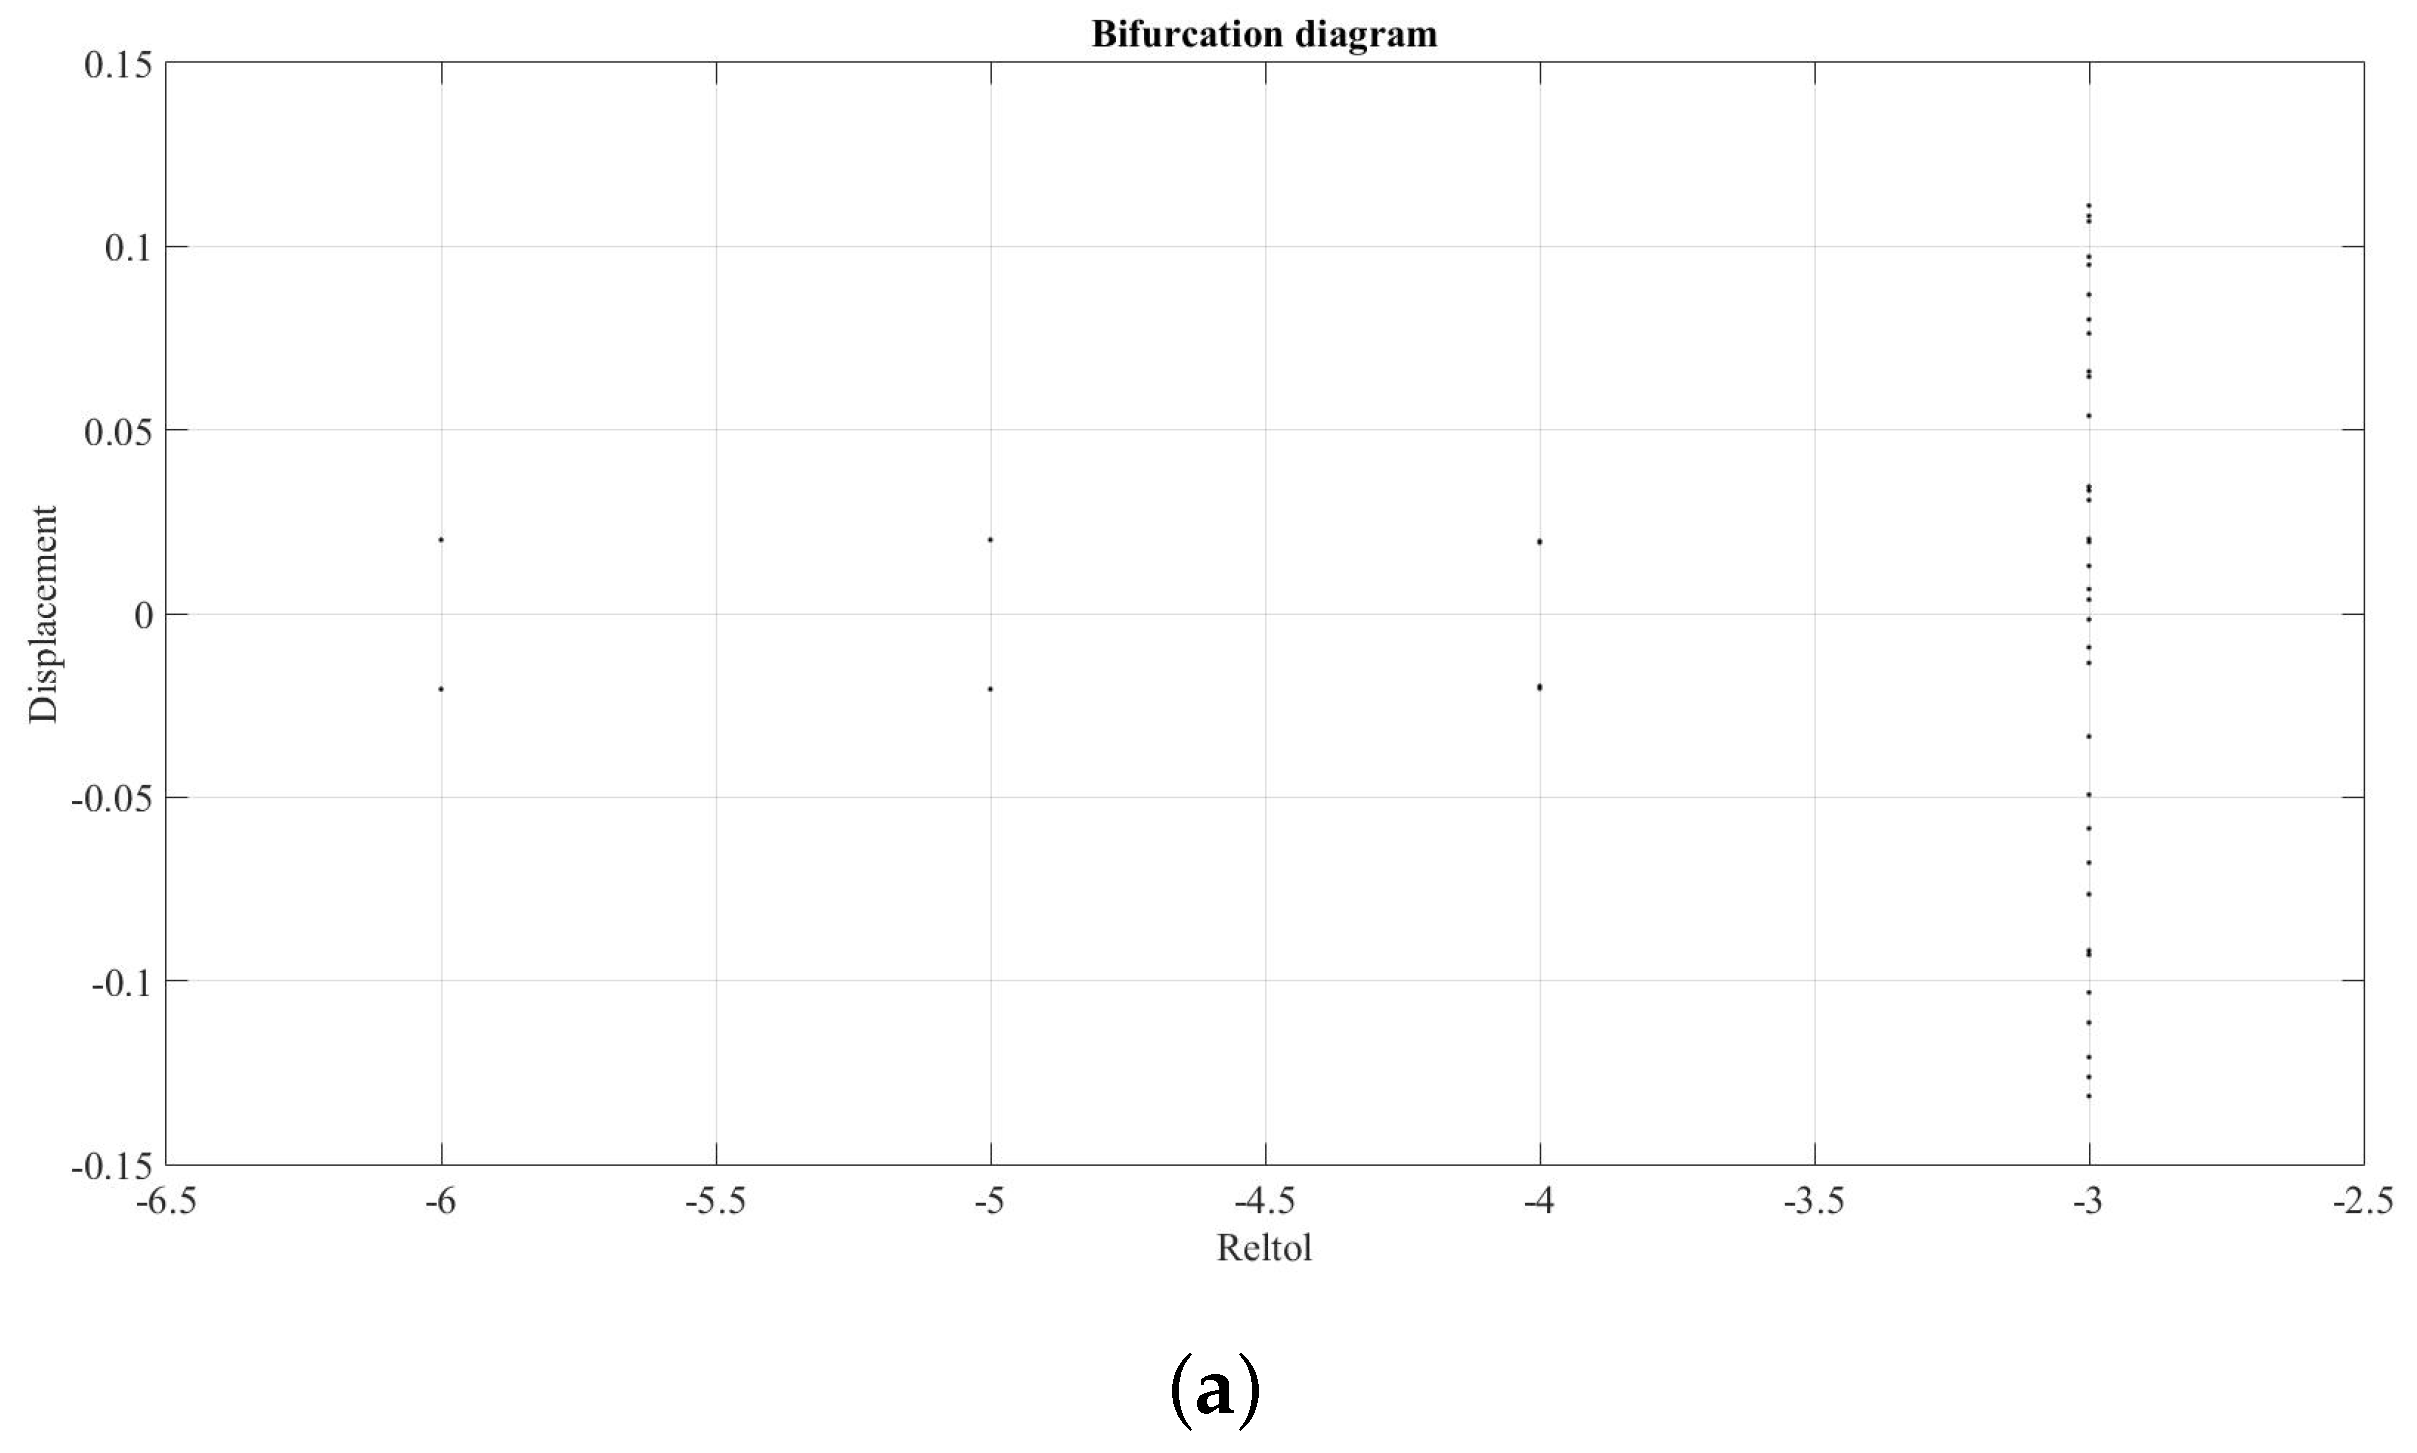
The Lyapunov exponents for two values of parameter κ 2 and 233 atoms, considering only 10 s, verify these results, Figure 38. In this case, the Lyapunov exponents are not able to display the chaotic behaviour. Furthermore, Figure 39 shows a bifurcation diagrams and graph with large Lyapunov exponent (LLE) for κ 2 = 1.5 [25,26,27].
5. Final Comments and Conclusions
The non-linear mechanical system of equations of FKT is solved by an efficient and reliable model which was designed using the network method. From the solutions, the time step effect has strong influence and is able to remove the chaotic behaviour of the system. In this case, all the Lyapunov exponents are negative.
It is an extended practice particularly in experimental and applied dynamics, to associate orbits with positive Lyapunov exponents to their instability or chaotic behaviour and negative Lyapunov exponents with stability or non-chaoticity. However, such statement has no firm mathematical foundation if some restrictions on the maps describing the dynamical systems are not introduced. In fact, in Reference [23,24], several examples of system have exactly the opposite behaviour. We have systems with orbits in which Lyapunov exponents are all negatives but being chaotic in a neighbourhood of the orbit and others having positive Lyapunov exponents but non-chaotic in the neighbourhood. In Figure 13, we graphically show another example of such contradictory behaviour.

Author Contributions

J.S.R. Dry friction, numerical simulation, network simulation method. F.B.G. Dynamical system, chaos, partial differential equations. J.A.M.N. Numerical simulation, network simulation method, surface technology. F.M.G. Network simulation method. All authors have read and agreed to the published version of the manuscript.

Funding

This research received no external funding.

Conflicts of Interest

The authors declare that they have no known competing financial interests or personal relationships that could have appeared to influence the work reported in this paper.

References

  1. Perry, S.S.; Lee, S.; Shon, Y.-S.; Colorado, R., Jr.; Lee, T.R. The Relationships between Interfacial Friction and the Conformational Order of Organic Thin Films. Tribol. Lett. 2001, 10, 81–87. [Google Scholar] [CrossRef]
  2. Müser, M.H. Theory and Simulation of Friction and Lubrication; Lecture Notes in Physics; Springer: Berlin, Germany, 2006; Volume 704. [Google Scholar]
  3. Tomlinson, G.A. CVI. A molecular theory of friction. Phil. Mag. Ser. 1929, 7, 905. [Google Scholar] [CrossRef]
  4. Frenkel, Y.I.; Kontorova, T. On the theory of plastic deformation and twinning. II. Zh. Eksp. Teor. Fiz. 1938, 8, 1340–1348. [Google Scholar]
  5. Strunz, T.; Elmer, F.J. Physics of Sliding Friction; Kluwer Academic Publishers: London, UK, 1996; Chapter 5, p. 149; Chapter 26, p. 433. [Google Scholar]
  6. Weiss, M.; Elmer, F.J. Dry friction in the Frenkel-Kontorova-Tomlinson model: Static properties. Phys. Rev. B 1996, 53, 7539–7549. [Google Scholar] [CrossRef] [PubMed]
  7. Weiss, M.; Elmer, F.J. Dry friction in the Frenkel-Kontorova-Tomlinson model: Dynamical properties. Phys. Rev. B 1997, 104, 55–69. [Google Scholar] [CrossRef] [Green Version]
  8. Robbins, M.; Müser, M. Modern Tribology; CRC Press: London, UK, 2001; p. 717. [Google Scholar]
  9. Elmer, F.J. Nonlinear dynamics of dry friction. J. Phys. A 1997, 30, 6057. [Google Scholar] [CrossRef] [Green Version]
  10. Fusco, C.; Fasolino, A. Velocity dependence of atomic-scale friction: A comparative study of the one- and two-dimensional Tomlinson model. Phys. Rev. B 2005, 71, 045413. [Google Scholar] [CrossRef] [Green Version]
  11. Alhama, F.; Marin, F.; Moreno, J.A. An efficient and reliable model to simulate microscopic mechanical friction in the Frenkel–Kontorova–Tomlinson model. Comp. Phys. Commun. 2011, 182, 2314–2325. [Google Scholar] [CrossRef]
  12. Kapitaniak, T. Chaos for Engineers. Theory, Applications, and Control; Springer-Verlag: Berlin/Heidelberg, Germany, 2000. [Google Scholar]
  13. Vogt, H.; Hendrix, M.; Nenzi, P. Ngspice Users Manual Version 31; Creative Commons Attribution Share-Alike (CC-BY-SA). 2019. Available online: http://ngspice.sourceforge.net/download.html (accessed on 24 June 2020).
  14. Wolf, A.; Swift, J.B.; Swinney, H.L.; Vastano, J.A. Determining Lyapunov Exponents from a Time Series. Phys. D 1985, 16, 285–317. [Google Scholar] [CrossRef] [Green Version]
  15. Wang, Z.-J.; Ma, T.-B.; Hu, Y.-Z.; Xu, L.; Wang, H. Energy dissipation of atomic-scale friction based on onedimensional Prandtl–Tomlinson model. Friction 2015, 3, 170–182. [Google Scholar] [CrossRef] [Green Version]
  16. Banerjee, S. Dynamics for Engineers; John Wiley and Sons: Chichester, UK, 2005. [Google Scholar]
  17. Parker, T.S.; Chua, L.O. Practical Numerical Algorithms for Chaotic Systems; Springer-Verlag: Berlin/Heidelberg, Germany, 1989; XIV, 348S., 152 Abb., DM 98; ISBN 3-540-96689-7. [Google Scholar]
  18. González-Fernández, C.F.; Alhama, F.; López-Sánchez, J.F. Application of the network method to heat conduction processes with polynomial and potential-exponentially varying thermal properties. Numer. Heat Transf. A Appl. 1998, 33, 549–559. [Google Scholar] [CrossRef]
  19. Horno, J.; González-Fernández, C.F.; Hayas, A. The Network Method for Solutions of Oscillating Reaction-Diffusion Systems. J. Comput. Phys. 1995, 118, 310–319. [Google Scholar] [CrossRef]
  20. Chacón, R.; Balibrea, F.; López, M.A. Inhibition of chaotic escape from a potential well using small parametric modulations. J. Math. Phys. 1996, 37, 5518–5523. [Google Scholar] [CrossRef]
  21. Chacón, R.; Martínez, A. Bifurcations and chaos in a parametrically damped two-well Duffing oscillator subjected to symmetric periodic pulses. Phys. Rev. E 1999, 59, 6558–6568. [Google Scholar] [CrossRef] [PubMed]
  22. Chacón, R. A control of homoclinic/heteroclinic chaos by weak harmonic excitations. In World Scientific Series on Nonlinear Sciences Series A; World Scientific: Singapore, 2005; Volume 55. [Google Scholar]
  23. Balibrea, F.; Caballero, V. Stability of Orbits via Lyapunov Exponents in Autonomous and Non-autonomous systems. Int. J. Bifurc. Chaos 2013, 23, 1350127. [Google Scholar] [CrossRef]
  24. Leonov, G.A.; Kuznetsov, N.V. Time-varying linearization and the Perron effects. Int. J. Bifurc. Chaos 2007, 17, 1079–1107. [Google Scholar] [CrossRef] [Green Version]
  25. Andreev, V.; Ostrovskii, V.; Karimov, T.; Tutueva, A.; Doynikova, E.; Butusov, D. Synthesis and Analysis of the Fixed-Point Hodgkin–Huxley Neuron Model. Electronics 2020, 9, 434. [Google Scholar] [CrossRef] [Green Version]
  26. Tutueva, A.; Butusov, D.; Okhota, A.; Pesterev, D.; Rodionova, E. The dynamical analysis of the modified rossler system. Iop Conf. Ser. Mater. Sci. Eng. 2019, 630, 012006. [Google Scholar] [CrossRef] [Green Version]
  27. Kaplun, D.; Tutueva, A.; Butusov, D.; Karimov, A.; Toming, J. Memristive Circuit Simulation Using the Semi-Implicit Multistep Method. In Proceedings of the International Conference on Telecommunications and Signal Processing (TSP), Budapest, Hungary, 1–3 July 2019; pp. 98–101. [Google Scholar]
Figure 1. Schematic diagram of the FKT model.
Symmetry 12 01413 g001
Figure 2. Nonlinear load-displacement curve of a spring.
Symmetry 12 01413 g002
Figure 3. Phase diagram of Duffing equations for RELTOL and VNTOL equal to 1.0 × 10 10 (DTMIN = 1.0 × 10 15 ).
Symmetry 12 01413 g003
Figure 4. Zoom of Figure 3 between 900 and 1000 s.
Symmetry 12 01413 g004
Figure 5. Zoom of Figure 3 between 0 and 100 s.
Symmetry 12 01413 g005
Figure 6. Lyapunov exponents of the Duffing equations represented in Figure 3.
Symmetry 12 01413 g006
Figure 7. Phase diagram of Duffing equations for RELTOL and VNTOL equal to 1.0 × 10 15 (DTMIN = 1.0 × 10 20 ).
Symmetry 12 01413 g007
Figure 8. Phase diagram of Duffing equations for RELTOL and VNTOL equal to 1.0 × 10 6 (DTMIN = 1.0 × 10 15 ).
Symmetry 12 01413 g008
Figure 9. Phase diagram of Duffing equations for RELTOL and VNTOL equal to 1.0 × 10 20 (DTMIN = 1.0 × 10 30 ).
Symmetry 12 01413 g009
Figure 10. Phase diagram of FKT model with κ 2 = 1.5 for RELTOL and VNTOL equal to 1.0 × 10 6 (DTMIN = 1.0 × 10 15 ).
Symmetry 12 01413 g010
Figure 11. Phase diagram of FKT model with κ 2 = 1.5 for RELTOL and VNTOL equal to 1.0 × 10 5 (DTMIN = 1.0 × 10 15 ).
Symmetry 12 01413 g011
Figure 12. Phase diagram of FKT model with κ 2 = 1.5 for RELTOL and VNTOL equal to 1.0 × 10⁻⁴ (DTMIN = 1.0 × 10 15 ).
Symmetry 12 01413 g012
Figure 13. Phase diagram of FKT model with κ 2 = 1.5 for RELTOL and VNTOL equal to 1.0 × 10 3 (DTMIN = 1.0 × 10 15 ).
Symmetry 12 01413 g013
Figure 14. Phase diagram of FKT model with the same parameters as Figure 13 in a range of 3950 and 4000 s.
Symmetry 12 01413 g014
Figure 15. Phase diagram of FKT model with the same parameters as Figure 13 in a range of 7950 and 8000 s.
Symmetry 12 01413 g015
Figure 16. Phase diagram of FKT model with the same parameters as Figure 12 in a range of 50 and 100 s.
Symmetry 12 01413 g016
Figure 17. Phase diagram of FKT model with the same parameters as Figure 9 but in a range of 50 and 100 s.
Symmetry 12 01413 g017
Figure 18. Phase diagram of FKT model with the same parameters as Figure 9 but using zero and infinite resistances of 10 − 20 and 10 + 20, respectively.
Symmetry 12 01413 g018
Figure 19. Phase diagram of FKT model with κ 2 = 1.4 for RELTOL and VNTOL equal to 1.0 × 10⁻⁴ (DTMIN = 1.0 × 10 15 ).
Symmetry 12 01413 g019
Figure 20. Phase diagram of FKT model with κ 2 = 1.4 for RELTOL and VNTOL equal to 1.0 × 10 5 (DTMIN = 1.0 × 10 15 ).
Symmetry 12 01413 g020
Figure 21. Phase diagram of FKT model with κ 2 = 1.4 for RELTOL and VNTOL equal to 1.0 × 10 6 (DTMIN = 1.0 × 10 15 ).
Symmetry 12 01413 g021
Figure 22. Phase diagram of FKT model with κ 2 = 1.4 for RELTOL and VNTOL equal to 1.0 × 10 7 (DTMIN = 1.0 × 10 15 ).
Symmetry 12 01413 g022
Figure 23. Phase diagram of FKT model with κ 2 = 1.4 for RELTOL and VNTOL equal to 1.0 × 10 10 (DTMIN = 1.0 × 10 15 ).
Symmetry 12 01413 g023
Figure 24. Phase diagram of FKT model with κ 2 = 1.4 for RELTOL and VNTOL equal to 1.0 × 10 12 (DTMIN = 1.0 × 10 15 ).
Symmetry 12 01413 g024
Figure 25. Phase diagram of FKT model with κ 2 = 1.4 for RELTOL and VNTOL equal to 1.0 × 10 6 (DTMIN = 1.0 × 10 15 ) (50–100 s).
Symmetry 12 01413 g025
Figure 26. Phase diagram of FKT model with κ 2 = 1.4 for RELTOL and VNTOL equal to 1.0 × 10 6 (DTMIN = 1.0 × 10 15 ) (150–200 s).
Symmetry 12 01413 g026
Figure 27. Phase diagram of FKT model with κ 2 = 1.4 for RELTOL and VNTOL equal to 1.0 × 10 6 (DTMIN = 1.0 × 10 15 ) (250–300 s).
Symmetry 12 01413 g027
Figure 28. Phase diagram of FKT model with κ 2 = 1.6 for RELTOL and VNTOL equal to 1.0 × 10 10 (DTMIN = 1.0 × 10 15 ).
Symmetry 12 01413 g028
Figure 29. Phase diagram of FKT model with κ 2 = 1.4 for RELTOL and VNTOL equal to 1.0 × 10 10 (DTMIN = 1.0 × 10 15 ).
Symmetry 12 01413 g029
Figure 30. Phase diagram of FKT model with κ 2 = 1.4 for RELTOL and VNTOL equal to 1.0 × 10 5 (DTMIN = 1.0 × 10 15 ).
Symmetry 12 01413 g030
Figure 31. Lyapunov exponents of the FKT model with κ 2 = 1.4 .
Symmetry 12 01413 g031
Figure 32. Phase diagram of FKT model using MATLAB with κ 2 = 1.6 for RELTOL and VNTOL equal to 1.0 × 10 5 (DTMIN = 1.0 × 10 15 ).
Symmetry 12 01413 g032
Figure 33. Phase diagram of FKT model using ngspice with κ 2 = 1.6 for RELTOL and VNTOL equal to 1.0 × 10 5 (DTMIN = 1.0 × 10 15 ).
Symmetry 12 01413 g033
Figure 34. Phase diagram of FKT model using MATLAB with κ 2 = 1.4 for RELTOL and VNTOL equal to 1.0 × 10 5 (DTMIN = 1.0 × 10 15 ).
Symmetry 12 01413 g034
Figure 35. Phase diagram of FKT model using ngspice with κ 2 = 1.4 for RELTOL and VNTOL equal to 1.0 × 10 5 (DTMIN = 1.0 × 10 15 ).
Symmetry 12 01413 g035
Figure 36. Lyapunov exponents of the FKT model with κ 2 = 1.6 .
Symmetry 12 01413 g036
Figure 37. Lyapunov exponents of the FKT model with κ 2 = 1.4 .
Symmetry 12 01413 g037
Figure 38. Lyapunov exponents of the FKT model versus κ 2 : 1.4 (a) and 1.6 (b).
Symmetry 12 01413 g038
Figure 39. Bifurcation diagrams (a) and LLE (b) for FKT system with 233 atoms.
Symmetry 12 01413 g039aSymmetry 12 01413 g039b