Subjective Product Evaluation System Based on Kansei Engineering and Analytic Hierarchy Process


Abstract
1. Introduction
2. Methods
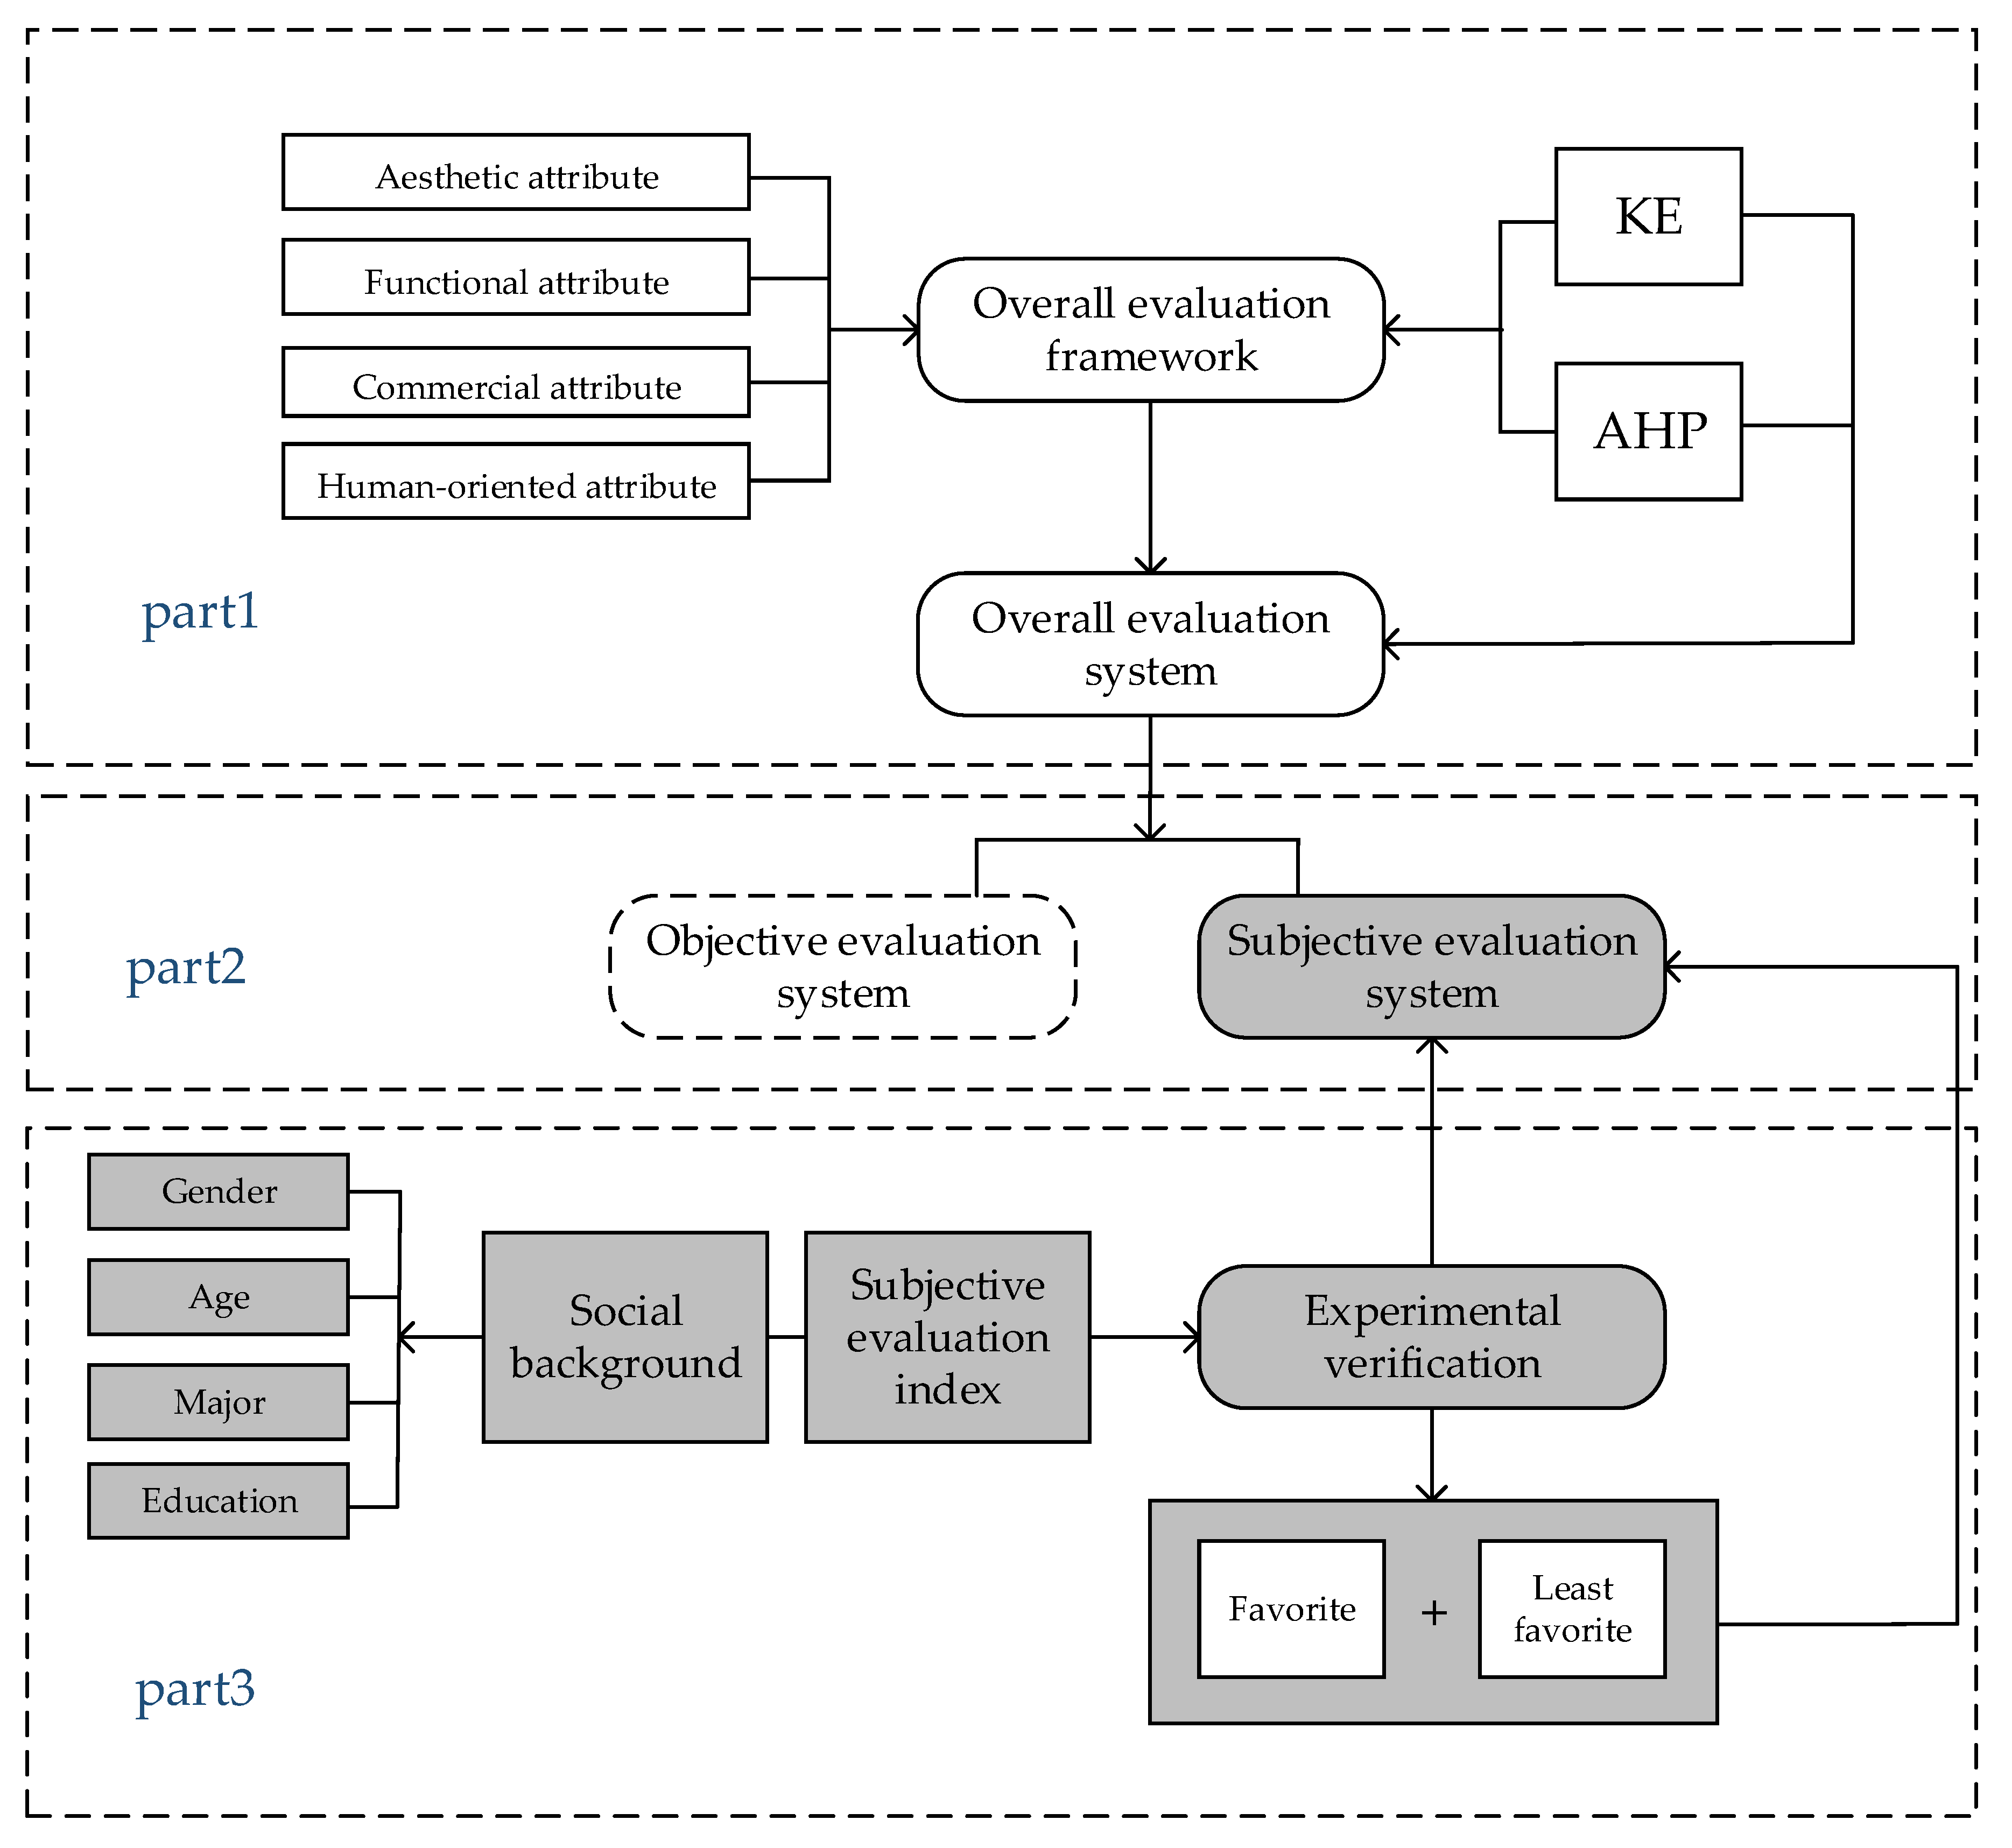
2.1. Research Framework
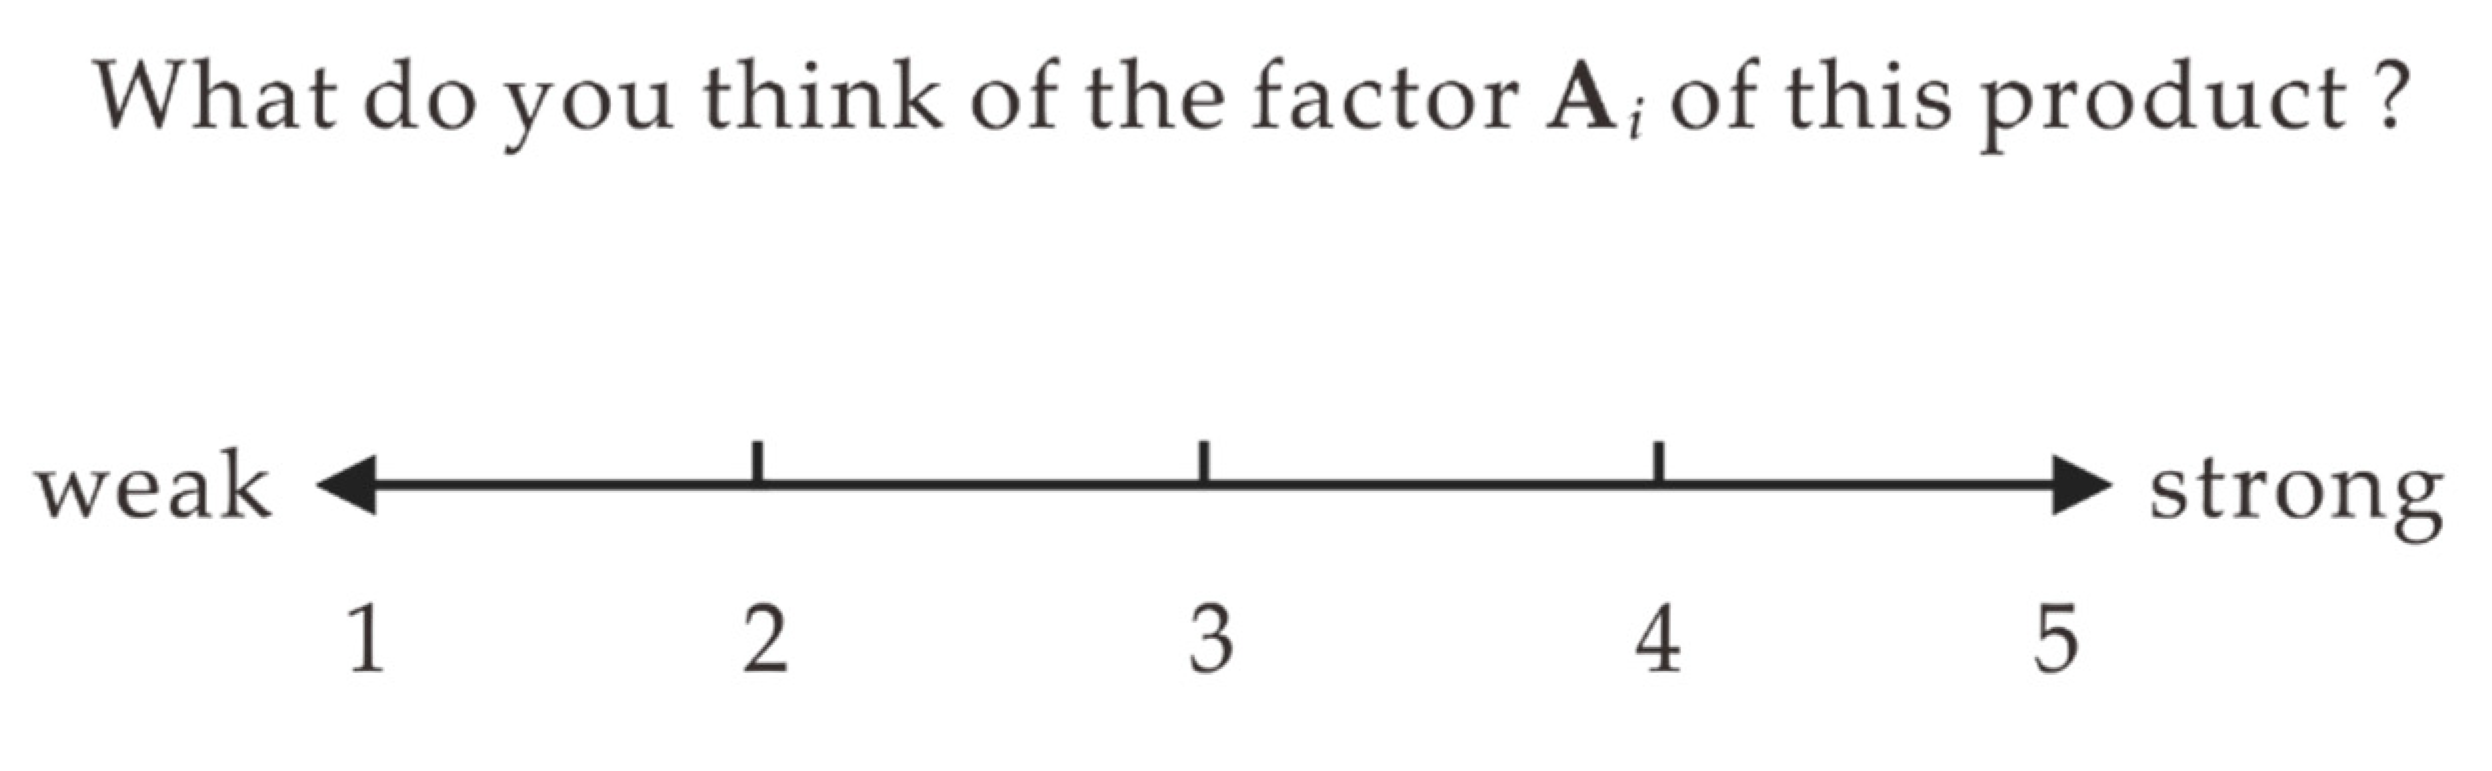
2.2. Kansei Engineering
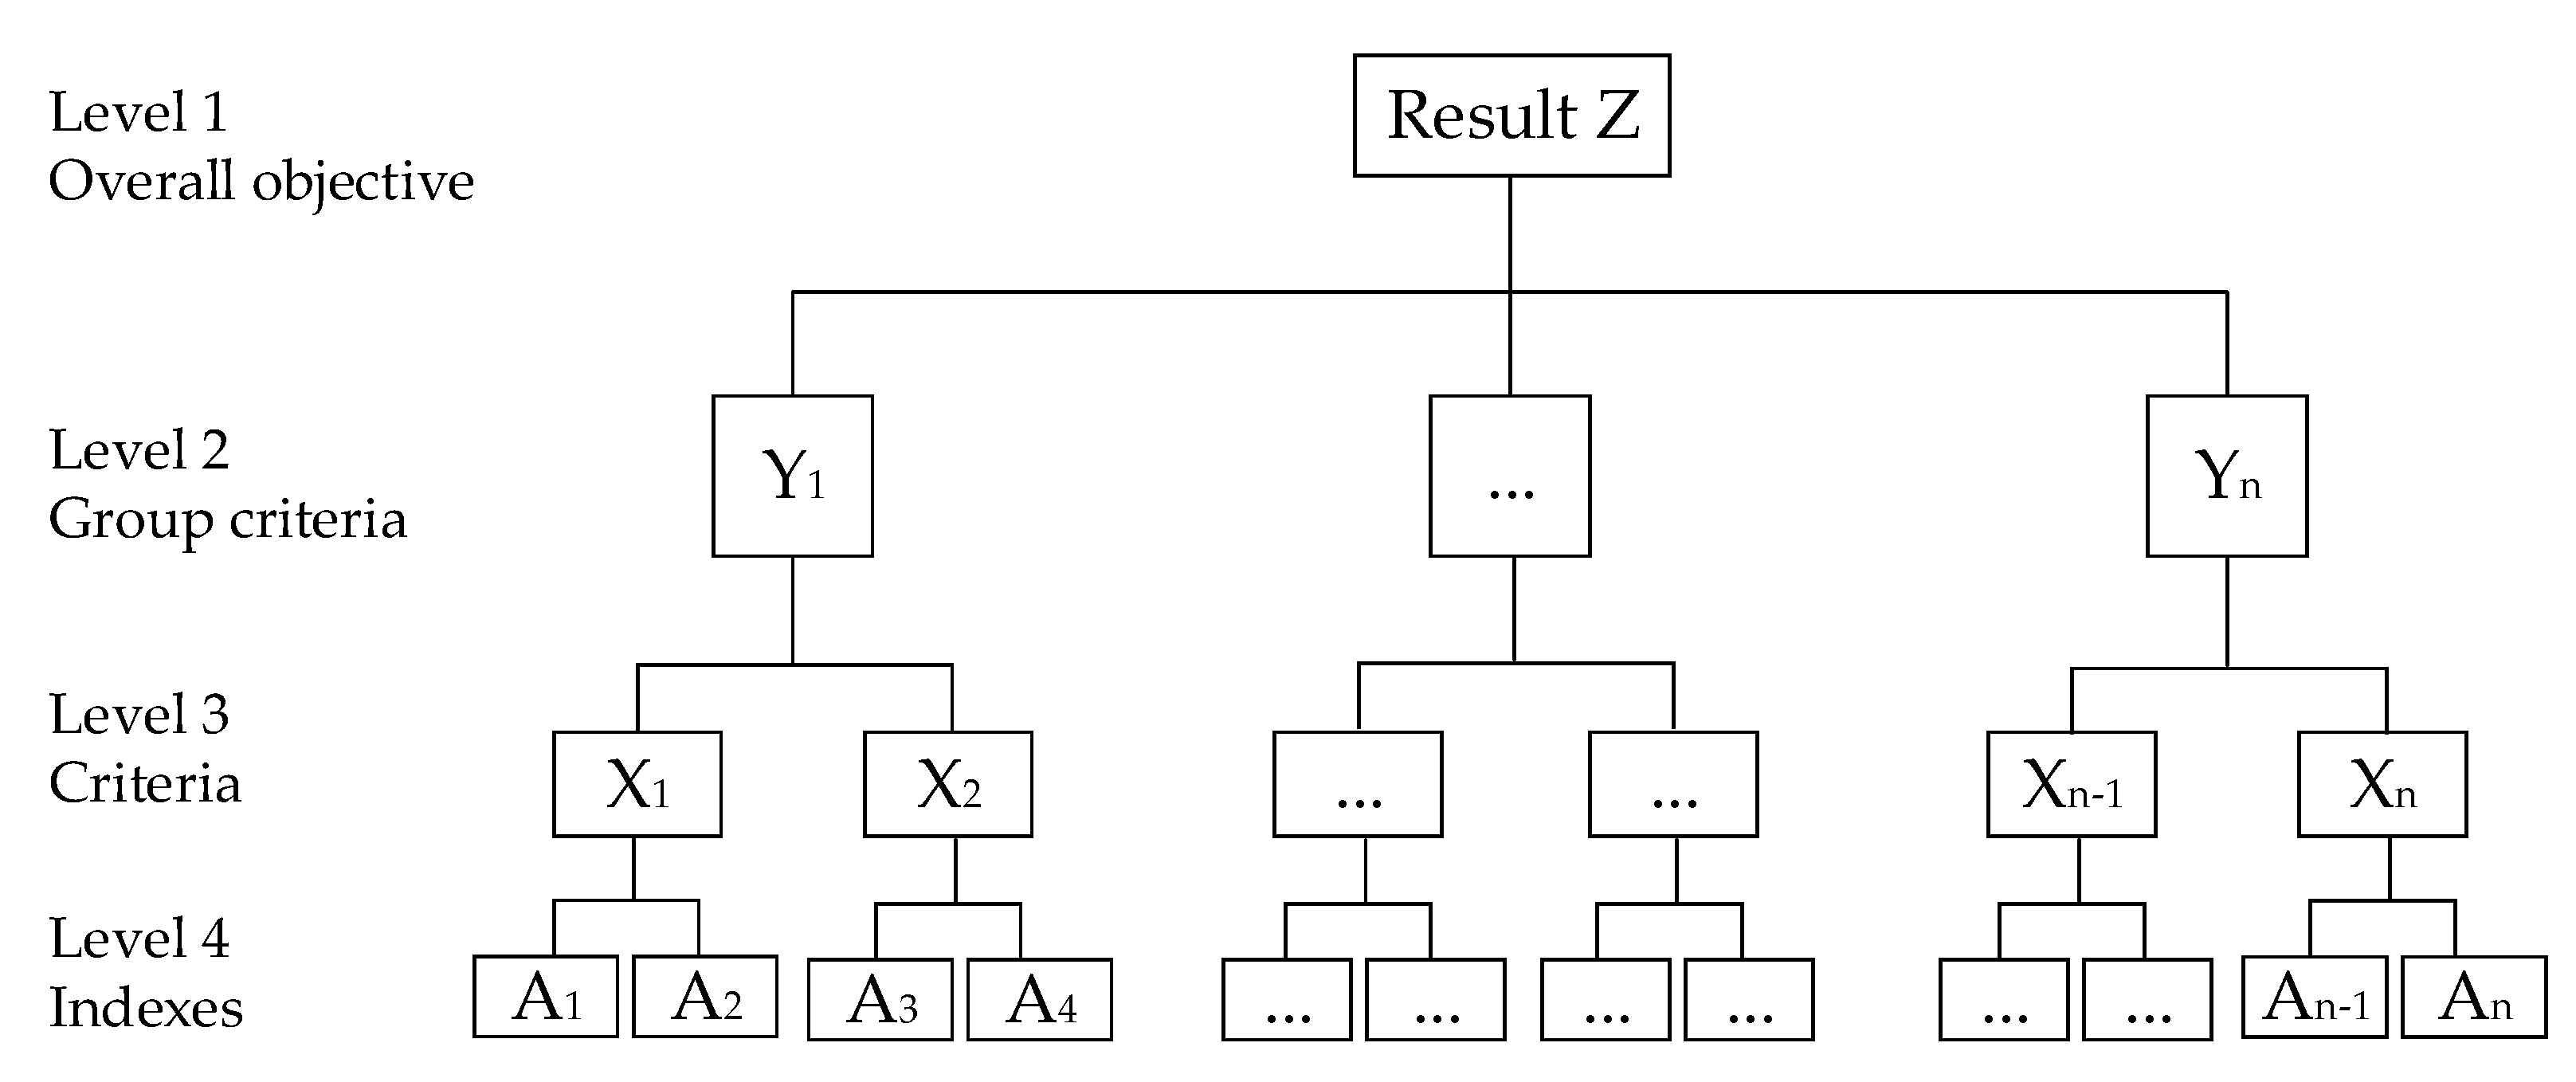
2.3. Analytic Hierarchy Process
3. Establishment of Subjective Product Evaluation System
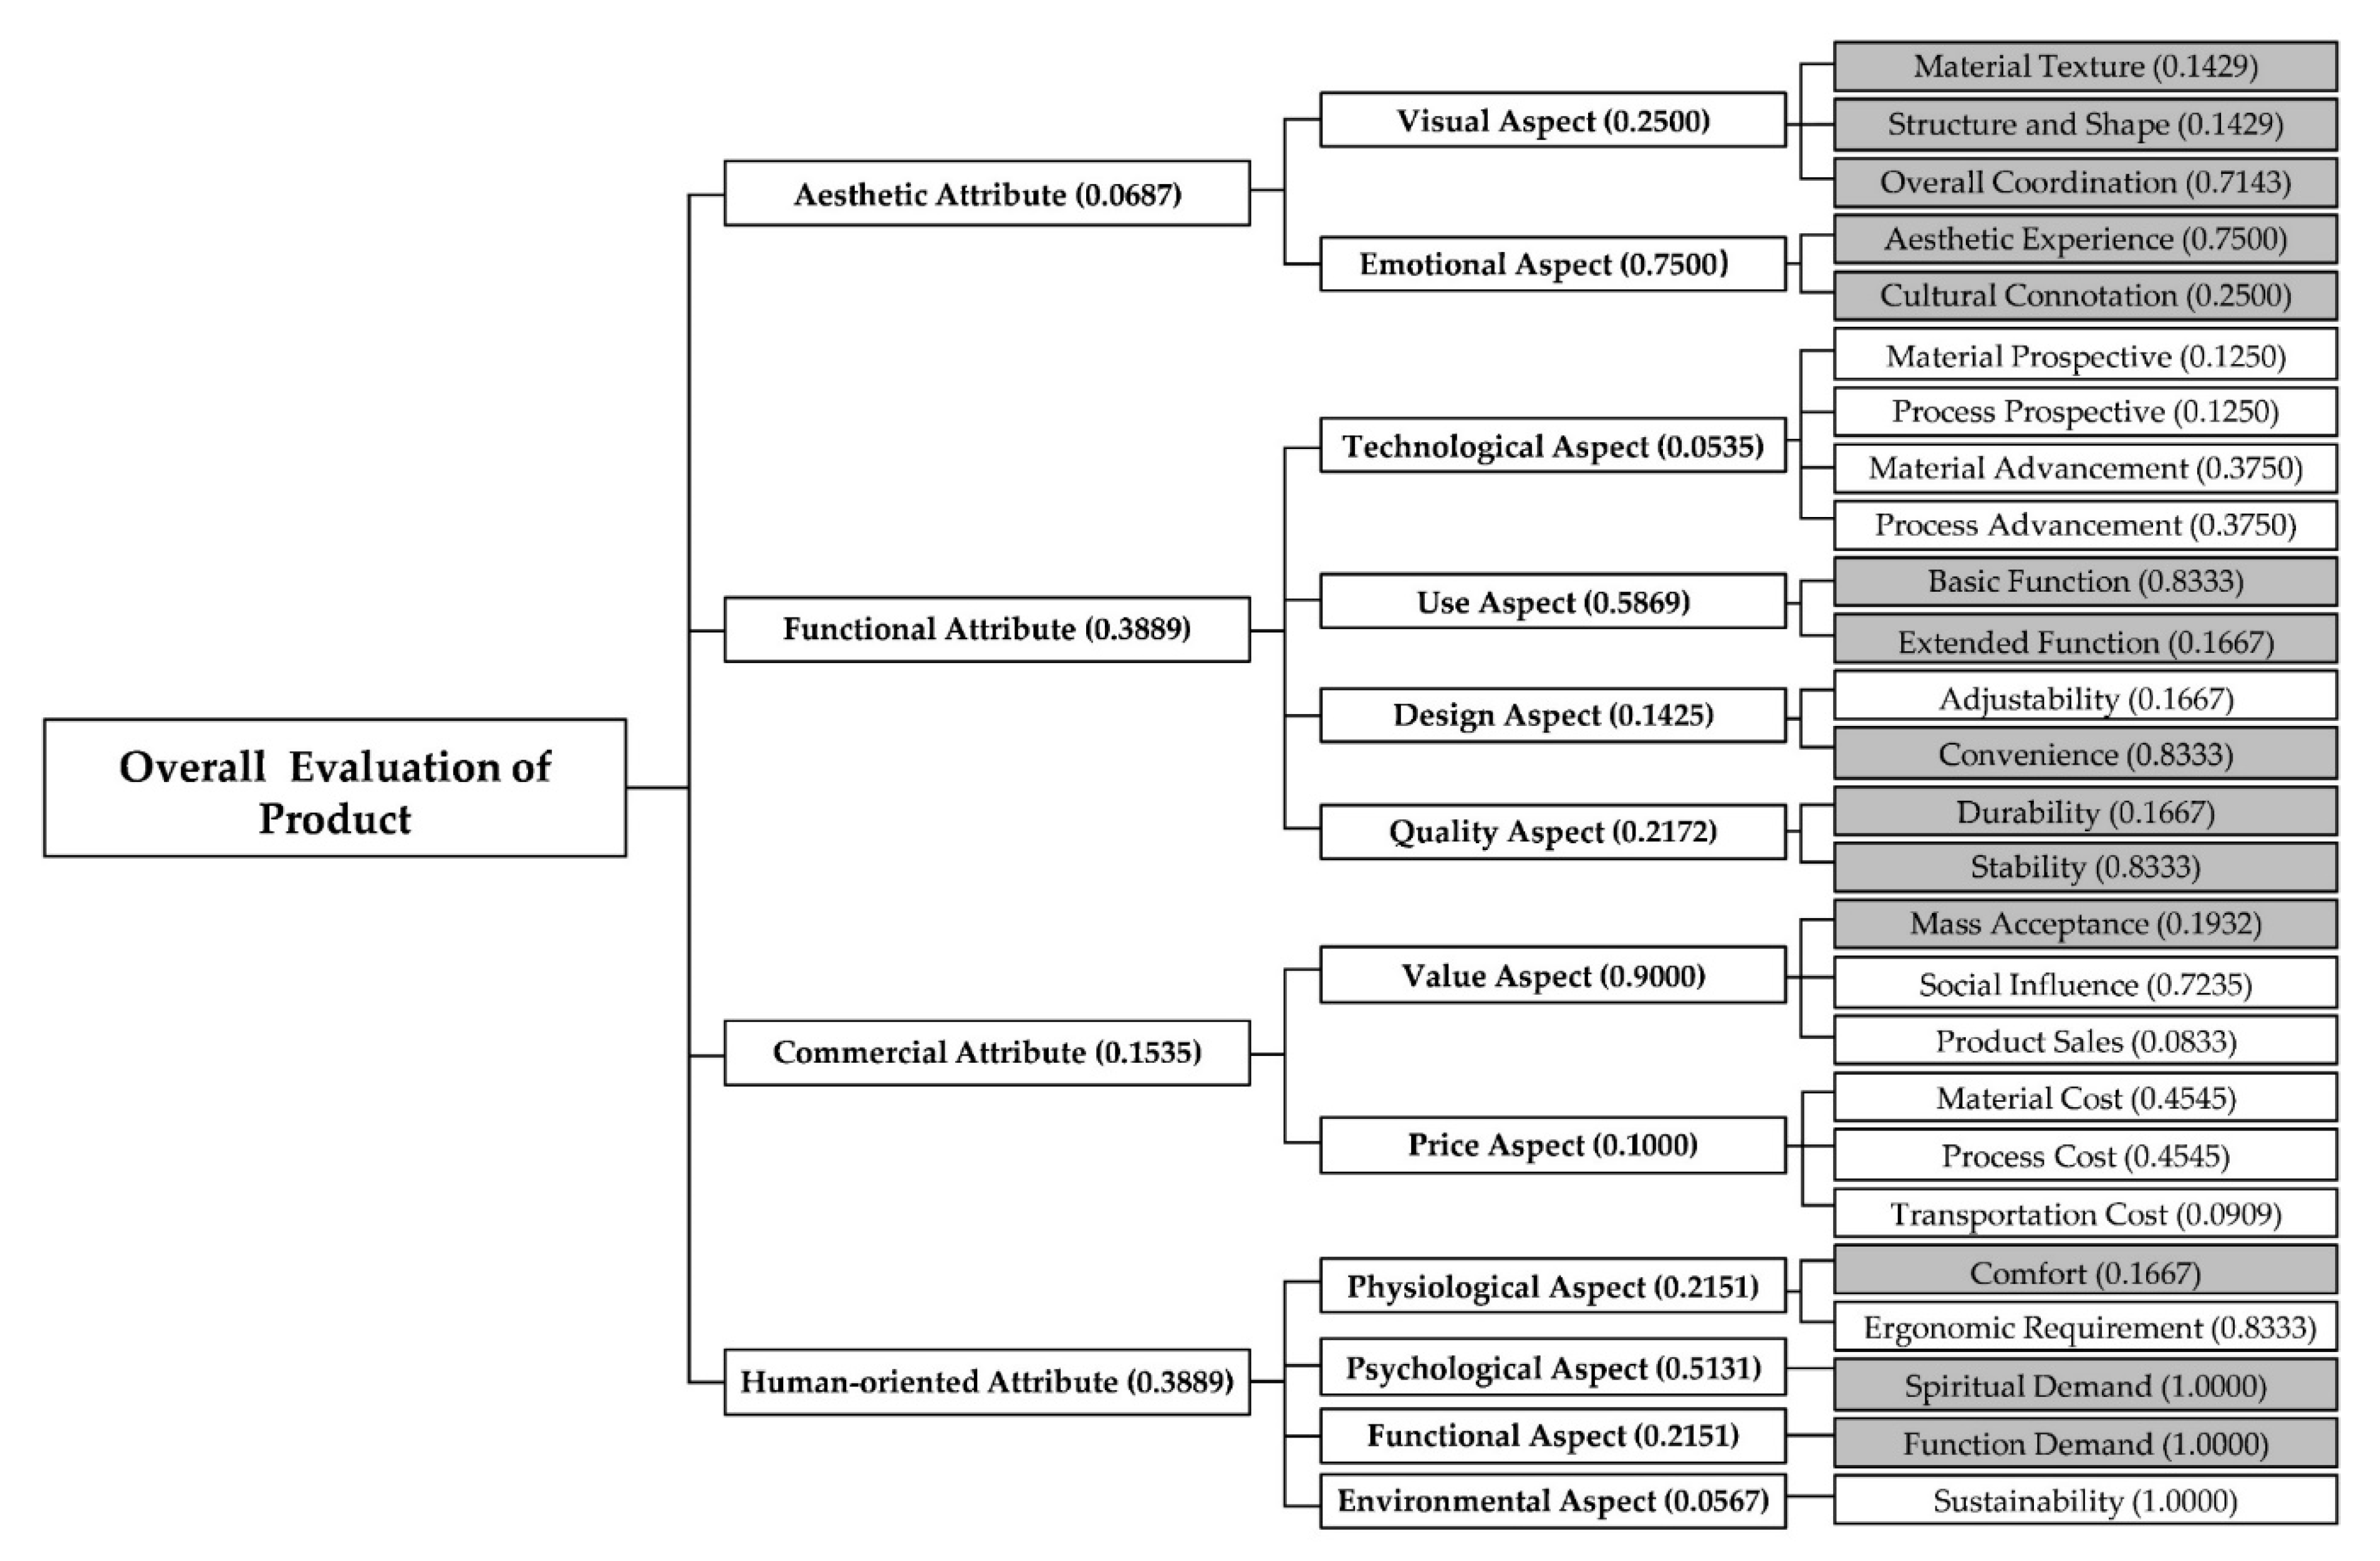
3.1. Overall Product Evaluation Framework
3.2. Weight Distribution of Each Level
3.3. Subjective Product Evaluation System
4. Experimental Verification
4.1. Experimental Samples Selection and Processing
4.2. Experiment Implementation
4.3. Data Processing and Analysis
4.3.1. Subjective Evaluations of Experimental Samples
4.3.2. Effects from Social Factors on Subjective Evaluation
4.3.3. Verification Analysis
5. Conclusions
Supplementary Materials
Author Contributions
Funding
Conflicts of Interest
References
- Nagamachi, M. Kansei Engineering: A new ergonomic consumer-oriented technology for product development. Int. J. Ind. Ergonom. 1995, 15, 3–11. [Google Scholar] [CrossRef]
- Nagamachi, M. Kansei Engineering as a powerful consumer-oriented technology for product development. Appl. Ergon. 2002, 33, 289–294. [Google Scholar] [CrossRef]
- Luo, S.; Pan, Y. Review of theory, key technologies and its application of perceptual image in product design. Chin. J. Mech. Eng. 2007, 3, 8–13. [Google Scholar] [CrossRef]
- Van der Bijl-Brouwer, M.; Dorst, K. Advancing the strategic impact of human-centered design. Design Stud. 2017, 53, 1–23. [Google Scholar] [CrossRef]
- Oliver, R.L. Cognitive, affective, and attribute bases of the satisfaction response. J. Consum. Res. 1993, 20, 3. [Google Scholar] [CrossRef]
- Mcdonagh, D.; Bruseberg, A.; Haslam, C. Visual product evaluation: Exploring users′ emotional relationships with products. Appl. Ergon. 2002, 33, 231–240. [Google Scholar] [CrossRef]
- Levy, P. Beyond Kansei Engineering: The emancipation of kansei design. Int. J. Des. 2013, 7, 83–94. [Google Scholar]
- Rajasekera, J.; Karunasena, H. Apparel design optimization for global market: Kansei Engineering preference model. Int. J. Affect. Eng. 2015, 14, 119–126. [Google Scholar] [CrossRef]
- Chang, Y.; Chen, C. Kansei assessment of the constituent elements and the overall interrelations in car steering wheel design. Int. J. Ind. Ergon. 2016, 56, 97–105. [Google Scholar] [CrossRef]
- Rosyidi, C.N.; Hermayanti, I.; Laksono, P.W.; Purwaningrum, L.; Susmartini, S.; Murakic, S. Desk and chair design of elementary school using Kansei Engineering and conjoint analysis. J. Eng. Appl. Sci. 2016, 11, 2514–2519. [Google Scholar]
- Razza, B.; Paschoarelli, L.C. Affective perception of disposable razors: A Kansei Engineering approach. Procedia Manuf. 2015, 3, 6228–6236. [Google Scholar] [CrossRef][Green Version]
- Guo, F.; Liu, W.L.; Cao, Y.; Liu, F.T.; Li, M.L. Optimization design of a webpage based on Kansei Engineering. Hum. Factor Ergon. Manuf. 2016, 26, 110–126. [Google Scholar] [CrossRef]
- Nakai, A.; Pyae, A.; Luimula, M.; Hongo, S.; Vuola, H.; Smed, J. Investigating the effects of motion-based Kinect game system on user cognition. J. Multimodal User 2015, 9, 403–411. [Google Scholar] [CrossRef]
- Carreira, R.; Patrício, L.; Jorge, R.N.; Magee, C.L. Development of an extended Kansei Engineering method to incorporate experience requirements in product–service system design. J. Eng. Des. 2013, 24, 738–764. [Google Scholar] [CrossRef]
- Matsubara, Y.; Shiraki, W.; Yamasaki, T.; Fujie, T.; Wilson, J. Kansei Engineering approach to public constructions design. Jpn. J. Ergon. 2002, 38, 102–103. [Google Scholar] [CrossRef]
- Mardani, A.; Jusoh, A.; MD Nor, K.; Khalifah, Z.; Zakwan, N.; Valipour, A. Multiple criteria decision-making techniques and their applications–A review of the literature from 2000 to 2014. Econ. Res.-Ekonomska Istraživanja 2015, 28, 516–571. [Google Scholar] [CrossRef]
- Kittidecha, C.; Marasinghe, A.C.; Yamada, K. Application of affective engineering and fuzzy analytical hierarchy process in thai ceramic manufacturing. Int. J. Affect. Eng. 2016, 15, 325–334. [Google Scholar] [CrossRef]
- Vaidya, O.S.; Kumar, S. Analytic hierarchy process: An overview of applications. Eur. J. Oper. Res. 2006, 169, 1–29. [Google Scholar] [CrossRef]
- Emrouznejad, A.; Marra, M. The state of the art development of AHP (1979–2017): A literature review with a social network analysis. Int. J. Prod. Res. 2017, 55, 6653–6675. [Google Scholar] [CrossRef]
- Kabir, G.; Sadiq, R.; Tesfamariam, S. A review of multi-criteria decision-making methods for infrastructure management. Struct. Infrastruct. Eng. 2014, 10, 1176–1210. [Google Scholar] [CrossRef]
- Javalgi, R.G.; Armacost, R.L.; Hosseini, J.C. Using the analytic hierarchy process for bank management: Analysis of consumer bank selection decisions. J. Bus. Res. 1989, 19, 33–49. [Google Scholar] [CrossRef]
- Ball, J.; Srinivasan, V.C. Using the analytic hierarchy process in house selection. J. Real Estate Financ. 1994, 9, 69–85. [Google Scholar] [CrossRef]
- Saaty, T.L.; Vargas, L.G. Diagnosis with dependent symptoms: Bayes Theorem and the analytic hierarchy process. Oper. Res. 1998, 46, 491–502. [Google Scholar] [CrossRef]
- Castro, F.; Caccamo, L.P.; Carter, K.J.; Erickson, B.A.; Ruiz, C.A. Sequential test selection in the analysis of abdominal pain. Med. Decis. Mak. 1996, 16, 178–183. [Google Scholar] [CrossRef] [PubMed]
- Carter, K.J.R.N. Analysis of three decision-making methods. Med. Decis. Mak. 1999, 1, 49–57. [Google Scholar] [CrossRef] [PubMed]
- Sarkis, J.; Talluri, S. Evaluating and selecting e-commerce software and communication systems for a supply chain. Eur. J. Oper. Res. 2004, 159, 318–329. [Google Scholar] [CrossRef]
- Levary, R.R. Using the analytic hierarchy process to rank foreign suppliers based on supply risks. Comput. Ind. Eng. 2008, 55, 535–542. [Google Scholar] [CrossRef]
- Salgado, E.G.; Salomon, V.A.P.; Mello, C.H.P. Analytic hierarchy prioritisation of new product development activities for electronics manufacturing. Int. J. Prod. Res. 2012, 50, 4860–4866. [Google Scholar] [CrossRef]
- Razi, N.; Karatas, M. A multi-objective model for locating search and rescue boats. Eur J. Oper. Res. 2016, 254, 279–293. [Google Scholar] [CrossRef]
- Petiot, J.; Yannou, B. Measuring consumer perceptions for a better comprehension, specification and assessment of product semantics. Int. J. Ind. Ergon. 2004, 33, 507–525. [Google Scholar] [CrossRef]
- Zhu, Y. The form design of home service robots based on Kansei Engineering theory. Packag. Eng. 2015, 36, 50–54. [Google Scholar]
- Zhou, X.; Liang, H.; Dong, Z. A personalized recommendation model for online apparel shopping based on Kansei engineering. Int. J. Cloth. Sci. Tech. 2017, 29, 2–13. [Google Scholar] [CrossRef]
- Shuzhi, Y.; Hongni, G.; Wei, W.; Jue, Q.; Xiaowei, L.; Kang, L. Multi-image evaluation for human-machine interface based on Kansei engineering. J. Eng. Des. 2017, 24, 523–529. [Google Scholar]
- Hadiana, A. Interface Modeling for Mobile Learning Using Kansei Engineering and Analytical Hierarchy Process; IEEE: New York, NY, USA, 2017; pp. 153–157. [Google Scholar]
- Fevi, S.; Megat Hamdan, M.A.M.; Eqwan, R.; Nazmi, I. An analysis to determine the priority emotional design in Kansei Engineering by using the AHP approach in product development. Int. J. Eng. Manag. Res. 2018, 8, 151–156. [Google Scholar]
- Huda, C.N.; Hadiana, A. Kansei analysis using analytical hierarchy process. In ICOBEST-EBM 2019; Atlantis Press: Paris, France, 2020; pp. 218–223. [Google Scholar]
- Nagamachi, M. An image technology expert system and its application to design consultation. Int. J. Hum.-Comput. Int. 1991, 3, 267. [Google Scholar] [CrossRef]
- Qiufang, Z.; Zhenya, W.; Botao, F. An introduction of Kansei Engineering and it’s resarch status in Japan. Art Des. 2007, 4, 32–34. [Google Scholar]
- Osgood, C.E.; Suci, G.J.; Tannenbaum, P. The Measurement of Meaning; University of Illinois Press: Champaign, IL, USA, 1967; p. 360. [Google Scholar]
- Zhang, J. The diagnosis methods in planning and design (16)-SD method. Surv. Anal. LA 2004, 10, 57–61. [Google Scholar]
- Saaty, R.W. The analytic hierarchy process—What it is and how it is used. Math. Model. 1987, 9, 161–176. [Google Scholar] [CrossRef]
- Ishizaka, A.; Labib, A. Review of the main developments in the analytic hierarchy process. Expert Syst. Appl. 2011, 38, 14336–14345. [Google Scholar] [CrossRef]
- Saaty, T.L. A scaling method for priorities in hierarchical structures. J. Math. Psychol. 1977, 15, 234–281. [Google Scholar] [CrossRef]
- Quan, H.; Li, S.; Wei, H.; Hu, J. Personalized product evaluation based on GRA-TOPSIS and Kansei Engineering. Symmetry 2019, 11, 867. [Google Scholar] [CrossRef]
- Saaty, T.L. Response to holder′s comments on the analytic hierarchy process. J. Oper. Res. Soc. 1991, 42, 909–914. [Google Scholar] [CrossRef]
- Ishizaka, A. Advantages of clusters and pivots in AHP. In Proceedings of the 15th Mini EURO Conference, Coimbra, Portugal, 22–24 September 2004. [Google Scholar]
- Jordan, P.W. Designing Pleasurable Products: An. Introduction to the New Human Factors; Taylor& Francis: London, UK, 2000; p. 216. [Google Scholar]
- Norman, D.A. Emotional Design: Why We Love (or Hate) Everyday Things; Basic Books: New York, NY, USA, 2005; p. 272. [Google Scholar]
- Crilly, N.; Moultrie, J.; Clarkson, P.J. Seeing things: Consumer response to the visual domain in product design. Design Stud. 2004, 25, 547–577. [Google Scholar] [CrossRef]
- Crilly, N.; Moultrie, J.; Clarkson, P.J. Shaping things: Intended consumer response and the other determinants of product form. Design Stud. 2009, 30, 224–254. [Google Scholar] [CrossRef]


| Intensity of Importance | Definition |
|---|---|
| 1 | Equal importance |
| 3 | Weak importance of one over another |
| 5 | Essential or strong importance |
| 7 | Demonstrated importance |
| 9 | Absolute importance |
| 2, 4, 6, 8 | Intermediate values between the two adjacent judgments |
| n | 1 | 2 | 3 | 4 | 5 | 6 | 7 | 8 | 9 | 10 |
|---|---|---|---|---|---|---|---|---|---|---|
| RI | 0 | 0 | 0.52 | 0.89 | 1.12 | 1.24 | 1.36 | 1.41 | 1.46 | 1.49 |
| X1 | A1 | A2 | A3 |
| A1 | 1 | 1 | |
| A2 | 1 | 1 | |
| A3 | 5 | 5 | 1 |
| X2 | A4 | A5 |
| A4 | 1 | 3 |
| A5 | 1 |
| 1 | 1 | |||
| 1 | 1 | |||
| 3 | 3 | 1 | 1 | |
| 3 | 3 | 1 | 1 |
| X4 | A10 | A11 |
| A10 | 1 | 5 |
| A11 | 1 |
| X5 | A12 | A13 |
| A12 | 1 | |
| A13 | 5 | 1 |
| X6 | A14 | A15 |
| A14 | 1 | |
| A15 | 5 | 1 |
| X7 | A16 | A17 | A18 |
| A16 | 1 | ||
| A17 | 5 | 1 | |
| A18 | 1 |
| X8 | A19 | A20 | A21 |
| A19 | 1 | 1 | 5 |
| A20 | 1 | 1 | 5 |
| A21 | 1 |
| X9 | ||
| 1 | ||
| 1 | 1 |
| Y1 | X1 | X2 |
| X1 | 1 | |
| X2 | 3 | 1 |
| Y2 | X3 | X4 | X5 | X6 |
| X3 | 1 | |||
| X4 | 7 | 1 | 5 | 4 |
| X5 | 4 | 1 | ||
| X6 | 5 | 2 | 1 |
| Y3 | X7 | X8 |
| X7 | 1 | 9 |
| X8 | 1 |
| Y4 | X9 | X10 | X11 | X12 |
| X9 | 1 | 1 | 5 | |
| X10 | 3 | 1 | 3 | 6 |
| X11 | 1 | 1 | 5 | |
| X12 | 1 |
| Z | Y1 | Y2 | Y3 | Y4 |
| Y1 | 1 | |||
| Y2 | 5 | 1 | 1 | |
| Y3 | 3 | 1 | ||
| Y4 | 5 | 1 | 3 | 1 |
| Subjective Evaluation Index | Weight (Relative to Overall Subjective Evaluation) |
|---|---|
| Spiritual Demand (Human-oriented Attribute) | 0.2656 |
| Basic Function (Functional Attribute) | 0.2531 |
| Function Demand (Human-oriented Attribute) | 0.1113 |
| Stability (Functional Attribute) | 0.0937 |
| Convenience (Functional Attribute) | 0.0615 |
| Aesthetic Experience (Aesthetic Attribute) | 0.0514 |
| Extended Function (Functional Attribute) | 0.0506 |
| Mass Acceptance (Commercial Attribute) | 0.0354 |
| Durability (Functional Attribute) | 0.0187 |
| Comfort (Human-oriented Attribute) | 0.0186 |
| Cultural Connotation (Aesthetic Attribute) | 0.0171 |
| Overall Coordination (Aesthetic Attribute) | 0.0163 |
| Material Texture (Aesthetic Attribute) | 0.0033 |
| Structure and Shape (Aesthetic Attribute) | 0.0033 |
| Total | 1.0000 |
| Attribute | Aspect | Question of Subject Evaluation | |
|---|---|---|---|
| Aesthetic Attribute | Visual Aspect | Q01. What do you think of the material of this chair? | 1 2 3 4 5 |
| Q02. What do you think of the structural shape of this chair? | 1 2 3 4 5 | ||
| Q03. What do you think of the overall coordination of this chair? | 1 2 3 4 5 | ||
| Emotional Aspect | Q04. Does this chair give you a pleasant psychological feeling? | 1 2 3 4 5 | |
| Q05. What do you think of the style of this chair? | 1 2 3 4 5 | ||
| Functional Attribute | Use Aspect | Q06. What do you think of the basic function of this chair? | 1 2 3 4 5 |
| Q07. What do you think of the functional extensibility of this chair? | 1 2 3 4 5 | ||
| Design Aspect | Q08. What do you think of the convenience of using this chair? | 1 2 3 4 5 | |
| Quality Aspect | Q09. What do you think of the durability of this chair? | 1 2 3 4 5 | |
| Q10. What do you think of the stability of this chair? | 1 2 3 4 5 | ||
| Commercial Attribute | Value Aspect | Q11. Will you buy this chair if economic conditions permit? | 1 2 3 4 5 |
| Human-oriented Attribute | Physiological Aspect | Q12. What do you think of the comfort of this chair? | 1 2 3 4 5 |
| Psychological Aspect | Q13. Does this chair bring you spiritual satisfaction? | 1 2 3 4 5 | |
| Functional Aspect | Q14. Does this chair bring you functional satisfaction? | 1 2 3 4 5 |
| C01 | C02 | C03 | C04 | C05 | C06 | C07 | C08 | C09 | C10 | |
|---|---|---|---|---|---|---|---|---|---|---|
| Q01 | 3.04 | 3.21 | 4.20 | 3.63 | 3.57 | 3.89 | 3.14 | 4.11 | 3.23 | 3.92 |
| 1.144 | 1.038 | 0.819 | 1.018 | 1.066 | 1.016 | 1.111 | 0.936 | 1.193 | 1.088 | |
| Q02 | 2.93 | 3.03 | 3.90 | 3.68 | 3.63 | 3.85 | 3.38 | 3.68 | 3.64 | 3.71 |
| 1.172 | 1.100 | 0.883 | 1.084 | 1.018 | 1.032 | 1.143 | 1.042 | 1.207 | 1.057 | |
| Q03 | 3.03 | 3.21 | 3.82 | 3.68 | 3.56 | 4.04 | 3.20 | 3.78 | 3.59 | 3.65 |
| 1.169 | 1.101 | 0.984 | 0.976 | 0.968 | 0.918 | 1.088 | 0.998 | 1.211 | 1.026 | |
| Q04 | 2.54 | 2.82 | 3.87 | 3.57 | 3.47 | 3.78 | 3.11 | 3.74 | 3.32 | 3.85 |
| 1.099 | 1.101 | 0.991 | 1.066 | 1.139 | 1.114 | 1.069 | 1.063 | 1.307 | 0.965 | |
| Q05 | 3.46 | 3.35 | 3.87 | 3.65 | 3.68 | 3.68 | 3.60 | 3.55 | 3.77 | 3.70 |
| 1.302 | 1.242 | 1.013 | 1.015 | 1.094 | 1.134 | 1.219 | 1.067 | 1.292 | 1.049 | |
| Q06 | 2.95 | 3.20 | 4.02 | 3.69 | 3.54 | 4.02 | 3.24 | 4.33 | 3.12 | 3.92 |
| 1.149 | 0.991 | 0.856 | 0.927 | 0.970 | 0.894 | 1.015 | 0.746 | 1.031 | 0.846 | |
| Q07 | 2.77 | 2.92 | 3.46 | 3.11 | 2.98 | 3.38 | 3.04 | 3.78 | 2.90 | 3.88 |
| 1.175 | 1.108 | 0.911 | 0.983 | 1.064 | 1.172 | 1.074 | 1.020 | 1.165 | 1.052 | |
| Q08 | 2.20 | 3.00 | 3.36 | 3.27 | 3.54 | 3.90 | 3.09 | 3.59 | 3.42 | 3.03 |
| 1.002 | 1.085 | 1.038 | 1.086 | 1.128 | 1.065 | 1.132 | 1.238 | 1.146 | 1.059 | |
| Q09 | 3.12 | 3.10 | 3.46 | 3.35 | 3.05 | 4.01 | 3.01 | 3.99 | 3.35 | 3.74 |
| 1.290 | 1.155 | 1.057 | 1.037 | 0.970 | 0.863 | 1.090 | 0.888 | 1.233 | 0.964 | |
| Q10 | 3.56 | 3.34 | 3.58 | 3.23 | 3.16 | 4.21 | 3.04 | 3.95 | 2.91 | 4.15 |
| 1.267 | 1.128 | 1.096 | 1.096 | 0.981 | 0.823 | 1.074 | 1.037 | 1.226 | 0.999 | |
| Q11 | 1.97 | 2.30 | 3.56 | 2.99 | 3.00 | 3.57 | 2.75 | 3.64 | 2.65 | 3.41 |
| 1.187 | 1.188 | 1.318 | 1.321 | 1.274 | 1.284 | 1.244 | 1.140 | 1.328 | 1.273 | |
| Q12 | 2.11 | 2.84 | 4.05 | 3.42 | 3.58 | 3.58 | 3.10 | 4.43 | 2.69 | 4.11 |
| 0.948 | 1.003 | 0.935 | 0.978 | 1.076 | 1.023 | 1.146 | 0.791 | 1.161 | 0.960 | |
| Q13 | 2.67 | 2.74 | 3.82 | 3.26 | 3.23 | 3.63 | 3.02 | 3.78 | 2.99 | 3.80 |
| 1.155 | 1.281 | 1.039 | 1.143 | 1.126 | 1.189 | 1.135 | 0.987 | 1.243 | 0.969 | |
| Q14 | 2.59 | 2.80 | 3.81 | 3.42 | 3.47 | 3.81 | 3.13 | 4.29 | 2.97 | 3.87 |
| 1.192 | 1.077 | 0.988 | 1.023 | 0.993 | 0.953 | 1.098 | 0.834 | 1.149 | 1.024 |
| Sample | Question | Gender | N | Mean Score | Std. Deviation | T | Comparison |
|---|---|---|---|---|---|---|---|
| C01 | Q02 | Male | 49 | 2.51 | 1.063 | −4.030 ** | 1 |
| Female | 42 | 3.43 | 1.107 | ||||
| Q03 | Male | 49 | 2.69 | 1.122 | −3.133 ** | 2 > 1 | |
| Female | 42 | 3.43 | 1.107 | ||||
| Q04 | Male | 49 | 2.27 | 0.908 | −2.646 * | 2 > 1 | |
| Female | 42 | 2.86 | 1.221 | ||||
| Q09 | Male | 49 | 2.73 | 1.303 | −3.245 ** | 2 > 1 | |
| Female | 42 | 3.57 | 1.129 | ||||
| C02 | Q09 | Male | 49 | 2.88 | 1.184 | −2.007 * | 2 > 1 |
| Female | 42 | 3.36 | 1.078 | ||||
| C04 | Q08 | Male | 49 | 3.51 | 1.063 | 2.286 * | 1 > 2 |
| Female | 42 | 3.00 | 1.059 |
| Sample | Evaluation Attribute | Sum of Squares | df | Age | N | Mean Score | Std. Deviation | F | Comparison | |
|---|---|---|---|---|---|---|---|---|---|---|
| C03 | Commercial Attribute (Mean score of Q11) | Between groups | 16.988 | 2 | 1 | 75 | 3.76 | 1.228 | 5.361 ** | 1 > 2, 1 > 3 |
| Within groups | 139.430 | 88 | 2 | 8 | 2.63 | 1.188 | ||||
| Total | 156.418 | 90 | 3 | 8 | 2.63 | 1.598 | ||||
| Human-oriented Attribute (Mean score of Q12–Q14) | Between groups | 7.629 | 2 | 1 | 75 | 4.03 | 0.793 | 5.350 ** | 1 > 2, 1 > 3 | |
| Within groups | 62.747 | 88 | 2 | 8 | 3.25 | 1.020 | ||||
| Total | 70.376 | 90 | 3 | 8 | 3.29 | 1.133 | ||||
| C05 | Aesthetic Attribute (Mean score of Q01–Q05) | Between groups | 7.628 | 2 | 1 | 75 | 3.70 | 0.829 | 5.133 ** | 1 > 3 |
| Within groups | 65.384 | 88 | 2 | 8 | 3.30 | 0.807 | ||||
| Total | 73.012 | 90 | 3 | 8 | 2.73 | 1.190 | ||||
| Functional Attribute (Mean score of Q06–Q10) | Between groups | 5.006 | 2 | 1 | 75 | 3.33 | 0.767 | 3.993 * | 1 > 3 | |
| Within groups | 55.159 | 88 | 2 | 8 | 3.30 | 0.676 | ||||
| Total | 60.165 | 90 | 3 | 8 | 2.50 | 1.095 | ||||
| Human-oriented Attribute (Mean score of Q12–Q14) | Between groups | 10.125 | 2 | 1 | 75 | 3.56 | 0.892 | 6.155 ** | 1 > 3 | |
| Within groups | 72.383 | 88 | 2 | 8 | 3.17 | 0.816 | ||||
| Total | 82.508 | 90 | 3 | 8 | 2.42 | 1.123 | ||||
| C07 | Functional Attribute (Mean score of Q06–Q10) | Between groups | 5.776 | 2 | 1 | 75 | 3.16 | 0.829 | 3.851 * | 1 > 3, 2 > 3 |
| Within groups | 65.995 | 88 | 2 | 8 | 3.20 | 1.009 | ||||
| Total | 71.771 | 90 | 3 | 8 | 2.28 | 1.069 | ||||
| C09 | Functional Attribute (Mean score of Q06–Q10) | Between groups | 8.962 | 2 | 1 | 75 | 3.28 | 0.873 | 5.252 ** | 1 > 3 |
| Within groups | 75.077 | 88 | 2 | 8 | 2.63 | 1.000 | ||||
| Total | 84.040 | 90 | 3 | 8 | 2.33 | 1.296 | ||||
| C10 | Functional Attribute (Mean score of Q06–Q10) | Between groups | 4.299 | 2 | 1 | 75 | 3.85 | 0.657 | 3.913 * | 1 > 3 |
| Within groups | 48.346 | 88 | 2 | 8 | 3.30 | 1.176 | ||||
| Total | 52.645 | 90 | 3 | 8 | 3.25 | 0.978 |
| Sample | Evaluation Attribute | Sum of Squares | df | Major Background | N | Mean Score | Std. Deviation | F | Comparison | |
|---|---|---|---|---|---|---|---|---|---|---|
| C01 | Functional Attribute (Mean score of Q06–Q10) | Between groups | 5.682 | 2 | 1 | 41 | 2.64 | 0.941 | 3.793 * | 3 > 1 |
| Within groups | 65.916 | 88 | 2 | 3 | 3.27 | 0.231 | ||||
| Total | 71.598 | 90 | 3 | 47 | 3.14 | 0.813 | ||||
| C02 | Aesthetic Attribute (Mean score of Q01–Q05) | Between groups | 11.656 | 2 | 1 | 41 | 3.44 | 0.895 | 7.489 ** | 1 > 2, 1 > 3, 2 < 3 |
| Within groups | 68.476 | 88 | 2 | 3 | 1.73 | 0.702 | ||||
| Total | 80.132 | 90 | 3 | 47 | 2.94 | 0.878 | ||||
| Commercial Attribute (Mean score of Q11) | Between groups | 18.489 | 2 | 1 | 41 | 2.78 | 1.194 | 7.498 ** | 1 > 2, 1 > 3 | |
| Within groups | 108.500 | 88 | 2 | 3 | 1.33 | 0.577 | ||||
| Total | 126.989 | 90 | 3 | 47 | 1.94 | 1.051 | ||||
| Human-oriented Attribute (Mean score of Q12–Q14) | Between groups | 12.439 | 2 | 1 | 41 | 3.16 | 0.882 | 7.272 ** | 1 > 2, 1 > 3 | |
| Within groups | 75.261 | 88 | 2 | 3 | 1.67 | 0.667 | ||||
| Total | 87.700 | 90 | 3 | 47 | 2.54 | 0.970 | ||||
| C03 | Aesthetic Attribute (Mean score of Q01–Q05) | Between groups | 4.480 | 2 | 1 | 41 | 4.17 | 0.719 | 3.509 * | 1 > 3 |
| Within groups | 56.178 | 88 | 2 | 3 | 4.00 | 0.917 | ||||
| Total | 60.658 | 90 | 3 | 47 | 3.72 | 0.857 | ||||
| Commercial Attribute (Mean score of Q11) | Between groups | 12.444 | 2 | 1 | 41 | 3.95 | 1.224 | 3.803 * | 1 > 3 | |
| Within groups | 143.973 | 88 | 2 | 3 | 2.67 | 2.082 | ||||
| Total | 156.418 | 90 | 3 | 47 | 3.28 | 1.280 | ||||
| Human-oriented Attribute (Mean score of Q12–Q14) | Between groups | 5.618 | 2 | 1 | 41 | 4.17 | 0.810 | 3.817 * | 1 > 3 | |
| Within groups | 64.758 | 88 | 2 | 3 | 3.56 | 0.770 | ||||
| Total | 70.376 | 90 | 3 | 47 | 3.68 | 0.901 | ||||
| C06 | Aesthetic Attribute (Mean score of Q01–Q05) | Between groups | 5.855 | 2 | 1 | 41 | 4.12 | 0.838 | 3.590 * | 1 > 3 |
| Within groups | 71.772 | 88 | 2 | 3 | 3.33 | 0.577 | ||||
| Total | 77.627 | 90 | 3 | 47 | 3.64 | 0.967 | ||||
| Functional Attribute (Mean score of Q06–Q10) | Between groups | 3.396 | 2 | 1 | 41 | 4.12 | 0.701 | 3.145 * | 1 > 3 | |
| Within groups | 47.511 | 88 | 2 | 3 | 3.60 | 0.200 | ||||
| Total | 50.907 | 90 | 3 | 47 | 3.74 | 0.777 | ||||
| Commercial Attribute (Mean score of Q11) | Between groups | 17.098 | 2 | 1 | 41 | 3.98 | 1.214 | 5.734 ** | 1 > 2, 1 > 3 | |
| Within groups | 131.188 | 88 | 2 | 3 | 2.00 | 1.732 | ||||
| Total | 148.286 | 90 | 3 | 47 | 3.32 | 1.200 | ||||
| C07 | Commercial Attribute (Mean score of Q11) | Between groups | 10.513 | 2 | 1 | 41 | 3.12 | 1.122 | 3.595 * | 1 > 3 |
| Within groups | 128.674 | 88 | 2 | 3 | 2.33 | 1.528 | ||||
| Total | 139.187 | 90 | 3 | 47 | 2.45 | 1.265 | ||||
| C08 | Aesthetic Attribute (Mean score of Q01-Q05) | Between groups | 4.369 | 2 | 1 | 41 | 3.72 | 0.761 | 3.187 * | 1 > 2 |
| Within groups | 60.316 | 88 | 2 | 3 | 2.67 | 0.306 | ||||
| Total | 64.686 | 90 | 3 | 47 | 3.89 | 0.896 | ||||
| Commercial Attribute (Mean score of Q11) | Between groups | 12.252 | 2 | 1 | 41 | 3.76 | 1.090 | 5.145 ** | 1 > 2, 2 < 3 | |
| Within groups | 104.781 | 88 | 2 | 3 | 1.67 | 0.577 | ||||
| Total | 117.033 | 90 | 3 | 47 | 3.66 | 1.109 | ||||
| C10 | Commercial Attribute (Mean score of Q11) | Between groups | 12.308 | 2 | 1 | 41 | 3.78 | 1.037 | 4.052 * | 1 > 3 |
| Within groups | 133.649 | 88 | 2 | 3 | 2.33 | 1.528 | ||||
| Total | 145.956 | 90 | 3 | 47 | 3.15 | 1.367 | ||||
| Human-oriented Attribute (Mean score of Q12–Q14) | Between groups | 6.048 | 2 | 1 | 41 | 4.21 | 0.694 | 4.223 * | 1 > 3 | |
| Within groups | 63.019 | 88 | 2 | 3 | 3.67 | 0.577 | ||||
| Total | 69.067 | 90 | 3 | 47 | 3.70 | 0.968 |
| Sample | Question | Sum of Squares | df | Education Background | N | Mean Score | Std. Deviation | F | Comparison | |
|---|---|---|---|---|---|---|---|---|---|---|
| C01 | Q07 | Between groups | 11.297 | 2 | 1 | 25 | 3.28 | 1.208 | 4.404 * | 1 > 2 |
| Within groups | 112.857 | 88 | 2 | 60 | 2.52 | 1.049 | ||||
| Total | 124.154 | 90 | 3 | 6 | 3.17 | 1.602 | ||||
| Q08 | Between groups | 10.110 | 2 | 1 | 25 | 2.24 | 1.052 | 4.750 * | 1 < 3, 2 < 3 | |
| Within groups | 139.560 | 88 | 2 | 60 | 2.07 | 0.841 | ||||
| Total | 149.670 | 90 | 3 | 6 | 3.33 | 1.633 | ||||
| Q11 | Between groups | 9.484 | 2 | 1 | 25 | 1.80 | 1.041 | 3.554 * | 1 < 3, 2 < 3 | |
| Within groups | 117.417 | 88 | 2 | 60 | 1.92 | 1.139 | ||||
| Total | 126.901 | 90 | 3 | 6 | 3.17 | 1.722 | ||||
| Q12 | Between groups | 13.668 | 2 | 1 | 25 | 2.20 | 0.764 | 8.945 ** | 1 < 3, 2 < 3 | |
| Within groups | 67.233 | 88 | 2 | 60 | 1.93 | 0.841 | ||||
| Total | 80.901 | 90 | 3 | 6 | 3.50 | 1.517 | ||||
| Q14 | Between groups | 10.949 | 2 | 1 | 25 | 2.68 | 1.108 | 4.117 * | 1 < 3, 2 < 3 | |
| Within groups | 117.007 | 88 | 2 | 60 | 2.43 | 1.125 | ||||
| Total | 127.956 | 90 | 3 | 6 | 3.83 | 1.602 | ||||
| C02 | Q09 | Between groups | 8.710 | 2 | 1 | 25 | 3.60 | 1.291 | 3.440 * | 1 > 2 |
| Within groups | 111.400 | 88 | 2 | 60 | 2.90 | 1.020 | ||||
| Total | 120.110 | 90 | 3 | 6 | 3.00 | 1.414 | ||||
| C03 | Q08 | Between groups | 12.160 | 2 | 1 | 25 | 3.88 | 1.054 | 6.304 * | 1 > 2 |
| Within groups | 84.873 | 88 | 2 | 60 | 3.10 | 0.969 | ||||
| Total | 97.033 | 90 | 3 | 6 | 3.83 | 0.753 | ||||
| C04 | Q05 | Between groups | 7.974 | 2 | 1 | 25 | 4.08 | 0.909 | 4.139 * | 1 > 2, 1 > 3 |
| Within groups | 84.773 | 88 | 2 | 60 | 3.53 | 0.982 | ||||
| Total | 92.747 | 90 | 3 | 6 | 3.00 | 1.265 | ||||
| Q07 | Between groups | 8.334 | 2 | 1 | 25 | 3.60 | 0.913 | 4.668 * | 1 > 2 | |
| Within groups | 78.567 | 88 | 2 | 60 | 2.93 | 0.918 | ||||
| Total | 86.901 | 90 | 3 | 6 | 2.83 | 1.329 | ||||
| C05 | Q04 | Between groups | 10.141 | 2 | 1 | 25 | 3.88 | 0.971 | 4.188 * | 1 > 3 |
| Within groups | 106.540 | 88 | 2 | 60 | 3.40 | 1.123 | ||||
| Total | 116.681 | 90 | 3 | 6 | 2.50 | 1.378 | ||||
| Q06 | Between groups | 7.659 | 2 | 1 | 25 | 3.88 | 1.013 | 4.379 * | 1 > 3, 2 > 3 | |
| Within groups | 76.957 | 88 | 2 | 60 | 3.48 | 0.854 | ||||
| Total | 84.615 | 90 | 3 | 6 | 2.67 | 1.366 | ||||
| Q07 | Between groups | 11.713 | 2 | 1 | 25 | 3.56 | 0.961 | 5.711 ** | 1 > 2 | |
| Within groups | 90.243 | 88 | 2 | 60 | 2.75 | 0.968 | ||||
| Total | 101.956 | 90 | 3 | 6 | 2.83 | 1.602 | ||||
| Q14 | Between groups | 6.765 | 2 | 1 | 25 | 3.80 | 0.957 | 3.634 * | 1 > 3 | |
| Within groups | 81.917 | 88 | 2 | 60 | 3.42 | 0.926 | ||||
| Total | 88.681 | 90 | 3 | 6 | 2.67 | 1.366 | ||||
| C06 | Q07 | Between groups | 9.888 | 2 | 1 | 25 | 3.80 | 1.225 | 3.828 * | 1 > 2 |
| Within groups | 113.650 | 88 | 2 | 60 | 3.15 | 1.117 | ||||
| Total | 123.538 | 90 | 3 | 6 | 4.00 | 0.894 | ||||
| C07 | Q07 | Between groups | 7.818 | 2 | 1 | 25 | 3.52 | 1.005 | 3.583 * | 1 > 2 |
| Within groups | 96.007 | 88 | 2 | 60 | 2.87 | 0.999 | ||||
| Total | 103.824 | 90 | 3 | 6 | 2.83 | 1.602 | ||||
| C09 | Q01 | Between groups | 10.214 | 2 | 1 | 25 | 3.72 | 1.021 | 3.810 * | 1 > 2, 1 > 3 |
| Within groups | 117.940 | 88 | 2 | 60 | 3.10 | 1.189 | ||||
| Total | 128.154 | 90 | 3 | 6 | 2.50 | 1.378 | ||||
| Q05 | Between groups | 10.337 | 2 | 1 | 25 | 4.20 | 1.041 | 3.253 * | 1 > 3 | |
| Within groups | 139.817 | 88 | 2 | 60 | 3.68 | 1.295 | ||||
| Total | 150.154 | 90 | 3 | 6 | 2.83 | 1.722 | ||||
| Q06 | Between groups | 10.477 | 2 | 1 | 25 | 3.64 | 0.995 | 5.411 ** | 1 > 2, 1 > 3 | |
| Within groups | 85.193 | 88 | 2 | 60 | 2.97 | 0.938 | ||||
| Total | 95.670 | 90 | 3 | 6 | 2.50 | 1.378 | ||||
| Q07 | Between groups | 11.770 | 2 | 1 | 25 | 3.48 | 1.005 | 4.693 * | 1 > 2 | |
| Within groups | 110.340 | 88 | 2 | 60 | 2.70 | 1.139 | ||||
| Total | 122.110 | 90 | 3 | 6 | 2.50 | 1.378 | ||||
| C10 | Q08 | Between groups | 7.068 | 2 | 1 | 25 | 3.40 | 0.957 | 3.314 * | 1 > 2 |
| Within groups | 93.833 | 88 | 2 | 60 | 2.83 | 1.092 | ||||
| Total | 100.901 | 90 | 3 | 6 | 3.50 | 0.548 |
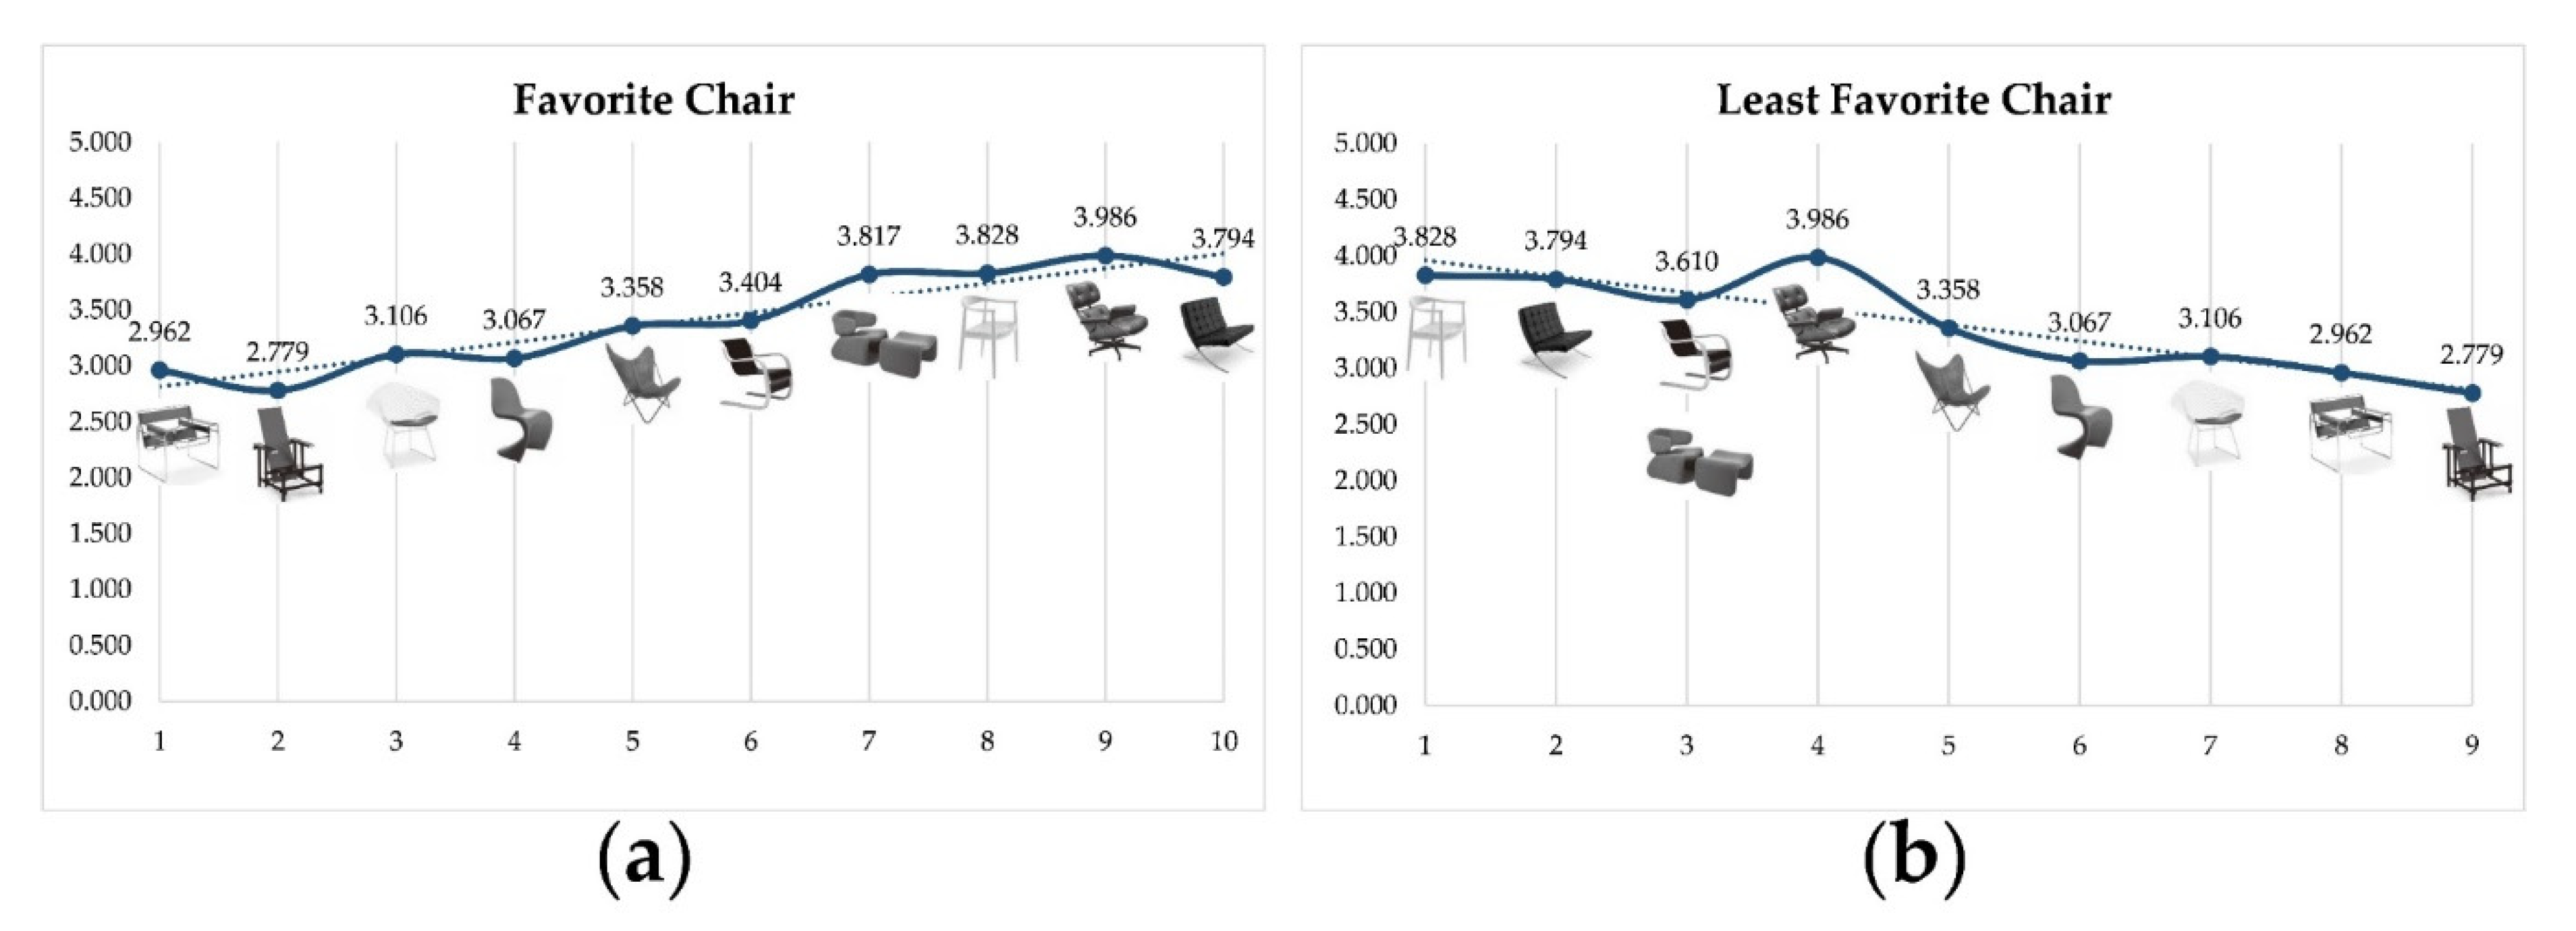
| Experimental Sample | Overall Subject Evaluation |
|---|---|
| C01 | 2.779 |
| C02 | 2.962 |
| C03 | 3.794 |
| C04 | 3.404 |
| C05 | 3.358 |
| C06 | 3.828 |
| C07 | 3.106 |
| C08 | 3.986 |
| C09 | 3.067 |
| C10 | 3.817 |
© 2020 by the authors. Licensee MDPI, Basel, Switzerland. This article is an open access article distributed under the terms and conditions of the Creative Commons Attribution (CC BY) license (http://creativecommons.org/licenses/by/4.0/).
Share and Cite
Zuo, Y.; Wang, Z. Subjective Product Evaluation System Based on Kansei Engineering and Analytic Hierarchy Process. Symmetry 2020, 12, 1340. https://doi.org/10.3390/sym12081340
Zuo Y, Wang Z. Subjective Product Evaluation System Based on Kansei Engineering and Analytic Hierarchy Process. Symmetry. 2020; 12(8):1340. https://doi.org/10.3390/sym12081340
Chicago/Turabian StyleZuo, Yaxue, and Zhenya Wang. 2020. "Subjective Product Evaluation System Based on Kansei Engineering and Analytic Hierarchy Process" Symmetry 12, no. 8: 1340. https://doi.org/10.3390/sym12081340
APA StyleZuo, Y., & Wang, Z. (2020). Subjective Product Evaluation System Based on Kansei Engineering and Analytic Hierarchy Process. Symmetry, 12(8), 1340. https://doi.org/10.3390/sym12081340