Brief Report

Remaining Useful Life Prediction of an IGBT Module in Electric Vehicles Statistical Analysis

1
Hubei Key Laboratory of Power System Design and Test for Electrical Vehicle, Hubei University of Arts and Science, Xiangyang 441053, China
2
School of Automotive and Traffic Engineering, Hubei University of Arts and Science, Xiangyang 441053, China
3
Dongfeng Xiangyang Touring CAR CO, LTD, Xiangyang 441004, China
4
School of Mechanical, Materials, Mechatronic and Biomedical Engineering, University of Wollongong, Wollongong NSW 2522, Australia
*
Authors to whom correspondence should be addressed.
Symmetry 2020, 12(8), 1325; https://doi.org/10.3390/sym12081325
Submission received: 2 July 2020 / Revised: 3 August 2020 / Accepted: 5 August 2020 / Published: 8 August 2020
(This article belongs to the Special Issue Symmetry in Mechanical Engineering Ⅱ)

Abstract

:
The whole life cycle of an insulated gate bipolar transistor (IGBT) is a kind of asymmetry process, while the whole life cycles of a set of IGBTs can be regarded as a symmetry process. Modelling these symmetry characteristics of the IGBT life cycles enables the improvement of the remaining useful life (RUL) prediction performance. For this purpose, based on the key failure mechanism of IGBT in electric vehicles, a new method for estimating the RUL of an IGBT module is proposed based on the two-stress acceleration synthesis environment of junction temperature and vibration. The maximum likelihood estimation (MLE) was employed to estimate the logarithmic standard deviation and covariance matrix. The Shapiro–Wilk (S–W) test was performed to investigate the satisfaction degree of the RUL of the IGBT module to the lognormal distribution. The accelerated life test datasets of the IGBT module were analyzed using the Weibull++ software. The analysis results demonstrate that the IGBT lifetime is confirmed to lognormal distribution, and the accelerated model accords with the generalized Eyring acceleration model. The proposed method can estimate IGBT RUL in a short time, which provides a certain technical reference for the reliability analysis of the IGBT module.

1. Introduction

Insulated gate bipolar transistor (IGBT) is the most widely used full-control voltage-driven power semiconductor device [1]. The IGBT has been used in various types of electrical energy conversion devices, switching power supply, new energy generation, electric vehicles, etc. [2,3,4]. IGBT has the advantages of simple drive, low switching loss, good thermal stability, high carrier current density and low on-state voltage drop [5,6,7,8]. With the rapid development of materials, welding, packaging and control technologies, the reliability of the IGBT module is also increasing. However, according to recent investigation [9], the IGBT module is one of the most frequent failure devices in power electronic equipment. In order to improve the reliability of power electronic equipment, it is necessary to monitor the reliability of the IGBT modules in a timely manner. Ideally, the life cycle of an IGBT can be symmetrical to any other IGBTs; however, due to differences in actual manufacturing quality and operating conditions, the life cycle of an IGBT is often asymmetrical to another one, which poses great difficulty in predicting the remaining useful life (RUL) of the IGBTs. The methods for IGBT reliability analysis can be divided into two categories: one is based on statistical methods [10,11] and the other one is based on the accelerated life test [12,13,14]. The statistics models aim to analyze the reliability of the IGBT modules through collected field data. However, field data of IGBT failure samples are always difficult to collect; so it is very difficult to perform statistical analysis for the IGBT reliability. The other one based on the accelerated life test can obtain sufficient failure data; as a result, subsequent analysis has been very popular with an astounding degree of success. Zhao et al. [15] put forward a method to predict the life of bonding lead based on shell temperature. This method can determine the service life of bonding lead according to the easily measured shell temperature, so as to reduce the failure rate and improve the reliability of IGBT modules. Lai et al. [16] used the IGBT module aging test to analyze the IGBT aging mechanism. The test results showed that the failure of the welding layer was the main failure mode due to alternating temperature. In the process of failure, the thermal resistance of the characteristic parameter satisfied the parameter degradation model, and the junction temperature difference is the key factor to IGBT failure. Lu et al. [17] proposed a multistep Bayesian method to estimate the RUL of IGBT modules under power cycle. The estimation results showed that the RUL distribution of the IGBT modules approximately conformed to the Weibull distribution. Luo et al. [18] made use of an advanced gate driver of a switchable grid resistor network to analyze the temperature wobble of the AC load current related junction in the IGBT modules. The simulation and experiment results showed that the advanced gate driver could change the switching power loss according to the amplitude of the AC current and effectively reduce the junction temperature wobble associated with the maximum junction and AC load current. Hence, the service life of the equipment can be improved. Fang et al. [19] used the junction temperature tester to study the junction temperature of the IGBT module. The infrared imager was used to record the surface heat distribution of the IGBT module, and the thermal distribution field of the IGBT module was simulated and modeled by ANSYS and MATLAB. The simulation and experimental results showed that the highest temperature appeared at the chip and the connection between the chip and the lead in the temperature distribution diagram of the device. It was confirmed that the main factors affecting the reliability of the IGBT module were in the stripping and breaking of the lead caused by the overheating of the device. Choi et al. [20] used an advanced power cycle test to study the effect of the IGBT module junction temperature variation duration on its lifetime. The results showed that this effect had a significant impact on lifetime. Although much excellent work has been done to address the IGBT reliability analysis, there is still a long way to go to completely solve the IGBT reliability problem. For example, the joint analysis of the life distribution and reliability of the IGBT modules remains a challenge.
In this paper, the life distribution and reliability of the IGBT module were studied systematically. The logarithmic normal function was used to describe the life distribution of the IGBT module. Six sets of double stress accelerated life test data were analyzed by Weibull and maximum likelihood estimation (MLE). The reliability analysis shows favorable results, which provides a simple and practical method for IGBT reliability analysis.
The remainder of this paper is as follows. The fault mechanism analysis of the IGBT Module is presented in Section 2. Section 3 presents the RUL prediction model. Section 4 demonstrates the specific steps for the Shapiro–Wilk hypothesis test. Section 5 illustrates examples to perform qualitative analysis using Weibull++ software for six sets of IGBT life test data and the RUL estimation using the MLE covariance matrix. Finally, conclusions and discussions are given in Section 6.

2. IGBT Fault Mechanism Analysis

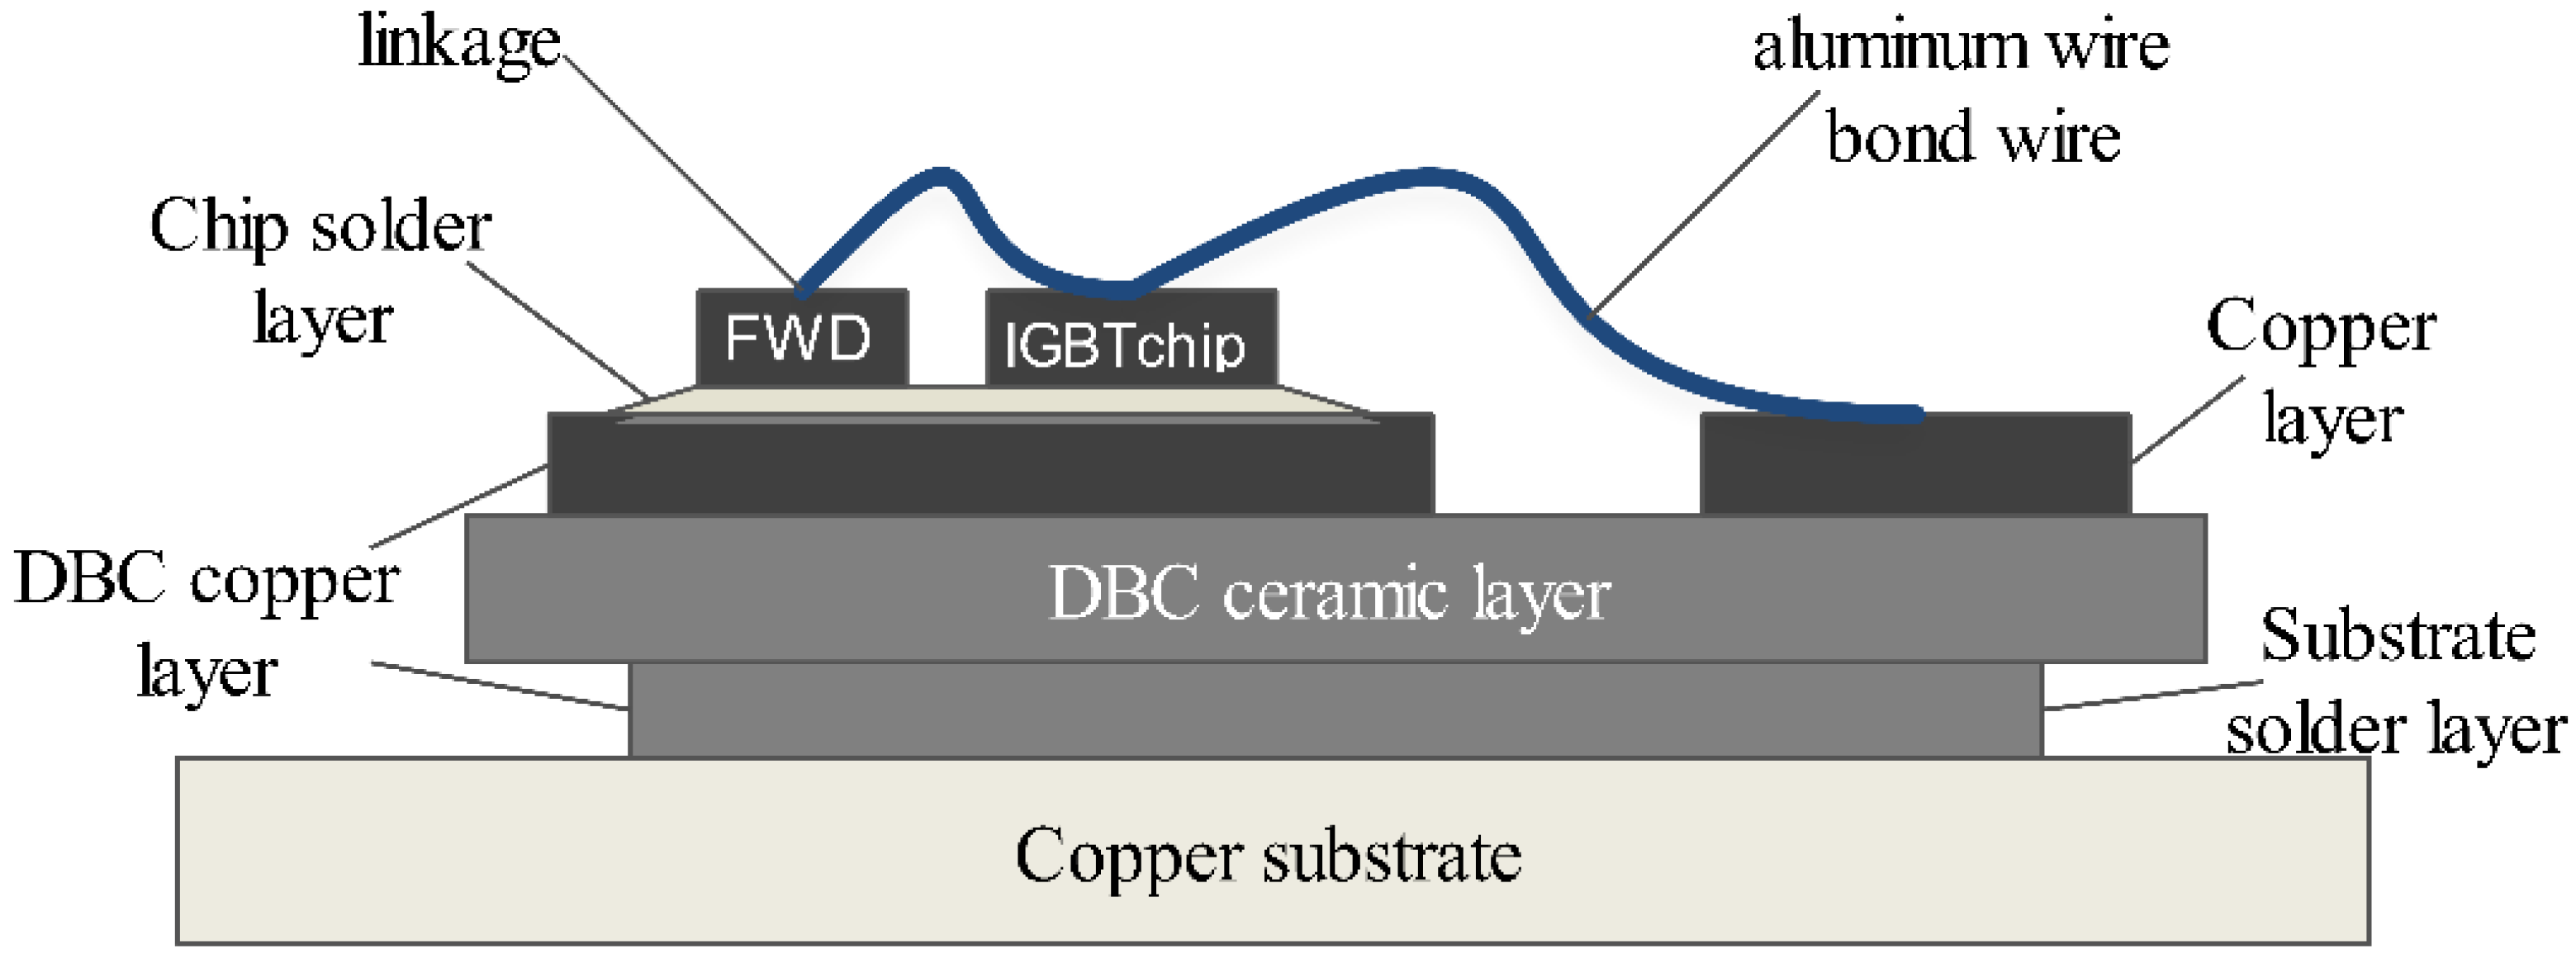
2.1. Structure of IGBT Module

The IGBT module has a multi-layer structure, each of which uses different materials and different coefficients of thermal expansion. The layering structure diagram is shown in Figure 1. It can be seen from the diagram that the IGBT module is mainly composed of an aluminum lead, a direct copper bonded (DCB) copper layer, a DCB ceramic layer, a pair of silicon chips and substrate, which are welded by a specific solder between the layers. The material, thickness, thermal conductivity, expansion coefficient, thermal resistance value, and heat capacity of each layer are all different. The material properties of the IGBT module of type GD50HFL120C1S 1200V/50A are shown in Table 1.

2.2. Failure Mechanism of IGBT Module

With the miniaturization of module encapsulation and the increase in switching frequency and current, the temperature of the actual working node increases day by day; while the performance and lifetime of the power device are closely related to the actual working node temperature. When the high node temperature passes through the module, the thermal stress is produced because of the different expansion coefficient of the material. When the module works under the thermal cycle impact for a long time, it will lead to the material fatigue and aging, which eventually leads to the module failure such as the welding layer fracture or shedding. The main heat source of the IGBT module is from the silicon chip. From Table 1 of the GD50HFL120C1S module, it can be seen that the node temperature Tj of the module is −40~150 °C. However, the thermal expansion coefficient of the welding layer between the silicon chip and its connected aluminum lead is quite different. The thermal expansion coefficient of aluminum lead is 22 × 10−6 K, the difference of the thermal expansion coefficient between the silicon chip and aluminum lead is 19 × 10−6 K, and the difference between the silicon chip and welding layer is 22 × 10−6 K. Subject to the high deference of the thermal expansion coefficient, the main failure modes of the IGBT modules are aluminum bonding lead shedding and the welding layer fatigue.

2.2.1. Aluminum Bonding Lead Shedding

The bonding lead is welded to the silicon chip and DBC copper layer through the bonding place, which is one of the weakest links in the IGBT module [21]. The failure of the aluminum bonding is caused by thermal overstress, mechanical stress and cracks in the interface between the bonding lead and the silicon chip [22]. Due to constant impact of large current and the different thermal expansion coefficients of different materials at the bonding site, the thermal stress is constantly changing and continues with the power cycle. With the continuous accumulation of the peeling effect of different thermal stresses on the bonding site, if it exceeds the bearing capacity of the bonding lead, the bonding lead wire will be stripped off or melted. Therefore, in order to improve the reliability of the electrical connection, each chip in the power module is connected in parallel through multiple lead wires. In actual operation, the shedding of one lead wire will cause the imbalance of the current, thus accelerating the shedding of other leads and resulting in the IGBT failures.

2.2.2. Welding Layer Fatigue

As can be seen from Figure 1, the solder layer is the key link between the silicon chip and the DBC copper layer, DBC and substrate, electrical terminal and the DBC. In [23] it pointed out that the structure of solder layer material is one of the important factors affecting IGBT reliability. The time-varying mechanical parameters, such as mechanical hardening of materials, will increase the thermal stress and accelerate the cracks in the solder layer. The improper contact between physical layers will reduce the thermal conductivity of the module and overheat the chip, which will lead to stress increase and cracks. As the crack grows, the device eventually fails. As pointed out in [24], the thermal resistance of the chip will increase due to delamination of the solder layer, cracks and voids, which will lead to the increase in the junction temperature and the non-emission of the heat accumulation.

3. Life Prediction Model of IGBT Module

3.1. Basic Assumption

Statistical analysis of the accelerated life test data of the IGBT module is carried out on the premise of the following four hypotheses.
Hypothesis A: under the normal stress level combination (0, 0) and the accelerated stress level combination (i, j), the lifetime of the IGBT module is followed by the lognormal distribution, and t is the random variable for the lifetime of the IGBT. So its failure distribution function is expressed as:
F T i j ( t ) = Φ ( ln t μ i j σ i j ) = ( ln t μ i j ) / σ i j 1 2 π exp [ x 2 2 ] d x
where Φ ( ) is the distribution function of the standard normal distribution N ( 0 , 1 ) , μ i j is logarithmic mean, and σ i j is logarithmic standard deviation.
Hypothesis B: under the normal stress level combination (0, 0) and the accelerated stress level combination (i, j), the failure mechanism of the IGBT module is unchanged, and the relational expression can be defined as:
σ 00 = σ 11 = σ 21 = σ 22 = = σ l 1 l 2 = σ
Hypothesis C: for the IGBT module, the acceleration equation satisfies between the mean value μ i j and the stress level S i j , as defined by:
μ i j = A 0 + A 1 ϕ 1 ( S 1 i ) + A 2 ϕ 2 ( S 2 j ) i = 0 , 1 , 2 , , l 1 ; j = 0 , 1 , 2 , , l 2
where A 0 , A 1 , A 2 are the estimated parameters; ϕ 1 ( S 1 ) or ϕ 2 ( S 2 ) is a known function of the stress levels S 1 or S 2 .
Hypothesis D: the failure probability is consistent with Nelson’s theorem, which defines that the residual life of the sample is only related to the accumulated failure part and the current stress level, but is not related to the accumulation mode.

3.2. Establishment of IGBT Module Life Acceleration Model

According to the main failure modes of the IGBT module, such as aluminum wire bonding lead shedding and welding layer fatigue, and based on the actual running condition of pure electric vehicle, the influence of the vibration on the IGBT module is not small because of the complicated driving condition and the variable speed of the running vehicle. The vibration stress can accelerate the formation of cracks at the interface between the aluminum lead and the chip and strip or warp of the aluminum lead during the process of aluminum wire bonding lead shedding. During the fatigue process of the welding layer, the vibration stress accelerates the cracking of the solder layer. Therefore, in order to further shorten the test time to an acceptable level and to simulate the actual working conditions more accurately, this paper proposes that in the accelerated life test the vibration stress should be taken into account in order to carry out double accelerated stress accelerated life test. The obtained accelerated life test data of the IGBT modules are assumed to be close to the real-life data.
According to the performance degradation trajectory curve, an appropriate degradation trajectory model is selected to model the degradation trajectory. The degradation model of the i-th IGBT module at the m stress level can be expressed as:
y i = f ( t , B 1 m i , B 2 m i , B l m i )
where m = 1 , 2 , 3 , 4 , 5 , 6 , i = 1 , 2 , , 8 ; B 1 m i , B 2 m i , B l m i are the model parameters.
Using the least square method, the degradation equation of the IGBT module at different accelerated degradation stress levels is obtained as follows:
y i = f ( t , B 1 m i , B 2 m i , B l m i )
where B 1 m i , B 2 m i , B l m i are the degradation model parameters.
Through the accelerated life data of the IGBT module at each stress level and the degradation trajectory equation, the life acceleration model is obtained. The Eyring model can be used to describe the damage mechanism caused by thermal and non-thermal variables. When the temperature range is relatively large, the Eyring model can be extended to a generalized Eyring model. The accelerated stress level is a double stress level consisting of a temperature stress level and a vibration stress level, the temperature stress is caused by the thermal variable, while the vibration stress is caused by the non-thermal variable. Then, the generalized Eyring acceleration model can be used to model the double stress level [25]. The generalized Eyring acceleration model is shown in Equation (6).
t = α 0 exp ( α 1 T ) ( V α 2 )
where α 0 , α 1 and α 2 are model parameter; T is temperature stress (K); V is vibration stress (Hz).
ln t = ln α 0 + α 1 T α 2 ln V can be obtained from Equation (6), A 0 = ln α 0 , A 1 = α 1 , A 2 = α 2 are assumed. A 0 , A 1 and A 2 are model parameters.
The lifetime of IGBT is assumed to obey the lognormal distribution, and the stresses only affect the location parameter of the distribution. Thus, the accelerated life model is obtained as:
t ~ Lognormal ( exp ( A 0 + A 1 T + A 2 ln V ) , σ )

4. Shapiro–Wilk Hypothesis Testing Principle

The Shapiro–Wilk (S–W) test [26,27,28] is based on the regression of order statistics to their expected values. It is a test of the ANOVA form of a complete sample. The test statistic is the ratio of the square of the linear combination of sample order statistics to the usual variance estimator [29,30,31].
Hypothesis 1 (H1).
sample overall obeys normal distribution.
Hypothesis 2 (H2).
sample overall does not obey normal distribution.
This hypothesis is based on the order observation value, and the test sample value is arranged in ascending order first:
x 1 x 2 x n
and then S is calculated as
S = a k [ x n + 1 k x k ]
The value of subscript k here takes 1 , 2 , , n 2 (n is an even number) or 1 , 2 , , ( n 1 ) 2 n is an odd number) according to the parity of n. The coefficient a k has a specific value when the sample size is n.
S–W test statistic W:
W = S 2 n m 2
Here
n m 2 = ( x i x ¯ ) 2
Under the significant level of α = p , if the value of statistic W is less than its p quantile ( p = α ), then the original hypothesis is rejected; otherwise, the original hypothesis is accepted. By looking up the statistical parameter table, one can get the quantile p under different significance levels. The logarithm of the original data is tested by normal test. If the test results conform to the normal distribution, the original data is followed by lognormal distribution.

5. Data Processing and Result Analysis

5.1. Data Analysis of Accelerated Life Experiment

From the research of Liu et al. [32], it can be seen that the rated working current of the IGBT module of GD50HFL120C1S 1200V/50A is 50A, and the conduction current should not exceed 110 A under the condition that the acceleration effect is maximum and the failure mechanism is invariable. According to the vibration test requirements of the motor [33,34,35] and its controller in QC/T 413-2002 “Basic specifications for automotive equipment” of GB/T 18488.1-2006 “Electric motors and their controllers for electric vehicles-part1: technical requirements”, the vibration stress should be within 250 Hz. Therefore, in this paper, the temperature stress is selected as 70 K and 100 K, the vibration stress is selected as 150 Hz and 200 Hz, and six groups of double stress IGBT module accelerated life test data are obtained, as shown in Table 2.

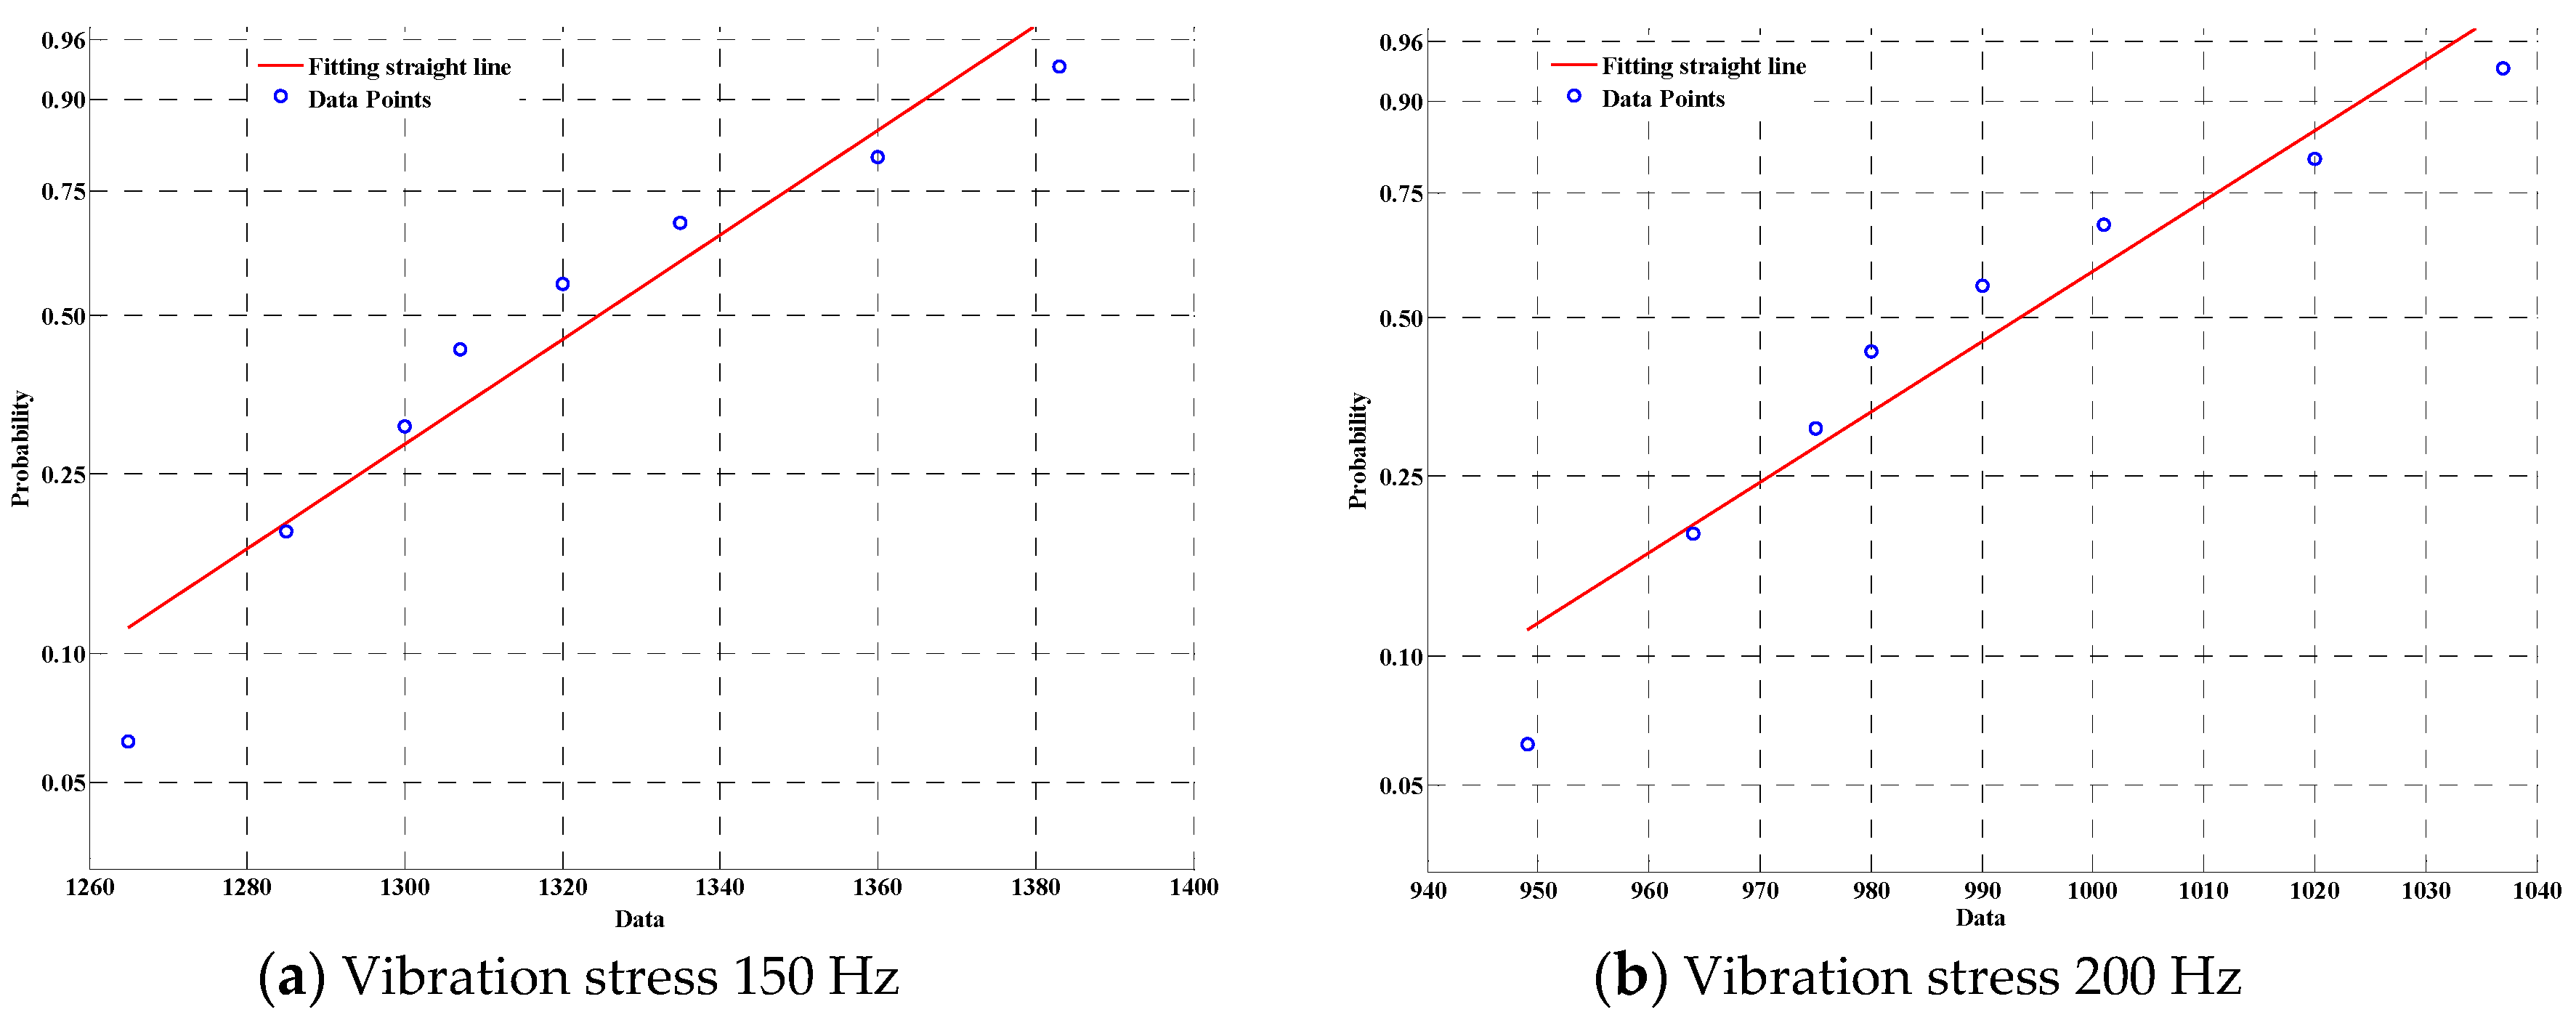
5.1.1. Qualitative Test Analysis

The data in Table 2 were analyzed using Weibull++ software. The results are shown in the following Figure 2, Figure 3 and Figure 4. It can be seen that the data points at each stress level are approximately a straight line within the bilateral confidence level 95%, illustrating that the lifetime of the IGBT module is followed by the lognormal distribution. The approximate parallelism of six straight lines also fully shows that the failure mechanism of the IGBT module under double stress levels is the same as that under normal stress level.

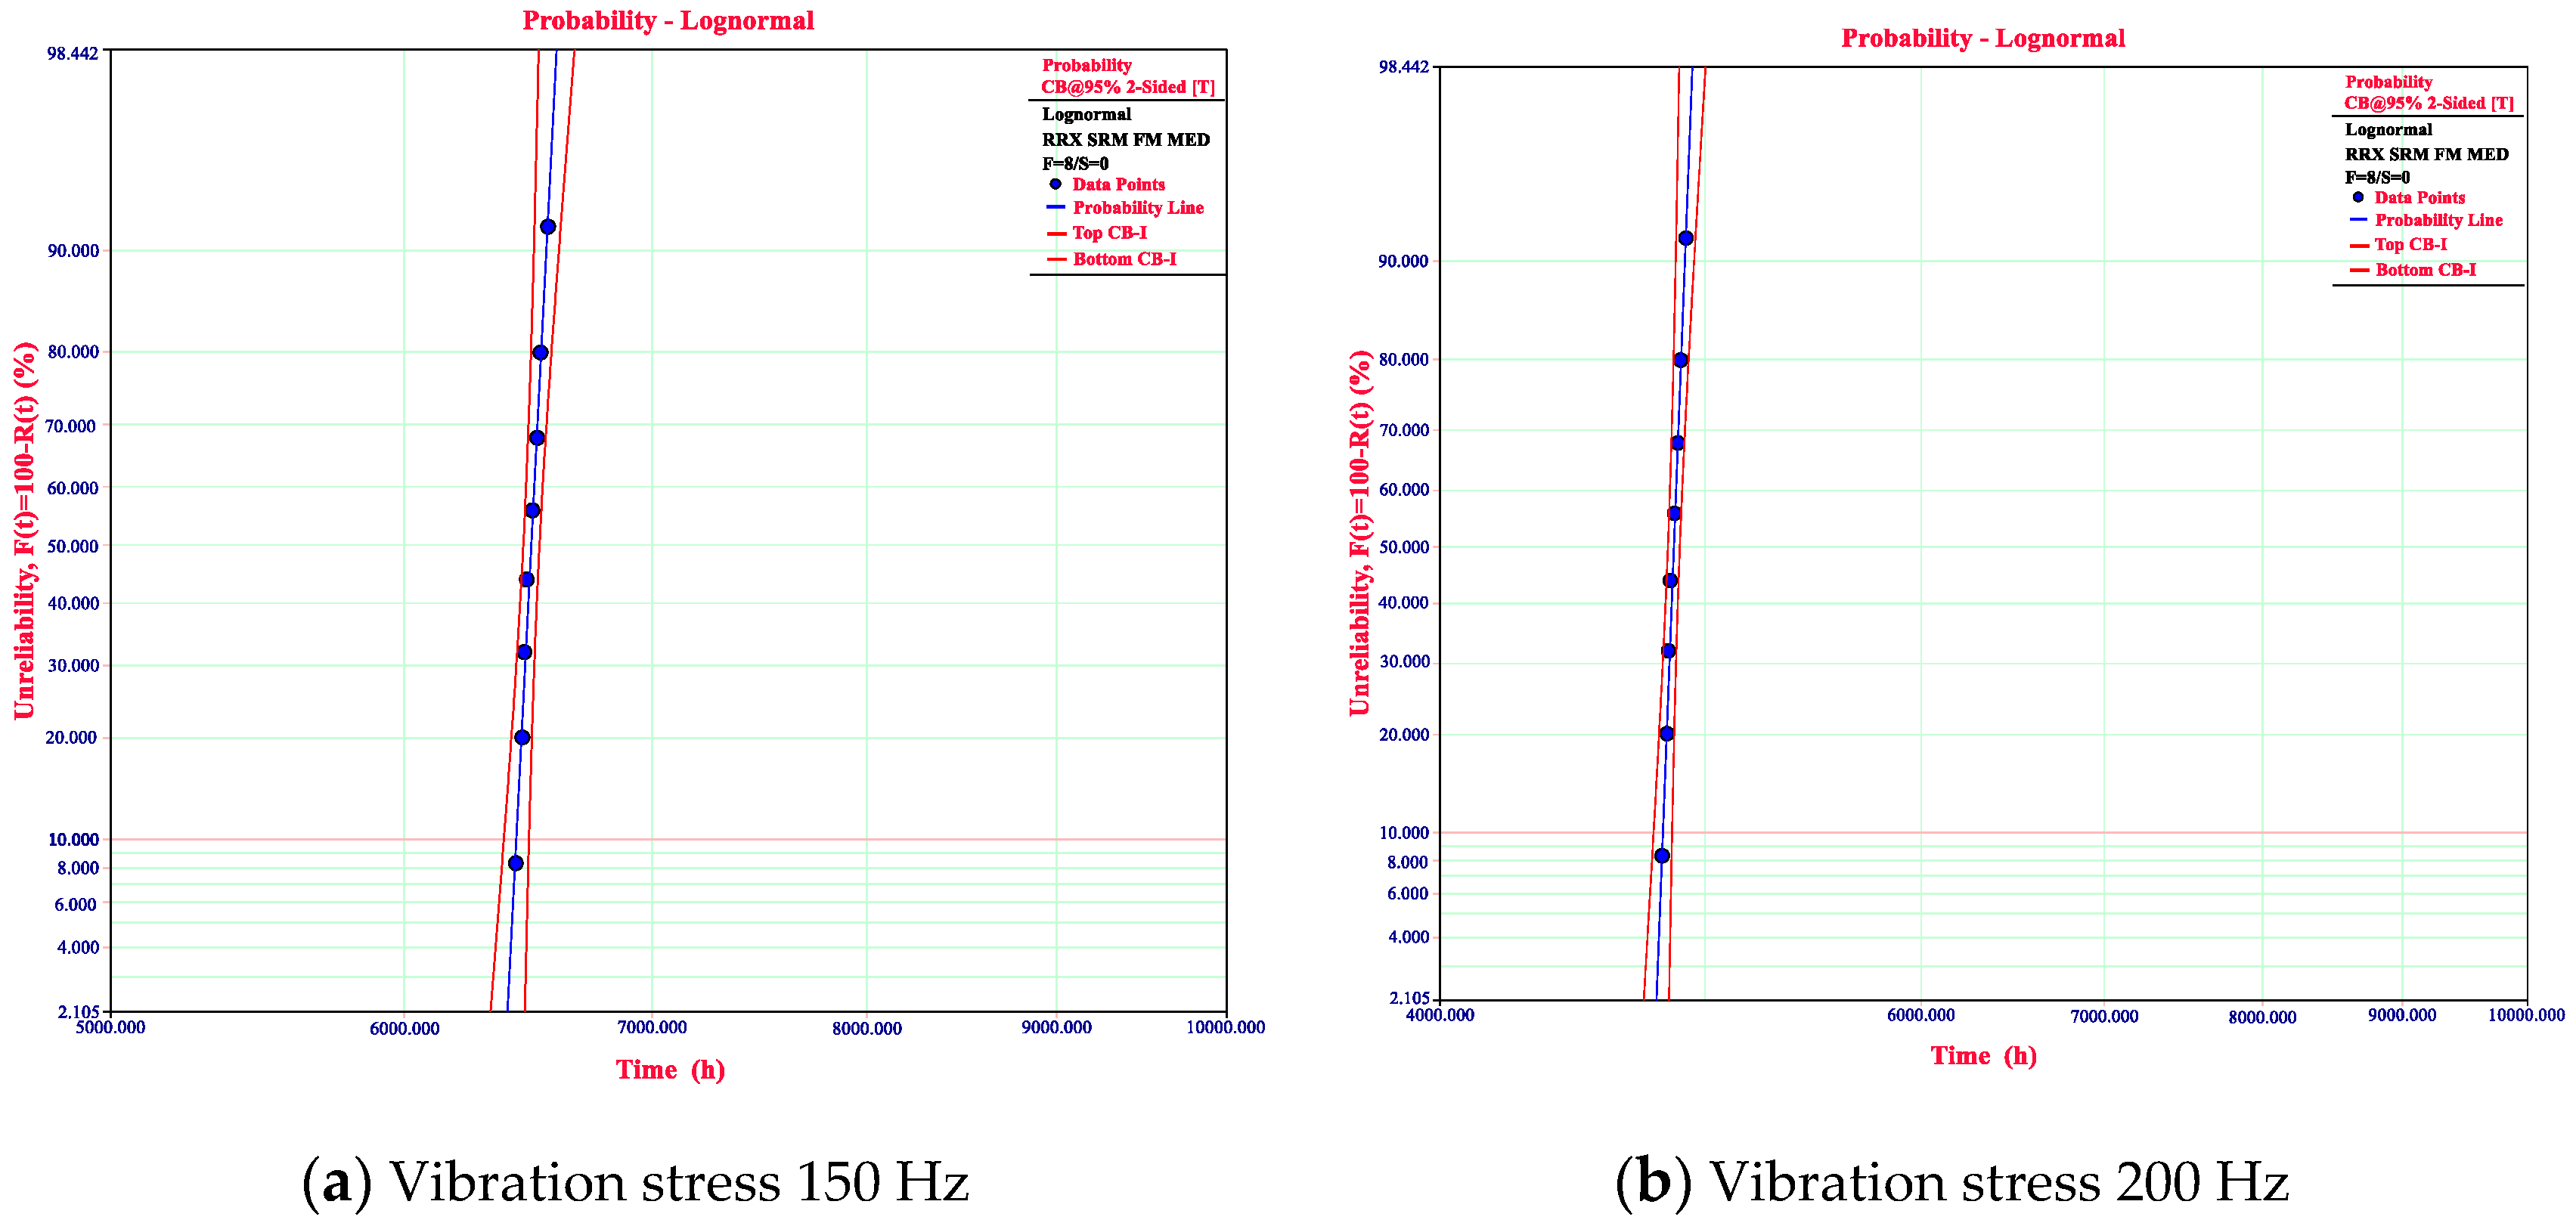
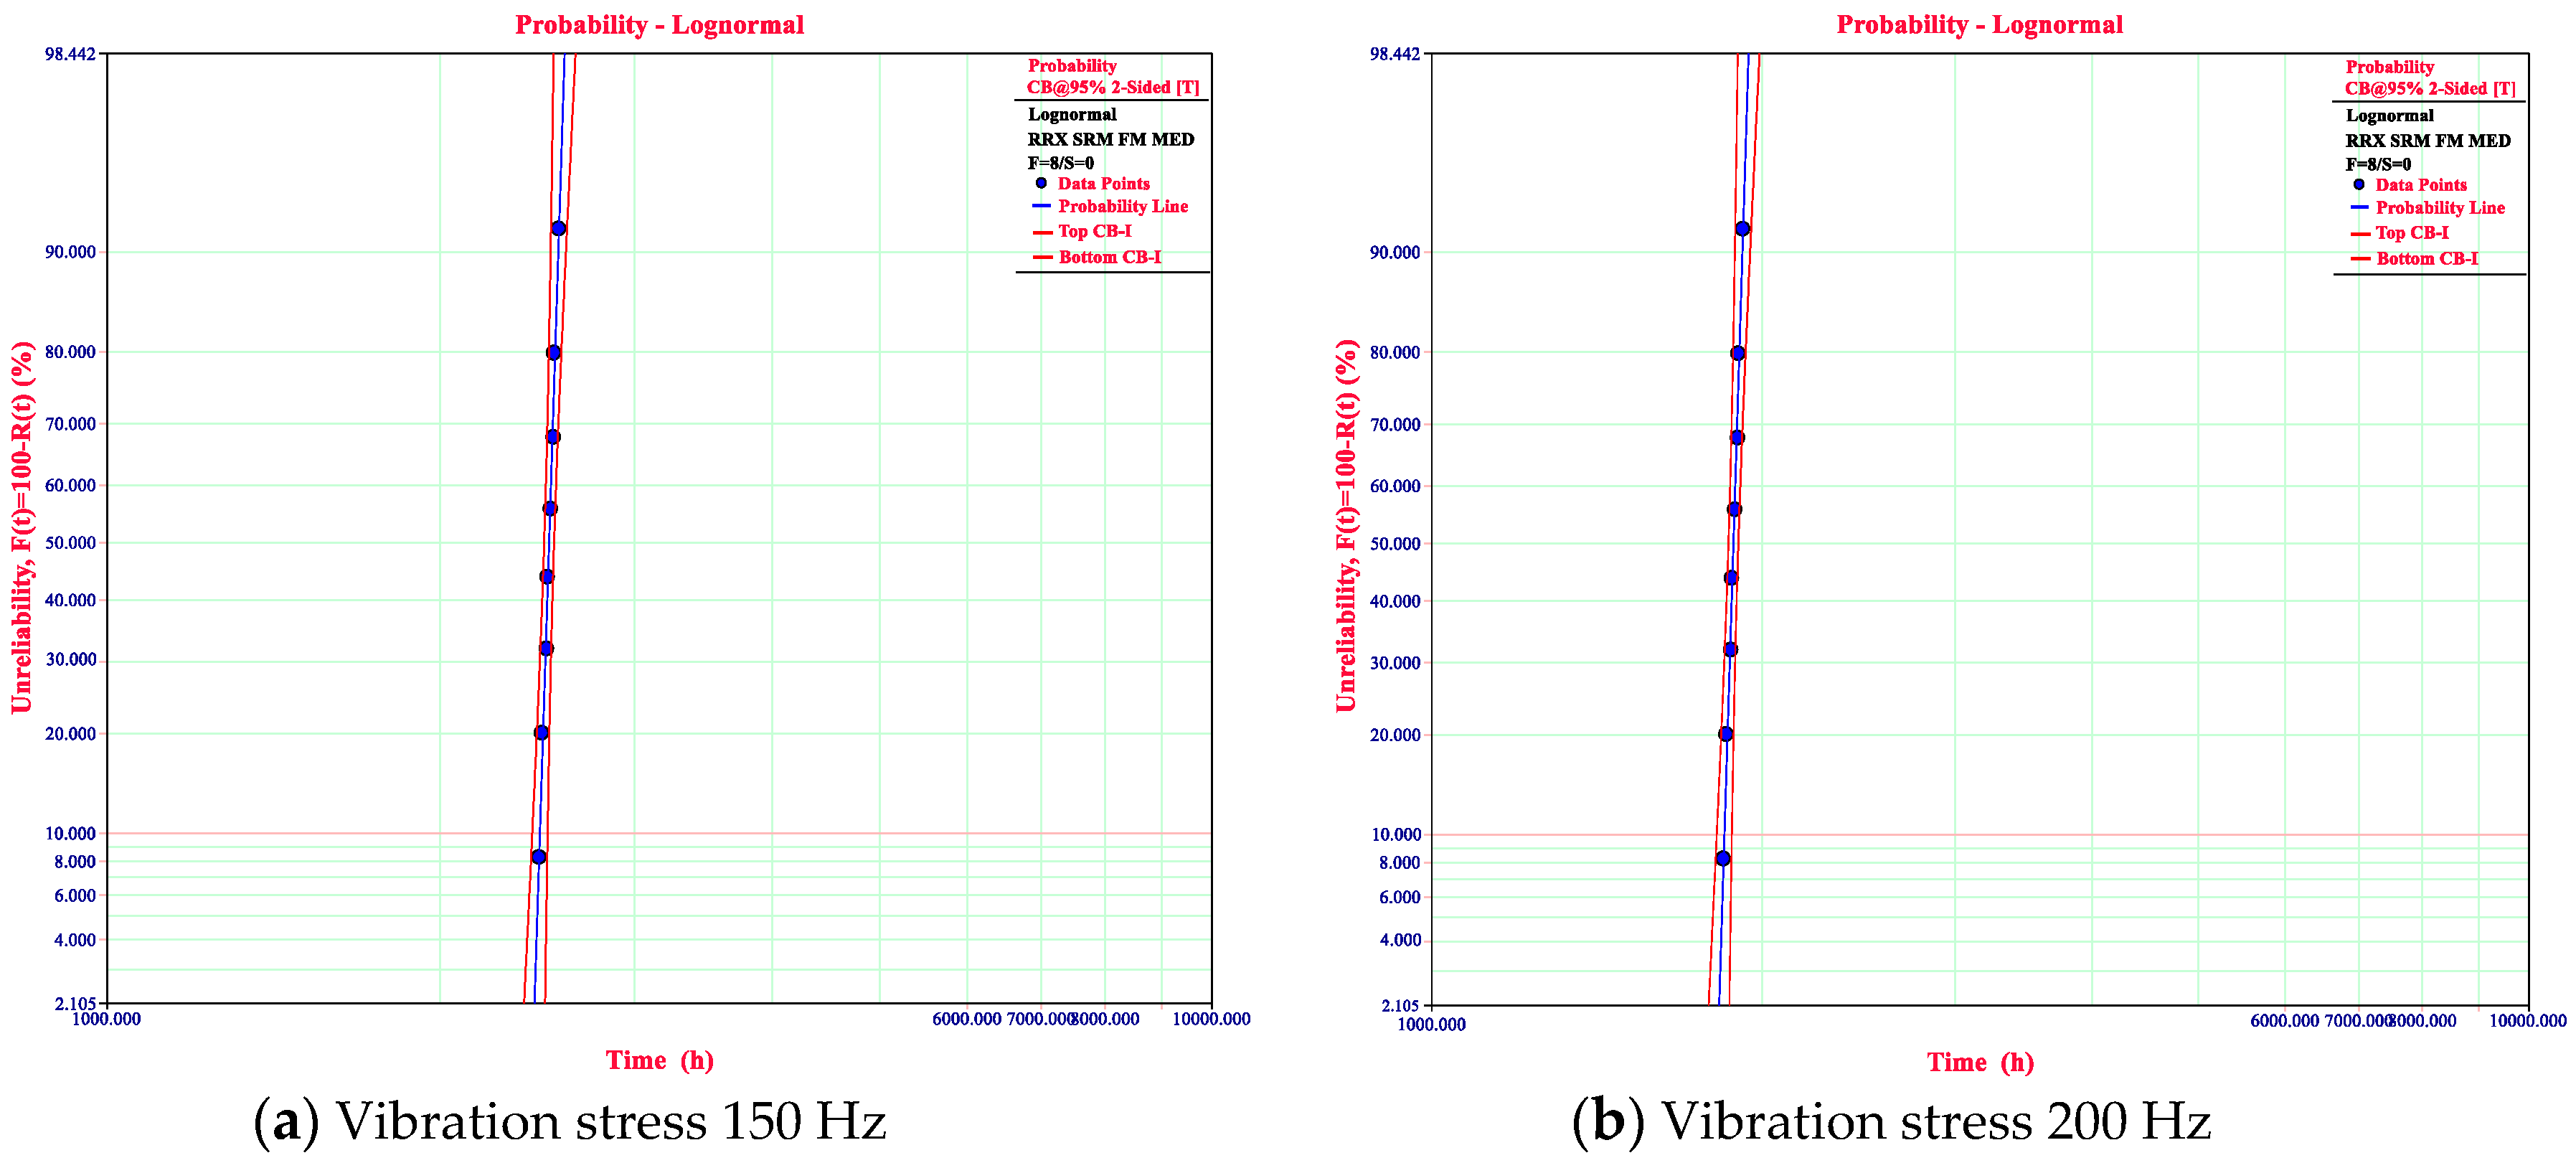
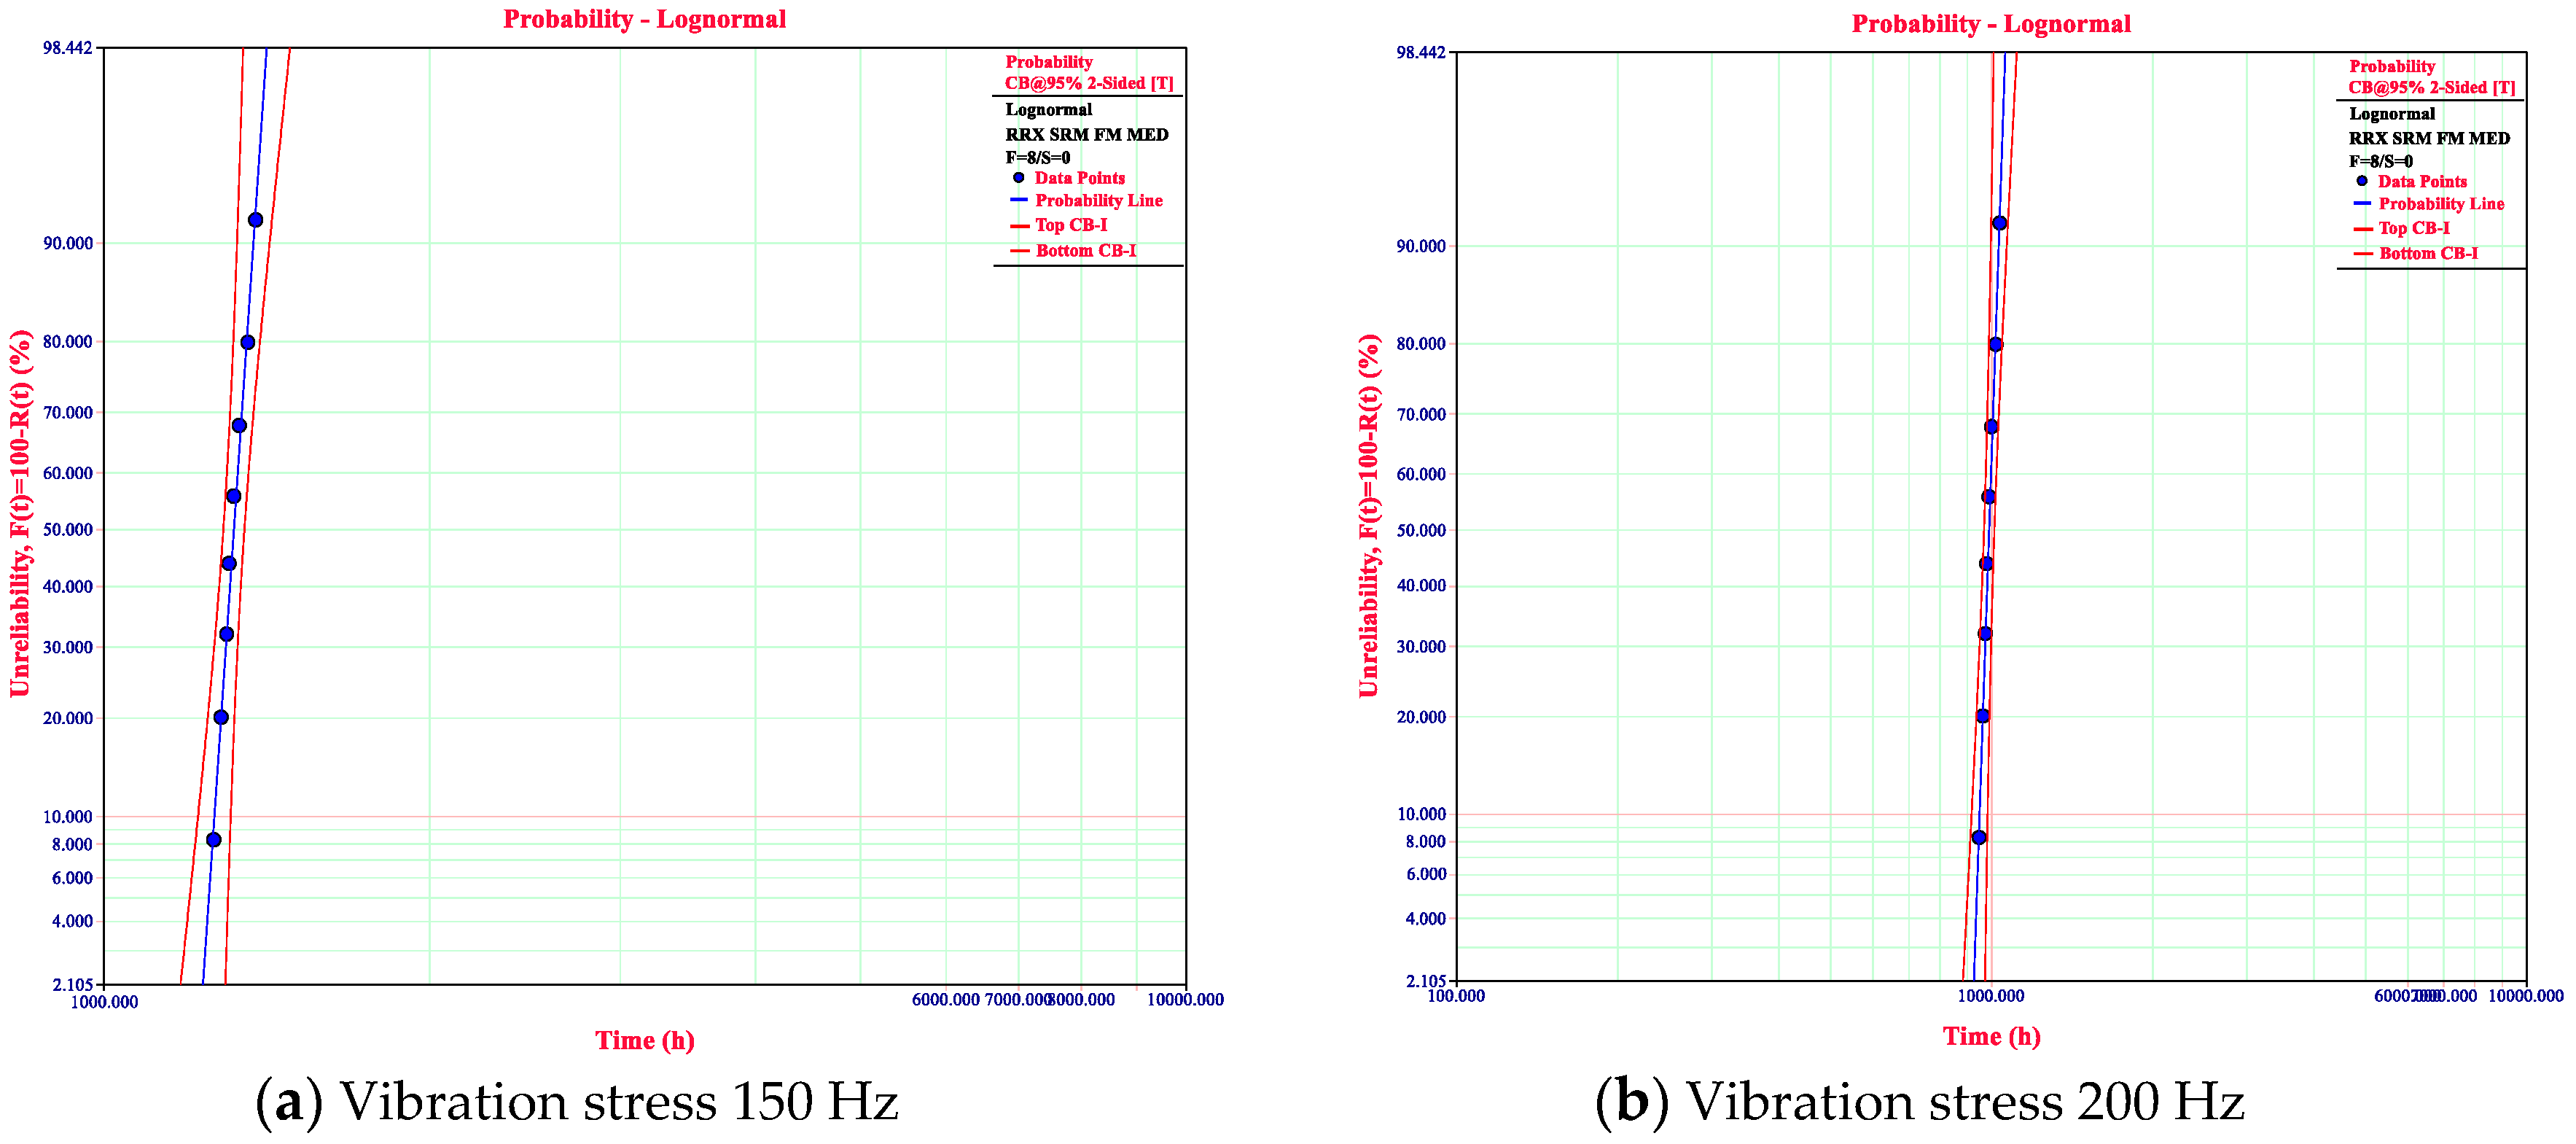
5.1.2. Quantitative Test Analysis

Under the normal stress level combination (0, 0) and the accelerated stress level combination (i, j), the IGBT lifetime is assumed to obey the Weibull distribution, and t is the random variable for the lifetime of the IGBT. Its distribution function is given by Equation (12):
F T i j ( t ) = 1 exp [ ( t η i j ) m i j ] , t 0 , m i j , η i j > 0
where m i j is shape parameter, and η i j is characteristic life.
The shape parameter m i j and characteristic life η i j of the Weibull distribution function are estimated by the maximum likelihood estimation method.
The Weibull distribution function and related parameters were calculated according to the data in Table 2. Table 3 shows the shape parameters and related data under each stress level, where r is the correlation coefficient and a is the slope. Figure 5, Figure 6 and Figure 7 show the straight lines obtained from the fitting data at each stress level.
The correlation coefficient of each stress level obtained from Table 3 is close to 1 and the straight lines obtained from the fitting data in Figure 5, Figure 6 and Figure 7 indicate that the life of the IGBT module may follow the Weibull distribution. However, the slopes of the fitted straight line at each stress level are not equal to each other and the fitted straight lines are not parallel to each other, indicating that the shape parameters of the Weibull distribution function are varied. The shape parameter values obtained from Table 3 also prove that the failure mechanisms of the IGBT modules are different at each stress level. This contradicts the fact that the IGBT module’s accelerated life data is obtained when the failure mechanism remains unchanged (otherwise the obtained data is invalid). Thus, it can be concluded that the IGBT module life is actually not subject to the Weibull distribution [36,37].
The base e logarithm was taken for the six groups of the accelerated life test data in Table 2 before the Shapiro–Wilk test. Then the logarithmic data under the six stress levels were tested by Shapiro–Wilk test. Table 4 shows the S–W test results. Take into account that the sample size n = 8, and the significant level α = p = 0.05 . From the Shapiro–Wilk test statistic W parameter table, the p quantile is 0.818 when n = 8 and α = p = 0.05 . Because the calculated W i ( i = 1 , 2 , , 6 ) is larger than this value, the original assumption H 0 is accepted. Then one can conclude that the life of the IGBT module is followed by the lognormal distribution.

5.2. MLE Double Accelerated Life Estimation

The parameters A 0 , A 1 , A 2 and the logarithmic standard difference σ in Equation (7) were estimated by the global maximum likelihood estimation to obtain the estimated value A 0 , A 1 , A 2 , σ and covariance matrix Σ . The global maximum likelihood function is:
L ( A 0 , A 1 , A 2 , σ ) = i = 1 k j = 1 m { σ t i j σ 1 exp [ σ ( A 0 + A 1 T + A 2 ln V ) ] } exp { t i j σ exp [ σ ( A 0 + A 1 T + A 2 ln V ) ] }
where, t i j is the life data value of the j ( j = 1 , 2 , , 8 ) IGBT module under the accelerated stress level S i ( i = 1 , 2 , 3 , 4 , 5 , 6 ) .
The maximum likelihood estimators for A 0 , A 1 , A 2 , σ were obtained by letting ln L A 0 = 0 , ln L A 1 = 0 , ln L A 2 = 0 , ln L σ = 0 .
The covariance matrix Σ of parameters A 0 , A 1 , A 2 , σ is as follows:
Σ = [ 2 ln L A 0 2 2 ln L A 0 A 1 2 ln L A 0 A 2 2 ln L A 0 σ 2 ln L A 0 A 1 2 ln L A 1 2 2 ln L A 1 A 2 2 ln L A 1 σ 2 ln L A 0 A 2 2 ln L A 1 A 2 2 ln L A 2 2 2 ln L A 2 σ 2 ln L A 0 σ 2 ln L A 1 σ 2 ln L A 2 σ 2 ln L σ 2 ]
Using the data in Table 2, the global maximum likelihood estimation of the parameters in the accelerated life model was carried out to obtain A 0 , A 1 , A 2 , σ and the covariance matrix Σ as shown in Table 5.
The logarithmic lifetime of the IGBT module under normal operating temperature T, vibration V and the reliability of R is estimated as follows:
ln t R = A 0 + A 1 T k + A 2 ln V + 1 σ ln [ ln ( 1 / R ) ]
The minimum sample size corresponding to different reliability R and confidence γ is shown in Table 6, where the failure number m has two values: 0 and 1.
According to the sample size n, it can be seen from Table 6 that the corresponding minimum reliability R is 0.85 and the confidence degree is 0.7. Therefore, the average service life of the IGBT module is 12.56 years under different environmental conditions (30 K + 80 Hz).

6. Conclusions

In this paper, the Shapiro–Wilk test, Weibull and MLE were used to analyze the accelerated life test data of the IGBT modules. The main conclusions are drawn as follows:
  • The graph analysis method based on Weibull++ software has fast computation speed, high precision, and good visualization; and the overall performance is better than the traditional computational sketch plotting method.
  • The lifetime of the IGBT module is followed by the lognormal distribution, and its acceleration model conforms to the generalized Eyring acceleration model.
  • The IGBT RUL can be estimated effectively by the proposed MLE method based on the accelerated life test data.
  • This method can provide a certain technical reference for the reliability research of high reliability and long life power electronic devices.

Author Contributions

Writing—original draft preparation, C.Y.; writing—review and editing, H.W. and Z.L.; methodology, Y.Z.; validation, J.N.; data curation, Y.K.; funding, Z.L. and H.W. All authors have read and agreed to the published version of the manuscript.

Funding

This research was funded by the Technical Innovation Special Major Fund Project of Hubei Province under Grant 2017AAA133, the Hubei Superior and Distinctive Discipline Group of “Mechatronics and Automobiles” under Grant XKQ2020012, the Natural Science Foundation of China under Grant 11704110, and the Australia Research Council under Grant DE190100931.

Acknowledgments

The study and the related experiment was supported by Hubei Key Laboratory of Power System Design and Test for Electrical Vehicle.

Conflicts of Interest

The authors declare no conflict of interest.

References

  1. Sfakianakis, G.E.; Nawaz, M. Development of a modeling platform for 4.5 kV IGBT power modules. In Proceedings of the IECON 2014—40th Annual Conference of the IEEE Industrial Electronics Society, Dallas, TX, USA, 29 October–1 November 2014; pp. 1416–1422. [Google Scholar] [CrossRef]
  2. Lu, G.; Zhao, Q.; Xu, Y. Analysis of the electro-thermal parameters variation of the IGBT modules in the power cycle. Fire Control Command Control 2017, 42, 160–163. [Google Scholar]
  3. Ren, Y.; Peng, Q.; Yu, D.; Zhou, J. Research on the Reliability Prediction Model for IGBT Based on Accelerated Lifetime Testing. Power Electron. 2017, 51, 121–124. [Google Scholar]
  4. Luo, H.; Li, W.; He, X.; Iannuzzo, F.; Blaabjerg, F. Uneven temperature effect evaluation in high-power IGBT inverter legs and relative test platform design. Microelectron. Reliab. 2017, 76, 123–130. [Google Scholar] [CrossRef]
  5. Yu, H.; Lu, T.; Ji, S.; Yuan, L.; Zhao, Z. Active clamping circuit threshold voltage design for series-connected HVIGBTs. Proc. CSEE 2016, 36, 1357–1365. [Google Scholar]
  6. Zhang, P.; Han, R.; Jin, R.; Yu, K.; He, W.; Liu, J. Package Design of High Power IGBT Module for Electric Vehicle. Smart Grid 2014, 2, 48–51. [Google Scholar]
  7. Jiang, N.; Chen, M.; Xu, S.; Lai, W.; Gao, B. Thermal fatigue of IGBT module considering crack damage. J. Zhejiang Univ. (Eng. Sci.) 2017, 51, 825–833. [Google Scholar]
  8. Wang, Y.; Jones, S.; Dai, A.; Liu, G. Reliability enhancement by integrated liquid cooling in power IGBT modules for hybrid and electric vehicles. Microelectron. Reliab. 2014, 54, 1911–1915. [Google Scholar] [CrossRef]
  9. Yang, S.; Xiang, D.; Bryant, A.; Mawby, P. Condition Monitoring for Device Reliability in Power Electronic Converters: A Review. IEEE Trans. Power Electron. 2011, 25, 2734–2752. [Google Scholar] [CrossRef]
  10. Mi, W.; Yan, Y. Research on reliability of IGBT module. Chin. J. Electron Devices 2015, 38, 27–31. [Google Scholar]
  11. Zhu, C.; Wang, X.; Luo, H.; Zhou, Y.; Yang, H.; Li, W.; He, X. Dynamical Junction Temperature Online Extraction with Thermal Sensitive Electrical Parameters for High Power IGBT Modules. Proc. CSEE 2017, 37, 2686–2693. [Google Scholar]
  12. Thebaud, J.M.; Woirgard, E.; Zardini, C.; Azzopardi, S.; Briat, O.; Vinassa, J.M. Strategy for designing accelerated aging tests to evaluate IGBT power modules lifetime in real operation mode. IEEE Trans. Compon. Packag. Technol. 2007, 26, 429–438. [Google Scholar] [CrossRef]
  13. Mao, Y.; Zhou, L.; Du, X.; Sun, P. Research of IGBT accelerated aging test. Chin. J. Power Sources 2014, 38, 2383–2385. [Google Scholar]
  14. Zhang, Y.; Li, Z. Research on IGBT Lifetime Prediction Models Based on Accelerated Lifetime Test. Electr. Drive 2016, 46, 72–75. [Google Scholar]
  15. Zhao, X.; Zhu, G.; Wu, X. Fatigue Life Prediction of Bonding Wires in IGBT Modules Based on Case Temperature. High Volt. Appar. 2017, 53, 167–173. [Google Scholar]
  16. Lai, W.; Chen, M.; Zhai, L.; Wang, X.; Xu, S. Analysis of IGBT Failure Mechanism Based on Ageing Experiments. Proc. CSEE 2015, 35, 5293–5300. [Google Scholar]
  17. Lu, Y.; Christou, A. Lifetime Estimation of Insulated Gate Bipolar Transistor Modules Using Two-step Bayesian Estimation. IEEE Trans. Device Mater. Reliab. 2017, 17, 414–421. [Google Scholar] [CrossRef]
  18. Luo, H.; Iannuzzo, F.; Ma, K.; Blaabjerg, F.; Li, W.; He, X. Active gate driving method for reliability improvement of IGBTs via junction temperature swing reduction. In Proceedings of the 2016 IEEE 7th International Symposium on Power Electronics for Distributed Generation Systems (PEDG), Vancouver, BC, Canada, 27–30 June 2016; pp. 1–7. [Google Scholar] [CrossRef]
  19. Fang, J.; Liu, X.; Xia, L.; Li, L. Influence of Temperature Field Distribution on Reliability of the Semi-bridge IGBT Device Based on ANSYS and MATLAB. Res Prog. SSE 2018, 38, 178–183. [Google Scholar]
  20. Choi, U.M.; Blaabjerg, F.; Jørgensen, S. Study on Effect of Junction Temperature Swing Duration on Lifetime of Transfer Molded Power IGBT Modules. IEEE Trans. Power Electron. 2017, 32, 6434–6443. [Google Scholar] [CrossRef] [Green Version]
  21. Zhou, W.; Wang, X.; Zhang, B.; Lai, W. Research on Failures of Bonding Wire in IGBTs Module. J. Power Supply 2016, 14, 10–17. [Google Scholar]
  22. Chen, M. Failure characteristics and mechanism analysis of IGBT modules under high-temperature power cycling. J. Xi’an Jiaotong Univ. 2014, 48, 119–126. [Google Scholar]
  23. Chen, M.; Hu, A.; Liu, B. Failure Mechanism and Lifetime Prediction Modeling of IGBT power electronic devices. J. Xi’an Jiaotong Univ. 2011, 45, 65–71. [Google Scholar]
  24. Tang, Y.; Wang, B.; Chen, M.; Liu, B. Reliability and on-line evaluation of igbt modules under high temperature. Trans. China Electrotech. Soc. 2014, 29, 17–23. [Google Scholar]
  25. Park, C.; Padgett, W. Stochastic degradation models with several accelerating variables. IEEE Trans. Reliab. 2006, 55, 379–390. [Google Scholar] [CrossRef]
  26. Ukponmwan, H.; Ajibade, F. Evaluation of Techniques for Univariate Normality Test Using Monte Carlo Simulation. Am. J. Theor. Appl. Stat. 2017, 6, 51–61. [Google Scholar] [CrossRef]
  27. Hanusz, Z.; Tarasinska, J. Simulation Study on Improved Shapiro-Wilk Tests for Normality. Commun. Stat.-Simul. Comput. 2014, 43, 2093–2105. [Google Scholar] [CrossRef]
  28. Torabi, H.; Montazeri, N.; Chávez, A. A test for normality based on the empirical distribution function. SORT 2016, 40, 55–88. [Google Scholar] [CrossRef]
  29. Mudholkar, G.; Kumarsrivastava, D.; Lin, C. Some p-variate adaptations of the shapiro-wilk test of normality. Commun. Stat. 1995, 24, 953–985. [Google Scholar] [CrossRef]
  30. Zhou, X.; Wang, X.; Liu, X.; Zhang, L. The Reliability Analysis and the Probability Distribution of Wheel Tracking Test of Asphalt Mixture. In Proceedings of the Geohunan International Conference, Zhangjiajie, China, 6–8 June 2011; pp. 89–96. [Google Scholar] [CrossRef]
  31. Hanusz, Z.; Tarasińska, J. Normalization of the Kolmogorov–Smirnov and Shapiro–Wilk tests of normality. Biom. Lett. 2015, 52, 85–93. [Google Scholar] [CrossRef] [Green Version]
  32. Liu, B.; Liu, D.; Tang, Y. Lifetime prediction and failure analysis of IGBT module based on accelerated lifetime test. J. Jiangsu Univ. (Nat. Sci. Ed.) 2013, 34, 556–563. [Google Scholar]
  33. Glowacz, A.; Glowacz, W.; Kozik, J.; Piech, K.; Gutten, M.; Caesarendra, W.; Liu, H.; Brumercik, F.; Irfan, M.; Khan, Z.F. Detection of deterioration of three-phase induction motor using vibration signals. Meas. Sci. Rev. 2019, 19, 241–249. [Google Scholar] [CrossRef] [Green Version]
  34. Glowacz, A. Recognition of acoustic signals of commutator motors. Appl. Sci. 2018, 8, 2630. [Google Scholar] [CrossRef] [Green Version]
  35. Glowacz, A. Fault detection of electric impact drills and coffee grinders using acoustic signals. Sensors 2019, 19, 269. [Google Scholar] [CrossRef] [PubMed] [Green Version]
  36. Parsons, F.G.; Wirsching, P.H. A Kolmogorov-Smirnov goodness-of-fit test for the two-parameter Weibull distribution when the parameters are estimated from the data. Microelectron. Reliab. 1982, 22, 163–167. [Google Scholar] [CrossRef]
  37. Lawless, J.F. Statistical Models and Methods for Lifetime Data, 2nd ed.; John Wiley & Sons: New York, NY, USA, 2003. [Google Scholar]
Figure 1. The hierarchical structure of the IGBT module.
Symmetry 12 01325 g001
Figure 2. Data under accelerated stress of 70 K.
Symmetry 12 01325 g002
Figure 3. Data under accelerated stress of 90 K.
Symmetry 12 01325 g003
Figure 4. Data under accelerated stress of 100 K.
Symmetry 12 01325 g004
Figure 5. Data under accelerated stress of 70 K.
Symmetry 12 01325 g005
Figure 6. Data under accelerated stress of 90 K.
Symmetry 12 01325 g006
Figure 7. Data under accelerated stress of 100 K.
Symmetry 12 01325 g007
Table 1. Material properties of each layer of an insulated gate bipolar transistor (IGBT) module.
HierarchiesMaterialThickness /μmExpansion Coefficient /10−6 K Thermal   Conductivity / W ( m K ) 1 Thermal   Resistance / K W 1 Heat   Capacity   / J K 1
IGBT chipSi3203.080~1500.050.05
Solder layer (between chip and copper layer)SnAgCu8025.0350.020.01
Copper layer on DBCCu30016.83900.0310.03
DBC ceramic layerAl2O37004.0140~1700.021.19
Copper layer below DBCCu30016.83900.0310.03
Solder layer (between copper layer and substrate)Sn63Pb3710025.0350.0050.24
Copper substrateCu300016.83900.00332.33
Table 2. The accelerated life test data of the IGBT module.
Temperature Stress /(K)Vibration Stress/(Hz)Time Failed/ (h)
7015065006433656365196533646764596477
20048754825492248894900485048444858
9015025202535256325372460250324742500
20018901901192219031845187818561875
10015013201360133513831307130012851265
200990102010011037980975964949
Table 3. Shape parameters and related data under the Weibull distribution.
Temperature Stress (K)Vibration Stress (Hz)mr a / 10 3
70150588.20.98663.14
200373.70.98583.26
90150196.40.98572.36
200162.30.98602.67
100150115.90.98562.64
20089.20.98582.86
Table 4. Shapiro–Wilk (S–W) test of IGBT module life.
Temperature Stress (K)Vibration Stress (Hz)W
701500.981
2000.980
901500.974
2000.975
1001500.983
2000.981
Table 5. Maximum likelihood estimation (MLE) and covariance matrix.
ParameterMLECovariance Matrix
A0A1A2 σ
A00.5738123.2535−46530.0562−0.0256
A11516.8−465315−532412.3542
A2−2.54620.0562−53240.45630.0025
σ5.1532e−5−0.025612.35420.00250.0132
Table 6. The minimum sample size.
m01
γ 0.70.80.90.70.80.9
R
0.8571014101522
0.9121522242938
0.95243245495977

